Comparative Analysis of the MAX Pathway
|
|
|
- Jemimah Horton
- 5 years ago
- Views:
Transcription
1 Comparative Analysis of the MAX Pathway Joanna Alex Hepworth, MA Cantab. Submitted in part fulfilment for the degree of Doctor of Philosophy The University of York Department of Biology March 2012
2 2
3 3 Abstract The pattern of branch outgrowth is a key determinant of the plant body plan. In most angiosperms branching is flexible, as branches are produced from axillary meristems which can either remain dormant or grow out. Strigolactones (SLs), a new class of plant hormones, repress branching in a range of angiosperms, including Arabidopsis, and there is increasing evidence that SLs are regulators of plant development in response to nutrient stress. This study has exploited genetic and physiological methods to investigate the evolution of SL biosynthesis and roles across the four major lineages of vascular plants. The cytochrome P450 family member MAX1 in Arabidopsis is required for the synthesis of SLs, and forms part of a signalling pathway containing at least four other genes in Arabidopsis and five in rice. Most other components of the strigolactone signalling pathway are conserved throughout the land plants, but MAX1 orthologues are absent from the moss Physcomitrella patens, which nevertheless produces SLs. Unlike other members of the pathway MAX1 orthologues have radiated in the angiosperms, particularly in the monocots. By use of complementation analysis this study presents evidence that MAX1 catalytic function is conserved in lycopodiophytes and gymnosperms, and that it may therefore have been incorporated into the SL pathway before the division of the vascular plant groups. In angiosperms the radiation of MAX1 gene copies has led to different evolutionary fates, of conservation of catalytic function in monocots, but divergence in dicots. Deletions of MAX1 orthologues have also contributed to natural variation in shoot architecture in domestic rice. In addition, this study presents evidence that the action of D27 in the biosynthetic pathway of SLs in rice is conserved in Arabidopsis. These genetic approaches are complemented with physiological investigation of the actions of strigolactones in non-angiosperm species, including spruce, fern and Selaginella species.
4 4 Table of Contents Abstract... 3 Table of Contents... 4 Acknowledgements Author s Declaration Chapter 1. Introduction Shoot branching Shoot meristems Hormone pathways The MAX pathway and Strigolactones Discovery Phenotypes and functions Regulation, signal transduction and transport Biochemical structure and hormone pathway Evolution of shoot branching Evolution of strigolactones Aims Chapter 2. Methods and Materials Definition of terms Nomenclature of duplicated genes Gene and protein naming conventions... 45
5 5 2.2 Molecular cloning techniques dh RNA extraction DNA extraction from plants cdna synthesis RACE RACE Sequencing PCR Error-free PCR Gel electrophoresis PCR Primers Q-PCR Restriction digestion Ligation Cloning from PCR products Bioinformatics Orthologue identification Coding sequence prediction Alignments Constructs... 54
6 Overexpression constructs Pre-transcriptional repression construct Production of Transgenic Organisms Bacterial selection and growth Escherichia coli transformation Agrobacterium tumefaciens transformation Plant transformation Plant growth and experimentation Plant material Growing conditions Hormone treatments Arabidopsis Medicago White Spruce Selaginella kraussiana Ceratopteris richardii Statistical analysis and representation of data Statistical analysis Graphs & Thesis Chapter 3. MAX1 Incorporation into the MAX pathway Introduction to the evolution of MAX
7 Phenotype Dose response curves The Brassicaceae-specific hypothesis MAX1 complementation by non-angiosperm species Branch phenotype Leaf phenotype Discussion Chapter 4. Roles for Strigolactones in Non-Angiosperm Species Gymnosperms - Picea glauca Initial decapitation studies and protocol development Long term effects of SL application SL effects on dormant apical bud formation SL effects on outgrowth after decapitation SL genes and phosphate response Moniliphytes (ferns) - Ceratopteris richardii Experimental species and gene search Responses to phosphate limitation Response to GR Lycopodiophytes - Selaginella kraussiana Initial studies and protocol development Branching and rhizophore length response to decapitation
8 Branching and rhizophore length response to GR24 and decapitation Discussion Chapter 5. MAX1 duplication in Angiosperms Medicago Branching phenotype Comparison of expression to phenotype Leaf phenotype In planta expression of MtMAX orthologues MAX1 diversity in rice Branch phenotype Leaf phenotype In planta expression of OsMAX orthologues Relating function to gene structure Discussion Chapter 6. D27 and D27like Expression of AtD27 and AtD27like Function of D27 and D27like Branching Leaf phenotype Discussion Chapter 7. General Discussion
9 9 Appendix A Appendix A Abbreviations (including gene name abbreviations) List of References
10 10 Acknowledgements Never has a thesis owed so much to so many! Primary thanks of course go to my supervisor, Ottoline Leyser, for encouragement, advice, inspiration as a scientist and a woman-in-science, and a lot of patience. Also and not least the provision of a lab full of equally friendly people to help me through the course of this PhD, all of whom deserve thanks for their many kindnesses. Of those people, Drs Céline Mouchel and Richard Challis initiated the study of the evolution of the MAX pathway and Céline especially inducted me into the mysteries of molecular and genetic experimentation. Drs Petra Stirnberg, Gosia Domalgalska, Anne Readshaw and Dörte Müller and fellow students Gilu George and (now Drs) Lynne Armitage and Scott Crawford in particular gave practical help and advice. My training committee, Drs Richard Waites and Betsy Pownall, expanded my understanding, restricted my wilder ideas, and tolerated my distraction of their own PhD students for tea drinking and gossip. Richard Waites also co-supervised me and oversaw the leaf shape work (and made sure this thesis got printed!). Dr Michael Schultze kindly supervised the work on Medicago. At other universities, Dr Heather Sanders of Oxford provided me with materials and advice on care of c-fern and Selaginella, and Dr Jill Harrison of Cambridge gave me papers and the best possible soundingboard for the Selaginella research. As a student of my generation I feel I must acknowledge the contribution of the Wikipedia website and that of the all-knowing NCBI, without which herein plants would not have common names and genes would not have identifiers. On a personal level, thanks are due to Dr Phil Garnett, Vera Matser, Dr Simon Ramsbottom, Simon Fellgett, Joe Vaughan and Tom Brabbs for tea, beer, pizza and sanity! In Tom, Vera and Joe s case, also for help with and commiseration about the vagaries of plant experimentation. Also to Dr David Hanke at Cambridge for first seeing through the disorganisation to something of promise, and Professors Howard Griffiths and J. Andrew C. Smith for revealing to me some of the weirder and more wonderful ways of plants.
11 11 My three inspirations, to whom this thesis is dedicated: Patrick Gordon, for love and faith and patience: my scientific Dad, for teaching me about DNA at 6 years old, 6-carbon-ring sugars at 7, and that pinnacle of art and science, beer, all my life; my artistic, linguistic mum, one Dr Price, who first taught me that what a girl really needs in life is a Ph.D.!
12 12 Author s Declaration Except where otherwise stated, the work presented in this thesis is my own. Identification of MAX orthologues was done in collaboration with Drs Céline Mouchel and Richard Challis as noted in Chapter 3, and of D27 orthologues in Chapter 6 by Dr Richard Challis, as well as all the phylogenetic trees. Gilu George, Ann Barker, Drs Petra Stirnberg, Malgorzata Domagalska and Anne Readshaw all kindly collected data and applied hormone treatments in the experiments on spruce described in Chapter 4 Section 1.2 in my absence, as did Thomas Brabbs for the experiment described in Chapter 4 Section 1.4. However, the experimental design was mine and they did so in accordance with that design and on my instruction. Constructs and transgenic plant lines produced by others are acknowledged in the text, and primers from others acknowledged in Appendix A1. Figure 3-2B in Chapter 3 has been previously published in Crawford et al. (2010).
13 13 Chapter 1. Introduction On this same view of descent with modification, all the great facts in Morphology become intelligible, - whether we look to the same pattern displayed in the homologous organs, to whatever purpose applied, of the different species of a class; or to the homologous parts constructed on the same pattern in each individual animal and plant. Charles Darwin, On the Origin of Species By Means of Natural Selection (1859) The brilliant diversity of a tropical rainforest is the result of many hundreds of years of the interlocking growth, death and regrowth of thousands of species from all the kingdoms of life plant, animal, fungus, bacteria, archaea and many of those strange branches of the life-river that are not readily recognised. Behind each of these species lies millennia of evolution: reproduction, mutation, and selection, so that each species has its particular capacities for survival among the great variety of environments found in just one square foot of a Darwinian tangled bank. Despite this astonishing array of abilities, the molecular tool-kits underlying this explosion of difference are often very similar. The same components are used to build similar modules, which are repeated with subtle differences depending on the genetics of the organism and, to some extent, its environment. Plants in many ways exemplify this similarity of construction. Like metazoans, fungi and a few others, they are multicellular, an evolutionary innovation that allowed inner subfunctionalisation of the organism into different cell types. These cell types in themselves become repeated modules (tissues), which go together to form organs structures that in plants particularly may be repeated many times. In flowering plants, roots and lateral roots are repeated to form complex networks, sepals, petals, stamens and carpels are repeated together to form flowers, and leaves, stem segments and axillary meristems are repeated to form the shoot and its branches.
14 14 The growth and positioning of cell types, tissues and organs in multicellular organisms are coordinated in the process known as development. Most metazoan species develop into organisms that can move, allowing them to change their environment by moving to a new one. In metazoans most developmental patterning is done early in life, and at the end of embryogenesis most of the major organs and tissues are specified. Although there are some exceptions, such as the change from tadpole to frog in the tetrapods, and the extreme developmental changes of larvae developing into adults in the arthropods, metazoans have one unchanging set of organs throughout even in those that metamorphose, their final form is fixed as to the number and position of their organs. In organisms such as plants and fungi, which are sessile for most of their lifecycle, growth forms their main source of movement and response to their environment, and changes to developmental patterning continue throughout their lives and are vital to their survival. As a result, plants have evolved suites of mechanisms to sense their environment and to control and coordinate the production of different organs. The evolution of one small part of this coordination mechanism is discussed here. 1.1 Shoot branching Shoot branching is one of the most recognisable characteristics of plant bodies, as branches provide the architecture from which leaves (the main source of energy) and the reproductive units form. The control of branch production, to allow optimal positioning of organs whose function depends on their local environment (light for leaves, accessibility to pollinators for flowers) is therefore key to determining the survival and reproduction of the plant. The development of branches, as for most other aspects of plant life, is best understood in the angiosperms, the flowering plants. In this group, the embryo is bipolar, with two regions from which the most of the plant will be formed: the root apical meristem and the shoot apical meristem (SAM). Meristems are the tightly coordinated structures of pluripotent cells that generate all postembryonic plant tissues, including secondary meristems. These secondary meristems include the axillary shoot, lateral and adventitious root, and vascular cambial meristems, and from different inceptions take a number of different forms. Lateral and adventitious root meristems form de novo in both root and
.")
15 15 shoot from the pericycle for lateral roots, or in the case of adventitious roots also from cambial tissue, and their siting and development is largely defined by hormone signalling (Benková and Bielach, 2010; Rasmussen et al., 2012). The vascular cambium, a layer of meristematic cells within the vascular tissue that allows the secondary thickening of the stem, and is therefore important to the production of wood, is produced during the development and patterning of vascular tissues (reviewed in Baucher et al., 2007). In the shoots of angiosperms axillary meristems form part of a series of repeated modules called phytomers, produced by the SAM, that make up the main stem. The phytomer consists of a section of stem (the internode), a leaf, the petiole of which joins the stem at the node, and between the leaf axil and the stem, an axillary meristem (Figure 1-1) (McSteen and Leyser, 2005). C B A Figure 1-1. Three different phytomers in a chrysanthemum (Dendranthema grandiflora) stem one with a dormant bud (A), one with a branch (B) and one with only an axillary meristem (C), and white arrows indicate bud, branch and axillary meristem (too small to see by the naked eye) respectively. The relationship between primary and secondary meristems may be one of equilibrium or of varying degrees of dominance in either direction depending on environmental cues such as temperature, light, nutrient content of the soil; and developmental cues such as age and flowering status. Information about any of these factors can be locally produced or transmitted from organs far distant
16 16 from their site of influence. In the case of the SAM and subtending axillary meristems the relationship is often one of dominance by the SAM. Axillary meristems can either activate to produce branches or a flowering shoot, go perpetually dormant, or switch between dormancy and active growth. Those that have produced some tissue may also be called axillary buds, which may have the same or different developmental characteristics to those of axillary meristems (reviewed in Bennett and Leyser, 2006). In many angiosperms the primary shoot meristem restricts the outgrowth of axillary meristems and buds lower down the stem, rendering them dormant in a process called apical dominance. Should the primary shoot apex be lost (for example, broken off or eaten by predatory herbivores), axillary meristems will be released to grow out to replace the primary shoot. The long distance signalling required to coordinate the status of multiple meristems, the environment and the plant s developmental status is mediated by a variety of factors, including the movement of proteins and RNA and particularly a dedicated hormone signalling network (reviewed by Domagalska and Leyser, 2011). As a result, the control of shoot architecture in angiosperms consists of at least two interacting and conserved systems, firstly the shoot meristem, and secondly the hormone signalling system Shoot meristems Although the molecular modules controlling the maintenance of shoot and root apical meristems as pluripotent regions contain a number of shared or similar components, only the processes involved in shoot meristem maintenance (and for axillary meristems, their production) will be discussed here. In Arabidopsis as in all seed plants, meristems are multicellular structures, in which more than one cell maintains pluripotency. Within the meristem an area of stem cells called the central zone (CZ) grow and divide slowly, producing daughter cells that are moved by the continued production of cells out of this region of pluripotency to the peripheral zone (see Figure 1-2). In the peripheral zone new organs may become specified. This area of pluripotency is maintained by expression of the homeobox transcriptional repressor WUSCHEL (WUS) in the organising centre (OC), a group of cells immediately below the CZ (reviewed in Besnard et al., 2011). WUS is a member of the WOX family of
17 17 plant-specific homeobox transcription factors (TFs) that are implicated in meristem development in both roots and shoots in angiosperms, and are conserved throughout land plants, although the action of WUS itself is an angiosperm innovation (Nardmann et al., 2009). AS1 STM CLV3 WUS AS1 Figure 1-2. Structure of the SAM in Arabidopsis (surrounded by expanding leaves), with the areas of expression of some of the regulatory genes labelled. Blue = area of the meristem, red = differentiating primordia, grey = OC, green = CZ, pink = RZ. Deep red lines represent the organ boundary regions where genes such as CUC and LAS will be expressed. Adapted from Besnard et al. (2011). The presence of WUS is required to maintain stem cell identity in the CZ. In turn, its expression is controlled by the production of a mobile peptide signal, CLAVATA3, produced by the CZ cells, which restricts WUS expression in the OC below (Katsir et al., 2011). The balance of this interaction contributes to control of meristem activity and is affected by a number of factors, particularly the signalling of the cytokinin group of plant hormones, which are required for stem cell maintenance and which themselves are regulated by WUS (reviewed in Durbak et al., 2012). Immediately below the OC the rib zone (RZ) forms the growing stem beneath the meristem, within which the vascular tissues of the stem differentiate. Throughout the CZ and OC and into the peripheral zone another meristem marker, SHOOT MERISTEMLESS (STM), is expressed. STM, like WUS is a member of a homeodomain TF family, the KNOX genes, which are involved in the specification of meristematic identity and whose actions are partly controlled through interacting with BELLRINGER (BELL) family homeodomain TFs (reviewed by Hay and Tsiantis, 2010). In angiosperms KNOX genes also interact antagonistically with the ARP family of genes such as
18 18 ASSYMETRIC LEAVES1 of Arabidopsis. ARP genes in Arabidopsis are expressed in emerging primordia during organogenesis, where they contribute to the downregulation of meristematic KNOX expression to provide determinacy. The sites at which lateral organs are produced in the peripheral zone are defined by the patterning of maxima of the hormone auxin, and auxin signalling contributes to downregulation of KNOX homologues. Auxin signalling also interacts with cytokinin signalling (CKs, another hormone group) at the CZ and OC to maintain high CK levels (Zhao et al., 2010) and in turn in young and developing tissues CKs have been shown to upregulate auxin synthesis (Jones et al., 2010). Thus these hormones between themselves, with other hormones (the gibberellins and brassinosteroids especially) and with other transcriptional and gene networks specific to the meristem provide a system of feedback and feedforward mechanisms that maintain the pluripotency of the meristem whilst allowing it to grow and react (Hay and Tsiantis, 2010; Besnard et al., 2011; Durbak et al., 2012) Axillary meristems The derivation of axillary meristems, whether arising de novo, in common with the mechanism suggested for root lateral meristem, or persisting as a detached part of the meristem of the primary meristem, has historically been a matter of debate in plant development. However, it seems that in angiosperms axillary meristems (AMes) are specified as part of leaf development within the phytomer, although due to changes in growth of different regions the AMe may end up on the leaf itself or on the stem some distance from it (this debate has been reviewed by Steeves and Sussex, 1989; and its conclusion reviewed by McSteen and Leyser, 2005). As a result, the correct establishment and placement of AMes is also related to the establishment of polarity in the subtending leaf, a process in which the Class III HD-ZIP family TFs such as REVOLUTA, among others, is involved, and to the correct specification of the boundaries of lateral organs, a process involving not only the KNOX and ARP factors noted above but also the actions of other transcription factors like the CUP-SHAPED COTYLEDON (CUC) family (Talbert et al., 1995; Raman et al., 2008; Hay and Tsiantis, 2010).
19 19 Axillary meristem specification itself is controlled by a suite of axillarymeristem specific factors in angiosperms, including the R2R3 Myb (TFs) Blind/RAX1 in tomato and Arabidopsis, the Ls/LAS/MOC1 GRAS TFs of tomato, Arabidopsis and rice and the ROX/LAX1/BA1 bhlh TFs of Arabidopsis, rice and maize (McSteen and Leyser, 2005; reviewed in Yang et al., 2012). LAS in particular is activated early in the development of angiosperm leaf primordia, though it specifies an area adjacent to the primordia, within the primary meristem region still defined as indeterminate by STM expression, and the expression of LAS is required for the reactivation of meristem identity later in the development of the leaf-ame module (Greb et al., 2003) Dormancy control in axillary meristems The maintenance of dormancy in these meristems is an equally complex process. Dormancy can take more than one form, and be imposed by different environmental and developmental stimuli (Rohde and Bhalerao, 2007). Likewise axillary meristems can adopt diverse fates giving rise to indeterminate shoot branches, determinate flowers and in some species underground storage organs, each of which may be subject to a different set of regulatory factors (Bennett and Leyser, 2006). Many of these factors are hormones, but in the case of branch production the TCP transcription factors TB1 (in maize) and its Arabidopsis orthologues BRANCHED1 (BRC1) and BRC2, pea orthologue PsBRC1 and rice orthologue FINE CULM1 (FC1) are important to the read-out of these interactions, to different extents in different species (Doebley et al., 1997; Aguilar-Martinez et al., 2007; Minakuchi et al., 2010). All three have axillary meristem (AMe) specific expression and repress branch outgrowth, and BRC1 expression closely correlates with axillary bud activity in Arabidopsis (Doebley et al., 1997; Aguilar-Martinez et al., 2007; Minakuchi et al., 2010). Downstream of TB1, the class I HD-ZIP GRASSY TILLERS1 (Gt1) has recently been identified as also being an important negative regulator in axillary meristem outgrowth, and is also regulated by light, suggesting it forms part of the integration of the shade avoidance response in branching control (Whipple et al., 2011). Upstream of the Tb1/BRC family, however, the precise factors regulating the mechanism of their downregulation have yet to be defined, and these may differ between species.
20 Hormone pathways The hormones of plants (sometimes termed plant growth regulators), have a history of interest to investigators of plant development and shoot branching in particular going back over a century (possibly first reviewed by Bayliss, 1918). For many years a set of approximately five substances or substance groups were recognised as hormones the auxins (a group of structures defined by their effect on plant growth, as suggested by its Greek namesake αυξειν, to grow), the cytokinins, the gibberellins, ethylene and abscisic acid (ABA; Santner and Estelle, 2009). More recently, this little population has bloomed, and the brassinosteroids, salicylic acid, jasmonic acid and strigolactone-related compounds have generally been accepted as hormones to some degree (Jaillais and Chory, 2010). Mutants in Arabidopsis suggest the existence of at least one other, as-yet-unidentified and carotenoid derived signal (reviewed in Mouchel and Leyser, 2007; Lee et al., 2012). Several other groups of non-cell autonomous signalling molecules exist, including the short peptide signals such as CLAVATA3, reactive oxygen species, mobile RNAs, and some have been proposed to have hormone-like properties and actions, such as FT, the mobile protein that is required for photoperiodic induction of flowering in Arabidopsis (the much sought-for florigen ) and also regulates seasonal dormancy in poplar (Böhlenius et al., 2006; signalling molecules reviewed by Van Norman et al., 2011; Turnbull, 2011). However, the term hormone in plants is usually applied to the small molecules derived from secondary metabolism that can carry longrange signals and are active at low levels (Santner and Estelle, 2009; Jaillais and Chory, 2010). Several of these hormones have been implicated in the control of shoot branching and dormancy in axillary meristems, including all of the original canonical five at some time, a point perhaps unsurprising given the generally pleiotropic nature of plant hormones. However, of these, auxin was the first identified (Thimann and Skoog, 1933) and is one of the most important in shoot branching, along with cytokinins and the newest group of hormones, the strigolactones.
21 Auxin The hormone auxin is one of the best characterised signals known in plant development and evolution, and probably the most important. Auxin has a role in a vast array of environmental and internal developmental processes, acting as a morphogen in the establishment of plant body axes, tracing the future lines of vasculature, and regulating the growth rate, positioning and production of organs in both shoots and roots in response to internal developmental and external environmental cues (reviewed by Leyser, 2011). One particular function it performs in many seed plants is the control of shoot branching (McSteen and Leyser, 2005; Cline et al., 2006). A particular feature of auxin signalling is the importance not only of its presence but of its movement the polar auxin transport (PAT) mechanism. This mechanism is a unique and specific, self-regulating and self-organising transport system of dedicated plasma-membrane influx and efflux carriers (Benjamins and Scheres, 2008). The self-organising nature of auxin transport is vital to the establishment of the peaks and troughs in auxin concentration that specify the emergence of organs in both root and shoot, and is generated through complex feedback and feedforward mechanisms acting on the placement and action of the influx and efflux carriers. These mechanisms have provided material for a number of elegant mathematical models of plant development (for example, those of Smith et al., 2006; Lucas et al., 2008; and Prusinkiewicz et al., 2009). The production of auxin transport channels a process known as canalisation is driven in part by the behaviour of the PIN family of auxin efflux carriers, which export auxin across the plasma membrane, but are continuously cycled from there to internal vesicles, a process necessary for plant development (Paciorek et al., 2005). This endocytotic cycling requires, in the case of PIN1 and PIN7, the action of the ADP ribosylation factor-gtp/gdp exchange factor (ARF-GEF) GNOM, which is involved in the regulation of vesicular trafficking to endosomes, and gnom mutants show severe patterning defects from embryogenesis. Constant endocytotic cycling allows changes to the polarity of PIN protein localisation on the plasma membrane, and this localisation is partly controlled by the auxinregulated protein serine/threonine kinase PINOID through the phosphorylation
22 22 status of the PINs (Benjamins and Scheres, 2008). Endocytotic cycling is inhibited by auxin itself, possibly through the action of the ABP1 auxin receptor, so that auxin self-regulates its own polar transport stream both by stabilising PIN proteins at the plasma membrane, and (via PINOID and other factors) by polarising them in the direction of auxin flow, thus generating directional, self-reinforcing transport (Paciorek et al., 2005; Benjamins and Scheres, 2008; Dhonukshe et al., 2008; Robert et al., 2010). The resulting auxin channels may then differentiate into vascular traces, and so play an important role in the development of the vascular network, and the channels remain in the adult vascular tissue throughout the plant (Sachs, 1981; Baucher et al., 2007). In the control of shoot branching, the polar transport of auxin, travelling from its point of synthesis in the growing tip and tissues of the shoot, down the stem to its point of action, is key to the maintenance of dormancy in axillary meristems. Removal of the auxin source by decapitation of the growing shoot tip leads to the outgrowth of axillary buds further down the stem, and replacement of this source by exogenously supplied auxin can prevent this outgrowth (Thimann and Skoog, 1933). Disruption of polar auxin transport with inhibitors also allows outgrowth of buds further down (Panigrahi and Audus, 1966; Chatfield et al., 2000). However, the points and mechanism of auxin action in shoot branching are more complex than the simple presence of auxin from the shoot directly repressing outgrowth, as auxin from the polar auxin transport stream does not enter the bud itself (Booker et al., 2003). The presence of one or more second messengers has therefore been postulated (Booker et al., 2003) Cytokinins The actions of cytokinins (CKs) are likely to form at least part of this second messenger role (reviewed in detail by Muller and Leyser, 2011). CKs are both synthesised locally in the bud and travel upwards from the roots, directly promote meristem activity and can promote bud outgrowth when applied directly to the bud (Muller and Leyser, 2011 and references therein). When basally applied CKs can activate buds even in the presence of apical auxin, and thus they act antagonistically to auxin in apical dominance (Chatfield
23 23 et al., 2000). CK production in the nodal stem is downregulated by apical auxin, and this has contributed to a model in which release of CK production from repression by the loss of apical auxin on decapitation promotes bud outgrowth (Tanaka et al., 2006). Cytokinins are implicated in the promotion of meristem identity and outgrowth, partly through their interactions with auxin itself and through direct effects on cell cycling (reviewed in Durbak et al., 2012). However the precise mechanisms of CK promotion of bud outgrowth is likely to be considerably more complicated, as the feedback loops between CKs and auxin act at a number of levels (Muller and Leyser, 2011), some of which are discussed below Strigolactones Mutants in a range of species revealed the existence of another factor, acting in concert with auxin and cytokinins (reviewed in Domagalska and Leyser, 2011). In Arabidopsis these mutants were termed the max mutants, for More AXillary growth. The MAX pathway produces and responds to a signal that acts at long-range, is produced in the root and shoot, travels upwards towards the shoot apex in the transpiration stream in the xylem and can act at or near the bud to repress its outgrowth (Booker et al., 2005; Stirnberg et al., 2007; Kohlen et al., 2011). These signal are carotenoid derived and this, along with a defect in the formation of symbiotic relationships with fungi in the mutants in pea, led to their recent identification as being the strigolactone-related (SLs) group of compounds (Gomez-Roldan et al., 2008; Umehara et al., 2008). Like auxin, the action of SLs in branching control is to repress outgrowth, and so their action is proposed to form part of the second messenger function. SL biosynthesis genes are upregulated by auxin (Bainbridge et al., 2005; Johnson et al., 2006; Arite et al., 2007; Foo et al., 2007; Hayward et al., 2009). However, in common with auxin and cytokinins, the precise mechanisms of action of SLs have not been conclusively defined. In one hypothesis of their action, SLs act directly within the bud to maintain dormancy, antagonistically to CKs, with the dormancy regulator BRC1 in Arabidopsis being a putative target in a more-or-less direct signalling cascade (Dun et al., 2006; Brewer et al., 2009; Dun et al., 2009; Braun et al., 2012). However, in assays using excised
24 24 nodes without a natural or supplied auxin source, synthetic SL analogues are incapable of repressing outgrowth (Crawford et al., 2010) an inability suggesting that interaction with other hormones is key to SL action Hormone Interactions the Canalisation Hypothesis The beginning of the investigation of apical dominance was with auxin, and auxin may yet be its end. Auxin downregulates CK synthesis, upregulates SL synthesis and feedback regulates its own synthesis (Leyser, 2011). Auxin also regulates its own transport, and the transport of auxin from the bud to the main stem has been proposed as key to the outgrowth of dormant buds (Sachs, 1981). In the canalisation hypothesis of branching control, the ability of buds to export auxin to the main stem determines their release from dormancy. This export is a competitive process, with buds competing not only with the primary apical meristem but with buds above and below for a common transport route in the main stem (Bennett et al., 2006; Prusinkiewicz et al., 2009; Crawford et al., 2010; Balla et al., 2011; reviewed in Domagalska and Leyser, 2011). This transport route provides the auxin sink to which auxin transport, via PIN polarisation, will canalise, if the balance between the auxin sources and the sink strength allows (Prusinkiewicz et al., 2009). SLs also influence PIN cycling, as SL addition decreases the amount of PIN protein localised to the basal plasma membrane and SL mutants have increased PIN and increased auxin transport, in antagonism to auxin s own effect on its transport (Bennett et al., 2006; Crawford et al., 2010). In the canalisation hypothesis of bud outgrowth, SL repression of shoot branching is mediated via their dampening effects on auxin transport, thereby increasing the competition between buds and the apical auxin source (Prusinkiewicz et al., 2009; Crawford et al., 2010). In addition to those discussed here, other hormones such as gibberellins, and factors such as light, also affect bud outgrowth (Bennett and Leyser, 2006). With so many interdependent factors, acting both with the bud and across the whole plant, precise conclusions about the relative importance of the different aspects of hormone interaction are hard to draw, leaving the question of the direct action versus canalisation hypotheses open to further research the situation, like the hormones, remains in flux. However, whatever their precise
25 25 mode of action at (or nearby) the branching node, the identification of SLs as signals involved in branching control has led to their recognition as the newest group of plant hormones, and considerable interest in the investigation of their mechanisms of action, of their synthesis, and in the case of this thesis, of their evolution. 1.2 The MAX pathway and Strigolactones Discovery Strigolactones are so named for strigol, the compound first identified as a germination stimulant active at hormonal level for the parasitic plant Striga lutea in the 1960s (Cook et al., 1966). SLs are exuded from plant roots, and so their presence acts as a beacon for the proximity of a host species to parasitic species such as those of the Orobanchaceae family, the Striga, Orobanche, and Alectra genera (Humphrey and Beale, 2006). Parasitic on a wide range of crops, including legumes and members of the Solanaceae and Brassicaceae, these species cause substantial economic damage and abandonment of cultivation of susceptible species in many countries in the developed world (Humphrey and Beale, 2006; Parker, 2009). However, Striga arguably wreaks the most havoc through its effect on cereal crops, particularly maize, pearl millet and sorghum, on subsistence farms in Africa, and the problem of infestation is increasing (Parker, 2009). This has driven considerable research in SLs as potential targets for use in battling these pernicious weeds (Zwanenburg et al., 2009). A turning point in strigolactone research was the discovery of a role for their exudation from the host plant. After nearly forty years of knowing of their existence, Akiyama and colleagues reported that SLs simulated the branching of hyphae in arbuscular mycorrhizal (AMy) fungi (2005). AMy symbioses have been proposed as key to the success of the land plant as they provide plants with the ability to colonise, and collect nutrient from, larger areas of ground via fine fungal hyphae at a lower cost than would be possible with their own roots (Wang and Qiu, 2006; Parniske, 2008). However, these symbioses do still come with a cost in the form of sugar, and sometimes other nutrients, supplied to the symbiont fungus, so there is a selective pressure to limit symbiosis formation to
26 26 when it is most required (Parniske, 2008). The plant side of the initial communications in attracting fungal symbionts now appears largely, though not entirely, to be mediated by the exudation of SLs from their roots, this time as beacon for fungal help (Bouwmeester et al., 2007). SLs were known to be carotenoid-derived (Matusova et al., 2005) and this was one of the factors that contributed to their matching to the carotenoid-based MAX pathway by two groups (Gomez-Roldan et al., 2008; Umehara et al., 2008). There were four genes known in the MAX pathway in Arabidopsis, identified from the max mutants. MAX3 and MAX4 are the carotenoid cleavage dioxygenases (CCDs) that produce a graft-transmissible signal that is subsequently modified by MAX1, a cytochrome P450 family protein in a clade unique to plants (Booker et al., 2004; Schwartz et al., 2004; Booker et al., 2005). MAX2 forms part of the signal transduction pathway, and is a member of the F-box protein family, which is involved in providing substrate specificity to the proteolytic 26S proteasome pathway, a role conserved in this family in many organisms, including mammals (Stirnberg et al., 2002; Stirnberg et al., 2007). The mutant phenotypes of the Arabidopsis, pea and rice orthologues of MAX2 are resistant to the addition of synthetic SLs (Gomez-Roldan et al., 2008; Umehara et al., 2008). max2 among the Arabidopsis mutants also has more severe and additional phenotypes, particularly in germination, photomorphogenesis and leaf shape defects (Shen et al., 2007; Stirnberg et al., 2007; Nelson et al., 2011; Waters et al., 2012). Similar mutants to the biosynthetic maxes also exist in pea (ramosus, RMS, mutants), petunia (decreased apical dominance, DAD) and rice (dwarf, D and high-tillering dwarf, HTD), and have led to the identification of orthologous genes to MAX2, MAX3 and MAX4 in these species, as well as other components not previously identified in Arabidopsis, principally the biosynthetic D27 and mysterious D14 components found in rice (see Table 1-1).
27 27 Table 1-1. Characterised orthologues of MAX genes in four species. Founding member in bold. References: (3 - Stirnberg et al., 2002; 2 - Sorefan et al., 2003; 1 - Booker et al., 2004; 10 - Ishikawa et al., 2005; 13 - Snowden et al., 2005; 11 - Johnson et al., 2006; 6 - Zou et al., 2006; 7 - Arite et al., 2007; 12 - Simons et al., 2007; 12 - Gomez-Roldan et al., 2008; 8 - Umehara et al., 2008; 9 - Arite et al., 2009; Gao et al., 2009; 5 - Lin et al., 2009; Liu et al., 2009; 14 - Drummond et al., 2012; 4 - Waters et al., 2012) D27 CCD7 CCD8 MAX1 D14 MAX2 Arabidopsis AtD27 MAX3 1 MAX4 2 MAX1 3 AtD14 4 MAX2 3 Rice D27 5 D17 6 D10 7 Pea Unknown RMS5 11 RMS1 3 No mutants, five orthologues known 8 Unknown, at least 2 orthologues D14 9 D3 10 Unknown RMS4 11 suspected 12 PhMAX1 14 (not Petunia Unknown DAD3 12 DAD1 13 known as mutants, but role established Unknown PhMAX2a and PhMAX2b 14 (not known as mutants, but role established) Phenotypes and functions All these mutants lacked the presence of, or ability to respond to, the carotenoid-derived, graft-transmissible signal that would be identified as SL (Leyser, 2008). In terms of phenotype, mutants in strigolactone production, recognition or transduction show increased numbers of branches due to higher proportions of axillary buds breaking dormancy and growing out. In the Arabidopsis mutant phenotype this is mainly noticeable in buds from rosette leaves. Arabidopsis wild type axillary meristems typically activate in a basipetal wave (down the stem) on flowering, and also to a lesser extent in an acropetal wave, from older bud to younger bud up the stem (Hempel and Feldman, 1994). max mutants initiate many more of these first order axillary meristems in the rosette, which are normally dormant in the wild type (first order branches are generated from the main stem higher order branches are produced from branches themselves, and the proportion of these is not affected, Figure 1-3).
 stage and the transitional inflorescence stage - these leaves and nodes are referred to as cauline.")
28 28 Cauline Rosette Wild type branching max mutant branching A B Figure 1-3. Branching pattern in Arabidopsis thaliana wild type and max mutants. Buds are produced in the axils of leaves made both in the vegetative (rosette leaf) stage and the transitional inflorescence stage - these leaves and nodes are referred to as cauline. Arrows represent active, growing meristems, red circles for buds actively growing out, blue for dormant buds. Plant A) Columbia-0, an ecotype, and B) a Columbia-0 plant carrying a mutation in MAX1 (allele max1-1). Mutants across all species also display several pleiotropic phenotypes such as reduced height, changes in leaf size and shape and in Arabidopsis, petunia and rice delayed senescence, hinting a wide range of roles for SLs (Woo et al., 2001; Stirnberg et al., 2002; Ishikawa et al., 2005; Snowden et al., 2005; Arite et al., 2007; Yan et al., 2007). Indeed, not only have they been shown to be germination stimulants for parasitic plants, attractants for mycorrhizal fungi, accelerators of senescence, and a missing link in shoot branching control, SLs have recently been implicated in a wide range of other processes (and Xie et al., 2010; reviewed by Tsuchiya and McCourt, 2012). These include; promoting germination in non-parasitic plants (Tsuchiya et al., 2010; Nelson et al., 2011; Toh et al., 2012); light signalling (Kebrom et al., 2010; Mayzlish-Gati et al., 2010; Koltai et al., 2011); promoting nodulation (the formation of symbioses with nitrogen fixing bacteria) in pea (Foo and Davies, 2011); restricting the development of cambial thickening and the production of adventitious roots; and in a concentration dependent manner promoting root elongation and root hair development (Agusti et al., 2011; Kapulnik et al., 2011; Koltai, 2011; Ruyter-Spira et al., 2011; Rasmussen et al., 2012). In cambial and root
29 29 development, SL action has also been found to be related to its effects on auxin signalling, as it is for shoot branching (Agusti et al., 2011; Ruyter-Spira et al., 2011; Rasmussen et al., 2012; Kapulnik et al., 2011; Koltai, 2011). This plethora of roles is similar to those of other plant hormones, and marks them as key regulators of plant development. The phenotypes affected by SLs may be diverse, but several aspects of their function and regulation suggest that there may be a unifying factor to their actions. Their effects on plant growth in the shoot are largely restrictive, but they have promotive effect on root development, especially in phosphate limited conditions, and their exudation promotes the formation of phosphate-supplying AMy symbioses (Bouwmeester et al., 2007; Agusti et al., 2011; Domagalska and Leyser, 2011; Ruyter-Spira et al., 2011). Moreover, SL production, exudation and the expression of SL biosynthesis genes are upregulated in response to phosphate and, in some species, to nitrogen limitation (Yoneyama et al., 2007; Yoneyama et al., 2007; Lopez-Raez et al., 2008; Umehara et al., 2010; Ruyter-Spira et al., 2011; Kretzschmar et al., 2012; Yoneyama et al., 2012). These factors suggest that SLs might be general regulators of development in response to nutrient availability (particularly that of phosphate) and to some extent light availability, although in these actions SLs form a single part of a complex signal integration process with many other inputs, frequently other hormones (for example, as reviewed by Domagalska and Leyser, 2011) Regulation, signal transduction and transport The signal transduction of SLs and their own regulation is not yet completely understood, although their mode of transport has been better characterised. Grafting experiments between roots and shoots, and also using epicotyl intergrafts, had previously indicated that the branching inhibitor was upwardly mobile (Beveridge et al., 1996; Foo et al., 2001; Booker et al., 2005; Simons et al., 2007), and SLs have since been identified in xylem sap (Kohlen et al., 2011). A mechanism of exit from the xylem, and also from the roots when exuded, has been supplied by the recent identification of the petunia ABC transporter protein PhPDR1 as a strigolactone transporter by Kretzschmar et al. (2012). PDR1 is required for proper exudation of SLs and for proper shoot
30 30 branching control, although the phenotypes are not as severe in the pdr1 transgenic knock-down as in the dad1 biosynthesis mutant (Kretzschmar et al., 2012). Consistent with these roles, PhPDR1 is expressed both in the subepidermal cells of lateral roots, and in the vasculature of the stem above ground, especially near nodes with axillary meristems, perhaps allowing the unloading of SLs from the xylem into the living tissues in which it is likely to act, whether directly or via effect on auxin transport (Kretzschmar et al., 2012). MAX2, and its homologues in rice, D3, and in pea, RMS4, are the only confirmed signal transduction components of the SL pathway. They are leucinerich repeat F-box proteins, which form the part of the SCF complex that interacts directly with the substrate in E3-RING ubiquitin ligases, which mark proteins for destruction via the 26S proteasome by attaching ubiquitin proteins to them (Vierstra, 2009). Several other F-box proteins have been implicated in hormone signalling cascades, such as those of auxin, jasmonic acid and gibberellins (Dharmasiri et al., 2005; Kepinski and Leyser, 2005; Ueguchi- Tanaka et al., 2005; Katsir et al., 2008). However, as yet there is no receptor for SLs confirmed and nor are there any direct targets for degradation or transcriptional regulation mediated by MAX2. Regulators for SLs themselves include auxin, which transcriptionally upregulates the expression of the biosynthetic components MAX3 and MAX4 and their orthologues in pea and rice, in a manner dependent on auxin-signalling component AXR1 in Arabidopsis (Bainbridge, 2005; Foo et al., 2005; Johnson et al., 2006; Zou et al., 2006; Arite et al., 2007; Hayward et al., 2009). This process forms at least part of the negative feedback of SLs on their own biosynthetic genes, reported in all four species in which mutants are known (Foo et al., 2005; Arite et al., 2007; Foo et al., 2007; Simons et al., 2007; Umehara et al., 2008; Hayward et al., 2009). In addition to auxin, upregulation of biosynthetic SL genes on phosphate limitation has also been reported, consistent with the upregulation of SL biosynthesis in the same conditions in a large number of species (Umehara et al., 2010; Kohlen et al., 2011; Yoneyama et al., 2012 and references therein). Finally, recently the GRAS transcription factors NODULATION-SIGNALLING PATHWAY1 (NSP) and NSP2 have also been shown to be required for SL
31 31 production and upregulation of MtD27 and a MAX1 orthologue in Medicago truncatula, a legume (Liu et al., 2011), a finding discussed further in Chapter Biochemical structure and hormone pathway SLs are formed of a backbone of four rings, with variation in the degree of saturation on the rings between different compounds (see Figure 1-4, taken from Umehara et al. 2008). The three ABC rings form a single lactone and are joined to the fourth D ring, a γ-butyrolactone moiety, by an enol ether bond liable to nucleophilic attacks, such as by water, making most of the SL compounds labile in water and ethanol (Akiyama et al., 2010 and references therein). However, this C-D section is required for the hyphal branching activity of SLs in fungi and to their germination activity in parasitic plants (Zwanenburg et al., 2009; Akiyama et al., 2010). Figure 1-4. Structure of four strigolactones, taken from Umehara et al deoxystrigol is believed to be the first compound synthesised with activity in shoot branching (Rani et al., 2008), and the predominant SL in rice, while orobanchol is probably the predominant SL in Arabidopsis (Goldwasser et al., 2008; Kohlen et al., 2011). Strigol is the SL founder, and GR24 is a synthetic analogue that has become highly used in studies of plant branching. A wide range of strigolactones, including strigol, sorgomol, orobanchol and 5-deoxystrigol, have been isolated from plants, of which 5-deoxystrigol has been proposed as a first active compound before elaboration by hydroxylation reactions changes its structure further (Rani et al., 2008). Although the
32 32 particular chemical structures active in shoot branching are still unknown, Umehara et al. (2008) and Gomez-Roldan et al. (2008) demonstrated that a synthetic strigolactone compound called GR24 could rescue biosynthetic, but not signalling, mutants in the MAX (Arabidopsis), RMS (pea) and tillering dwarf (rice) pathways, that these compounds are produced in planta, and that they are absent in the biosynthetic but not the signalling mutants of the pathway. These biosynthetic mutants are discussed further below D27 D27 was identified from analysis of a group of rice mutants assembled on the basis of their tillering dwarf phenotype mutants that displayed reduced stature but that produced more tillers (branches) than wild-type plants by Ishikawa et al., in a study that also identified all the other mutants in the MAX pathway known in rice (2005). As well as their higher production of tillers, which could be reduced by the addition of GR24, d27, like the other mutants, also had reduced culm length and plant height and increased auxin content and polar transport in the shoot (Ishikawa et al., 2005; Arite et al., 2007; Lin et al., 2009). Interestingly from an evolutionary point of view, when the affected locus was identified, it was found to encode a protein with no previouslycharacterised family members nor conserved domains. In full-length form D27 binds an iron cofactor, although this was lost in C terminal truncated polypeptides. The role of D27 in the SL-related hormone pathway was strongly supported by the reduction in levels of 2 -epi-5-deoxystrigol in the mutant and lowered induction of Orobanche minor seed germination by mutant root exudates compared to the wildtype (Lin et al., 2009). The protein is plastid localised, like those of MAX3 (D17 in rice) and MAX4 and D10 (the rice MAX4 orthologue), and shares similar expression patterns to D17 and D10 (Booker et al., 2004; Auldridge et al., 2006; Arite et al., 2007; Lin et al., 2009). The location of the protein and its iron content led to the hypothesis that D27 catalyses a redox reaction required for SL biosynthesis, either after (Beveridge and Kyozuka, 2010) or before the action of D17 and D10. This hypothesis was confirmed very recently by the findings of Alder et al. (2012), which identified D27 as having catalytic activity as a carotenoid isomerase required to convert
33 33 all-trans-β-carotene into 9-cis-β-carotene (discussed further in Chapter 6), the substrate required by the next step in the pathway, CCD MAX3 (CCD7) & MAX4 (CCD8) The CCD proteins belong to a family of non-haem, iron-containing polyene dioxygenases, with nine members in Arabidopsis. Of these nine, five belong to the 9-cis-epoxy-dioxgenase (NCEDs) clade, all of which are involved in synthesis of the phytohormone ABA (Frey et al., 2012). CCD7 and CCD8 orthologues each belong to phylogenetically distinct clades and both share more similarity to non-plant orthologues than to plant CCDs (such as NCED9) outside their own clade (Sorefan et al., 2003; Wang et al., 2011a and pers. comm. R. Challis). Mutants in these genes have been found in all four of the species in which SLs have been characterised mutationally (see Table 1-1 and references therein). In addition, the role of CCD8 in SL mediated regulation of shoot branching has also been demonstrated in the economically important floristry species chrysanthemum (Liang et al., 2010), as has the role of CCD7 in tomato (Vogel et al., 2010) and of CCD7 and CCD8 in kiwifruit, demonstrating that SLs are active in branching in a woody perennial (Ledger et al., 2010). The two CCDs had been shown to be required for the production of a mobile substrate, upstream of the action of MAX1, and able to sequentially cleave the apocarotenoid all-trans-β-carotene in vivo to produce 13-apo-βcarotenone (Booker et al., 2004; Schwartz et al., 2004). Around the same time, the work of Matusova et al. had indicated that at least part of the SL molecule was derived from carotenoids, and proposed a pathway in which cleavage of the C11-C12 bond of 9-cis-β-carotene by a CCD provided the ABC rings of the structure, and the D ring was added later (2005). More recently, the work of Alder and co-workers has confirmed that the production of a putative SL precursor requires the 9-cis isomer of β-carotene (2012). However instead of the second lactone (the D ring) being added later, it is formed by the cleavage of 9- cis-β-carotene into 9-cis-β-apo-10 -carotenal (and a second product, β-ionone) by CCD7 and conversion to a novel compound, carlactone, by the action of CCD8 (Alder et al., 2012 and see Figure 1-4, taken from that paper). The carlactone compound already possesses the D ring, and the final steps to the
. A) Steps established by Alder et al. B) Steps proposed for the continuation of the pathway. 1.2.4.")
34 34 production of strigolactones include cyclisation to form the B and C rings instead, roles for which MAX1 may be a candidate (Alder et al., 2012). Figure 1-5. Biochemical pathway for SL synthesis taken from Alder et al. (2012, supplemental data). A) Steps established by Alder et al. B) Steps proposed for the continuation of the pathway MAX1 Unlike the CCD genes, grafting studies have shown that MAX1 is not required to be active in the same tissues as MAX3 and MAX4 to produce the wildtype branching phenotype (Booker et al., 2005). These results suggested that MAX1 is downstream of the action of the CCDs within the biosynthetic pathway, and that unlike the CCDs was acting on an upwardly mobile, grafttransmissible substrate. MAX1 was first identified as a component of the strigolactone pathway via analysis of the max1-1 mutant in Arabidopsis, an ethyl methane sulphonate (EMS) induced mutation in the Enkheim-2 ecotype background, chosen from the AIS collection because of its many-stemmed phenotype (Stirnberg et al., 2002). The affected gene was identified as At2g26170, a member of the cytochrome P450 monooxygenase superfamily (shortened to CYPs; Booker et al., 2005). This enzyme family is almost ubiquitous in living organisms, occurring even in viruses, and its members catalyse a wide range of redox reactions with an equally diverse variety of substrates (Hannemann et al., 2007; Nelson, 2011). These reactions are catalysed through the movement of electrons via a haem cofactor, bound
35 35 through a conserved cysteine group, an arrangement that generates the characteristic light absorption at 450nm that gives these proteins their name. This flexibility of CYPs to catalyse such a variety of different reactions has contributed to making identification of MAX1 s precise role in the MAX pathway difficult, although it may catalyse hydroxylation reactions downstream of carlactone or even downstream of the first active SL compound D14 When mutated, d14 and Atd14 render rice and Arabidopsis incapable of response to GR24 (Arite et al., 2009; Waters et al., 2012), suggesting a very late biosynthetic step or involvement in signal transduction. As a member of the α/β fold hydrolase superfamily D14 has relatives both with receptor functions in plants in the gibberellin pathway (Ueguchi-Tanaka et al., 2005) and with a wide range of biosynthetic functions. These include that of Salicylic-Acid Binding Protein 2, which is required for production of the plant hormone salicylic acid (Forouhar et al., 2005), or that of AidH, a bacterial protein that hydrolyses the γ-butyrolactone ring of bacterial quorum-sensing signal molecules N- acylhomoserine-lactones (Mei et al., 2010), which share this lactone group with SLs (Tsuchiya and McCourt, 2012). As a result, it is as yet unknown whether D14 represents a late-acting member of the biosynthetic pathway, a putative part of a receptor complex, or a step in the latter signal transduction. D14 has several paralogues in both the rice and Arabidopsis genomes, which themselves are conserved in many land plants (Waters et al., 2012). D14 and these sister clades have been shown to have diverged in function and expression to play similar roles in two parallel signalling pathways by the group of Professor Steven Smith at the University of Western Australia. The SL signal transduction component mutant max2 has phenotypes not shared by the biosynthetic mutants in the MAX pathway, particularly photomorphogenic defects in seedlings (Nelson et al., 2011). In the study by Waters et al. (2012) Smith and co-workers found that these phenotypes are in common with mutants in AtD14like, which are defective in sensing karrikins, germination stimulants from smoke which show structural similarity to SLs (specifically the D butenolide ring). Atd14like mutants do not show SL insensitivity. However,
36 36 mutants in AtD14, which do not share the seedling dormancy phenotypes, do instead largely share the SL insensitivity of max2 mutants residual responses to GR24 being due to a slight redundancy with AtD14like. AtD14like is the more ancient of the two orthologues, perhaps reflecting an ancient role in promoting germination. The tempting (and tentative) conclusion to draw is that that the duplication of D14like has allowed the evolution of parallel pathways, both sensing molecules whose presence predates in planta roles (karrikins from smoke, SLs as biologically synthesised compounds whose actions previously occurred outside the plant) and which share structural similarity, whilst retaining an elegant efficiency by sharing downstream signal transduction components. Such an example of evolution by molecular exploitation has been previously reported in the steroid hormone signalling pathway of vertebrates (Bridgham et al., 2006). A predisposition in the ancestral corticoid receptor to aldosterone, a hormone not present in the ancestral vertebrate, was exploited when a modification to the catalytic activity of a cytochrome P450 in the tetrapod lineage produced this new steroid. The corticoid receptors had duplicated much earlier in the vertebrate lineage, and so both the genetic and chemical materials were present for the evolution of a new, yet specific, hormone-ligand interaction (Bridgham et al., 2006). In SL signalling, the predisposition of the receptor to the butenolide lactone ring compound may have provided the ability to receive the structurally-similar karrikin compounds, even before that reception became associated with a specific response. This story of the evolution of hormone signalling pathway components is a good example of the importance of duplication and subsequent sub- or neofunctionalization to the elaboration of developmental mechanisms, be it HOX genes in animals or KNOX genes in plants (Gehring et al., 2009; Hay and Tsiantis, 2010). As a new regulator of plant development, analysis of the evolutionary history of SL signalling and synthesis will shed light on the coordination of growth in different species, and the universality of this method of growth control in the plant kingdom.
37 Evolution of shoot branching The land plants are a monophyletic group that is believed to have evolved from the charaphyte group of green algae approximately 470 million years ago (mya, Pires and Dolan, 2012). With these algae they share a number of characteristics important to land-plant development, including multicellularity, apical growth, PIN-like orthologues and several other elements of auxin signalling (although not all), and the control of diploid development by KNOX/BELL interactions (Lee et al., 2008; De Smet et al., 2011; reviewed in Pires and Dolan, 2012). Land plants possess two multicellular life stages, one haploid, and one diploid, and the degree of dominance and independence of each stage has changed in the successive groups that have emerged through evolution, generally towards elaboration of the diploid sporophyte at the expense of the complexity and independence of the gametophyte. Figure 1-6 shows gives a broad plan of the relationship of the extant land plant groups. In the mosses, liverworts and hornworts (the bryophytes ) the haploid gametophyte is the dominant phase, and this produces thallus or leaf- and roothair-like structures on at least one different growth axis, while the diploid sporophyte has a single growth axis (it never normally, pers. comm. J. Langdale branches) and is virtually parasitic upon the gametophyte (Bell and Hemsley, 2000). In lycopodiophytes and ferns the sporophytic, the diploid sporophyte stage is dominant, and has a developed vascular system, although the gametophyte is still free-living and independent, if usually tiny (Bell and Hemsley, 2000). In the seed plants, the gametophyte has become the maternal tissue of the seed and pollen, totally dependent on the sporophyte and in the case of angiosperm pollen, reduced to only two nuclei (Willis and McElwain, 2002). Development in gametophyte and sporophyte appear to be differently regulated, with the KNOX and BELLRINGER transcription factors that specify indeterminacy and meristem identity in angiosperms involved in sporophytic but not gametophytic development in mosses, lycopodiophytes and ferns (Harrison et al., 2005; Sano et al., 2005; Singer and Ashton, 2007; Sakakibara et al., 2008).
38 Seed plants Euphyllophytes Vascular plants 38 Charaphyte algae Liverworts Mosses Hornworts Lycophytes Ferns (Moniliphytes) Cycads Gymnosperms Ginkgo Conifers Gnetales Paraphyletic basal clades Angiosperms Eudicots Monocots Figure 1-6. Phylogenetic relationships of extant plant groups, adapted from Tudge (2006) and Pires and Dolan (2012) Telome theory & the evolution of axillary branching Branching in the different groups of land plants varies greatly, and branching in the vascular plants is discussed further in Chapter 4. In angiosperms, branches develop from axillary meristems, and AMes in turn develop with the leaf. True leaves, or megaphylls are believed to have derived, in evolutionary terms, from indeterminate bifurcations i.e. branches (reviewed in Beerling and Fleming, 2007). Extant bryophytes do not have leaves or branches in the sporophyte at all, but only a single growth axis topped by a determinate structure, the sporangium, although the gametophyte produces both branches and leaf-like structures (Bell and Hemsley, 2000; reviewed in Langdale, 2008). Lycopodiophytes have evolved leaves independently as
39 39 microphylls, structures believed to derive from a single determinate spike or branch and containing only one vascular strand (Tomescu, 2009). Branching in lycopodiophytes, which develop the sporophyte shoot from a meristem of much less complexity than that of angiosperms (frequently a single apical cell) is generally described as occurring only through bifurcation of the shoot tip (Bell and Hemsley, but see Chapter 4). Megaphylls are thought to have developed from branches produced by these bifurcations, an idea known as Zimmerman s telome theory. There are three important stages in the telome theory of evolution of branch to leaf: overtopping, or the establishment of dominance of one branch over the other and of determinacy in the overtopped branch; planation, in which subsequent branching of the subordinate branch become flattened into a single plane; and the webbing that produces a laminar structure (Willis and McElwain, 2002; Beerling and Fleming, 2007). However the evolution of megaphylls has occurred at least twice within the euphyllophytes or true leaved plants ferns and seed plants and in the case of ferns many aspects of the frond indicate that it retains shoot-like characteristics of iterative development (Tomescu, 2009; Sanders et al., 2011). Nevertheless, very similar developmental modules have been co-opted to regulate the development of all leaves, even where they have evolved separately in different lineages from different origins. The interaction between KNOX genes and their downregulation by ARP TFs is required in the development of determinate leaf structures in all vascular plants (Beerling and Fleming, 2007; Dolan, 2009; Hay and Tsiantis, 2010). The KNOX/ARP interaction, key to the distinction between determinacy and indeterminacy, including in the specification of AMes in angiosperms, may have evolved from controlling meristem bifurcation in the ferns and lycopodiophytes (Harrison et al., 2005) but there is no ARP orthologue in moss, which shows no branching in the sporophyte (Floyd and Bowman, 2006) and these factors do not control the processes of branching and leaf formation in fern or moss gametophytes (Sano et al., 2005). This is despite the presence of a leafy, almost shoot-like structure, the gametophore, in the gametophyte of the model moss Physcomitrella patens, but the absence of branching or leaf production in the sporophyte (Sakakibara et al., 2008). The class III HD-ZIP TFs like REVOLUTA that govern leaf specification and vascularisation betray a different origin for microphylls, as
40 40 they do not act in the same manner in lycopodiophytes as they do in angiosperm megaphylls, but nevertheless they are still involved in similar processes (Floyd and Bowman, 2006). The role of auxin seems likely to be conserved in many aspects of leaf development, as local auxin accumulation is involved in the specification of the future leaf primordium and vasculature formation in seed plants, both processes with conserved components in leaves between angiosperms to lycopodiophytes. Even the maintenance of dominance of one meristem over another by auxin signalling and polar auxin transport, known in some angiosperms and gymnosperms, may be conserved in apical dominance in some ferns, if not all (Croxdale, 1976; Pilate et al., 1989). Auxin signalling components are present and active in moss development, including in the production of root-hair-like rhizoids, suggesting that the actions of auxin maxima may be universal in land plant development (Poli et al., 2003; Eklund et al., 2010; Jang et al., 2011; De Smet et al., 2011). Whether the conserved aspects of auxin signalling extend to auxin polar transport in moss, and particularly whether it is present in both sporophyte and the dominant gametophyte generation, is still a matter for contention. It has been reported that active (i.e. effected by known inhibitors) auxin transport is present in the sporophyte of mosses and liverworts, and that auxin is important to the axial growth of sporophytes in all three bryophyte groups (Poli et al., 2003; Fujita et al., 2008). Fujita et al. in the same study also found that the gametophyte lacked PAT. However, previously an auxin transport mechanism has been reported in moss gametophytes, particularly the rhizoids (Rose et al., 1983; Rose and Bopp, 1983) and the presence of a spatial mismatch in auxin production and reception in developing rhizoids has been more recently reported, perhaps supporting Rose et al. s findings (Eklund et al., 2010). Mosses do possess orthologues of PIN proteins, but these belong to the PIN5 clade that in angiosperms is localised to the endoplasmic reticulum rather than the plasma membrane and regulates intracellular auxin homeostasis, not intercellular transport, and this may be the role of PINs in mosses too (Mravec et al., 2009; De Smet et al., 2011). Axillary meristems themselves then are foreshadowed by some of the
41 41 components that mediate their control, specifically polar auxin transport and its regulation of development, and meristem specification. Dormant meristems in the shoot are also present in gymnosperms, ferns and lycopodiophytes and in all three repression of outgrowth has been associated with auxin to some degree (Wochok and Sussex, 1975; White and Turner, 1995; Cline et al., 2006). The question arises whether SLs, as auxin second messenger s, are also present. 1.4 Evolution of strigolactones The presence of a strigolactone control of axillary branching seems well conserved in the angiosperms, with active pathways reported in Arabidopsis, rice, pea and petunia (Table 1-1). However strigolactones are involved in several aspects of plant physiology, and their involvement in mycorrhizal symbiosis in particular may well predate the evolution of axillary meristems. Fossil evidence shows that mycorrhizal symbioses arose at least 460 million years ago, before the evolution of vascular plants, and these symbioses are believed to be among the key adaptations that allowed the land-plant radiation, as they are widespread and frequent throughout all land plant taxa (Wang and Qiu, 2006; Parniske, 2008). The roles of SLs in other parts of plant development may represent the co-option of this substance, which was already produced on nutrient limitation, to a more general role in coordinating developmental responses to that limitation. However, the ancestral role could have equally been developmental, and the mycorrhizal connection a later adaptation. Most extant moss species lack AMy symbioses (Wang and Qiu, 2006) but the moss Physcomitrella patens, the genome of which has been fully sequenced, contains orthologues to CCDs 7 and 8 and MAX2. Physcomitrella has been found to exude several SLs, and when SL biosynthesis mutants were generated by knock-out of the moss PpCCD8 orthologue, the resulting plants had increased branching and extended colony growth, which could be rescued by addition of GR24 (Proust et al., 2011). In Physcomitrella SLs also seem to act like a quorum-sensing signal, limiting growth of not only the original colony but also surrounding ones (Proust et al., 2011). Whether this reflects an ancestral role of colony growth coordination, or one derived during the more than four million years since the emergence of the moss lineage, is a fascinating question. The important role which SL biosynthesis and signalling play in plant
42 42 growth and development, at least, appears to be conserved, arguing that this could be conserved in all land plant groups, and making their evolution of great scientific interest for the understanding of plant hormone evolution. Two particularly interesting points in the evolution of strigolactones were identified as the involvement of MAX1 and D27. D27 was noted to be of interest in that, like D14, it is present in duplicate conserved clades in the angiosperms, that appear to have arisen during land plant evolution. These sister clades are also separated by long branch lengths suggesting that different selection pressures have driven divergence. However, the involvement of MAX1 in particular was even more interesting. Despite being present and active in Arabidopsis as a single copy gene, max1 mutants remain unreported in other species studied. This may well be due to redundancy, as homology searches in rice have revealed five possible orthologues (Umehara et al., 2010), two are present in Medicago truncatula, and at least two are believed to be present in pea (Gomez-Roldan et al., 2008). Indeed, orthologues are present in all plant genomes searched, frequently in multiple copies in the angiosperms, with the notable exception of moss Physcomitrella patens (see Figure 1-7 for a phylogeny of MAX1 orthologues, Figure 1-6 for a comparable phylogeny of the taxa to which they belong). Nevertheless, orthologues of MAX2, MAX3 and MAX4 are all present in moss (and active, in the case of MAX4) and generally in all land plants searched (R. Challis, pers. comm.). Does the absence of a MAX1 in moss suggest its later incorporation into the strigolactone pathway, perhaps coincident with or causative for the development of a role in branching and function as a hormone? As the strigolactone biosynthesis pathway predates branching in the sporophyte generation, at what point did it become incorporated into branching control? The absence of MAX1 in other species with well-characterised pathways also raised the question of whether its function in the SL pathway is restricted to Arabidopsis and the non-mycorrhizal Brassicaceae group, perhaps due to the release of a symbiotic evolutionary constraint on the signalling molecule. Most particularly, as MAX1orthologues are present in other species, do they have conserved effects on the functioning of the SL pathway? This thesis aims to suggest answers some of these
43 43 questions, by investigating the role of MAX1 by complementation analysis, genetics and physiological analysis. 1.5 Aims This project focused on the complementation analysis of MAX1 orthologues from a variety of species, with the aim to dissect the influence of changes in biosynthetic enzymes on the pathway as a whole, and in particular to characterise the incorporation of MAX1 into the biosynthetic pathway (Chapter 3) and contribute to the understanding of its function in other angiosperms, previously undetermined (Chapter 5). In order to provide a context for genes used in complementation experiments that were derived from non-angiosperm species and groups, the role of strigolactones and the control of branching was also investigated in these species (Chapter 4). Finally, in the light of the recent characterisation in rice of D27 and its phylogenetic analysis, investigation of its role and that of its orthologue D27like in Arabidopsis was started, to compare this early evolutionary duplication with the later diversification of MAX1 (Chapter 6).
.")
44 44 MAX1 CCD7 CCD8 Figure 1-7. Maximum likelihood trees for loci involved in the MAX/strigolactone pathway, showing bootstrap support. Only clades corresponding to the orthologues known to be involved in branching are shown here (for D27 sister clades, see phylogeny in Chapter 6). Dicotyledons in green, monocotyledons in blue, nonangiosperms in black. Scale bar corresponds to 0.1 substitution per site. Kindly provided by Richard Challis. MAX2 D14 D27
45 45 Chapter 2. Methods and Materials 2.1 Definition of terms Nomenclature of duplicated genes The nomenclature used for genes believed to share descent or function is usually determined by their relationships to each other and to their origin. For example; homologous genes share descent, orthologous genes share a common ancestor and are separated by speciation; paralogous genes are related genes derived from duplication within a genome, and if the duplication were the result of whole genome duplication (WGD) these can be referred to as ohnologues or sometimes homoeologues. Definitions sometimes imply but usually don t require functional similarity. These examples are not exhaustive for more discussion of these terms see Koonin (2005). Many of these terms and their variants require knowledge of a gene s history, something not necessarily available, and sometimes also their function, the elucidation of which is the aim of this study. Therefore to save confusion and prevent homologuephobia, only two terms are used here. All genes that show sufficient sequence identity to MAX1 to have been classed as members of the CYP711 clan (and therefore presumed, even though unproven, to share descent) will herein be described as orthologues of AtMAX1. Paralogue is used to define the relationship of potential orthologues represented more than once in the same genome as each other, regardless of their duplication mechanism or function. Similar principles apply to D27, D27like and its orthologues, and others mentioned here Gene and protein naming conventions Gene names are given in italics, and their protein products are given in regular script. When referring to mutant alleles lower case is used, with the wild-type allele in upper case. As orthologues from a wide number of species are referred to, where available, gene identifiers from genome annotation
46 46 projects are provided, if the predicted sequences match well to the cdna sequences found here. 2.2 Molecular cloning techniques dh20 dh 2 O refers to water micro filtered through a Purelab Ultra lab water system (ELGA, Marlow, UK) and then autoclaved RNA extraction All plant material was ground in liquid N 2 to disrupt the material. For extraction from Arabidopsis thaliana, Oryza sativa root material, Medicago truncatula, Ceratopteris richardii and Selaginella moellendorffii the Qiagen RNeasy Plant Mini Kit was used, ( with all optional steps included, including the on-column DNaseI digestion. For extraction from Picea glauca and Oryza sativa shoot the method described by Azevedo et al. (2003) was used, adapted according to the amount of material being used, except for Q- PCR for Picea glauca. In this case RNA was further purified by starting from point 3 of the plant protocol for the RNeasy Plant Mini Kit (QIAGEN, 2010). RNA quantity and quality were assessed using a Nanodrop ND-1000 Spectrophotometer (Thermo Fisher Scientific), and occasionally by gel electrophoresis as well DNA extraction from plants For cloning For cloning and preparation of high quality plant DNA from Arabidopsis, the DNeasy Plant Mini Kit from Qiagen was used according to enclosed instructions. DNA quantity and quality were checked on the Nanodrop Spectrophotometer For genotyping For genotyping the quick protocol described by Edwards et al. (1991) was used to extract crude samples of genomic DNA.
47 cdna synthesis cdna was synthesised from purified total RNA using Superscript II M- MLV Reverse Transcriptase from Invitrogen ( Life Technologies, Carlsbad, CA, USA) according to manufacturer s instructions, using Oligo-d (T) (Invitrogen) as the non-specific primer, except for construction of RACE libraries and cloning Os06g from Oryza sativa. For cloning this gene, which has a GC-rich hairpin within the coding sequence, and for RACE an adaptation to the manufacturer s instructions for the incubation step was employed. This step is normally just a 50 minute incubation at 42 C with the enzyme, but in an adaption recommended by Dr Dörte Müller the incubation was changed to 40 minutes at 42 C, 10 minutes at 70 C, readdition of the enzyme and 20 minutes at 50 C. Typically 500ng of RNA was used as starting material for RTPCR, where RNA concentration allowed, and no less than 100ng was used for RT-PCR RACE 3 Rapid Amplification of cdna ends was used to confirm the stop codon position in Os01g , using the protocol as described by Scotto-Lavino et al. (2006) and reagents as described for cdna and PCR RACE 5 RACE was performed on Picea glauca RNA using the protocol described by Sambrook and Russell (2001) and reagents as described for cdna and PCR Sequencing Sanger sequencing was used to determine the sequences of RACE, and PCR products for cloning and to confirm the sequences of all constructs used to transform plants. Sequencing was performed by the Technology Facility of the University of York using an Applied Biosystems 3130XL machine using primers as described in Appendix A1, and the results analysed using Applied Biosystems Sequence Scanner Version 1.0 (Applied Biosystems, Life Technologies).
48 PCR Standard PCRs were used for a variety of purposes, including genotyping plants, cloning with degenerate primers, semi-quantitative reverse-transcription PCR (using gel electrophoresis to visualise differences in cdna quantity) to check expression of transgenes in Arabidopsis or Medicago genes in planta, and colony PCRs for bacterial colony selection. Sample mixes and programmes are given in Table 2-1, (although programmes were adjusted to primers, templates and purposes) and reagents used were from New England BioLabs Inc. (NEB, Massachusetts). Master mixes were used wherever possible. Reactions were carried out using an eppendorf Mastercycler ( with the recommended programme for PCR products of less than 6kb. The products were visualised using gel electrophoresis. Table 2-1. PCR conditions for standard PCR Experiment: Genotyping plants Semi-quantitative RTPCR Colony PCR Thermopol buffer 2μl 2μl 1μl 2mM dntps 2μl 2μl 1μl 10mM each primer 1μl 1μl 0.5μl Taq DNA polymerase (5U/µl) 0.05μl 0.1μl 0.05μl Template 2μl genomic DNA diluted x2 2μl cdna diluted x4 Colony stab Final volume made up with dh 2 O 20μl 20μl 10μl
49 49 Initial denaturing 94 C 2 minutes 94 C 2 minutes 94 C 2 minutes Cycle denaturing 94 C 20s 94 C 30s 94 C 20s Cycle annealing Primer Tm 20s Primer Tm 30s Primer Tm 20s Cycle elongation 72 C 30s-1min 72 C 30s 72 C 30s-1min Number of cycles Final elongation 72 C 5minutes 72 C 10 minutes 72 C 5 minutes Table 2-1. PCR conditions for standard PCR (programme) Error-free PCR Both proof-reading polymerases PfuTurbo (Stratagene, Agilent Technologies, Santa Clara, California) or Pfu (Promega Corporation, Madison, Wisconsin) were used for error-free PCR for cloning, with the Promega product used for more difficult templates but the Stratagene enzyme for more robust amplification, with mixes and programmes as described in Table 2-2. For templates with a high GC content or low expression, particularly those from Oryza sativa, 50mM MgCl 2 was added at 1µl to 50µl mix to bring the final concentration of free Mg 2+ to 3mM, and 10% dimethylsulphoxide (DMSO) for a final concentration of 4%. Reactions were carried out using an eppendorf Mastercycler ( with the recommended programme for PCR products of less than 6kb. PCR products were then assessed by gel electrophoresis, and for difficult templates (for example, SmMAX1, Os01g and Os06g ) the required band was cut out and 1µl from the gel used as template for a further cycles.
50 50 Table 2-2. PCR reaction mixes and programmes for error-free PCR Enzyme: PfuTurbo (Stratagene) Pfu (Promega) Buffer 5μl 10x cloned Pfu reaction buffer (Stratagene) 5μl 10x Pfu reaction buffer (Promega) 2mM dntps 5μl 5μl 10mM each primer 2.5μl 2.5μl DNA polymerase 1μl 2.5U/µl PfuTurbo 0.4µl 2.5U/µl Pfu Template 0.5-4μl cdna (undiluted, ~20-50ng) 0.5-4μl cdna (undiluted, ~20-50ng) Final volume made up with dh 2 O 50μl 50μl Initial denaturing 95 C 2 minutes 95 C 2 minutes Add Pfu hotstart N/A Yes Cycle denaturing 95 C 2 minutes 9 C 2 minutes Cycle annealing Primer Tm 25s Primer Tm 25s Cycle elongation 72 C 30s-1min 72 C 2min/kb Number of cycles Final elongation 72 C 10 minutes 72 C 10 minutes Gel electrophoresis Gel electrophoresis was carried out using gels made from 0.8 3% molecular grade agarose (Sigma Aldrich Corporation, USA) dissolved in 1 x - TBE (0.445M Tris-borate, 10mM EDTA, ph 8) and run in gel tanks (Flowgen, Nottingham) at 2-6V/cm. 1-2μl of SYBRSafe dye (Invitrogen) was added per
51 51 100ml of gel, and visualisation carried out with a SafeImager TM (Invitrogen), photographed and analysed with GeneSnap TM software (Syngene, Biocon, Bengaluru, India). Purification from electrophoresis gels and PCR mixes was carried out using the illustra GFX PCR DNA and Gel Band Purification Kit from GE Healthcare (Amersham) according to manufacturer s instructions PCR Primers Primers were designed by eye by the author with the assistance of the web based oligonucleotide programs provided by NCBI (Primer Blast and Integrated DNA Technologies Ltd (OligoAnalyzer, eu.idtdna.com/analyzer/applications/oligoanalyzer/), except where designed or gifted by others, as noted in Appendix A1. Primers were synthesised by Sigma-Aldrich Corporation (USA) Q-PCR Q-PCR was performed on an ABI 7000 QPCR machine (Applied Biosystems) and analysed with the corresponding software. Primers were tested by producing standard curves based on a sequence of 20ng/μl, 2ng/μl, 0.2ng/μl and 0.02ng/μl purified single-stranded cdna from a tissue presumed to be highly expressing the tested gene, and on the dissociation curves. Reaction mixes used were: 5μl cdna from a total of 500ng, 250ng or 125ng total RNA depending on sample concentration, 12.5μl SYBR Green I dye (using the ROX internal passive reference dye, Applied Biosystems), and 5.5μl of a 2mM mix of the primers. Master mixes were always used. Primers used are listed in Appendix A1 and were designed using Primer Express v3.0 (Applied Biosystems). cdna for Q-PCR was prepared as described above, and for standard curves was purified using the illustra GFX kit described in Section and quantified by Nanodrop TM Restriction digestion Restriction digests were carried out using restriction enzymes (NEB) with appropriate buffers. A typical digest mix would be:
52 52 2µl 10x reaction buffer (appropriate buffer chosen from NEB double digest recommendation) 1µg (at ng/μl) DNA 0.2µl 100x BSA if required 1µl Restriction enzyme 1 (NEB) (typically 5-20 units) 1µl Restriction enzyme 2 (NEB) (if required) Distilled, autoclaved water to 20µl Master mixes were used where possible. Reactions were incubated at 37 C or 28 C as appropriate for 1 hour, and subsequently for single enzyme digests of vectors, 1µl of 5U/µl Antarctic phosphatase (NEB) was added, mixed in, and the reaction mixture was incubated at 37 C for a further 15 minutes. Reactions were heat inactivated for 20 minutes at 65 C or 80 C, as appropriate. Digests were analysed by gel electrophoresis and bands cut out and purified as described above Ligation Ligations were carried out using vector: insert ratios of 4:1, 3:1 or 2:1, depending on insert size and vector determined using the following calculation: Insert fragment (ng) = [Vector fragment (ng)] x [Insert fragment (bp)] [Vector fragment size (bp)] These were added to the following mix: 2µl 10x reaction buffer (NEB) ng Insert DNA (typical amount) 50ng Vector DNA (typical amount) 1µl 400U/µl T4 DNA ligase (NEB) Distilled, autoclaved water to 20µl The reactions were then incubated for ~24 hours at 14 C, and 10µl of the reaction was used immediately for transformation of E. coli or stored at -20 C in case of transformation failure.
53 53 Where amenable (i.e. for ligations where the final vector construct sums to less than 10 Mb, both vector and fragment are available in high concentration, and restriction digest was used) a variation was used adapted from a protocol designed by Michael Koelle (pers. comm.) in which digested fragments or blunt end PCR products were run on low-melt gels in 0.75 x TAE (Tris-Acetate EDTA) buffer in a 4 C room (to prevent the gel melting). DNA bands were visualised, cut from the gel, and melted in a 70 C heating block. 5μl vector band and 10μl insert band were then mixed quickly with 2μl dh 2 O and 2μl T4 ligase buffer, placed on ice for 1 minute, and 1μ T4 DNA ligase enzyme was added, thoroughly mixed, left on ice for a further minute and then incubated for ~24 hours at 14 C. For E. coli transformation, the reactions were melted at 70 C again, diluted with 80μl 0.1M Tris-HCl ph7.3, placed on ice to cool for a few seconds and then 10µl of the reaction was quickly mixed with E. coli cells and transformed as normal Cloning from PCR products For products produced by standard PCR the Original TA Cloning Kit from Invitrogen was used to clone PCR fragments from standard PCR for sequencing. For products produced by error-free PCR for cloning the Zero- Blunt TOPO Cloning Kit (also Invitrogen) was used as detailed in Appendix A2. Both were used as per manufacturer s instructions. 2.3 Bioinformatics Orthologue identification Orthologues of MAX1 identified by the author were found by reciprocal BLAST searches using protein sequences of AtMAX1, SmMAX1 and when identified PgMAX1 against translated nucleotide sequences from different nucleotide sequence collections and different plant taxa on the NCBI and Phytozome websites (Goodstein et al., 2012; NCBI) Coding sequence prediction Coding sequences for Medicago, rice and Selaginella were taken from their GenBank or TAIR curated predictions, except where these conflicted with
54 54 known MAX1 gene structure. For these, GeneMark-E* at (Lomsadze et al., 2005) was used to predict a more likely sequence from genomic sequence surrounding the orthologue. Primers were designed against the longest open reading frame, and sequences were confirmed from the resulting clones, except for the stop codon of Os01g , which was confirmed by 3 RACE as above. Coding sequence for PgMAX1 was identified from cdna by using 5 RACE based on a resequenced clone from the Arborea project (see Appendix A1 for primer sequence details) Alignments Alignments were produced by Neighbour-Joining algorithm in Clustal X (Larkin et al., 2007) and alignments edited and consensus sequences produced in BioEdit (Hall, 1999). 2.4 Constructs Overexpression constructs All overexpression constructs using the CaMV 35S promoter were created in the part7 binary vector as described by Gleave (1992), including those donated by Dr Sally Ward. Cloning strategies varied for each gene due to differences in the ease of amplifying full-length coding sequences details are provided in Appendix A Pre-transcriptional repression construct An adapted version of the pfgc5941 vector (Kerschen et al., 2004), kindly donated by Dr Louise Jones lab, in which a constitutive NOS promoter drives an inverted repeat of the CaMV 35S promoter was further adapted to drive an inverted repeat of 426bp of the AtD27like (At1g64680) promoter from +12 to of the transcriptional start site, by sequentially excising each CaMV 35S repeat and religating with the AtD27like promoter PCR fragment, into which appropriate restriction digest sites had been designed for directional cloning.
55 Production of Transgenic Organisms Bacterial selection and growth Plates (Petri dishes, Sterilin, ThermoFisher Scientific) were made from LB supplemented with 1% sucrose and 0.8% agar, autoclaved, and after cooling antibiotics were added from stock solutions of 1000 times working concentration added at 1:1000 dilution. Stock solutions were as follows, and filter sterilised: 50mg/µl Kanamycin monophosphate, in dh 2 O 50mg/µl Carbenocillin, in dh 2 O 100mg/µl Streptomycin, in dh 2 O 50mg/µl Gentomycin, in dh 2 O For blue/white selection of colonies (used for part27), 5-bromo-4-chloro- 3-indolyl-β-D-galactopyranoside (X-gal) was added at 40μg/ml final concentration to the medium in the same way as the antibiotics. 40µl 100mM Isopropyl β-d-1-thiogalactopyranoside (IPTG) was spread on the top of plates just before plating of the bacteria. Bacterial growth plates were grown in incubators. E. coli were grown at 37 C overnight, and A. tumefaciens at 28 C for 2-3 days Colony selection and plasmid preparation After growth on plates colonies were picked into a half-size standard PCR with primers specific for the insert or plasmid, and the results of the PCR used to select colonies. Colonies of E. coli were grown in liquid LB culture overnight and plasmids purified using a Spin Miniprep Kit (QIAGEN), and DNA quantity and quality checked on the Nanodrop Spectrophotometer Escherichia coli transformation Aliquots of 100µl E. coli DH5α were prepared using the method of Inoue et al. as described by Sambrook and Russell (2001) and stored at -80 C. For transformations, aliquots were placed on ice until they thawed, then for transformation of ligations as described above, 50µl of cells was mixed with 10µl of ligation mix, but for subcloning reactions, as above, 3µl ligation was
56 56 added to 50µl cells. The mix was then left on ice for 15 minutes, heat shocked at 42 C for 30 seconds and returned to ice for 2 minutes. 250µl liquid LB was added to each transformation and they were shaken at 37 C for 40 minutes, before being spread on LB plates containing the appropriate antibiotic Agrobacterium tumefaciens transformation Chemically competent Agrobacterium tumefaciens GV3101 were prepared and transformed by a method modified from Höfgen and Willmitzer (1988). A single-colony from an LB plate was used to inoculate 5ml LB containing gentamycin, which was cultured overnight at 28 C and 250rpm shaking, and then in turn used to inoculate 200ml LB with gentamycin. This culture was incubated for 3-4 hours at 28 C and shaking, before cells were pelleted at 3000g for 20 minutes at 4 C. The supernatant was discarded and cells were washed in 10ml Tris-EDTA buffer at 4 C. Cells were then recentrifuged, resuspended in 20ml LB, and flash frozen in aliquots then stored at -80C. For transformation 50μl aliquots were left to thaw on ice, 0.2-1µg of the part27 binary vector plasmid stirred into the aliquot, left on ice for a further 5-10 minutes, flash frozen (cold shocked) in LN 2 for 3-5 minutes, placed in a 37 C water bath for 5 minutes, then 500μl LB was added and cells were incubated at 28 C with shaking at 250rpm. 250μl were then spread on LB plates containing gentamycin and the appropriate antibiotic for the plasmid, and incubated at 28 C for two days Plant transformation Transformation was performed using the floral dip method, adapted from Clough and Bent (1998). Arabidopsis thaliana of the appropriate genotype were grown at 2 plant per pot density on soil in long day conditions or for four weeks short day conditions followed by long day conditions until the first siliques had reached maturity. Agrobacterium tumefaciens was prepared by picking transformed colonies into 10ml LB media containing gentamycin and the plasmid-specific antibiotic, and incubated with shaking at 250 rpm overnight at 28 C. Of this 10ml, 0.9ml was added to 0.9ml 30% glycerol and flash frozen in liquid N 2 for storage, and 5ml was used to inoculate 400ml of LB with
57 57 antibiotics and incubated as before. Half an hour before transformation, 100ml of fresh LB, 5g of sucrose and 20μl of Triton-1000X were added to the culture, which was returned to the incubator until dipping. Inflorescences were dipped in the culture for approximately 1 minute, and plants returned to the greenhouse in clear plastic bags over night. The following day the bags were removed and plants were allowed to set seed Arabidopsis transgenic selection and establishment of transgenic lines Transgenic plants were selected by growing seed on ATS plates supplemented with 1% sucrose and 0.8% agar and antibiotics added as for bacterial plates. Stock solutions were as follows: 50mg/ µl Kanamycin monophosphate, in dh 2 O 50mg/ µl phosphinothricin (Basta, Bayer CropScience) in dh 2 O 12mg/ µl Sulphadiazine, in dh 2 O For the T 1 generation Basta resistant plants were also selected by growth on soil and watering with Basta at 1 and 3 weeks old. To establish stably transformed lines of Arabidopsis, T 1 seed was screened and resistant plants were selected, numbered and allowed to self-fertilise. Seed was collected from these individual plants and the seed screened on plates to check for a 3:1 antibiotic resistant: sensitive segregation, which should indicate a single successful insertion event. For each single insertion T 1 plant 10 resistant T 2 progeny were transferred to soil, numbered, allowed to self and the seed collected. This seed was screened for 100% resistance to discover which parent was homozygous, and for homozygous T 2 plants expression of the transgene in pools of 10 x 10 day old seedlings was tested by semi-quantitative RTPCR. For max1-1 complemented plants, homozygosity of the max1-1 allele was also checked by use of an Enkheim CAPS marker that segregates with the max1-1 mutant mutation details of this and RTPCR primers are in Appendix A1 and A2. T 3 progeny of T 2 plants homozygous for max1-1, the transgene and with good expression of the transgene were selected for phenotyping.
58 Plant growth and experimentation Plant material Arabidopsis thaliana (L.) Heynh. (Arabidopsis). All seeds and lines except AtD27 RNAi 2-1 and 1-12 were sourced from the Leyser group stocks at the University of York. AtD27 RNAi 2-1 and 1-12 were the gift of Dr Yonghong Wang at the Institute of Genetics and Developmental Biology, Beijing. Other lines used were as follows: Ecotype Columbia-0 (Col-0, wild type). Mutants: max1-1 (EMS point mutation in the Enkheim background, backcrossed 7 times to Columbia-0), max2-1 (EMS mutation, Columbia-0) and double mutant max1-1 max2-1 all described by Stirnberg et al. (2002), max3-9, an EMS mutant (Booker et al., 2004), max4-1, a T-DNA mutant (Sorefan et al., 2003), Atd27-1, a T-DNA mutant (GK134E08) from the GABI-Kat collection (Rosso et al., 2003) and described here (Chapter 6). Transgenic lines: 35S::AtMAX2 max1-1, a MAX2 overexpression line in the max1-1 background (Stirnberg et al., 2007) 35S::AtMAX1 max1-1 and 35S::SvMAX2 max2-1, overexpression lines for MAX1 from A. thaliana and a MAX2 orthologue from willow (Salix viminalis) in the max1-1 and max2-1 backgrounds respectively, both made by Dr Sally Ward. All Arabidopsis transgenics and mutants are in the Col-0 background except where otherwise stated.
59 59 Other species: Ceratopteris richardii Brongn. (cfern). Spores of homozygous wildtype diploid line Hn-n. (Scott and Hickok, 1987) kindly provided by Dr Heather Sanders, University of Oxford, along with much kind advice on their care. Medicago truncatula Gaertn. (barrel medic, Medicago). Accessions Jemalong A17 and R108 kindly provided by Dr Michael Schulze, and ParaggioF by Dr Céline Mouchel, both of the University of York. Oryza sativa L. spp. japonica cultivar Nipponbare rice seedlings were kindly donated by Prof. Dale Sanders group at the University of York. Picea glauca (Moench) Voss (white spruce). - RNA for the cloning of PgMAX1 was from adult needles of clone WS 1062 at Glencorse clone bank site, UK Forestry Commission Northern Research Centre, Roslin, Scotland (Thanks to Joan Cottrell and Rob Sykes at the UK Forestry Commission). - Seeds for experimentation were half-sibling family lots F and F from the Tree Seed Centre, with thanks to Dave Kolotelo and Spencer Reitenbach of the Tree Seed Centre, Ministry of Forests, Lands and Natural Resources Operations and Tim Lee of the Vernon Seed Orchard Company, both of British Columbia, Canada. Selaginella kraussiana (Kunze) A.Braun, (Krauss spikemoss). Cuttings kindly provided by Dr Younousse Saidi and Susan Bradshaw, University of Birmingham. Selaginella moellendorffii Hieron. (gemmiferous spikemoss). Bulbils from Plants Delight (sequenced genotype) kindly provided by Prof. Jo Ann Banks, Purdue University, USA.
60 Growing conditions All plants were grown in one of 3 growth rooms or chambers as described below, and watered when necessary by the Horticultural Technicians of the University of York. Greenhouse: natural light supplemented with artificial light to provide long day (16 hours light) conditions at ~150 μmol m -2 s -1. Temperatures between C. Growth room: - Long day 16 hours light, 8 hours dark, temperatures C day, C night, light intensity ~ μmol m -2 s Short day - 8 hours light, 16 hours dark, temperatures C day, C night, light intensity ~80 μmol m -2 s Warm growth room long day light conditions, but temperatures at 24 C day, C night, ~120 μmol m -2 s -1. Percival growth cabinet: short day conditions (8 hours light, 16 hours dark) light intensity ~80 μmol m -2 s -1, temperatures 20 C day, 18 C night Hormone treatments GR-24 was supplied by LeadGen Labs LLC as an equal mix of diastereomers, and dissolved in 100% acetone to make a 10mM stock kept at -80 C. β-napthoxyacetic acid (NAA) and indole-3-acetic acid (IAA; heteroauxin) were supplied by Sigma Aldrich Corporation and dissolved in 100% ethanol to make a 10mM and 200mM stocks respectively kept at -20 C. Unless otherwise stated, all controls in treatments involving hormones were mock treated with the carrier.
61 Arabidopsis Growth media Arabidopsis plants were grown on F2 compost pre-treated with Intercept (both Levington Horticulture, Ipswich, UK) in trays supplied by Desch Plantpak (Maldon, UK). P40 4cm pot trays were used except where noted otherwise. When grown on plates seeds were sterilised as described below and grown on Arabidopsis Thaliana Salts (Lincoln et al., 1990) solidified with 0.8% agar and supplemented with 1% sucrose Seed sterilisation Arabidopsis seeds were sterilised by one of two methods: - Wet method: Up to 2000 seeds in a 1.5ml microcentrifuge tube were shaken in 500µl of 70% ethanol for 1 minute. The ethanol was removed and replaced by 500µl 10% NaClO with 0.01% Triton- 1000X (Sigma Aldrich Corporation). This was shaken for 8 minutes for seeds used in analytical experiments, 15 minutes for resistance selections. Seeds were rinsed by three washes with dh 2 O, and spread on plates in either water or ATS with 0.05% agar. - Dry/gas method: Up to 100mg of seed in open microcentrifuge tubes, were placed in a sealed box containing chlorine gas. This was left for 2 hours for seed to be used for experimental purposes, 3 hours for seed only being selected for resistance (e.g. T 1 or T 2 seed). For larger volumes of seed Petri dishes (Sterilin ) with lids half closed were used instead of tubes Dose response for GR24 Plants were grown in 500ml Weck Jars (Weck, Germany) on ATS medium, 1% sucrose, 0.8% agar, as described by Crawford et al. (2010). Stock solutions of 1000 times working concentration GR24 dissolved in acetone was added at 1:1000 dilution to cooled autoclaved medium. 50ml medium was used per jar, and 7 equally spaced seeds were added per jar in sterile conditions. Seeds were sterilised with the wet method (described above) and then stratified for 2 days at
62 62 4 C prior to planting. Jars were kept in long-day growth room and were randomised once a week. Rosette branches were scored when bolts had reached the top of the jar and the first siliques had been formed (approximately four-five weeks post germination). Branches were scored as growing out when visible to the naked eye. Treatments and genotypes were colour-coded to blind the test and prevent bias Short day branching assay Following and adapting from Greb et al. (2003), seeds were stratified for 2 days at 4 C, and grown on soil in the Percival short day condition cabinet for 28 days, then moved to long day conditions in the greenhouse. Plants were grown in blocks of 10 plants which were randomised once every 1-2 weeks. When bolts of a 10 plant block reached 10-15cm, they were decapitated, and branches longer than 0.5cm were counted 10 days after decapitation Long day branching assay Seeds were stratified for 2 days at 4 C, and grown on soil in long day conditions in the greenhouse for approximately 6 weeks until the primary inflorescence stem had ceased flowering, at which point rosette branches longer than 0.5cm were scored Leaf phenotyping Seeds were stratified for 2 days at 4 C, and grown on soil in P24 trays in the greenhouse for 5 weeks or, for the experiments described in Chapter for 6 weeks. Leaves were processed as described in Weight et al. (2008) and Keiffer et al. (2011); cotyledons and adult rosette leaves were removed in phyllotaxic sequence and laid on acetate sheets, pressed within book leaves and scanned using a Scanjet 4370 scanner (Hewlett-Packard, at 300 dpi resolution. Pictures were saved as.tif and analysed with LeafAnalyser (Weight et al., 2008). Leaf nodes and tips were corrected by hand, and the coordinates produced by LeafAnalyser were Procrustes fitted using MorphoJ (Klingenberg, 2011) which also produced the centroid size data. LeafAnalyser was then used to produce a PCA eigenvector matrix from a library of 1500 leaves from ten natural Arabidopsis accessions produced by Vera Matser
63 63 (Kieffer et al., 2011) and Procrustes-fitted by Joe Vaughan of Dr Richard Waites group at the University of York. The eigenvector matrix was used to calculate leaf point models scaled to the standard deviations of the natural accession database, using a program written in Python provided by Joe Vaughan and adapted by the author. These leaf point models form the data presented Medicago Seeds for the Q-PCR experiment were removed from pods and scarified by rubbing with sandpaper, then planted in 4cm pots on 50:50 mix of sand and terra-green (Oil-Dri Corporation, Illinois, USA), and fertilised once a fortnight (start of week one, week three and week five) with Phostrogen All Purpose Plant Food (Bayer Garden, Bayer AG, Germany). Plants were grown in the green house for five weeks before harvesting, and tissues cut with razor blades as shown in Figure 5-6 before flash freezing in LN White Spruce Seeds were stratified by placing on damp filter paper (Whatman, GE Healthcare as above), in the dark at 4 C for one week. Plants were then grown in 8cm square pots (Plantpak) on a 50:50 mix of F2 compost (as above) and vermiculite (William Sinclair Holdings Plc., Lincoln, UK) treated with Intercept (as above), at a density of 1-3 plants per pot (>90% of plants were in 1- or 2- plant pots) Excised bud assay Half-strength Murashige & Skoog (MS) (1962) medium with Nitsche s vitamins (DUCHEFA Biochemie B.V., Haarlem, The Netherlands), 2% sucrose and 0. 2-(N-morpholino) ethanesulfonic acid (MES) buffer was corrected to ph6.5 with 1M KOH was jellified with 0.8% technical agar, autoclaved and 50ml added into 10cm square tissue culture plates (Sterilin). Plates were injected with 1mM IAA or carrier and/or 1mM GR24 or carrier at 1μl per ml. Plates were then left overnight at 4 C to equilibrate. Agar was then cut and arranged to produce plates with a thin central section containing no agar, and 3 plates per treatment as follows: control apical/control basal, 1μM IAA
64 64 apical/control basal, 1μM IAA apical/1μm GR24 basal. Sections of stem with one visible dormant axillary bud were cut from 3 month old greenhouse grown plants, surface sterilised in 2% NaClO for 20 minutes, washed 3 times in dh 2 O and fitted between the agar blocks. Plates were placed vertically in the long day growth room and photographed every 2-3 days Initial decapitation assay Four month old seedlings of lot F ( F 21 ) grown in the greenhouse and with dormant apical buds were decapitated (or left whole in the control experiment). 50μl of 200mM IAA or ethanol carrier was mixed in 1ml liquid lanolin to final concentration of 10μM, and a small dab added to the cut surface of the plants. 10μl of 5μM GR24 in a dh 2 O based mixture of 5% acetone, 4% polyethylene glycol and 25% ethanol was added to the lowest point of the stem at which needles started once every three days for one month. Photographs were taken of each plant at each dosing time point to record any outgrowth SEM 1 year old seedlings of F 21 grown in the greenhouse were decapitated below actively growing apices and left for two weeks. After two weeks plants were inspected visually for outgrowth, photographed and then sections of stem cut and dropped into water. Sections were fixed in 2% glutaraldehyde and 0.05M NaPO 4 ph7.2 phosphate buffer for 48 hours, initially using vacuum infiltration and <0.01% Triton-X1000 to assist sinking. Sections were then washed in phosphate buffer twice for 30 minutes each before being dehydrated in an acetone series of 25%, 50%, 70%, 90% and 3 x 100% washes of 30 minutes, with the final wash continuing overnight followed by drying in a critical point drier. The samples were gold-coated and visualised on a JEOL 6490LV SEM Long-term GR24 dosing experiment Plants of lot F 21 (90 seeds, 1 st replicate, nd two replicates) were germinated and allowed to grow in the short day growth room for two months (except for the April replicate, which spent an extra month in these conditions)
65 65 at which time all apical meristems had formed bud scales, before moving to the greenhouse. After 3 weeks all but 3 of ~60 plants had reactivated growth, and at this point dosing with 100μl of 0, 1 or 10μM final concentration GR24 in 1% acetone in dh 2 O was started, with each treatment being balanced for pots with 1 or 2 plants. Doses were applied to the soil at the stem base. Dosing was done approximately every 8 days, at which time several measurements were taken in the first replicate plant height from the base of the needles (the point at which the cotyledons were formed), number of axillary buds, bud scale formation/activity of apical and axillary buds, and the leaf number subtending the axillary buds (i.e. their position). In the second two replicates only the activity of individual buds (apical and axillary) was recorded as no hint of a difference was seen in the other measures, whereas a possible promotion effect had been seen by addition of 1μM GR24 on apical activity times Apical dormancy experiment 120 seeds per replicate of lot F 21 were germinated in the warm (24 C), long day growth room and after one month, at which point plants had started to produce axillary buds, they were moved to the cooler, short day growth room to induce dormancy, from which time they were dosed with 0 and 1μM GR24 as for the long-term experiment, but at weekly intervals and formation of apical buds measured once a week until all plants had ceased apical growth Decapitation experiment Plants were left in short day conditions for 131 days (just over 3 months) and then returned to the warm growth room. After 2 weeks 80% of the first replicate, 64% of the second replicate and 33% of the third replicate had reactivated apically and several had also actively growing branches. Plants were either decapitated by removal of the apical bud or all the apical growth since this reactivation, or left whole, and dosed once a week with 5ml of 0 or 10μM final concentration GR24 at 1/1000 dilution to each pot, to ensure delivery of the hormone to the roots. The time of bud break of each axillary bud was then measured over three weeks, scoring once every 3 days.
66 Q-PCR experiment 1 high/low phosphate Plants from lot F were stratified as above, germinated on filter paper for 1-4 days, and then grown in individual 4cm pots on 50:50 mix of sand and terragreen (as for Medicago) fertilised once a week with 10ml half-strength Murashige & Skoog (MS) (1962) liquid medium. The medium was corrected to ph with 1M NaOH and autoclaved before use. Plants were grown for 2 weeks supplemented with standard medium at 10ml, then the medium supplement was added at 20ml for a further 4 weeks at which point some had produced axillary buds. Before dosing on the 7 th week pots were washed by adding 20ml dh 2 O and letting it drain through three times. Then plants were fertilised as before, but with media in which 0.625mM of KCL was substituted for the 0.625mM KH 2 PO 4 ( no-phosphate medium ). After a week, three plants were dissected into roots, shoots (all tissue above the cotyledons) and hypocotyl (between roots and shoots ) and the tissues pooled and flash frozen in LN 2. The remaining plants were split into two groups (balanced to have the same number of plants with the same number of axillary buds). Half were dosed with standard media, and the other half with the no-phosphate medium. After a further week plants were dissected and flash frozen as before. RNA was extracted as recorded above Q-PCR experiment 2 high/low phosphate with or without GR24 Plants of lot F 21 were grown as described for the first Q-PCR experiment but supplemented with 20ml standard medium for the first three weeks, and then moved carefully to new pots of sand and terragreen supplemented with 20ml of no-phosphate medium once a week for 5 weeks. At that point, acetone carrier control was added to the medium at 1/100 concentration. After a week, plants were harvested as described above. For the first replicate plants were divided in half (only 8 plants were available) and one half were treated with standard medium with carrier control, and the second half with standard medium and 1μM GR24. In the second experiment only 4 plants survived at all. In the third experiment plants were split into four groups, with all four combinations of no phosphate/standard medium and GR24/carrier control. After one week plants were harvested as before.
67 Selaginella kraussiana Cuttings to be used in experiments were grown 50:50 F2 and vermiculite mix in the long day growth room in P1 or P15 trays with lids maintained in standing water, and shaded with 0.4 neutral density filters (Lee Filters, Andover, Hampshire). For growth on plates, C-fern medium was prepared as described by Hickok and Warne (1998), but 5g/l sucrose was added and the solution corrected to ph7 before autoclaving. For the initial and decapitation experiments (Sections , Figure 4-15 to Figure 4-20) 1% technical agar was used to solidify media, but for GR24 only experiments (Section 4.3.3, Figure Figure 4-22) 0.8% agar was used and 1ml/l of Gamborg s vitamins 1000X solution (Sigma Aldrich Corporation) was added to the medium to encourage growth and purchase of the rhizophores in the medium. Plates were kept in long-day growth room conditions and shaded with two layers of white muslin Initial experiments For the initial experiments explants with one expanded node were cut from the parent plants and were surface sterilised in 15% NaClO for 3 minutes, rinsed three times in dh 2 O and placed 3 to a single plate, with GR24 added at 1/1000 to final concentrations of 0, 1 or 10μM, with two plates per treatment. Plants were transferred to new plates and apices counted at 25, 78 and finally at 94 days, at which point lengths of rhizophores long enough to be visible to the naked eye were measured with a ruler, as was the whole explant at its longest point, and plants were also weighed on a microbalance Decapitation and GR24 experiments Explants were cut with approximately two expanded nodes and surface sterilised in 2% NaClO for 15 minutes (this method was recommended as more suitable for larger explants by Dr Heather Sanders). Explants were then washed 3 times in dh 2 O, allowed to dry for a few minutes and added to plates with GR24 added as before to final concentrations of 0 or 1μM. At the end of the experiments, rhizophore length was measured either by ruler or by dissecting nodes with fine forceps to reveal developing rhizophores under a dissection microscope. Nodes were photographed by microscope-mounted camera and
68 68 images analysed using ImageJ (Rasband, 1997). Treatments were randomly assigned numbers to blind the test before data analysis. For the decapitation experiments, plants were decapitated before sterilisation with a scalpel under the dissection microscope, at the smallest possible node, and the major branch was always chosen. Explants were moved to new plates once a week for three weeks in total before phenotyping. 30 plates were originally set up per treatment, and after plates had been removed due to contamination numbers between 9 14 were left, except for a third experiment in which all decapitated plants were lost. For the GR24 only experiments the protocol was adapted to use plates with less agar and vitamins added as described above, and explants were added without decapitation to plates with 0, 1 or 10μM GR24. Explants were moved to new plates after two weeks, with any explants that were slightly but not seriously contaminated re-sterilised as before, and scored after a further two weeks. 40 plates were used per treatment, of which survived Ceratopteris richardii Spores were surface sterilised by the wet method described for Arabidopsis seeds, and spread on Petri dishes (Sterilin) of C-fern medium (Hickok and Warne, 1998) solidified with 0.8% agar and corrected to ph6. Gametophytes were grown for one month in the warm growth room, with 1-2ml dh 2 O added every two weeks to encourage fertilisation and growth of sporophytes. When at the five-leaf stage, sporophytes were moved to 25ml liquid Cfern medium with 0.05% agar in autoclaved square Magenta culture vessels (Sigma-Aldrich Corporation) with 10 sporophytes per vessel. After 2 weeks plants were moved to autoclaved round baby-food jars sealed with Magenta B-caps (both Sigma- Aldrich Corporation) containing 25ml experimental media at a density of 6 plants per vessel, and grown on these media for four weeks, with media being replaced with fresh media at 2 weeks. Experimental media were: For the phosphate experiment, phosphate sufficient was standard media, but no phosphate media had the 0.625mM KH 2 PO 4 replaced with equivalent molar of KCl. 3 vessels were used per treatment.
69 69 For the GR24 experiment, GR24 dissolved in acetone was added at 1μl/ml of media and concentration 0, 0.1, 1 or 10mM to a final concentration of 0, 0.1, 1 or 10μM. 6 vessels were used per treatment. Plants were then measured using a ruler and counting numbers of sporophylls, roots, measured length of the longest single root, length and width of sporophylls at longest and widest point, and counting leaves with signs of senescent (yellowing) leaves and with pinna divisions with acute angles. 2.7 Statistical analysis and representation of data Statistical analysis Statistical analyses were performed using the PASW Statistics 18 program (SPSS, IBM Corporation, New York, US), unless distributions were known to be normal and variances equal, in which case ANOVA or Student s t-test was used in Microsoft Excel 2010 (Microsoft, Washington, US), or in the case of Chi-squared test, done by hand. In PASW the Explore function was initially used on parameters not previously analysed (e.g. the first time branching was analysed) to establish normality of the data. Data in which Shapiro-Wilkes values were less than 0.05 were considered not normally distributed and analysed using the Kruskal-Wallis test, but normally-distributed data was analysed by ANOVA with Levene s test for equal variances. Data identified as equal by Levene s was post-hoc analysed with Tukey s HSD, and data rejected by Levene s at p=0.01 was analysed using Tamhane s T2 or Dunnett s T3 tests. Probability cut-offs were adapted to the experiment and are noted in the text, with P=0.05 used as the uppermost boundary of significance Graphs & Thesis All graphs were produced in Microsoft Excel and all error bars show standard error of the mean. This thesis was written in Microsoft Word on an ASUS (Taiwan) U53JC Series laptop with bamboo lid running Windows 7 (Microsoft). Diagrams were produced in Microsoft PowerPoint.
70 70 Chapter 3. MAX1 Incorporation into the MAX pathway 3.1 Introduction to the evolution of MAX1 MAX1 was designated CYP711A1, as the first member of the CYP711 family and clan (Nelson et al., 2004), with other members of this family presumed to be orthologues of MAX1. The CYP711 family is plant-specific, although two sister families from the same clan, CYP743 and CYP744, are known to exist in the green algae. However these are specific to that lineage (in which they represent an astonishing third of all CYPs) and they are not shared in the land plants. Indeed, they may only be long branch attracted to the CYP711 family, as they do not cluster with it in more global trees of CYPs (Nelson and Werck-Reichhart, 2011). Not only are MAX1 orthologues specific to land plants (embryophytes), they are also absent from the genome of Physcomitrella patens, the only bryophyte currently sequenced (Rensing et al., 2008). Despite this, MAX1 orthologues were present in every complete tracheophyte genome published, including that of the lycopodiophyte Selaginella moellendorffii (Banks et al., 2011). In eudicots MAX1 orthologues are generally present as a single copy, but in monocots several orthologues are present as many as five in rice, representing three separate clades, each of which is also represented in maize and Brachypodium distachyon (Nelson et al., 2008 Challis et al. in preparation, Figure 3-1). This apparent conservation and duplication of MAX1 in flowering plants compared to its absence from Physcomitrella led to the hypothesis that it had been incorporated into the MAX pathway after the divergence of the moss and tracheophyte lineages, and that its subsequent duplication in the angiosperms has allowed orthologues to diversify functionally. In order to investigate how MAX1 orthologue function has evolved within the SL biosynthesis pathway, a complementation analysis approach was employed, exploiting the ease of producing transgenics and the mutant collection available in the Arabidopsis model.

71 71 Figure 3-1. Maximum likelihood tree for MAX1, showing bootstrap support. Dicotyledons in green, monocotyledons in blue, non-angiosperms in black. Scale bar corresponds to 0.1 substitution per site. Kindly provided by Richard Challis Phenotype In Arabidopsis at least three different mutant max1 alleles have been described (Stirnberg et al., 2002; Booker et al., 2005; Lazar and Goodman, 2006). All three have phenotypes similar to those of max2, max3 and max4 mutants, with increased branching in the rosette but with wild-type proportions of higher-order branches, as well as leaves with shorter petioles and shorter and more rounded laminas, and delayed onset of senescence (Stirnberg et al., 2002; Bainbridge, 2005; Booker et al., 2005; Lazar and Goodman, 2006). Unlike max2 mutants but in common with max3 and max4, max1 does not show hypocotyl and cotyledonary elongation defects in light (Stirnberg et al., 2002; Shen et al., 2007; Nelson et al., 2011). As a members of the strigolactone biosynthetic pathway, the branching defects of max3, max4 and max1 can be rescued by addition of strigolactones, as can the tillering defect of the corresponding mutants in rice, d17 and d10 (max3 and max4 respectively) and that of d27, whereas the signal transduction mutant max2 and the α/β hydrolase mutant d14 cannot (Gomez-Roldan et al., 2008; Umehara et al., 2008; Arite et al., 2009; Lin et al., 2009). Although the varied capabilities of the CYP family
72 72 make the reaction catalysed by MAX1 difficult to hypothesize with certainty, grafting studies indicate that it acts downstream of MAX3 and MAX4, which produce a mobile, but inactive precursor (Booker et al., 2005). A hypothesis of late action in the pathway has therefore been proposed for MAX1, in which it catalyses one of the final steps required for production of active molecules. 3.2 Dose response curves To further establish the position of MAX1 in the biosynthetic pathway, and to characterise more closely max1 phenotypes for comparison to transgenics produced by the complementation analysis, assays were performed to investigate the dose-response curves of the branching phenotype of max1-1 grown on the synthetic strigolactone GR24, using the method described by Bennett et al. (2006). This allowed comparison of the max1-1 phenotype to that of the max4-1 phenotype, to check for the possibility of resistance to GR24 in max1-1. This resistance would be hypothesised if MAX1 function were so late in the pathway that it were downstream of the compound that GR24 mimics, and therefore required to produce a GR24-derivative with full shoot-branching activity. However, two experiments revealed no differences in response between max1-1 and max4-1 at the concentrations tested, as both showed significant reductions from their growth on the acetone carrier control when grown on 1μM GR24 or higher, but not when grown on 0.1μM GR24 or lower (Figure 3-2). These results infer that GR24 mimics a compound or compounds that are downstream of the action of both MAX4 and MAX1. A further test with all four max mutants at 0.5μM, an intermediate concentration between those that did and did not produce a response (Figure 3-3), also showed no difference between any of the biosynthetic mutants, and a significant reduction in branching to levels similar to those of the wildtype control.
73 0μM 0.1μM 1μM 5μM 0μM 0.1μM 1μM 5μM 0μM 0.1μM 1μM 5μM 0μM 0.1μM 1μM 5μM Mean number of rosette branches 0µM 0.01µM 0.1µM 1µM 0µM 0.01µM 0.1µM 1µM 0µM 0.01µM 0.1µM 1µM 0µM 0.01µM 0.1µM 1µM Mean number of rosette branches 73 A ** * 1 0 Columbia-0 max1-1 max2-1 max4-1 B ** * ** ** ** 1 0 Columbia-0 max1-1 max2-1 max4-1 Genotype and concentration of GR24 Figure 3-2. Mean number of branches for plants grown on agar containing GR24 dissolved in acetone. A) Experiment 1, B) Experiment 2. Branches were scored after approximately five weeks when the first siliques had formed. Columbia and max2-1 are controls. Error bars are standard error of the mean. Samples treated with GR24 were compared to the samples of the same genotype treated with acetone, where ** = significant difference to P<0.001, * = P<0.05 in a Kruskal-Wallis test (adjusted for multiple sampling). Figure B is reproduced from Crawford et al. (2010).

74 74 Figure 3-3. Mean number of branches for plants grown on agar containing 0.5μM GR24 dissolved in acetone. Branches were scored after approximately five weeks when the first siliques had formed. Columbia and max2-1 are controls. Error bars are standard error of the mean. Samples sharing the same letter show no significant difference to P<0.001 in a Kruskal-Wallis test (adjusted for multiple sampling). 3.3 The Brassicaceae-specific hypothesis With regard to strigolactones, Arabidopsis is unusual among the models studied in two ways; firstly, (like most of the Brassicaceae) it does not form mycorrhizal symbioses, and secondly it is the only model system which currently has a max1 orthologue mutant. This initially suggested a variation of the hypothesis that MAX1 was a later incorporation into the biosynthesis pathway; that the absence of the evolutionary constraints imposed by mycorrhizal symbiosis may have allowed the incorporation of MAX1 into the strigolactone pathway in the Brassicaceae specifically. If this is the case, then there may also have been coevolution of the signal transduction pathway, and particularly the receptor. There is only very limited knowledge of SL signalling at present, with MAX2 as the only confirmed signal transduction component. To test for co-evolution of SL synthesis with the recruitment of MAX1 and SL signalling by modification of MAX2, the ability of MAX2 from a species outside the Brassicaceae, hypothesised not to have MAX1 in its SL biosynthetic
75 75 pathway, was assessed for its ability to rescue an Arabidopsis max1 mutant. This experiment rested on two assumptions: that MAX1 catalyses a modification to an SL that is bioactive outside the Brassicaceae, and that MAX2 was a possible receptor or co-receptor for the compound, with which it would therefore have to coevolve. Two 35S::SvMAX2 max2-1 Arabidopsis transgenics produced by Dr Sally Ward, containing MAX2 orthologues derived from willow, Salix viminalis, (which is in the Salicaceae family, but is also a rosid, like Arabidopsis) under the control of the strong 35S promoter, which had been found to substantially rescue max2-1, were crossed into the max1-1 max2-1 double mutant reported by Stirnberg et al. (2002), which has a similar or slightly stronger rosette branching phenotype than the single mutants. F 2 plants from the cross were then scored for branching by long day branching assay, in which plants are grown in the greenhouse for approximately 6 weeks, until the main stem has ceased producing flowers, and then the number of rosette branches were scored. The 76 plants were found to segregate with a ratio of 48 wild type plants: 29 max-like, not significantly different from the 43:33 (9:7 wild type to branchy) ratio expected for no or limited rescue of the max1 phenotype by the SvMAX2 construct (not significant at P 0.05 in a Chi squared test, see Table 3-1). The 9:7 ratio results from all the plants being homozygous for the Atmax2-1 mutation, producing a ratio of 9 wild type phenotype plants carrying both the SvMAX2 transgene and a wild type copy of MAX1; 4 plants without the rescuing SvMAX2 transgene (3 with and 1 without MAX1, as the max2 phenotype is epistatic to the max1 phenotype); and 3 plants without MAX1 but with an SvMAX2 transgene. This was as opposed to the 3 wild-type: 1 max2-like segregation expected if the transgene were capable of substantially reducing the max1 phenotype (the results were significantly different to this ratio at P 0.05 in Chi squared test). In addition, it was possible to distinguish differences between the max-like plants corresponding to the slight differences between max1 and max2 phenotypes, specifically the much stronger leaf shape and curling phenotype in max2-like plants. Dividing by these phenotypes gave a ratio of 48 wild type: 17 max2-like: 12 max1-like, again not significantly different (P 0.05 in Chi squared test) from the 43:19:14 ratio expected for no or limited rescue.
76 76 Table 3-1. Phenotypic punnet square for expected phenotypes of F 2 plants from the 35S::SALIXMAX2 max2 x max1max2 cross note all progeny are homozygous for max2-1. Plants carrying both at least one copy of the transgene (so wildtype for the max2 lesion) and a wild-type MAX1 copy are in black, those without a rescuing transgene and therefore max2 phenotype are red, and plants with a transgene but homozygous for max1-1 are in blue, resulting in a 9:3:3:1 ratio, in which the 1 (lacking both transgene and MAX1), is indistinguishable from the those lacking only the transgene. Parental lines 35S::SvMAX2 35S::SvMAX2 (max2) (max2) MAX1 max1 MAX1 max1 35S::SvMAX2 35S:: SvMAX2 35S:: SvMAX2 35S:: SvMAX2 35S:: SvMAX2 MAX1 MAX1 MAX1 MAX1 MAX1 35S::SvMAX2 35S:: SvMAX2 35S:: SvMAX2 35S::SvMAX2 35S::SvMAX2 max1 MAX1 max1 MAX1 max1 (max2) 35S::SvMAX2 35S::SvMAX2 (max2) (max2) MAX1 MAX1 MAX1 MAX1 MAX1 (max2) 35S::SvMAX2 35S::SvMAX2 (max2) (max2) max1 MAX1 max1 MAX1 max1 To quantify the resulting phenotypes in more detail in case of weak effects, a short day decapitation assay was used to compare F 3 plants from three different F 2 parents with the max1-like phenotype and homozygous for the transgene. In this assay, to enhance the number of shoot branches for analysis, the method developed by Greb et al. (2003) was employed, in which plants are grown in short day conditions for four weeks to delay flowering and increase rosette leaf and axillary bud production. The light period is then lengthened to induce flowering, and when bolting has started the primary meristem is decapitated, to release further buds. This enhances the number of branches even in max mutants as although dormancy is reduced in these plants even they retain some dormant buds after growth in short day conditions, and they also retain the decapitation response. As a control a 35S::AtMAX2 max1 line was included in the assay, since this transgene was previously shown partially suppress the phenotype of max1 (Stirnberg et al., 2007).
77 Mean number of rosette branches c bc 14 b a ab a Figure 3-4. F3 plants homozygous for 35S::SvMAX2 but with max1 phenotype, tested for branching in short day decapitation assay against controls Columbia-0, max1-1, 35S::AtMAX2 max1-2, and parental lines max1-1 max2-1 and 35S::SvMAX2 max Error bars represent standard error of the mean, n=24 for all lines except the 35S::SvMAX2 max1-1 max2-1, which are the pooled result of 3 separately backcrossed lines. Shared letters indicate no significant difference in Kruskal-Wallis test adjusted for multiple sampling at P As shown in Figure 3-4, branching in the test lines was found to be intermediate between max1-1 and max1-1 max2-1 and not significantly different from either of them (there were also no significant differences between the three test lines). This is similar to the phenotype reported for the max2-1 mutant (not tested here) which is intermediate between the max1-1 single mutant and the max1-1 max2-1 double mutant (Stirnberg et al., 2002). On average the 35S::SvMAX2 construct reduced the branching of the double mutant by three branches on average, a greater reduction than the effect of the overexpression 35S::AtMAX2 construct on the max1-1 mutant (a 2.6 branch reduction). However, in the double mutant background 35S::SvMAX2 could not significantly reduce the high branching phenotype to either the branch numbers
78 78 of the 35S::SvMAX2 max2-1 parent line, nor to less than that of a single max mutant. If rescue had occurred, the hypothesis that MAX1 was a Brassicaceaespecific innovation may have been supported. However, given the number of assumptions required for this experiment, few firm conclusions could be drawn from the lack of full rescue. 3.4 MAX1 complementation by non-angiosperm species To test more directly the incorporation of MAX1 into the MAX pathway in other species, the function of AtMAX1 was compared to that of other orthologues. In this case, it was hypothesized that orthologous proteins from other species capable of catalysing the same reaction as that in Arabidopsis may also act in SL biosynthesis in those species. Therefore if MAX1 function in the pathway predated the emergence of the angiosperms, non-angiosperm MAX1 orthologues should be able to act in the Arabidopsis pathway sufficiently well to rescue the mutant phenotype of max1-1 plants. In collaboration with Dr Richard Challis and Dr Céline Mouchel MAX1 orthologues from a range of plant species were identified by reciprocal Basic Local Alignment Search Tool (BLAST) searches on the GenBank, TIGR and Phytozome databases (Altschul et al., 1990; Childs et al., 2007; Goodstein et al., 2012; NCBI). MAX1 orthologues were identified from several angiosperm species, including all those (at that time) with fully sequenced genomes, as well as from Selaginella moellendorffii. S. moellendorffii represents the lycopodiophytes, the most distantly related group of plants from the angiosperms to possess both vasculature and branching in the sporophyte generation (Willis and McElwain, 2002). Its genome has been fully sequenced, revealing the presence of a single orthologue of MAX1 (Banks et al., 2011). As the lycopodiophytes are so evolutionarily distant from the angiosperms, and no genomes are available for any taxon between these two, a candidate expressed sequence tag (EST; GenBank accession BT103061) from Picea glauca (white spruce, a gymnosperm) was used as the basis for 5 RACE to identify the full length transcript for cloning of the coding sequence, which was used for phylogenetic analysis and complementation of MAX1 (as PgMAX1 ).
79 79 ClustalW (Larkin et al., 2007) was used to produce alignments of MAX1 orthologue proteins, and a 95% consensus sequence (Figure 3-5) and matrix of protein identities were produced in BioEdit (Hall, 1999). This alignment firstly revealed conservation of the PFGxGPRxCxG haem-binding motif, of the PERF motif corresponding to the PxRx of all Arabidopsis CYPs, and a KExMR motif corresponding to the K-helix motif (from the website of Paquette et al., 2009). All three motifs are either known to be involved in haem-binding (the conserved cysteine in the PFGxGPRxCxG motif forms the thiolate bond with the haem) or thought to stabilise the haem-binding pocket (Paquette et al., 2009). However, there are no obvious highly conserved motifs particular to MAX1, especially when compared to other CYP711 clan members from the green alga Chlamydomonas reinhardtii. The point mutation that abolishes function in the max1-1 mutant is a C-to-T substitution, predicted to convert Proline-117 to a leucine (Booker et al., 2005), but this proline is not conserved even within other potential MAX1 orthologues, although it is frequently present in other Arabidopsis CYPs (from the website of Paquette et al., 2009) and forms part of the first Substrate Recognition Sequences proposed by Nelson et al. (2008). These alignments also indicate that SmMAX1 shares very low sequence identity and protein similarity to AtMAX1 (Table 3-2), as its protein identity is only 38.9%, even less than the 40% normally required to be classified in the CYP711 family. This is in contrast to the similarity of the gymnosperm PgMAX1, which shows higher identity to AtMAX1 than several (although notably not all) monocot genes.
80 80 Figure 3-5. Alignment of selected MAX1 genes, showing consensus sequences from BioEdit (95% threshold identity) and Clustal (complete consensus as *, strong groups with >0.5 score in the Gonnet PAM250 similarity matrix as :, weak groups with 0.5 score as. ). The Arabidopsis P-117 that is affected in the max1-1 mutation is highlighted in grey P_trichocarpa_CYP711A MSTDLQVLFT--PMVTP-LCTVLAMLLG--LLGYLYGPYWGVRKVPGPPVIPLLGHLPLMAKHGPDVFTLLAKLYGPIFRFHMGRQ P_trichocarpa_CYP711A MDLQVLFTDVPVVTAIICTVFAMLLG--LLGYLYGPYWGVRKVPGPPVIPLLGHLPLMAKHGPDVFSVLAKRYGPIFRFHMGRQ V_vinifera MAPAFFTVLAMLGG--LLGYLYEPYWRVRRVPGPPVFPLVGHLPLMAKYGHDVFSVLAKKYGPIFRFHVGRQ C_papaya MGLVEMLMGVRWFNTTLPPAVSTFFTILAVAAG--ILVYLYGPYWGVRRVPGPPIIPLVGHLPLMAKYGPDVFSVLAKRHGPIFRFHMGRQ G_max_04g MVVFMDYLEWLFAIPSVPSASAMFTLLALIGG--LLVYLYAPYWGLRKVPGPPSLPLVGHLPLLAKYGPDVFSVLAKQYGPIYRFHMGRQ G_max_06g MVFMDYLEWLLPIPSVPSASAMFTLLALIGG--LLVYLYAPYWGVRKVPGPPSLPLVGHLPLLAKYGPDVFSVLAKQYGPIYRFHMGRQ L_japonicus_Chr1.CM MVFMD-FEWLFQIPSVPWSSAMFTLLATIGG--FLVYLYGPYWGVRKVPGPPSVPLIGHLPLLAKYGPDVFSVLAKQYGPIYRFHMGRQ M_truncatula_Medtr3g MVFMD-LEWLFPIP--ISVSFASTILALAGG--WLIYLYEPYWRVRKVPGPPSLPLVGHLHLLAKHGPDVFSVLAKQYGPIYRFHMGRQ G_max_Glyma17g MVSIVLEWLFPFP---CVAMFTTLLMLIGG--LLGYLYGPYWGLRKVPGPPTLPLVGHLPLLAKYGPDVFSLLAKQYGPIYRFHMGRQ G_max_Glyma14g MVSIVLEWLFRFP---CVAMFTTMLVLIIGG-LLGYLYGPYWGLRKVPGPPSLPLVGHLSLLAKYGPDVFPLLAKQYGPIYRFHMGRQ M_truncatula_Medtr1g MLFISVILNVP---LASTIFILVTLMGG--LVGYLYWPFWKLRKVPGPPSLPLVGHLPLLAKYGPDVFSVLAKQYGPIYRFHMGRQ A_thaliana_At2g MKTQHQWWEVLDPFLTQHEALIAFLTFAAVV-IVIYLYRPSWSVCNVPGPTAMPLVGHLPLMAKYGPDVFSVLAKQYGPIFRFQMGRQ O_sativa_Os01g MEIISTVLGST-AEYAVTLVAMAVGLLLLGYLYEPYWKVRHVPGPVPLPFIGHLHLLAMHGPDVFTVLARKYGPVFRFHMGRQ O_sativa_Os01g MDISEVLGAT-AEWAVTLVAMAVGLLVVAYLYEPYRKVWHVPGPVPLPLIGHLHLLAMHGPDVFSVLARKHGPVFRFHMGRQ O_sativa_Os01g MEISTVLGAILAEYAVTLVAMAVGFLVVGYLYEPYWKVRHVPGPVPLPLIGHLHLLAMHGPDVFSVLTRKYGPIFRFHMGRQ Z_mays_MAX1B_gi M-EECTFTSAAMAVGFLLVVYLYEPYWKVRHVPGPVPLPFVGHLHLLARHGPDVFLVLAKKYGPIFRFHMGRQ S_bicolor_Sb03g MEMGTVLGAM-EEYTFTFLAMAVGFLVLVYLYEPYWKVRHVPGPVPLPLIGHLHLLAKHGPDVFPVLAKKHGPIFRFHVGRQ B_distachyon_LOC MGMLPMLL-GEYAVTVVAMAVGFLVATYLYEPYWKMRHVPGPVPLPLIGNLHLLAWHGPDVFSVLARKHGPVFRFHMGRQ B_distachyon_Bradi4g MMGGVGVLLSS--WIEGSPS-FSAVFFTLAAL----VFAVYFYEPSWRVRRVPGPLAFPLIGHLPLLAKHGPEVFGVLAERYGPIYRFHMGRQ S_bicolor_Sb03g MG-WGEIISSQLLIESSSSSLPAVLFTAAALAAG-AFAVYFYIPSWRVRRVPGPVALPLVGHLPLFAKHGPGLFRMLAKEYGPIYRFHMGRQ B_distachyon_Bradi1g MESPLAAILFTVAALAAG-AFAVYFYAPSWRLRRVPGPLAYGLIGHLPLFTKHGPEVFGVLARRYGPIYRFYLGRQ O_sativa_Os06g MEALVAAAAAAARDQPWLLLPWSWLAGVVVV--VVYFYAPWWGVRRVPGPAALPVVGHLPLLAAHGPDVFAVLAKKYGPIFRFHLGRQ B_distachyon_Bradi1g MAPVGEWLPCISTLACCLLGL--VLYFYAPYWGVRRVPGPPALPLVGHLPLLARHGPDVFGLLAQKYGPIFRFHLGRQ Z_mays_MAX1A_gi MEMAGAAG-TEAWLPYVTTVASCAVGVFFLLYFYAPHWRIRDVPGPPALPVVGHLPLLARHGPDVFGLLAKKYGPIFRFHLGRQ S_bicolor_Sb10g MEMAGAAGTAETWLPYVTTAASCAVAVFFLLYFYAPQWAVRGVPGPPALPVVGHLPLLARHGPDIFGLLAKKYGPIFRFHLGRQ S_bicolor_Sb04g MEIA---LTVS--AVSHQSVPVLVLISFLSLFSAFLIYFYAPLWSVRRVPGPPTRFPIGHLHLLAKNGPDVFRAIAKEYGPIFRFHMGRQ Z_mays_LOC MEIT---ASCDDGAVTAGAVSGLLLASVLSLFGAFLVYFYAPFWSVRRVPGPPARFPIGHLHLLARNGPDVFRAIAKEYGPIFRFHMGRQ O_sativa_Os02g MQASSMEASNCSIALEISHVATPGLPVLLLGSSLALLAVFLVYFYAPFWSLRTVPGPPTRFPIGHLHLLAKNGPDVFRAITKEYGPIFRFHMGRQ B_distachyon_Bradi3g MAAITNCSIALVTSTNGHSAAASPTTAALLLLSLIIAFLAYFHLPFWAVRKVPGPPTRFPLGHLHLLAQHGPDILRAMAQEHGPIFRFHMGRQ P_glauca_MAX1 MASLCGLLTIFSTETDRFISTQDQFMNTTTILICVFILAAASITAWIYLATPTWKVRRVPSPPAFWLLGHLPLLAKHGPEVFIQLARKYGPIYRFNIGRQ S_moellendorffii_e_gw MALIIAVFFVILVTILIYLQWPAWKLSKIPAAPYISGLGHLPLMAKYQAGVFIKLAKQLGPIYRFQLGRQ Consensus Y P W VP GHL L A G F GP RF GRQ Clustal Consensus *: * : :*.. :*:* *:: :: ::. **::** :***
81 Figure P_trichocarpa_CYP711A8 PLIIVADPELCREIGIKKFKDIPNRSIPSPISASPLHQKGLFFT-RDAIWSTMRNSILSVYQPSHLASLVPTMQSFIESATENFQSLK EEE P_trichocarpa_CYP711A7 PLIIVADPELCKEVAIKKFKDIPNRSVPSPISASPLHQKGLFFT-RDARWSTMRNTILSVYQPSHLASLVPTMQSFIESATDNFQSSN EE- V_vinifera PLVIVADAELCREVGIKKFKDIPNRSIPSAISASPLHQKGLFFT-RDARWSTMRNTIISVYQQSHLANLVPTMQAFIEPAFRNLPSSE EED C_papaya PLIIVADPELCREVGIKKFKDIPNRSIPSPISASPLHQKGLFFT-RDARWSTMRNTIVSVYQPSHLASLVPTMQEFIESATQNLES QQD G_max_04g PLIIIADAELCKEAGIKKFKDISNRSIPSPISASPLHQKGLFFS-RDSQWSTMRNTILSMYQPSYLSRLVPTMQSFIESATQNLD-SQ KED G_max_06g PLIIIADAELCKEAGIKKFKDISNRSIPSPISASPLHQKGLFFS-RDSQWSIMRNTILSMYQPSYLSRLVPTMQSFIESATQNLD-SQ KED L_japonicus_Chr1.CM0133 PLIIIADAELCKEAGIKKFKDITNRSIPSPISASPLHQKGLFFT-KDSQWSTMRNTILSLYQPSHLSRLVPTMQSFIESATQNLD-SQ NED M_truncatula_Medtr3g PLIIVADAELCKEVGIKKFKDIPNRSTPSPIKASPLHQKGLFFS-RDSQWSTMRNTILSVYQPSHLSRLVPTMQSFIESATQNLD-SQ KED G_max_Glyma17g34530 PLILVADPELCKEVGIKKFKDIPNRSIPSPISASPLHQKGLFFT-RDSRWSTMRNTILSVYQPSHLASLVPTMQSFIESATQNLD-TP NED G_max_Glyma14g11040 PLILVADPELCKKVGIKQFKDIPNRSIPSPISASPLHQKGLFFT-RDSRWSAMRNTILSVYQPSHLASLVPMMQSFIESATQNLD-TP NED M_truncatula_Medtr1g PLIIIADAELCKEVGIKKFKEIPNRSIPSPISASPLHQKGLFFT-RNSQWSTMRNTILSVYQPSHLANLVPKMQSFIESATQNLDDTS KED A_thaliana_At2g PLIIIAEAELCREVGIKKFKDLPNRSIPSPISASPLHKKGLFFT-RDKRWSKMRNTILSLYQPSHLTSLIPTMHSFITSATHNLD-SK PRD O_sativa_Os01g PLVMVADAELCKEVGVKKFKSIPNRSMPSAIANSLINQKGLCFT-RGSRWTALRNMIISIYQPSHLASLIPTMQSCIECVSKNLDGQE D O_sativa_Os01g PLIIVADAELCKEVGVKKFKSIPNRSMPSPIANSPIHKKGLFFI-RGPRWTSMRNMIISIYQPSHLASLIPTMESCIQRASKNLDGQK E O_sativa_Os01g PLVMVADAELCKEVGVKKFKNFPNRSMPSPITNSPVHQKGLFFT-SGSRWTTMRNMILSIYQPSHLATLIPSMESCIERAAENLEGQE E Z_mays_MAX1B_gi PLVIVANAELCKEVGIKKFKSMPNRSLPSAIANSPIHLKGLFST-RDSRWSALRNIIVSIYQPSHLAGLIPSMQSHIERAAT-NLDDGGE AE S_bicolor_Sb03g PLIIVADAELCKEVGIKKFKSMPNRSLPSPIANSPIHRKGLFAT-RDSRWSAMRNVIVSIYQPSHLAGLMPTMESCIERAATTNLGDG EE B_distachyon_LOC ALIMVADAELCRQVGIRKFKSFRNRSLPSPIAKSPILEKGLFVT-RDSRWSAMRNTVASIYQPSHLASLVPTMHSYIQRAARNIGGVGGG QD B_distachyon_Bradi4g PLVMVASPELCREVGIKKFKSIPNRSMPSPIRCSPIHHKGLFFT-RDTRWQTMRNVIISIYQPSHLASLIPAIQPYVERAGRLLRHGE E S_bicolor_Sb03g PLVMVADAELCKEVGIKKFKSIPNRSIPTPIRGSPIHNKGLFFT-RDSRWQSMRNVILTIYQPSHVASLIPAIQPYVERAGRLLHPGE E B_distachyon_Bradi1g PVVVIADAELCREAGIKKFKSVVDRSVPSTIRSSPIHFKSLLFT-KGSRWQSMRNVIIAIYQPSHLASLIPAVHPYIRRAARLLHPGQ E O_sativa_Os06g PLVIVAEAELCKEVGIRQFKSIANRSLPAPIAGSPLHQKGLFFT-RDARWSAMRNTIISLYQPSHLAGLIPTMHSCVARAADAIAAAEQ RD B_distachyon_Bradi1g PLVIVADPELCKEVGIRQFKSIPNRSTPSPIAGSALHQKGLFFT-RDARWSAMRNAILSLYQPSHLAGLIPTMQRCVERAADTISTVND GD Z_mays_MAX1A_gi PLVIVADPELCREVGVRQFKLIPNRSLPAPIAGSPLHQKGLFFT-RDERWSAMRNTIISLYQPSHLAGLVPTMQHCIERAADAIPAMVVQENG------L S_bicolor_Sb10g PLVIVADPELCREVGVRQFKLIPNRSLPAPIAGSPLHQKGLFFTSRDERWSAMRNTIISLYQPSHLAGLVPTMQRCIERAADAILAPGVQQNGDGDVDVD S_bicolor_Sb04g PLVIVANAELCKEVGIKKFKDIRNRSTPPPSIGS-LHQDALFLT-RDSTWSAMRSTVVPLYQPARLAGLIPVMQSYVDILVANIAGWTDQ DC Z_mays_LOC PLVIVANAELCKEVGIKKFKDIPNRSTPPPSIGS-LHQDALFLT-RDSTWSAMRSTVVPLYQPARLAGLIPVMQSYVDTLAANIAACPDQ DC O_sativa_Os02g PLVIVANAELCKEVGIKKFKDIRNRSTPPPNVGT-LHQDALFLT-RDSTWSSMRNMVIPLYQPARLAGLIPTMQSYVDALVDNIAGCPDQ DC B_distachyon_Bradi3g PLVMAASAELCKEVGIKRFRDIRNRSAPPPTAGSPLHRDALFLA-RDSAWASMRSTVVPLYQPARLAQLVPTMRASVDALVDAVD--QDQG SY P_glauca_MAX1 PLVVIADADLCREVGIKKFKQFSNRSIPSPIASSPLHQKGLFFT-RDSRWSSMRGAIQPLYQTGRISNLLPVMERVVCVLKRKLAAKEET DD S_moellendorffii_e_gw1.18 PIVFVASADLCQEIAIRKFKVFPNRVILPYMKESWIHLHGLFMT-KAPDWARMRNILLPTFHTEKLSAYVPLMERVMGQVVEILDKHANAG ED Consensus A LC FK NRS P S L - W R YQ L P ---- Clustal Consensus.::. *..:**::.:::*:. :*. : :..* * :*. :. :: :: :* :. : 81
82 82 Figure P_trichocarpa_CYP711A8 ITFSNLSLKLATDVIGQAAFGVDFGLSKPQSTSDSFNSFHSQGK DNTDVSEFIKQHIYSTTQLKMDLSGSFSIILGLLVPILQEPFRQ P_trichocarpa_CYP711A7 ITFSNFSLKLATDVIGQAAFGVDFGLSKPQSASDSINSFHNQGK DNCDVSEFINQHIYSTTQLKMDLSGSFSIIIGLLVPILQEPFRQ V_vinifera ITFSNLSLKLATDVIGQAAFGVHFGLSKPPSS NEVK NSDEVSEFINQHIYSTTNLKMDLSGSFSIILGLLVPILQKPVQH C_papaya VNFSNMSLKLATDVIGRAAFGVNFGLSKPQSIDESINKKTNQDDN VDDHEVSSFINQHIYSTTQLKMDLSGSFSIILGLLIPILQEPFRQ G_max_04g IIFSNLSLRLATDVIGHAAFGVNFGLSRPHSVCDSIKSVNVNNNNN-NASASSS-SNDNEVSDFIDQHIYSTTQLKMDLSGSLSIILGLLLPILQEPFRQ G_max_06g IIFSNLSLRLATDVIGHAAFGVNFGLSSPHSVCDSIKNVNVNNNNN-NASASSSNSNDNEVSDFINQHIYSTTQLKMDLSGSLSIILGLLLPILQEPFRQ L_japonicus_Chr1.CM0133 FIFSNLSLSLATDVIGQAAFGVDFGLSRPQSVRDESGNKEVRGS GAGNEVSDFINQHIYSTTQLKMDLSGSFSIILGLLVPILQEPFRQ M_truncatula_Medtr3g IFFSNLSLKLATDVIGQAAFGVNFGLSQSHSVHNESKNVATDNKD------LMNASGSNEVTDFINQHIYSTTQLKMDLSGSFSIILGLLVPILQEPFRQ G_max_Glyma17g34530 IIFSNLSLRLATDVIGEAAFGVNFGLSKPHSVCESIKSVSVNNVR-----NDD-----DEVSDFINQHIYSTTQLKMDLSGSFSIILGLLAPILQEPFRQ G_max_Glyma14g11040 IIFSNLSLRLATDVIGEAAFGVNFGLSKPISVCESIKSVSVNNVR-----NDDNDNGDDEVSDFINQHIYSTAQLKMDLSGSFSIILGLLAPILQEPFRQ M_truncatula_Medtr1g IIFSNLSLRLATDVIGDAAFGVNFGLSKPHSICESMNNVEQSSAN-----SDE VSIFINQHIYSTTQLKMDLSGSFSIIIGLIAPILQEPIRQ A_thaliana_At2g IVFSNLFLKLTTDIIGQAAFGVDFGLSGKKPIKD VEVTDFINQHVYSTTQLKMDLSGSLSIILGLLIPILQEPFRQ O_sativa_Os01g ITFSDLALGFATDVIGQAAFGTDFGLSKISASS NDD-DIDKIATDTSAEAKASSEFIRMHVHATTSLKMDLSGSLSIIIGQLLPFLQEPFRQ O_sativa_Os01g ITFSDLSLSLATDVIGLAAFGTDFGLSKLPVTP DDS-NIDKIAADTSVEAKASSEFIKMHMHATTSLKMDLSGSLSILVGMLLPFLQEPFRQ O_sativa_Os01g INFSKLSLSFTTDVLGQAAFGTDFGLSKKLASS DDDEDTRKIAADTCAEAKASSEFIKMHVHATTSLKMDMSGSLSIIVGQLLPFLHEPFRQ Z_mays_MAX1B_gi VAFSKLALSLATDVIGQAAFGADFGLTTKPAAPPP----HHGPPRQHGEEDGDGSHSTRSS-EFIKMHIHSTTSLKMDLSGSLSTIVGTLLPVLQWPLRQ S_bicolor_Sb03g VVFSKLALSLATDIIGQAAFGTDFGLSGKPVVP DDDMKGVDVVVGDAAKAKASSSEFINMHIHSTTSLKMDLSGSLSTIVGALVPFLQNPLRQ B_distachyon_LOC VDFSTLAVSLFTDVMGQAAFGLDFGLTAADKNP GGDSSSNKQAQEFVKMHAHVTTSLKMDMTGSLSSIVGQLVPSLHRPFQE B_distachyon_Bradi4g ITFSDLSLKLFSDTIGQVAFGVDFGLTKGK GAEAEESIPD------GFIRKHFYATTELKMDLSGSLSMLLGMVAPLMQDPVRQ S_bicolor_Sb03g ITFSDLSLKLFNDTIGQVAFGVDFGLTKDDTTAATSPAAQQQPAHGGANANQSVDDP---ATDFIRKHFRATTSLKMDLSGPLSIVLGQFVPFLQEPVRQ B_distachyon_Bradi1g VAFSDLAVKLFSDTIGQAAFGVDFGLTKPDD ANNVDSTINNEKTATDDFIEKHLYALTSLKADLNGSLSMVLGTVAPLLQEPARQ O_sativa_Os06g VDFSDLSLKLATDVIGQAAFGVDFGLTAAAAAAPRS DDAD----ADGGEAAEFIREHVHSTTSLKMDLSGSLSIVLGLVAPALQGPARR B_distachyon_Bradi1g FDFSDLALKLATDVIGQAAFGVDFALSAPPAGDGTK DAS AAEFIAEHVQSTTSLKMDLSASLSIVLGLVAPALQEPARR Z_mays_MAX1A_gi VDFSDLSLKLATDIIGEAAFGVDFGLTASG-PGCE AAEFIREHVHSTTSLKMDLSAPLSVVLGLVAPALQGPVRH S_bicolor_Sb10g VDFSDLSLKLATDIIGQAAFGVDFGLTASGDPGGE AAEFIREHVHSTTSLKMDLSAPLSVALGLVAPALQGPVRR S_bicolor_Sb04g IPFCQLSLRMAIDIIGKTAFGIEFGLSKNAAGGGGE TE----GGEGDDNVREFLKEYKRSMEFVKMDLSSSLSTILGLFLPCVQTPCKR Z_mays_LOC VPFCQLSLRMAIDIIGRTAFGIEFGLSKNAAGTGSS SSESPGGGEGEGDVREFLREYKRSMEFVKMDLTSSLSTILGLFLPCVQTPCKR O_sativa_Os02g IPFCQLSLCMAIDIIGKTAFGIEFGLSRKAADTAAG DD---GDGDDDDDVKEFLREYKKSMEFIKMDLSSSLSTILGLFLPCVQTPCKR B_distachyon_Bradi3g VPFSQLSLRLAIDIIGKTAFGIEFGLLSKQGTNG DDEARELLGEYERSMEFMKMDLSSSLSTILGLFLPCLQTPCKR P_glauca_MAX1 IDFSELLLRVATDIIGEAAFGERFGLTEETTTISSS NPAEVSEFIKQHVYSTSSLKMDLNGTFSILVGILFPIAQELFRQ S_moellendorffii_e_gw1.18 VNMTQLLQRMALDVIGESAFGTGFKLVKPSWADGR SEDKDMVNAVLNSLDTLTMNEKAPVSTFAGLFFPFLQHPIRE Consensus F D G AFG F L MD S G P P Clustal Consensus. : :. * :* *** * * :: :. :...* *. * : :.
83 Figure P_trichocarpa_CYP711A8 ILKRIPGTMDWKVDRTNKNISGRLEEIVRKKMEEKNKGS KDFLSLILRARESETLSKN AFTPDYISAVTYEHLLAGSAT P_trichocarpa_CYP711A7 ILKRIPGTMDWKVDRTNRNISGRLDEIVRKKMEEKNRGS KDFLSLILRARESETLSKK VFTPDYISAVTYEHLLAGSIT V_vinifera ILKRIPGTMDWKIYQTNKKLSSRLDEIVAKRMKDKDRGS KDFLSLILNARESEKAMKN IFTSDYLNAVTYEHLLAGSAT C_papaya ILKRIPGAMDRKVDQTNRKISRKLDEIVTKRMKDIDKRSN VDFLSLILRARESGTAAKN VFSPDYISAVTYEHLLAGSAT G_max_04g ILKRIPGTMDWKIERTNQKLSGRLDEIVEKRMKDKARSS KDFLSLILNARETKAVSEN VFTPDYISAVTYEHLLAGSAT G_max_06g ILKRIPGTMDWKIEHTNQKLSGRLDEIVEKRMKDKTRSS KDFLSLILNARETKSVSEN VFTPEYISAVTYEHLLAGSAT L_japonicus_Chr1.CM0133. ILKRIPGTMDWKIECTNRKLSGRLDEIVEKRMKDKVRSS KDFLSLILNARESKTVSEN VFTPDYISAVTYEHLLAGSAT M_truncatula_Medtr3g ILKRIPGTMDWKIERTNEKLGGRLDEIVEKRTKDRTRSS KDFLSLILNARESKAVSEN VFTPEYISAVTYEHLLAGSAT G_max_Glyma17g34530 ILKRIPGTMDSKIESTNEKLSGPLDEIVKRRMEDKNRTS KNFLSLILNARESKKVSEN VFSPDYISAVTYEHLLAGSAT G_max_Glyma14g11040 ILKRIPGTMDRKIESTNEKLSGRLDEIVKRRMENKNRTS KNFLSLILNARESKKVSEN VFSPDYVSAVTYEHLLAGSAT M_truncatula_Medtr1g ILKRIPGTMDWKMECTNKNLTGRLDDIVKKRMEDKSRTS KNFLSLILNTRESKSVSEN VFSFDYISAVTYEHLLAGSAT A_thaliana_At2g VLKRIPGTMDWRVEKTNARLSGQLNEIVSKRAKEAETDS KDFLSLILKARESDPFAKN IFTSDYISAVTYEHLLAGSAT O_sativa_Os01g VLKRIPWTADHEIDHVNLALGGQMDKIVAERAAAMERDQAAPH-----AQQRKDFLSVVLAARESNKSWRE LLTPDYISALTYEHLLAGSAT O_sativa_Os01g VLKRIPGMGDYKIDRVNRALKTHMDSIVAEREAAMEHDLAAS QQRKDFLSVVLTARESNKSSRE LLTPDYISALTYEHLLAGSTT O_sativa_Os01g VLKRLRWTADHEIDRVNLTLGRQLDRIVAERTAAMKRDPAAL QQRKDFLSVMLTARESNKSSRE LLTPDYISALTYEHLLAGSAT Z_mays_MAX1B_gi LLLRVPGAADREIQRVNGALCRMMDGIVADRVAARERAP---Q-----AQRQKDFLSVVLAARDSDAAARK LLTPDYLSALTYEHLLAGSAT S_bicolor_Sb03g VLLRVPGSADREINRVNGELRRMVDGIVAARAAERERAPAATA-----AQQHKDFLSVVLAARESDASTRE LLSPDYLSALTYEHLIAGPAT B_distachyon_LOC VLRRVPGTADRETDRVNRELRRQMDAIVADAARERDLHYS-RQ-----QQKKNDFLSVVLGG-----AAEK LLTPDYIGALAYEHILAGSAS B_distachyon_Bradi4g LLLRVPGSADRRMEDTNLALSGLLDGIVAERAALPELERG QKNFLSVLLNARESTEALRN VFTPDYVSALTYEHLLAGAVT S_bicolor_Sb03g LMLRVPGSADRRLEEANSDMSGLLDEIVAERAAQADRGQ QKNFLSVLLNARESTEAMKK LLTPDYVSALTYEHLLAGSVT B_distachyon_Bradi1g LLLRVPGSADRLMDETNRALSGLVDAIVAERAAMEAQSEG EKKNFLSVLLKARESSHAMRE LFTADYVSALTYEHLLAGSGS O_sativa_Os06g LLSRVPATADWRTARANERLRARVGAVVARRERAGGEARR ARRDFLSAVLNARDGGSDRMR ALLTPDYVGALTYEHLLAGSAT B_distachyon_Bradi1g LLSRVPGTADRRTARANERLQARVEEIVASREQQSLQRRRQKS-----QISKRDFLSALLDARDGGDGKMR ELLTPVYVGALTYEHLLAGSAT Z_mays_MAX1A_gi LLSRVPGTADWRVARTNARLRARVDEIVVSRARGR--GQHG ERR-KDFLSAVLDARDR-SAALR ELLTPDHVSALTYEHLLAGSAT S_bicolor_Sb10g LLSRVPGTADWKVARTNARLRARVDEVVAARARARERRRHG EARTKDFLSAVLDARDR-SAALR ELLTPDHVSALTYEHLLAGSAT S_bicolor_Sb04g LLRRVPGTADYKMNENERRLCSRIDAIIAGRRRDRATRRRGGDGVSEDDAAPLDFIAALLDAMENGGG AKDFALADRHVRALAYEHLIAGTKT Z_mays_LOC LLRRVPGTADYKMDQNERRLCSRIDAIIAGRRRDRATRRRCGPGAAP-APAPLDFIAALLDAMESGGGGGGGAGANKDFALADRHVRALAYEHLIAGTKT O_sativa_Os02g LLRRVPGTADYKMDQNERRLCRRIDAIIAGRRRDRDAG DGAALDFIAALLDARESGGGG------HGGFALEDRHVRALAYEHLIAGTKT B_distachyon_Bradi3g LLRRVPGTADHKMEQNERRLCRRIDAIIAARRRRSSSP ATALDFIAALLEDSR GRVAALEDRHVRALAYEHLIAGTKT P_glauca_MAX1 ILSRIPGTGDWKVCINNRRLTHRLNAIVEKRKKDVVGKEK RMDFLSTVTGSKFSR ELFSEEYISALTYEHLLAGSAT S_moellendorffii_e_gw1.18 IMKRIPGTGDWNQYTGNLLLEAQMRALLERREAEMRDGVVR SDALSLLLDARAKSQEMRE LLTDERVLALAYELMMAGSES Consensus R P D - F L ---- A YEH AG Clustal Consensus :: *: * : : : :: : :: : : : *::** ::**. : 83
84 84 Figure P_trichocarpa_CYP711A8 TAFTLSSVVYLIAQHPEVEKKLLAEIDGFGP---HEQMPTAQDLQNEFPYLDQ VVKEAMRFYVV P_trichocarpa_CYP711A7 TSFTLSSVVYLVAQHPETEKKLLAEIDGFGP---HEQIPTAHDLQNKFPYLDQASLLKFFYRSPDAALLLSPNYLTHKDFAVIANPDLHVVKEAMRFYVV V_vinifera TSFTLSSTIYLIAEHPEVEKKLLAEIDGFGP---PDQMPTAHDLQHKFPYLDQAKS LVVKEAMRFYTV C_papaya TSFTLSSVLYLVAGHPEVEKKLLAEIDSFGP---HKKLPTFHHLQYNFPYLDQ VIKESMRFYLV G_max_04g TSFTLSSVVYLVAGHPEVEKKLLHEIDGFGP---VDQIPTSQDLHNKFPYLDQ VIKEAMRFYTV G_max_06g TSFTLSSVVYLVAGHPEVEKKLLHEIDGFGP---VDQIPTSQDLHDKFPYLDQ VIKEAMRFYTV L_japonicus_Chr1.CM0133 TSFTLSSIVYLVAGHPEVEKKMLQEIDGFGP---VDQTPTSQDLQEKFPYLDQ VIKEAMRYYTV M_truncatula_Medtr3g TSFTLSSVVYLVAAHPEVEKKMLEEIDGYGS---LDQIPTSQDLHDKFPYLDQ VIKEAMRFYIV G_max_Glyma17g34530 TAFTLSSIVYLVAGHREVEKKLLQEIDGFGP---PDRIPTAQDLHDSFPYLDQ VIKEAMRFYTV G_max_Glyma14g11040 TAFTLSSIVYLVAGHIEVEKKLLQEIDGFGT---PDRIPIAQDLHDSFPYLDQ VIKEAMRFYTV M_truncatula_Medtr1g TSFTLSSIVYLVAGHPNVEEKLLQEIDGFGP---HDKIPNAKDLNESFPYLDQ VIKEAMRIYTV A_thaliana_At2g TAFTLSSVLYLVSGHLDVEKRLLQEIDGFGN---RDLIPTAHDLQHKFPYLDQ VIKEAMRFYMV O_sativa_Os01g TAFTLSTVLYLVSKHPEVEEKLLREIDGFGP---HDHAPTAEDLQTKFPYLDQ VVKESMRFYFL O_sativa_Os01g TAFTLSTVLYLVAKHPEVEEKLLKEIDAFGP---RYCVPMADDLQTKFPYLDQ VVKESMRFYIM O_sativa_Os01g TAFTLTTALYLVAKHPEVEEKLLREIDGFGP---RDRVPTAEDLQTKFPYLDQ VLKEAMRYYPS Z_mays_MAX1B_gi TAFTLSSVLYLVAQHPRVEEKLLREVDAFGP---PDRVPTAEDLQSRFPYTDQ VLKESMRFFMV S_bicolor_Sb03g AAFTLSSVVYLVAKHPEVEEKLLREMDAFGP---RGSVPTADDLQTKFPYLDQ VVKESMRLFMV B_distachyon_LOC PAFTLSTVVYLVSKHPEVEDRLLKEVDAFFLD-HDDRLPTADDLHTNFPYLDQ VVKESMRFYMS B_distachyon_Bradi4g MSFTLSSLVYLVAAHPEVEEKLLREIDAFGP---KDVVPSAEELHNNFPYLEQ VLKETMRFFTV S_bicolor_Sb03g MSFTLSSLVYLVAMHPEVEEKLLREIDAFGP---KDVVPSSDDLETKFPYVEQ VVKETMRFYTA B_distachyon_Bradi1g MSFTLSGLAYRVAMHPEVEEKMLSEIDAFGP---KDLVPDAEELNTKFTYLEQ VLKETMRFYSS O_sativa_Os06g TAFTLSSAVYLVAGHPGVEAKLLDEVDRFGPPDAV---PTADDLEHKFPYLDQ VIKEAMRFYTV B_distachyon_Bradi1g TSFTLASAVYLVAGHPEVEAKLLAEIDRY-PPAAV---PTAEDLQQKFPYLDQ VIKEAMRFYTV Z_mays_MAX1A_gi TAFTLSSAVYLVAGHPEVEAKLLAEVDAFGPRGAV---PTADDLQHRFPYLDQ VIKEAMRFYTV S_bicolor_Sb10g TAFTLSSAVYLVAGHPEVEAKLLAEVDGFGPRGAV---PTADDLHHRFPYLDQ VIMEAMRFYTV S_bicolor_Sb04g TAFTLSSVVYLVSCHPRVEEKLLREVDGFAPRHG--RAPDADELQSRFPYLDQ VIKEAMRFHLV Z_mays_LOC TAFTLSSVVYLVSCHPLVEAKLLRELDGFAPRRGRGRAPDADELQSGFPYLDQ VIKEAMRFYVV O_sativa_Os02g TAFTVSSVVYLVSCHPRVEERLLREIDGFAPRGR---VPGADELHAGLPYLNQ VIKEAMRFHLV B_distachyon_Bradi3g TAFTLSSLVYLVSCHRPVEEKLLAELDAFGPQSQ---SPDADELHTKFPYLDQ IIKESMRFHLV P_glauca_MAX1 TSFTISVILYLVSAHPDVESKLLREIDEFGP---PDRNPAAEDLDIKFPYLTQ VIKEAMRFYTV S_moellendorffii_e_gw1.18 TGTNLCYTLYFIAAHPEVASKMVKEIDELAP----LGSTVAFEDVDKFKYVDQ VIKESMRMITF Consensus F Y H E L E D L F Y Q V KE MR Clustal Consensus..: * :: *. ::: *:*.. : * * :: *:**
85 Figure P_trichocarpa_CYP711A8 SPLIARETSKEVEIGGYLLPKGTWIWLAPGVLAKDPKNFP-EPDKFKPERFDPNCEEEKRRHPYALIPFGLGPRACIGQKFSIQEIKLSLIHLYRKYLFR P_trichocarpa_CYP711A7 SPLVARETSKEVEIGGYVLPKGTWIWLAPGVLAKDPKNFP-EPDRFKPERFDPNCEEEKRRHPCALIPFGIGPRACIGKKFSIQEIKLSLIHLYRKYLFR V_vinifera SPLVARETSAEVEIGGYVLPKGTWIWLAPGVLAKDPKNFP-EPDKFKPERFDPNCEEEKQRHPYALIPFGIGPRACLGQKFSLQEVKLSLIHLYQRYVFR C_papaya SPLIARETSKDVEIGGYFLPKGTWVWLAPGVLAKDPKNFP-EPDKFKPERFDPNCEEEKQRHPYAFIPFGIGPRACIGQKFSIQEIKLLLIHLYRNYVFR G_max_04g SPLVARETSNEVEIGGYLLPKGTWVWLALGVPAKDPKNFP-EPEKFKPDRFDPNCEEMKRRHPYAFIPFGIGPRACIGKQFSLQEIKISLIHLYRKYLFR G_max_06g SPLVARETSNEVEIGGYLLPKGTWVWLALGVPAKDPRNFP-EPDKFKPERFDPNFEEMKRRHPYAFIPFGIGPRACIGRQFSLQEIKLSLIHLYRKYLFR L_japonicus_Chr1.CM0133 SPLVARETSNEVEIGGYLLPKGTWVWLALGVVAKDPRNFP-EPEKFKPERFDPKCEEMKRRHPYAFIPFGIGPRACIGQKFSLQEIKLSLIHLYRKYLFR M_truncatula_Medtr3g SPLVARETSNEVEIGGYLLPKGTWVWLALGVLAKDHKNFP-EPEKFKPERFDPNCEEMKQRHPYAFIPFGIGPRACIGQKFSMQEIKLSLIHLYKKYLFR G_max_Glyma17g34530 SPLVARETSNEVEIGGYLLPKGTWVWLALGVLAKDPRNFP-EPEKFKPERFDPKCEEMKRRHPYAFIPFGIGPRACIGQKFSLQEIKLTLIHLYQKYVFR G_max_Glyma14g11040 SPLVAREASNEVEIGGYLLPKGTWVWLALGVLAKDPRNFP-EPEKFKPERFDPKCEEMKRRHPYAFIPFGIGPRACIGQKFSLQEIKLSLIHLYRKYVFR M_truncatula_Medtr1g SPLVARETSNEVEIGGYLLPKGTWVWLALGVLAKDSRNYA-EPEKFKPERFDPKCGEMKRRHPYAFIPFGIGPRACIGQKFSLQEIKLTLIHLYRKYIFR A_thaliana_At2g SPLVARETAKEVEIGGYLLPKGTWVWLALGVLAKDPKNFP-EPEKFKPERFDPNGEEEKHRHPYAFIPFGIGPRACVGQRFALQEIKLTLLHLYRNYIFR O_sativa_Os01g SPLIARETCEQVEIGGYALPKGTWVWLAPGVLAKDPKNFP-EPEVFRPERFDPNGEEEKRRHPYAFIPFGIGPRACIGQKFSIQEIKLSVIHLYRNYVFR O_sativa_Os01g SPLLARETLEQVEIGGYVLPKGTWVWLAPGVLAKDPKNFP-EPEIFRPERFDPNGEEERRRHPYAFIPFGIGPRVCIGQKFSIQEIKLSMIHLYRHYVFR O_sativa_Os01g SPLIARELNQQLEIGGYPLPKGTWVWMAPGVLGKDPKNFP-EPEVFRPERFDPNGEEEKRRHPYALFPFGIGPRACIGQKFAIQEMKLSAIHFYRHYVFR Z_mays_MAX1B_gi SPLVARETSEQVDIAGYVLPKSTWVWMAPGVLAKDPVNFP-EPELFRPERFDPAGDEQKRRHPYAFIPFGIGPRICIGQRFSIQEIKLALIHLYRQYVFR S_bicolor_Sb03g SPLVARETSERVEIGGYVLPKGAWVWMAPGVLAKDAHNFP-DPELFRPERFDPAGDEQKKRHPYAFIPFGIGPRVCIGQKFAIQEIKLAIIHLYQHYVFR B_distachyon_LOC SPLVARESSDKVDIGGYVLPKGTWVWLAPGVLAKDPINFP-DPELFRPERFDPTGDEDKRRHPYAFIPFGIGPRICIGYKFSIQEIKLAIIHLYRQYIFR B_distachyon_Bradi4g SPLIAREASEDVEIGGYLLPKGTWIWLAPGVLAKDPKQFP-DPYVFRPERFDPESEECKQRHPYAFIPFGIGPRACIGQKFSMQQLKLVVVHLYRQYVFR S_bicolor_Sb03g SPLVARQASEDVEVGGYLLPKGTWVWLAPGVLAKDPKDFP-DPDVFRPERFDPESEECKRRHPYAFIPFGIGPRACIGQKFAMQQLKLVVIHLYRNYIFR B_distachyon_Bradi1g SPLVSRETTEDVEIGGYLLPKGTWVWLATGQLSKDPKHFP-DPYTFRPERFDPEDEECKRRHPYAFLPFGIGPRGCPGQKFAMQQLKLVVIHLYRRYVFR O_sativa_Os06g SPLIARETSEQVEVGGYTLPKGTWVWLAPGVLSRDEAQFR-DAGEFRPERFDAGGEEERRRHAYAHVPFGLGPRACPGRRFALQEVKLAMAHLYRRFVFR B_distachyon_Bradi1g SPLIARETSREVEIGGYALPKGTWLWLAPGVLARDPAQFAPDPGAFRPERFEAGSEEEKARHPYAQIPFGLGPRACVGQRFALQEVKLAMVHMYRRFVFR Z_mays_MAX1A_gi SPLIARVTSRQTELGGHTLPKGTWLWMAPGVLSRDAANFE-DPGAFRPERFDPASEEQRRRHPCAHIPFGIGPRACVGQRFALQEVKLSMLHLYRRFLFR S_bicolor_Sb10g SPLIARVTSRRTELGGHELPKGTWLWMAPGVLSRDAASFFPDPGAFRPERFDPASEEQRGRHPCAHIPFGIGPRACVGQRFALQELKLSMVHLYQRFLFR S_bicolor_Sb04g SPLIARQTSERVEIGGYVLPKGAYVWLAPGVLARDAAQFP-DPEEFRPERFAPEAEEERTRHPYAHIPFGVGPRACIGHKFALQQVKLAVVELYRRYTFR Z_mays_LOC SPLIARQTSERVEIGGYVLPKGAYVWLAPGVLARDAAQFP-DPEEFRPERFAPEAEEERARHPYAHIPFGVGPRACIGHKFALQQVKLAVVELYRRYVFR O_sativa_Os02g SPLIARETSEPVEIAGHLLPKGTYVWLAPGVLARDAAQFP-EPEEFRPERFAAGAAEERARHPYAHIPFGIGPRACVGHRFALQQVKLAAVGLYRRYVFR B_distachyon_Bradi3g SPLIARETSEAVEIGGYLLPKGTCVWLAPGVLARDAAQFP-DPDEFRPERFAADGEEERARHPYAHIPFGIGPRACVGHRFALQQVKLAVVGLYRHFVFR P_glauca_MAX1 SPLVAREASEPVQIGGYMLPKGTWVWMALNALAKDPRYFP-EPEMFNPERFDPECEEEKNRHPYANSPFGIGPRACIGMKFAFQEIKVVLIHLYQLYTFD S_moellendorffii_e_gw1.18 SPVVAREAMEDIKVAGYHIPKGTWVWLVINALAQDEEDFP-EPHLFRPERFDPDCAEAKKRHPYAHSPFGIGPRMCIGYKLAYLEMKLALIHFYQRYTFE Consensus SPL AR G LPK W D F F PERF E RH A PFG GPR C G F Q K Y F Clustal Consensus **:::*.:.*: :**.: :*:...:* : :. *.*:**. * : **. * ***:*** * * ::: ::*: :*: : * 85
86 86 Figure P_trichocarpa_CYP711A8 HSPHMEKPLELDFGIVLNFRHGVKLRIVKRT P_trichocarpa_CYP711A7 HSPTMEKPLEFEFGIVLNFKRGVKLRIIKRT V_vinifera HSPNMEKPLELEYGIILNFKHAVKLRAIKRHP----- C_papaya HSPNMENPIELEYGIVLNFKYGVKLRVIKRT G_max_04g HSPNMENPLELQYGIVLNFKHGVKLRVIKRTE-TC-- G_max_06g HSPNMENPLELQYGIVLNFKHGVKLRAIKRKE-AC-- L_japonicus_Chr1.CM nc HSPNMENPLELEYGIVLNFKHGVKVRAIKRTERSC-- M_truncatula_Medtr3g HSADMESPLELEYGIVLNFKHGVKFSVIKRTEMSC-- G_max_Glyma17g34530 HSVDMEKPVEMEYGMVLNFKHGIKLRVIRRT G_max_Glyma14g11040 HSLDMENPVEMEYGMVLNFKHGLKLRVIRRT M_truncatula_Medtr1g HSLNMEKPVELEYGLVLNFKHGIKLRVIKRT A_thaliana_At2g HSLEMEIPLQLDYGIILSFKNGVKLRTIKR O_sativa_Os01g HSPSMESPLEFQYSIVCNFKYGVKLRVIKRHTA---- O_sativa_Os01g HSPSMESPLEF O_sativa_Os01g PSPSMESPPEFVYSIVSNFKNGAKLQVIKRHI----- Z_mays_MAX1B_gi HSPSMESPLEFQFGVVLNFKHGVKLQSIKRHKC---- S_bicolor_Sb03g HSPSMESPLEFQFGIVVNFKHGVKLHVIKRHVENN-- B_distachyon_LOC HSPSMESPLQFQYGVIVNFKHGVKLQVIHRHKE---- B_distachyon_Bradi4g HSPNMEAPLQFQFSIVVNFKHGVKLHVIERNA----- S_bicolor_Sb03g HSPRMEFPLQFQYSILVNFKYGVKVQVIERKN----- B_distachyon_Bradi1g HSPGMEFPLQLEFSIVNNFKHGVKLQVIDREEH---- O_sativa_Os06g RSPRMESPPELQFGMVLSFRRGVKLTAVERRHAAAA- B_distachyon_Bradi1g RSPRMESPPEFQFGMVLSFRHGVKLRAIKRLTRNEAV Z_mays_MAX1A_gi RSPRMESPPELQFGIVLNFKKGVKLVAVERCAAMPL- S_bicolor_Sb10g RSPQMESPPELQFGIVLNFKNGVKLVAVERCAAMS-- S_bicolor_Sb04g HSPAMESPLQFDFDLVLAFRHGVKLRAIRRS Z_mays_LOC HSPSMESPIQFDFDLVLAFRHGVKLRAIRRG O_sativa_Os02g HSPAMESPLQFDFDLVLAFRHGVKLRAIKRTNT---- B_distachyon_Bradi3g HSPDMESPVEFDFDLVLGFRHGVKLRAIRRTND---- P_glauca_MAX1 HSPAMENPLEFQFGIVVSVKYGIRLRLRHRRAQSPV- S_moellendorffii_e_gw HSPAMENPLAVRLSIVVRPIHGVKLRVRKREIC---- Consensus S ME P R - Clustal Consensus * ** *.
87 Table 3-2. Matrix of protein identities for selected MAX1 orthologues Sequence Identity Matrix A thaliana At2g L japonicus Chr1.CM nc L japonicus G max Glyma17g G max 17g34530 G max 06g LOC G max 06g C papaya G max 04g LOC C papaya G max 04g M truncatula Medtr3g M truncatula Medtr3g P trichocarpa CYP711A P trichocarpa CYP711A8 V vinifera GSVIVT M truncatula Medtr1g V vinifera M truncatula Medtr1g G max Glyma14g P trichocarpa CYP711A O sativa Os01g O sativa Os01g O sativa Os01g Sorghum bicolor Sb03g Z mays MAX1B O sativa Os06g Z mays MAX1A B distachyon Bradi4g S bicolor Sb03g B distachyon Bradi1g S bicolor Sb10g G max 14g11040 P trichocarpa CYP711A7 O sativa Os01g O sativa Os01g O sativa Os01g S bicolor Sb03g Z mays MAX1B O sativa Os06g Z mays MAX1A B distachyon Bradi4g S bicolor Sb03g B distachyon Bradi1g
88 88 Table 3-2 Sequence Identity Matrix A thaliana L japonicus G max 17g34530 G max 06g C papaya G max 04g M truncatula Medtr3g P trichocarpa CYP711A8 V vinifera P glauca MAX B distachyon LOC B distachyon Bradi1g O sativa Os02g S bicolor Sb04g Z mays LOC B distachyon Bradi3g S moellendorffii e_gw M truncatula Medtr1g G max 14g11040 P trichocarpa CYP711A7 O sativa Os01g O sativa Os01g O sativa Os01g S bicolor Sb03g Z mays MAX1B O sativa Os06g Z mays MAX1A B distachyon Bradi4g S bicolor Sb03g B distachyon Bradi1g Sequence Identity Matrix S bicolor Sb10g P glauca MAX P glauca MAX1 B distachyon LOC B distachyon LOC B distachyon Bradi1g B distachyon Bradi1g O sativa Os02g O sativa Os02g S bicolor Sb04g S bicolor Sb04g Z mays LOC Z mays LOC B distachyon Bradi3g B distachyon Bradi3g S moellendorffii e_gw
89 89 To investigate further whether the low similarity between Arabidopsis and Selaginella sequences were reflective of divergent function, and hence the late incorporation of MAX1into the SL pathway, the function of SmMAX1 was tested in Arabidopsis, along with that of the gymnosperm white spruce orthologue. MAX1 orthologues were cloned from cdna produced from S. moellendorffii and Picea glauca (bulbils and seeds respectively kindly provided by J. A Banks, Purdue University, USA, and Spencer Reitenbach and Tim Lee of the Tree Seed Centre and Vernon Seed Orchard Company of British Columbia, Canada) and denoted SmMAX1 and PgMAX1. These clones were placed under the control of the strong promoter CaMV 35S in order to ensure high levels of expression, so that complementation tested MAX1 function and not the expression of the transgene. The resulting constructs were transformed into max1-1, and transgenic lines were selected and brought to homozygosity for phenotypic analysis in the T 3 generation Branch phenotype Increased rosette branching, as the most visible phenotype of SL biosynthesis mutants, was used as a sensitive quantitative measure of rescue. To enhance the number of shoot branches for analysis, the method developed by (Greb et al., 2003) was employed, as described previously. For SmMAX1 eight independent transgenic lines were assayed, and for PgMAX1 eleven were assayed, and both 35S::SmMAX1 and 35S::PgMAX1 constructs were found to be capable of complete rescue of max1-1 (Figure 3-6 and Figure 3-7). In addition to the branching phenotype, the height of max mutants is also reduced, a characteristic suspected to be causally linked to the increase in branching, as the same amount of resources are stretched over a larger number of branches. The heights of the individual transgenic lines were therefore compared with their branch numbers, to assess further any differences between transgenic lines by providing a second dimension of variation (Figure 3-8). Although the individual transgenic lines of 35S::SmMAX1 are more variable in their clustering with the Columbia-0 control, both the Selaginella and spruce constructs show the ability to rescue both height and branching.
90 Columbia-0 max1-1 Mean number of rosette branches Columbia-0 max1-1 PgMAX1 max1-1 SmMAX1 max1-1 Mean number of rosette branches c ab a b A 16 No-insert controls max1-1 background B 35S::PgMAX1 35S::SmMAX1 Control Figure 3-6. Rosette branching of Arabidopsis max1-1 mutants complemented with SmMAX1 and PgMAX1 under the constitutive 35S promoter. Branching was assessed by short-day decapitation assay as described by Greb et al. (2003). Data for constructs are (A) mean averages of independent transgenic lines shown in (B), n for each line = 20, except for Columbia-0 and max1-1 for which n=40. (A) Shared letters indicate no significant difference in a Kruskal-Wallis test to P Error bars show standard error of the mean.

91 Mean height (cm) 91 Figure 3-7. Photograph of Columbia-0, max1-1, 35S::PgMAX1 max1-1 line 4.3, and 35S::SmMAX1 max1-1 line 8.3, from left to right, with both transgenics showing rescue. White bar = 40cm PgMAX1 max1-1 SmMAX1 max1-1 Columbia-0 max Mean number of rosette branches Figure 3-8. Branching plotted against height for individual constructs derived from Selaginella moellendorffii and Picea glauca. N =20, except for max1-1 and Columbia-0 where n=40. Height (in
92 92 centimetres) of the longest branch was measured the day of scoring for branching. Error bars show standard error of the mean. Note y axis starts at 20cm Leaf phenotype As rosette leaf shape is also affected in the max mutants, this phenotype was also used as a measure of rescue for the overexpression transgenics. max mutants have rosette leaves with rounder, shorter laminas and shorter petioles than wild-type plants, leading to a smaller rosette diameter (Stirnberg et al., 2002; Lazar and Goodman, 2006). The leaves also curl downwards at the edges, an effect most pronounced in the max2 mutants. However, while easily recognisable neither of these phenotypes is particularly dramatic. Leaf shape is a complex phenotype which, if measured by hand, is time consuming, and relatively few dimensions can be measured accurately. However, the development of geometric morphometric approaches - automated imaging techniques combined with multivariate statistics - has allowed analysis of leaf shape to become a sensitive indicator of changes invisible to the naked eye (Langlade et al., 2005; Micol, 2009; Kieffer et al., 2011). Previous work had indicated that the LeafAnalyser approach developed by Weight, Parnham and Waites (2008) could be used to identify differences between wild type and max Arabidopsis leaves (V. Matser, pers. comm.). LeafAnalyser is an automated image and data analysis program which identifies the margin of leaves within images via an adjustable threshold, and assigns each leaf node numbers, allowing all leaves from one plant to be analysed from a single image. It then calculates positions for the individual leaf tips and the leaf centres (or centroids) based on this margin, aligns these vertically, and plots a user-defined number of evenly spaced landmarks around the leaf margin. The coordinates of these landmarks can then be exported from the program for further analysis, or fed into the statistical analysis side of the program. In this mode the distances between pairs of landmarks are used in a principal component analysis (PCA), which can be used to generate a leaf shape space in which deviations in form between different leaf groups can be compared (Weight et al., 2008; Kieffer et al., 2011). For analysis of the complemented max1-1 mutants, the Columbia wild-type
93 93 and max1-1 mutant plants were grown with two independent transgenic lines each for 35S::PgMAX1 and 35S::SmMAX1 for five weeks, when the adult leaves were removed and scanned to produce images that were analysed with the image analysis mode of LeafAnalyser. The resulting coordinates were Procrustes fitted using the morphometrics program MorphoJ (Klingenberg, 2011). This method produces a calculation of the leaf size based on the centroid the central point as calculated from the mean distance of all the landmarks and then fits all the leaves to the same size, allowing size and shape to be analysed separately. LeafAnalyser was then used to run a PCA on a library of 1500 leaves from ten natural Arabidopsis accessions that had previously been produced by Vera Matser (Kieffer et al., 2011) and Procrustes-fitted by Joe Vaughan of Dr Richard Waites group at the University of York. The eigenvector matrix produced was then used to calculate a leaf point model for each of the leaves from the complementation experiment, which were scaled to the standard deviations of the natural accession database. Ninety-six principal components (PCs) were produced, corresponding to the ninety-six pairs of coordinates (from tip to landmark and centroid to landmark) for the forty-eight landmarks used in creating the leaf data % of the total variation was contained in the first five PCs, with a further 6.32% contained in the next five. In order to determine the salience of the PCs to max mutants, each of the first ten PCs were compared to see which differed significantly between Columbia and max1-1, and LeafAnalyser was used to produce models of the mean leaf and the mean leaf +/- 2 standard deviations to estimate the type of shape variation they explained (see Figure 3-9 for examples). PCs 1 and 4 appeared to show variance in petiole orientation on a right-to-left axis, while PCs 5, 6, 7 and 8 all seemed to represent differences in petiole thickness, either along the petiole or at its junction with the lamina, but none were different between wild-type and mutant. However, PCs 2, 3, 9 and 10 represented phenotypes significantly affected by the max1-1 mutation. From the PC space produced by LeafAnalyser (Figure 3-9) PC2, which explains 26.29% of the total variation, appears mainly defined by leaf width at the base of the lamina and its junction to the petiole. PC3, which contributes 13.66% of the variation, seems to reflect the degree to which lamina area is distributed along the length of the


94 94 whole leaf, and as a result, the lamina: petiole ratio. Finally, PCs 9 and 10, which reflect only 0.88% and 0.79% of the total variation respectively, describe correspondingly subtle phenotypes. PC9 looks like it varies on a left-to-right axis, showing the roundness on one side of the leaf compared to flatness on the other, whereas PC10 seems to correspond to the length of a vector crossing the lamina diagonally from a proximal left point to a distal right point, contributing to the left-to-right axis and a little to the total length. Taken together, the phenotypes affected by the max1-1 mutation represent 41.52% of the natural variation in leaf shape out of the 91.80% of variation considered, as well as its effect on total leaf area. -2 SD Mean +2 SD Overlay PC % PC % PC % PC9 0.88% PC % Figure 3-9. Principal components 1-3, 9 and 10: effect on leaf shape and percent of variation each explained. Overlays: red = 2SD, black = mean, blue = +2SD.
95 95 A Centroid size B PC2 C PC3 D PC9 E PC10 Figure Leaf shape analysis for Procrustes-fitted adult leaves four and above from max1-1 plants complemented with non-angiosperm MAX1 orthologues. Error bars are standard error of the
96 96 mean, calculated on number of plants as n, where n = 15 for controls, and lines 2.6 (n = 10) and 8.3 (n=8) were used for SmMAX1, and lines 1.5 (n=7) and 4.3 (n=8) for PgMAX1. Shown are mean centroid sizes, which corresponds to leaf size (A) and standard deviations from the mean leaf for PC2 (width at centre, B), PC3 (area distribution, C), PC9 (D) and PC10 (E). Letters indicate nonsignificance in Tamhane s T2 post-hoc test at P>0.001 (centroid, PC2) or P>0.05 (PC10) and Tukey s Honestly Significant Difference (HSD) at P>0.05 for PC3 and PC9 (which have equal variances). The leaf phenotypes identified as being affected in max1-1 mutants were then used to investigate the rescue phenotypes of the PgMAX1 and SmMAX1 transgenics (Figure 3-10). As PC3, PC9 and PC10 represent smaller percentages of total variation, the cut-off for significant values was raised from to 0.05 to reflect the smaller changes they convey. Generally, and in opposition to their effect on branching, PgMAX1 lines displayed less rescue over the five phenotypes considered than did SmMAX1 transgenics. For leaf size (as measured by centroid size parameter produced in MorphoJ, Figure 3-10A), PgMAX1 showed no rescue at all, and incomplete rescue for PC3 (3-10C) and PC10 (3-10E), whereas SmMAX1 only showed incomplete rescue for centroid size. However, in terms of PC2 (3-10B) and PC9 (3-10D), both lines rescued. As the branching results were derived from far more independent lines than used for leaf analysis, these results were broken down to see how differences between transgenic lines related to leaf rescue. The two independent lines used for leaf analysis of PgMAX1, 1.5 and 4.3, showed a wide variation in ability to rescue branching (see Figure 3-6), with 1.5 showing the least degree of rescue for all lines of this construct, whereas 4.3 showed more typical complete rescue. Nevertheless, the breakdown of the different lines indicated that the less successful rescue of centroid size and PC10 by PgMAX1 was due to unsuccessful rescue by both lines, not just that of 1.5, whereas for PC2, PC3 and PC9 the relative patterns of rescue were the same as those of the branching data. For SmMAX1, the lines chosen also varied in branch rescue, with 2.6 not being as successful as the fully-rescuing line 8.3, but still less branchy than PgMAX However, for leaf phenotypes 8.3 rescued less well than 2.6 for centroid size, PC3 and PC9, but better than 2.6 for PC10. This may indicate that leaf size, PC3 and PC10 phenotypes are more sensitive to MAX1 activity than PC2 and the branching phenotype, requiring a different threshold for phenotypic change. If so, then it would seem that the spruce homologue of MAX1 is less
97 97 capable than the Selaginella one of rescuing Arabidopsis, despite its closer phylogenetic relationship and protein similarity. 3.5 Discussion The placing of MAX1 in the strigolactones pathway has been a difficult question both from evolutionary and biochemical perspectives. From the biochemical point of view, as a CYP the possible reactions that MAX1 might catalyse are diverse. Outside of the CYP711 clan, MAX1 shows most similarity to the Thromboxane A 2 Synthases (TXAS) of mammals, which carry out two different reactions, an isomerisation and a fragmentation of the hormone Prostaglandin H 2 (Booker et al., 2005). This similarity to TXAS may mean that MAX1 doesn t require molecular oxygen or an electron donor, like the CYP74 family, which also catalyse substrates (allene epoxides) generated by dioxygenases within the plastid. The CYP74s are plastidically localised and act on the dioxygenase products directly, using parts of the substrate itself as the oxygen donor (Booker et al., 2005; Hannemann et al., 2007). However, MAX1 lacks a plastid target-peptide and the precise nature of its substrate is unknown. Grafting studies demonstrated that it is downstream of the mobile precursor that requires MAX3 and MAX4, (Booker et al., 2005), in conjunction with biochemical studies of the SL pathway, which proposed the action of a CYP or CYP-like activities downstream of the carotenoid-derived precursor (Matusova et al., 2005; Rani et al., 2008). Experiments were therefore designed to investigate whether that resulted in any resistance to rescue by a SL analogue, GR24, which is known to be capable of rescuing biosynthetic max mutants in rice and Arabidopsis, although only active at much higher concentrations than endogenous SLs such as 5-deoxystrigol (Gomez-Roldan et al., 2008; Umehara et al., 2008). max1-1 is as sensitive to low levels of GR24 as max4-1, with growth on GR24 reducing rosette branch numbers at the same concentrations in both mutants (Figure 3-2). MAX1, then, appears to be upstream of the synthetic SL GR24 in the pathway, a hypothesis supported by the biochemical and physiological studies of Rani et al. (2008) and Kohlen et al. (2011). In the Kohlen et al. study, Arabidopsis was found to produce 5-deoxystrigol and orobanchyl acetate, as well as orobanchol which had been reported previously (Goldwasser et al., 2008). Both max1-1 and max4-1 mutants lacked detectable
98 98 levels of orobanchol in root exudates, and root and stem extracts from the mutants showed a reduced ability to stimulate germination of the parasitic plant Phelipanche ramosa, a standard assay for SL activity, although 5-deoxystrigol was present in too low a concentration for direct measurement even in Columbia-0. As max1-1 is required for all SL activities tested (shoot branching, parasitic plant germination, and production of orobanchol), it seems likely that it is upstream of all the active SL structures, of which 5-deoxystrigol has been proposed as the biochemical start point (Rani et al., 2008; Kohlen et al., 2011). However, max1-1 resistance (compared to max4) to the addition of 1.25μM GR24 has been reported from work on the role of SLs on root elongation and lateral root suppression (Ruyter-Spira et al., 2011). The dose response curves generated for primary root extension and root hair elongation found by Ruyter- Spira et al. are very different to those found for branching phenotypes in roots, concentrations of GR24 of 1.25μM and 2.5μM promoted elongation, concentrations of 10μM GR24 inhibited it (2011). Such reversals of effect at different concentrations is not uncommon in plant hormones, but had not previously been reported for SLs, and has not been reported for branching in any species studied. These authors postulate that the resistance of max1-1 mutants to GR24 may reflect a dual role of max1-1 in more than one reaction in the production of SL compounds - both reactions necessary to the production of 5-deoxystrigol, and in reactions (such as the hydroxylation reactions proposed by Rani et al., 2008) downstream of this initial compound which enhance the activity of strigolactone structures. Which particular members of the SL compound family are active in shoot branching and root architecture control have yet to be elucidated, and nor have the particular chemical moieties that influence SL effectiveness been found. Indeed, it has been proposed that not only may the different SL species have different purposes, but that the response of different species to SLs may depend on the balances of different strigolactone structures they receive, in a similar manner to pheromone signalling in animals, in which it is the mix of compounds received, rather than any particular compound, that elicits the response (Tsuchiya and McCourt, 2012). As MAX1 was (and, based on the results from Ruyter-Spira et al., remains) a
99 99 possible late step in the biosynthesis of branching-active SLs in Arabidopsis, the hypothesis was raised that its presence in the pathway was a Brassicaceaespecific event, made possible by the relaxation of selection that would have occurred when the Brassicaceae broke their symbiotic relationship with arbuscular mycorrhizzae. However, the experiment used to test this required MAX2 to have coevolved with the structure of the active strigolactone, a point only likely if MAX2 directly interacted with SL as part of the receptor complex. As F-box proteins form receptors in plants for both auxin and jasmonateisoleucine conjugates (Dharmasiri et al., 2005; Kepinski and Leyser, 2005; Katsir et al., 2008), this assumption is plausible. However, a MAX2 homologue from the willow Salix viminalis could not rescue the Arabidopsis max1-1 phenotype. There are a number of possible reasons for this, which include; that MAX1 does not catalyse a late step in bioactive SL biosynthesis, a probability since max1 mutants appear to lack 5-deoxystrigol; that MAX2 is not a receptor and therefore would not influence the reception of the compound detected, and that MAX1 may be active within the Salix viminalis pathway. In addition to MAX1 and MAX2, the identification of D14 in rice added another component to the later part of the SL signalling pathway, for which either a late biosynthetic role or a signal transduction role may be possible. As well as its role in the SL pathway, MAX2 is also required for transduction of the karrikin-related signal, compounds found in smoke, which stimulate germination after fire (Nelson et al., 2011). Although the karrikin and strigolactone pathways are separate in most of their actions, they converge at MAX2, suggesting that there is another component that provides specificity of response in the case of the karrikins this is provided by D14like, a homologue of D14 (Waters et al., 2012). There is no evidence (as yet) that this specificity is due to a role for either of the D14 family orthologues (or MAX2 for that matter) as a receptor, nor that if D14 has a catalytic function it affects the same moiety of the active SL as MAX1, but both are possibilities and it may be that D14 is acting in a similar role to that proposed for the late action of MAX1, as a near-final step in SL biosynthesis. Although the SvMAX2 experiment was inconclusive, the hypothesis that MAX1 incorporation postdates the emergence of the Brassicaceae group was greatly weakened on the basis of the complementation of max1-1 by constructs
100 100 from both conifers and lycopodiophytes, as well as Dr Ward s finding of rescue of max1-1 by 35S::SvMAX1 (Sally Ward, pers. comm.). In addition, researchers working on petunia (Petunia hybrida), another (angiosperm) model for SL signalling, have found that not only can the PhMAX1 orthologue rescue Arabidopsis, but that knock down of PhMAX1 expression causes increased branching in petunia itself, providing the first evidence for MAX1 function in planta in shoot branching control outside of Arabidopsis (Drummond et al., 2012). The ability of SmMAX1, PgMAX1 and PhMAX1 to rescue substantially the Arabidopsis max1-1 branching, height and (for PgMAX1 and SmMAX1) leaf phenotypes shows a conservation of protein function across a wide evolutionary range. Although this does not necessarily reflect a role in SL production in planta of the non-angiosperm species, this conservation does suggest that MAX1 was incorporated fairly early in land plant evolution to the MAX pathway, or even first incorporated and then lost in moss, and that the SL biosynthesis pathway has been substantially conserved throughout that time. This provides an interesting mirror to the Brassicaceae-specific hypothesis for MAX1, as most mosses, like the Brassicaceae, have also secondarily lost the ancestral mycorrhizal symbiosis (Wang et al., 2010). The existence of an active role for SLs in development, if not mycorrhizal symbiosis, has been established in Physcomitrella patens, despite its lack of a MAX1 homologue. Proust et al. (2011) have demonstrated that the moss homologue of CCD8/MAX4 is required for production of several strigolactone compounds reported from angiosperms, including orobanchol, a compound which in Arabidopsis requires the activity of MAX1 for its production (Kohlen et al., 2011). The similarity of the compounds produced by moss to those present in angiosperms could imply that in Physcomitrella a different gene or set of genes has been co-opted to the role of MAX1 in SL production and indeed, it may add weight to the possibility that MAX1 function is a land-plant synapomorphy (possibly even ancestrally required for the AMy symbiosis) that Physcomitrella has subsequently lost over time. However, it is also possible that the reaction catalysed by MAX1 is connected to the long-distance nature of hormone signalling in vascular plants, but which is less necessary in bryophytes, in which tissues are only a few cells thick - perhaps in the conversion to activity of a more stable precursor better suited to long-distance transport. Although no MAX1 orthologues have yet been
101 101 found in other bryophytes, the sequencing of the Marchantia polymorpha genome will contribute to this question, as liverworts are the most basal extant land plants, the only group thought to have diverged from other land plants before the mosses, and they also form AMy symbioses (Willis and McElwain, 2002; Qiu et al., 2006). The use of both leaf phenotypes and branching/height phenotypes to investigate function of the transgenes in Arabidopsis raised some interesting points, particularly the mismatch in the degree of rescue between different phenotypes. Although both constructs are capable of rescuing max1-1 completely in terms of branching and height, and although PgMAX1 shares higher protein similarity with AtMAX1 than does SmMAX1, this construct was less able to rescue the leaf size and shape phenotypes of the leaves. Little is known about the mechanism of SL action in leaf development, and to determine the significance of these effects requires repetition of the leaf experiment, but these results may indicate that leaf phenotypes are influenced to different degrees or by different aspects of MAX pathway than those of branch outgrowth. As leaf lamina size is highly sensitive to incorrect (higher or lower) concentrations of auxin during leaf development (Ljung et al., 2001), this may explain the high threshold requirement for SLs to rescue phenotypes such as centroid size, as this sensitivity may amplify the effects of tiny changes in auxin transport generated by perturbation of SL concentration, which are not sufficient to affect branch outgrowth. Indeed, in the case of centroid size particularly, GR24 treatment itself has been found to reduce leaf size, and to delay vascular development through its effects on auxin signalling (Ruyter- Spira et al., 2011). Further work on leaf shape determinants will help to unravel whether other leaf shape phenotypes are similarly affected, although the general similarity of those measured here with the branching results suggests not. However, in whatever way the hormone they produce may be acting, the ability of both MAX1 constructs to rescue most Arabidopsis MAX pathway phenotypes implies that protein similarity, in the case of CYPs at least, is not necessarily a good guide to function, but that both lycopodiophytes and gymnosperms may conserve SL signalling and a role for MAX1 in the biosynthesis of these hormones.


.")
. Figure 4-1. Sample body plans of the sporophyte generation of five of the seven major extant land plant groups.")
102 102 Chapter 4. Roles for Strigolactones in Non- Angiosperm Species Given the presence of all the known genetic components required for SL synthesis and signalling in vascular non-angiosperm taxa, and the presence of SLs in even more distant taxa (Proust et al., 2011), what of the physiological and developmental roles of SLs in these diverse groups? Of the three extant non-angiosperm lineages of vascular plants the gymnosperm lineage are almost entirely perennial, and most are large trees or shrubs, whereas the extant lycopodiophytes more closely resemble mosses in size and shape, as is reflected in the clubmoss and firmoss names of many species, although extinct members of this group formed the forests of the Carboniferous (Willis and McElwain, 2002). Between these groups, the extant ferns (moniliphytes) span the full range from short-lived, tiny annuals to the impressive perennial structures of tree ferns, some reaching twenty meters in height (Bell and Hemsley, 2000; Willis and McElwain, 2002). Figure 4-1. Sample body plans of the sporophyte generation of five of the seven major extant land plant groups. From left to right: Medicago seedling (angiosperm), spruce seedling (gymnosperm), young c-fern (moniliphytes), section of Selaginella kraussiana (lycopodiophyte), gametophyte of Physcomitrella with sporophyte in orange at tip of gametophore (mosses). Leaf equivalents are shown in green, active meristems in red, dormant meristems (or similar structures) in blue. All diagrams approximately life-size.
103 103 Most gymnosperms (particularly conifers and Ginkgo) share recognisably similar body plans to angiosperm trees, including determinate, multiveined leaves, indeterminate and iterative shoots producing branches from axillary meristems, and bipolar embryos with roots derived from a root apical meristem (Steeves and Sussex, 1989; Bell and Hemsley, 2000). However, the body plan of the lycopodiophytes is very different to that of angiosperms, as they form branches by the dichotomous division of the shoot tip, and produce leaves which generally have at most one vascular trace (although some Selaginella spp. have more than one, bifurcating trace), rather than the ramifying patterns of angiosperm leaves (Willis and McElwain, 2002). Ferns are different again, and as varied as angiosperms in their body plans. The leaf-like fronds of ferns grow in an iterative pattern somewhat like angiosperm shoots, although these fronds may divide dichotomously, and produce a limited number of determinate modules (pinnae) rather than indeterminate branches - except where the fronds may be so indeterminate as to produce entire new plants on the leaf margin. The fronds themselves are produced from an axis that may be above ground or rhizomatous, that in some taxa branches dichotomously, but that can in some taxa produce other indeterminate branches from dormant buds (Bierhorst, 1971; White and Turner, 1995; Bell and Hemsley, 2000). This great variety of vascular plant body plans, moreover, only apply to the sporophyte generation (the dominant generation in all of these groups), and not to the gametophytes, which arguably vary even more between the lineages. In such a variety of forms, has evolution of SL signalling in branching control taken the same path in each? In moss, SLs are involved in controlling filament branching of the gametophyte and restricting colony extension in a quorum sensing-type manner coordinating the growth of different colonies, but not, of course, of branching of the single-axis sporophyte (Proust et al., 2011). In angiosperms, SLs are not just involved in branch outgrowth control, but play roles in a wide range of developmental processes in the sporophyte plant height and cambial thickening in the shoot, lateral and adventitious root and mycorrhizal symbiosis formation below ground, germination and photomorphogenesis in seedlings, and are regulated by phosphate and sometimes nitrogen availability (and Xie et al., 2010; Agusti et al., 2011; Foo
104 104 and Davies, 2011; and reviewed in Koltai, 2011; Toh et al., 2012; Tsuchiya and McCourt, 2012; Yoneyama et al., 2012). The unifying and conserved factor between the angiosperm and moss processes seems to be coordination of development and restriction of growth, suggesting that this was the ancestral role. However, which particular aspects of plant development are under the influence of SL signalling in the non-angiosperm, sporophyte-dominant vascular lineages is more difficult to hypothesise, except where those processes are clearly analogous to SL-controlled processes in angiosperms. Physiological experiments on Picea abies (white spruce), Ceratopteris richardii, (c-fern) and Selaginella kraussiana were therefore developed to establish systems for studying the effects of SLs on axillary branching (where applicable) and in responses to phosphate limitation across a wide span of plant forms, to enhance the understanding of SL evolution in physiological as well as genetic terms. 4.1 Gymnosperms - Picea glauca The gymnosperms are the most closely related group to the angiosperms, and with the exception of their reproductive biology (and the stranger species of the Gnetales, particularly Welwitschia mirabilis) they appear to share many developmental mechanisms with that group. Conifers in particular share axillary branching patterns with those of angiosperms, including the repressive action of auxin in the maintenance of apical dominance and the promotive effect of cytokinins on production and outgrowth of axillary buds (Cline et al., 2006). Likewise, auxin and its polar transport via PIN family proteins are known to be required in gymnosperms for developmental patterning in embryos, KNOX family genes specify meristematic zones, and at least some of the factors governing adaxial-abaxial polarity in leaf formation (important, in eudicots, to the specification of axillary meristems) are also conserved (Sundås-Larsson et al., 1998; Floyd and Bowman, 2006; Larsson et al., 2008; Palovaara et al., 2010; Larsson et al., 2012). Based on these similarities in development the possibility that SL signalling in branch outgrowth control might also be held in common between angiosperms and conifers was explored. White spruce was chosen as a representative of the gymnosperms because it is a commercially important forest tree for which large-scale EST sequencing and genome mapping resources are becoming available (Rigault et al., 2011). Database
105 105 searches revealed potential orthologues of several MAX genes, including MAX1, MAX2 and MAX4, from both white and Sitka spruce (P. sitchensis, a close relative of white spruce). Experiments were then designed based on the hypothesis that the axillary meristems of spruce were under similar developmental control as those of angiosperms, and that SLs would therefore be implicated in the outgrowth and breaking of dormancy in axillary buds. Given the important role that dormancy of apical meristems plays in the development of many temperate perennial species, and that there are aspects of similarity between this process and that of axillary meristem dormancy (Rohde and Bhalerao, 2007) the hypothesis that the control of SLs may in such species extend to control of the apical bud was also investigated. As conifers are mostly trees or shrubs and are all perennial, many also share with angiosperm trees the ability to suspend growth temporarily to survive unfavourable conditions, the phenomenon of seasonal dormancy (Tudge, 2006; Rohde and Bhalerao, 2007). Superficially, this dormancy is often evident from the formation of buds at the meristems structures containing the meristem, and often the prepatterned primordia that will expand upon reactivation to form the following season s growth, all encased in a protective covering, the bud scale (Sutinen et al., 2009). However, dormancy defined by production of the bud scale is deceptive, as although growth cessation is a prerequisite for dormancy, bud formation is not, and even then buds may reactivate growth if conditions remain or return to being favourable within a certain time, sometimes termed second flushing, where flushing is used to describe bud break and active growth (Rohde and Bhalerao, 2007). Dormancy itself has been more usefully defined by Rohde and Bhalerao (2007) as the point at which growth cannot be reactivated by the return of favourable conditions for considerable time (Olsen, 2010). This is sometimes also referred to as endodormancy, to distinguish it from ecodormancy, in which dormancy is maintained after the point at which the bud is capable of reactivating due to unfavourable environmental conditions, or paradormancy, in which dormancy is imposed on the bud by other parts of the plant (as reviewed by Rohde and Bhalerao, 2007). The onset of endodormancy is promoted by changes in photoperiod and temperature, as well as endogenous factors such as hormones, including gibberellins, abscisic acid and auxin, and
106 106 the requirements for these different factors vary between different plants (and reviewed by Rohde and Bhalerao, 2007; and Olsen, 2010; Baba et al., 2011). At least some of the molecular aspects of photoperiod signalling in connection with growth cessation, the PEPB gene family, are conserved between the angiosperm model tree poplar (Populus spp.) and the spruce species Picea abies (Norway spruce) and Picea sitchensis (Gyllenstrand et al., 2007; and reviewed in Olsen, 2010; Karlgren et al., 2011). A role for SLs has not yet been demonstrated in control of seasonal dormancy or growth cessation in any species, but given its other actions, this possibility was investigated in spruce both as a model conifer and as a model tree Initial decapitation studies and protocol development Initial experiments focussed on the establishment of decapitation and hormone application systems similar to those used in Arabidopsis. First-year seedlings of spruce were used for experimentation for two reasons. Firstly this eases the production of sample material, and secondly because spruce is a determinate tree species. For the first few years of growth (and particularly the first year) the patterning and expansion stages of stem and leaf development happen within the same season ( free growth ). In indeterminate species free growth may occur also in older plants, but in older plants of more determinate species patterning and formation of stem units increasingly occurs in the preceding year, with the current year s growth merely being the expansion of these preformed units (Gyllenstrand et al., 2007; Olsen, 2010; El Kayal et al., 2011). The use of seedlings therefore allowed visualisation of any developmental changes within the same season. To test for an effect on outgrowth of individual buds in spruce, the excisedbud assay developed for Arabidopsis by Chatfield et al. (2000) was adapted to investigate the effects of auxin and SL on spruce axillary buds (Figure 4-2A). In these experiments, excised nodal segments carrying a bud were treated with auxin (β-naphthoxyeacetic acid NAA - a synthetic auxin, apically), with or without GR24 (supplied basally). In Arabidopsis, apical auxin inhibits outgrowth of axillary buds in an apical-dominance-like effect, which is accentuated by the presence of GR24 in the basal medium (Chatfield et al.,
 or externally supplied, it has no effect on bud growth (Chatfield et al., 2000; Crawford et al., 2010).")
.")
107 ; Crawford et al., 2010). When GR24 is supplied in the absence of an auxin source, whether natural (e.g. from another bud) or externally supplied, it has no effect on bud growth (Chatfield et al., 2000; Crawford et al., 2010). As the bud scale of spruce axillary buds limits changes in bud length (the measurement used for Arabidopsis experiments) instead the number of buds in which the bud scale split (bud burst) was recorded over time. A B Figure 4-2. Excised bud assay adapted from that described for Arabidopsis by Chatfield et al. (2000). A) Sections of stem with well-developed buds from actively growing shoots were excised, surface sterilised and placed between nutrient agar blocks containing the synthetic auxin NAA or ethanol carrier above, and synthetic SL GR24 or acetone carrier below (picture from a different iteration of this experiment to results shown). B) The number of buds showing outgrowth activity (bursting through the bud scale) recorded every 2-3 days, N = 15 for each treatment. The response from a single replicate (Figure 4-2B) might suggest a pattern of reduction in bud burst in response to auxin, as would be expected from the angiosperm model. However, the difficulty of cleanly excising nodal segments with appropriate buds from stems with such close-set needles, the quick contamination of the agar plates, the slow nature of the growth response in spruce and the large amount of material required for this experiment rendered it impractical to repeat on the larger scale needed for reliable results. A similar
108 108 attempt to use larger explants in liquid medium tubes killed most of them before developmental changes were seen, and seeds planted on agar did not germinate. Given the difficulty of growing the spruce in axenic conditions, experiments with whole plants on soil were attempted. Plants were chosen that had formed dormant apical buds with bud scales (hereafter referred to as apical buds) because this allowed use of plants that were at a similar stage of activation and facilitated the easy removal of the apical meristem (presumably the principle auxin source) without damaging too many of the surrounding leaves (Figure 4-3A). Lanolin containing a natural auxin, 10μM indole-3-acetic acid (IAA), or the ethanol carrier as a control, was applied at the time of decapitation to the cut surface (Figure 4-3B), and 5μM GR24 (or the carrier acetone) was applied to the lower stem once a week in a PEG-based mixture adapted from that used for Arabidopsis bud applications by Gomez-Roldan et al. (2008). Outgrowth of tissue was measured from all axillary buds on the plant every 2-3 days for a month. Tissue outgrowth was seen from all treatments within 9 days of the start of the experiment, and within a month all treatments had an equal number of outgrowing branches or buds, however this outgrowth was not from axillary buds such as those shown in Figure 4-3C and D. Even though there were no significant differences seen between treatments at any time point (with the exception of the undecapitated controls, Figure 4-3E), a possible suppression of outgrowth at the 19 day stage by GR24 suggested that further investigation might be warranted. The suppression of outgrowth by apical auxin seen in the split plate assay described above was not repeated. However, outgrowth only occurred from the area of the cut surface, not from previously-formed visible axillary buds on the main stem, suggesting that it was either being produced from preformed axillary bud primordia remaining from the incomplete decapitation of the apical bud, or arose from that tissue as a wound response. As a result of the outgrowth occurring directly from the cut surface, the lanolin applied was therefore also in direct contact with these outgrowing branches, so that the auxin would be supplied directly to the bud, not via the stem as intended, potentially confounding the results (Figure 4-3B). The source of the outgrowth was therefore investigated in order to provide information for the

 as indicated.")

 & B) Dormant apical bud before and after decapitation, with B showing outgrowing branch with lanolin still adhering")
109 Mean number of branches emerging after 19 days 109 redesign of the protocol. A B C D E Decap. Decap. + auxin Decap. + GR24 Decap. + auxin + GR24 Control Figure 4-3. Decapitation experiment on white spruce. Branch buds in Picea glauca (white spruce). Plants were decapitated, cut surfaces treated with lanolin with or without 10mM IAA (auxin) as indicated. 5µM GR24 (or acetone carrier) was applied to the stem below the first needles every 2-3 days for one month, and plants were photographed at the same time for one month and sporadically thereafter. Controls were not decapitated, although new branch production was scored. A) & B) Dormant apical bud before and after decapitation, with B showing outgrowing branch with lanolin still adhering to the needles. C) & D) Axillary buds (arrows). E) Mean number of branches or new buds produced by 19 days after decapitation, the first point at which different branches could be
 Error bars are standard error of the mean.")


 Apex, decapitated two weeks previously, under compound microscope, and B) a similar apex under SEM.")
110 110 discerned from the general outgrowth and healing of the apical tissue and the only point at which means between different treatment showed much difference, although no differences were significant (ANOVA, P 0.05) Error bars are standard error of the mean. In order to identify the origin of the outgrowing branches in the decapitation experiment, and to judge whether they were derived from ab initio development from the meristematic apical cut surface or from invisibly small axillary buds close to the apex, actively growing plants were decapitated mid-stem for comparison. Two weeks post-decapitation, at which point almost all the apically decapitated plants had produced outgrowth, the actively growing plants showed no sign of new outgrowth close to the cut surface, nor from axils without visible buds close to the meristem, when inspected either by eye or when examined under a Scanning Electron Microscope (SEM, Figure 4-4A-D, n = 6 plants investigated). A B C D * Figure 4-4. Axillary buds in actively growing white spruce that has been decapitated A) Apex, decapitated two weeks previously, under compound microscope, and B) a similar apex under SEM. Arrows show axils (all empty). C) Close up of an empty axil. D) Actively growing apical meristem (star), with some needles removed to reveal it. This supported the hypothesis that the branches produced in the original decapitation experiment were either wound responses, or activation of axillary
111 111 meristems from nodes within the bud scale, or that nodes near the apical bud meristem have a different developmental potential than more mature nodes further down the stem. Thereafter, only plants that were actively growing or about to break dormancy were used for experimentation, as the decapitation response during active growth seemed more likely to be analogous to that of decapitation in annual angiosperm model plants. In addition, in further decapitation experiments efforts were made to decapitate the entirety of the apical bud, while balancing this with avoiding damage as much as possible to surrounding tissues Long term effects of SL application Having determined that plants with dormant apical buds react in a different manner to those actively growing, to investigate the effects of GR24 on active growth an induction system was adapted from that of Little and MacDonald (2003) to synchronise the release of apical buds from dormancy. Seedlings were germinated and grown for 2 months in short day conditions, (although in the April replicate this was extended by one month) so that seedlings formed dormant apical buds immediately. Plants were then moved to long day conditions in the greenhouse to synchronise re-activation. At this point, a longterm experiment was employed to investigate the action of GR24 in the development of undamaged plants. By three weeks after induction almost all plants had reactivated, and from that point 100μl GR24 at 0, 1 or 10μM in 1% acetone was added to the soil at the base of the plant to encourage uptake by the roots (Figure 4-5A). The hormone concentrations were chosen to maximise the possibility of discerning an effect of the GR24. Treatments were applied and the plants were scored for a range of phenotypes once approximately every 8 days for 136 days, at which point in the first two replicates of the experiment, most plants had ceased active growth and formed dormant scaled apical buds. During the experiment several of the apical and (in some cases) axillary buds went dormant and then reactivated in cycles of activity, sometimes more than once, although this varied a lot between plants and replicates. However, the final dormancy at the 136 day time point was more-or-less collectively reached by
 experimental set up, with a pot containing two plants, arrows showing point of hormone application.")

112 112 the plants of the first two replicates, with several of the plants having been dormant for several weeks. A B C Figure 4-5. Long term GR24 dosing experiment: A) experimental set up, with a pot containing two plants, arrows showing point of hormone application. Plants were planted one or two to a single 8cm pot, with equal numbers of one- and two- plant (and in the April replicate, one three-plant pot each) per treatment. Grid behind is of 10mm squares. B) Time to the first time that the apex forms a dormant bud and C) the number of times that the dormant apical bud then reactivates over the experiment time period, across three replicates at different times of the year (labelled with month of
113 113 planting on soil). N = for the October and April replicates, and for the June replicate. Error bars are standard error of the mean. In this experiment neither the addition of 1μM nor 10μM GR24 were sufficient to produce consistent or significant effects across three replicates, in either of the apical bud activity phenotypes measured (Figure 4-5B and C) or the axillary bud ones (Figure 4-6). Although the number of reactivations of the apical meristem (after dormant apical bud formation) was consistently greater with application of 1μM GR24 than on acetone application, this was never significant and was not consistently observed with 10μM GR24 (Figure 4-5C). Likewise, the October and April replicates hinted at the possibility of a promotion effect of 1μM GR24 on the length of time axillary branches spent in active growth, followed by a suppression effect at 10μM GR24, a pattern consistent with the action of some hormones, including that of GR24 in Arabidopsis root phenotypes (Ruyter-Spira et al., 2011), but this pattern itself was reversed in the final replicate (Figure 4-6D). No consistent effects were seen in the number of dormant or active buds and branches produced, activated (by number or proportion proportions not shown), or in when they first became active (Figure 4-6A-C). In addition in the final replicate the height of the main stem and the width of the stem base were measured at the end of the experiment, and again no clear effect of the hormone applications was evident (Figure 4-7). Considerable variation between replicates was observed. Plants in the first two replicates generally had ceased active growth at least once by the end of the 136 days, whereas plants in the final June replicate took far longer to form dormant apical buds, although once dormant they were just as likely, on average, to reactivate (Figure 4-5B and C). Plants in the June replicate also produced considerably more axillary buds, of which a larger proportion activated and did so more quickly, contributing to the higher mean time spent active by axillary buds in this replicate than for the others, although the second replicate was also more active than the first (Figure 4-6). This increased degree of growth by the second and third replicates may reflect the time of year at which they were planted, as the April and June replicates were moved into the greenhouse in July and September respectively, whereas the first replicate was

114 114 induced at the end of December, so that growth for this replicate started at the coldest and shortest natural day length time of the year. Although the temperature in the greenhouse is controlled and the light period supplemented with artificial light, this does not completely disguise the seasonal changes, and plants may have responded to this by limiting their growth. Against these seasonal changes, no consistent effect of GR24 application could be discerned. A B C D Figure 4-6. Long term GR24 dosing experiment: A) total number of visible axillary buds formed per plant, B) the number of those buds that activated during the experiment, C) time to the first time that an axillary bud activated for each plant, D) the amount of time each bud spent active during a single phase of activity per plant (averaged over several all cycles of activity per bud, where
 final height and B) stem width for the June replicate. N = 32-34. Error bars are standard error of the mean. 4.1.")
115 115 applicable, with non-activating buds scored as zero). N = for the October and April replicates, and for the June replicate. Error bars are standard error of the mean. A B Figure 4-7. Long term GR24 dosing experiment: A) final height and B) stem width for the June replicate. N = Error bars are standard error of the mean SL effects on dormant apical bud formation As the long term experiment did not produce any consistent result of application of GR24, the induction system was adapted further to see whether in more environmentally-controlled conditions, slight effects of SL addition could be discerned. Firstly, the hypothesis that SL might be involved in the control of apical growth and particularly the development of dormant apical buds was investigated in more detail. The induction system used in the long-term experiment was employed, but instead of germinating plants in short day (8 hour light, at C) to induce dormancy they were instead germinated in warm long day (16 hours light) conditions at 24 C. After one month, when all the plants were actively growing and some had produced visible (although not active) axillary buds, the plants were moved to short day conditions at 20 C to provide conditions conducive to the formation of dormant apical buds. At this point, and once a week thereafter, the plants were dosed as for the long-term experiment, although only with the control and 1μM GR24 concentrations to increase the sample numbers and improve the statistical power of the experiment. 1μM GR24 was chosen for its possible promotive effect on apical
 than for the long term experiment to increase the resolution of the timing information.")
116 116 bud reactivation in the first two replicates of the long-term experiment. The plants were also scored more frequently (three times a week) than for the long term experiment to increase the resolution of the timing information. However, even with these measures, no difference was seen in the time taken for the apex to form a dormant apical bud (Figure 4-8) demonstrating that at these concentrations and under these conditions, GR24 has no effect on the cessation of active growth in apical meristems in white spruce. Figure 4-8. Short term apical dormancy experiment: Time taken for apical buds to form in spruce in short day conditions, when dosed with GR24, across three replicates. No differences were significant (Student s t-test). N= 35 for replicates 1 and 2, and N = 48 and 50 (acetone and 1μM GR24 respectively) for the third. Error bars are standard error of the mean SL effects on outgrowth after decapitation Having established that there is no effect of GR24 on apical activity either over a season of growth or in dormancy-inducing conditions, further investigation was made on the effect of SLs in control of apical dominance and branch outgrowth, using the more controlled protocol from the short-term apical bud dormancy experiment. Plants from the control group of the short-term apical bud experiment were allowed to remain in short day conditions for a total of 131 days, and then returned to long day, warm (24 C) conditions. Within two weeks of movement to long day conditions 80% of the first replicate, 64% of
117 117 the second replicate and 33% of the third replicate had reactivated at the apex, and of the reactivating plants, some had also actively growing branches. At this point, plants were either decapitated or left whole, and dosed once a week with 5ml of 0μM (for control and decapitated plants) or 10μM GR24 (decapitated plants only) to each pot, to ensure delivery of the hormone to the roots. The time of bud break of each axillary bud was then measured over three weeks, by which time axillary buds on several plants (11 and 9 respectively) in the first two replicates had returned to dormancy, although only two plants had in the final replicate. No consistent pattern was seen in the time taken for axillary buds to break dormancy across all three replicates (Figure 4-9A). However, in the first and second replicates, a reduced percentage of axillary buds activated in the undecapitated plants compared to the mock-treated plants, as shown in Figure 4-9. This effect may be contributed to by the continued growth of the main stem in the control plants, which also produced more axillary buds, although several of these also activated. In the first replicate the application of GR24 appeared to attenuate the effect of decapitation, so that the GR24 plants were, although still statistically similar to the decapitated, mock-treated group, also statistically similar to the control group. Although the effect of decapitation was repeated in the second replicate, the GR24-associated effect was not, and in the final replicate no differences were seen in any treatment. For these experiments, care was taken to decapitate below the bud scale, to reduce the incidence of the putative wound-induced outgrowth described above. Nonetheless, some outgrowth of this type was seen, which might have reestablished apical dominance, confounding the effects of decapitation on more basal axillary buds. When those plants that showed apical outgrowth within 10 days of the start of the experiment were removed from the results, the patterns of outgrowth did not change in first or third replicate (Figure 4-9B), as only a few plants were affected, but in the second replicate, the pattern of response to GR24 from the first replicate reappears, although the sample sizes for this replicate are also then very low (only 5 and 4 for the two decapitated samples). The results from the first two replicates suggest that this experiment may be worth repeating with larger sample sizes (which were particularly low for this experiment due to lack of material), but from this data few conclusions can be
 N=10-12 for replicate 1, n=11 for replicate 2 and n=14-17 for replicate 3. B) Same data as A, but with plants showing outgrowth from the apex within 10 days of decapitation removed.")
118 118 drawn for the effect of GR24 on axillary bud outgrowth after decapitation. A B Figure 4-9. Percentage of axillary buds of white spruce activating within three weeks of decapitation of the apex. A) N=10-12 for replicate 1, n=11 for replicate 2 and n=14-17 for replicate 3. B) Same data as A, but with plants showing outgrowth from the apex within 10 days of decapitation removed. N=9, 9 and 12 for decapitated with acetone, decapitated with GR24, and undecapitated respectively for replicate 1, n=5, 4, and 11 for replicate 2 and n=16, 16 and 14 for replicate 3. Same letters indicate non-significance in an ANOVA using Tukey s HSD post hoc test, P Error bars show standard error of the mean.
119 SL genes and phosphate response The conservation of SL signalling in response to nutrient limitation was investigated by analysis of gene expression. The upregulation of SL biosynthesis in response to limited phosphate availability has been reported for a number of species, including Arabidopsis, pea, rice, tomato, red clover, alfalfa, and wheat (Yoneyama et al., 2007; Lopez-Raez et al., 2008; Umehara et al., 2010; Balzergue et al., 2011; Jamil et al., 2011; Kohlen et al., 2011; Yoneyama et al., 2012). In rice, this upregulation of synthesis was concomitant with upregulation of biosynthetic MAX gene orthologues, including three of the five OsMAX1 orthologues (Umehara et al., 2010). Upregulation of the petunia orthologue of MAX4 on phosphate starvation has also been reported (Breuillin et al., 2010). In order to establish whether spruce shared this response, quantitative (Q-) PCR was used to measure the effect of phosphate limitation and replacement on mrna abundance for spruce orthologues of the MAX genes. A phosphate-limited environment was created by growing seedlings on sand and terragreen, supplemented by addition of liquid half-strength Murashige & Skoog medium (1962) once a week. After 6 weeks, when seedlings were established and had started to produce visible axillary buds, the pots were washed three times with dh 2 O and subsequently the KH 2 PO 4 phosphate source in the medium was replaced with equivalent molar KCl. The plants were allowed to grow without phosphate for one week, and then leaf and root material was collected for analysis ( Day 0 ). Phosphate was then added back to the medium, and after one week s growth on phosphate plants were again collected for analysis ( Day 7 Adding Pi ), along with plants that had remained on the no-phosphate treatment as a control group ( Day 7 No Pi ). Identification of PgMAX1 is described in chapter 3 and spruce orthologues for MAX2 and MAX4 were identified from EST collections by reciprocal BLAST searches. The degree of expression of these genes was measured by Q-PCR, and normalised to the expression of two endogenous controls (PgTUB and PgTIF- 5α) previously reported by Abbott et al. (2010) and El Kayal et al. (2011). Of the three MAX genes investigated, only PgMAX4 was significantly affected by the treatment, and then only in the shoots. The plants remaining on low
120 120 phosphate had significantly lower expression of PgMAX4 than those at the start of the experiment (Figure 4-10). PgMAX4 was also expressed at significantly higher levels in roots compared to shoots to (p in Dunnett s T3 test). Despite the non-significance of most of the differences, the pattern of changes between times and treatments of PgMAX1 and PgMAX4 in shoots and roots were very similar, while that of PgMAX2 was different and far less responsive in general (showing no difference between tissue types either). PgMAX1 and PgMAX4 both showed indications of downregulation in the roots after a week with phosphate resupply, whereas they did not show much change after the second week without a phosphate source, a pattern that would be consistent with a downregulation of SL production in roots seen in Arabidopsis and rice, and not unlike the pattern reported from rice by Umehara and co-workers in the rice biosynthetic genes orthologues (2008; 2010; Kohlen et al., 2011). In contrast in shoots, both genes showed downregulation after 7 days under either treatment, but here it was the no-phosphate control that was lowest. PgMAX2 showed very little change between treatments, times or tissues, consistent with the lack of response of the rice orthologue D3 to changes in phosphate availability, and general ubiquity of expression of MAX2 orthologues in several species (Johnson et al., 2006; Stirnberg et al., 2007; Umehara et al., 2010; Drummond et al., 2012). These results support the possibility that SL biosynthesis, but not signal transduction, is upregulated in response to phosphate starvation.
121 121 ** * Figure Response to limitation and re-addition of phosphate (Pi) in PgMAX1, PgMAX2, PgMAX4 and PgSQD1 gene expression, in roots or shoots (needles, stem and axillary buds). Plants
122 122 were starved of phosphate for one week, collected, and then either starved for a further week or had the phosphate source returned, and gene response measured. Expression of test genes is normalised to the geometric mean of two endogenous controls, and the data presented for the PgMAX genes are the mean of two biological replicates, each technically replicated 3 times. Data for PgSQD1 are means of one biological replicate only. *** = significant difference to Day 0 sample at P<0.001, ** = P<0.01 and * = P<0.05 in Dunnett s T3 post-hoc test, star colour indicating treatment. Y axis is in log 2, and error bars are standard error of the mean. As a positive control of phosphate starvation, for the second biological replicate, a fourth test gene was included a spruce orthologue of SQD1 (At4g33030). SQD1 was identified in Arabidopsis as a potential smart indicator gene for phosphate starvation, as it is upregulated specifically in response to withdrawal of phosphate (Hammond et al., 2003). This upregulation is also conserved in the moss Physcomitrella patens (Wang et al., 2008), so the potential spruce orthologue was identified by reciprocal BLAST searches and included to gauge the efficiency of the phosphate starvation treatment. Although based on only one biological replicate, unlike the other genes that were based on two, the PgSQD1 gene did show slight, significant upregulation on the low phosphate treatment compared to the start of the experiment, and more significant upregulation (at p=0.003 in Dunnett s T3 post-hoc test) compared to the high phosphate treatment, although this upregulation only occurred in shoots. In roots, PgSQD1 expression appeared to be down regulated, although the change was not significant. AtSQD1 is required for sulpholipid biosynthesis in leaves, and is involved in response to reduced phosphate availability by supporting the replacement of phospholipids in thylakoid membranes of chloroplasts with sulpholipids (Essigmann et al., 1998). Because of this leafbiased role, the expression of SQD1 in roots may not relate to plant phosphate status. In support of its leaf-based role, PgSQD1 was expressed at significantly higher levels in shoots compared to roots (p=0.006, Dunnett s T3). To investigate further and confirm the phosphate response, and investigate whether the addition of GR24 had a feedback effect on the expression of the MAX3 and MAX4 SL biosynthetic genes, as reported for Arabidopsis by Mashiguchi et al. (2009) a similar experiment was repeated, but with three changes intended to increase the degree of phosphate starvation (Figure 4-11). Instead of washing the substrate to reduce any adhering phosphate, plants were
123 123 moved to a new sand and terragreen mix in clean pots, and this move was done after only three weeks of growth. Plants were then grown on this mix without any phosphate added for 6 weeks before the first samples were taken. Phosphate was then resupplied to the plants as in the previous experiment, and samples taken for analysis the following week. In addition, in this experiment as well as phosphate, half of the plants were also treated with 1μM GR24. As the seedling mortality rate in two replicates of this experiment was quite high, the limited number of plants meant that no-phosphate Day 7 samples were excluded from the first replicate, (the second replicate was lost entirely) so that data for these conditions only derives from a single biological replicate (the third). In three of the four conditions tested after seven days both PgMAX1 and PgMAX4 showed significant upregulation in roots, repeating their pattern of shared expression from the previous experiment (Figure 4-11). Curiously, this upregulation occurred on both the no-phosphate conditions with or without GR24 but also when both GR24 and phosphate were added. The only condition with no significant upregulation was that to which phosphate only had been added. Upregulation in a situation which in theory has not changed (other than that plants had gone from six weeks to seven without phosphate) was unexpected - the expected result would be steady-state on no-phosphate and downregulation on sufficient phosphate. However the lack of upregulation in the Adding Pi sample does suggest that this is a phosphate-limitation response, not the inverse, which would be upregulation of the Adding Pi sample when compared to the No Pi control. It may be that the plants had reached a threshold at this age at which phosphate starvation had become acute, causing upregulation of responses. The PgSQD1 phosphate marker results support this, as PgSQD1 does not show a consistent change in roots and while it does show a non-significant upregulation on phosphate addition in shoots, akin to the results for PgMAX1 and PgMAX4, PgSQD1 was even more upregulated (and significantly so) in shoots on the no-phosphate treatments.
124 124 *** *** ** ** ** *** *** *** ** *** *** Figure Response to limitation and re-addition of phosphate and addition of GR24 in PgMAX1, PgMAX2, PgMAX4 and PgSQD1 gene expression, in roots or shoots (needles, stem and axillary
125 125 buds). Plants were starved of phosphate for six weeks, samples taken at Day 0, and remaining plants were then either starved for a further week or had the phosphate source returned, as well as being dosed with 1μM GR24 or the acetone control, and gene response measured. Expression of test genes is normalised to the expression of PgTIF-5α. The data presented for all genes for the Day 0 and Added Pi samples (except the Added Pi + GR24 sample in shoots) are the means of two biological replicates, whereas the Added Pi + GR24 shoot and all No-Pi controls (with or without GR24) are a single biological replicate. Each sample was technically replicated 3 times. *** = significant difference to Day 0 sample at P<0.001, ** = P<0.01 and * = P<0.05 in Dunnett s T3 posthoc test, star colour indicating treatment. Y axis is in log 2, and error bars are standard error of the mean. The response of PgMAX1 and PgMAX4 in shoots is similar to that from the previous experiment, showing downregulation on high-phosphate compared to the Day 0 control, even though this was only significant in the Adding Pi and GR24 treatment for PgMAX4, whereas in the previous experiment it was the No Pi sample that was significantly downregulated. In this experiment, PgMAX1 and PgMAX4 also show higher levels of expression in shoots at the start of the experiment, while PgSQD1 is expressed at lower levels in shoots compared to roots (and significantly different to p=0.001 in a Dunnett s T3 post-hoc test). Interestingly, the relationships between the high phosphate-and- GR24 treatment and the high-phosphate only data points for PgMAX4 and PgMAX1 are very similar to those for the no-phosphate controls (which show no difference of adding GR24). GR24 had been hypothesised to feedback to down-regulate the expression of SL biosynthetic genes, so this apparent mimicking of the phosphate-starvation response is surprising. The responses of PgMAX2 in the roots, while again not significant, appeared to show more variation between high and low phosphate treatments than in the previous experiment. However, interestingly PgMAX2 this time does show a response in the shoots, and in a very similar pattern to that of PgSQD1, being upregulated in the continued absence of phosphate. As a part of the signal transduction pathway this might be expected, if SL signalling to the shoot is important in phosphate regulation in spruce, as it would presumably increase the sensitivity of the shoots to SLs produced in response to phosphate stress, although as with all the data for the No Pi samples this only based on one biological replicate.
126 Moniliphytes (ferns) - Ceratopteris richardii The leptosporangiate ferns make up approximately ~80% of all nonflowering vascular plant species, having undergone a radiation shortly after (and possibly causally linked to) the angiosperm radiation (Schuettpelz and Pryer, 2009). However, relatively little developmental research effort is currently entrained on the wildly diverse fern taxon, not least because it contains very few species of much economic interest, although historically the ferns have been well studied as models of plant shoot development (and the number of fern examples used by Steeves and Sussex, 1989, gives some idea of this; White and Turner, 1995). As a result, the relationship of different fern organs to those in the angiosperms (whether analogous et cetera) is still being elucidated, as is the homology of the molecular events controlling their development (Sano et al., 2005; for example, see Sanders et al., 2011). In terms of their shoot morphology, leptosporangiate ferns have at least one axis of growth that may branch from preformed buds, the outgrowth of which in some species, although not all, is governed by auxin-regulated apical dominance (Croxdale, 1976; Pilate et al., 1989; and reviewed in White and Turner, 1995). However, in some species shoots divide dichotomously, and a very few species branch both dichotomously and laterally (Imaichi, 2008). From the main axis and branches multiveined fronds are produced that are sometimes equated with angiosperm compound leaves, yet share indeterminate, iterative development with angiosperm shoots (Bierhorst, 1971; Bell and Hemsley, 2000; Sanders et al., 2011). The question of whether SL signalling is conserved in ferns was of interest in part because of this different body plan, which has been so evolutionarily successful, if such success can be measured in terms of extant species number or variety of ecological niches occupied Experimental species and gene search As a representative of the ferns, Ceratopteris richardii, or c-fern, was chosen for experimentation because it is has emerged, along with Adiantum capillus-veneris, as a model for the development of the polypod ferns, with a short lifecycle, a range of mutants available (especially for the study of gametophyte development) and easy growth both in axenic conditions and on
127 127 soil (Hickok et al., 1995; Banks, 1999; Chatterjee and Roux, 2000). A BLAST search for fern orthologues of MAX1, MAX2 and MAX4 produced one incomplete, putative, EST in C. richardii of MAX2 and another incomplete 5 EST of MAX1 in A. capillus-veneris, but degenerate primers against C. richardii MAX1 based on the sequence from A. capillus-veneris and on other species drew no results, ruling out the possibility of investigating MAX biosynthetic gene function directly in this species Responses to phosphate limitation As fern development is very different to that of angiosperms, and little is known about the role of auxin in apical dominance in ferns, identification of shared shoot-developmental modules for investigation was more difficult than for white spruce. Therefore, the putatively evolutionarily ancient role of nutrient-limitation sensing was used as a start point for investigation. Specifically, phosphate limitation responses were used as indication of potential strigolactone-related phenotypes. A test experiment was designed to investigate the effects of phosphate reduction on ferns, and in a parallel experiment the effects of addition of GR24 were measured. To this end, spores were cultured on plates for a one month to generate gametophytes and subsequently sporophytes. When sporophytes had produced approximately five sporophylls (or fronds), they were transferred to liquid media designed for c-fern culture (Hickok and Warne, 1998), and grown for a further four weeks. They were then transferred to a liquid culture containing either the same amount of phosphate as previously, or without any phosphate for 28 days (again, replacing KH 2 PO 4 with equivalent molar of KCl). For the GR24 experiment, the same protocol was followed, but maintaining the phosphate concentration and adding GR24 at a range of different concentrations. Depriving the ferns of phosphate unsurprisingly produced fairly dramatic effects as well as the phenotypes shown in Figure 4-12, the roots had turned from off-white to black in the nophosphate treatment and plants were visibly smaller. The phenotypes measured in Figure 4-12 were selected either as being likely to show an effect of growth limitation (sporophyll size and number) or because they had a comparable phosphate-limitation effect known in angiosperms (e.g. increased senescence, reduced root length).
128 128 A B C D E F Figure Phenotypes of c-fern grown with and without phosphate for 28 days. N = 18 plants. A)
129 129 and B) length and width at widest point of sporophylls along a development sequence from the oldest (1) to youngest (~12) sporophyll. C) length of longest root, D) total number of sporophylls produced, E) percentage of sporophylls with distinct pinnae (defined here as the presence of serrations in the leaves with an acute angle) and F) percentage of leaves senescent (yellow) or dead. C-F, mean averages were tested with Student s t-test for unequal variances, and significant differences on no-phosphate indicated by * = P 0.05, ** = P 0.01, *** = P Error bars are standard error of the mean. Root length (measured as the length of the longest individual root, as roots in c-fern are produced from along the shoot below the bases of the sporophylls) was the most clearly affected phenotype, although the number of roots produced was not affected (data not shown). In addition, the total number of sporophylls produced was also slightly decreased, as was the percentage of those sporophylls that had reached the point of producing clearly defined pinnae. The sporophylls produced by c-fern start as undivided flat leaf-like organs with no clear midrib or rachis, but from the eighth leaf become progressively more serrated, until two to three individual pinnae become identifiable (at around the 9 th -12 th sporophyll in this study). In the angles of the pinnae indentations (the sinuses ) vegetative buds are produced that can grow to produce entire new plantlets, although no more than one or two of these were seen in this experiment (Hou and Hill, 2002). In older and larger leaves more pinnae are produced, themselves bearing pinnules, so that reproductive sporophylls are highly and iteratively branched Figure 4-13, (Hill, 2001). Possibly as a result of the reduction in total leaf number, fewer such divided sporophylls were found on phosphate-limited plants. However, as the phosphate experiment was an exploratory one and was only carried out once, all data are shown for a single replicate and would need repetition. Figure Adult reproductive sporophyll of C. richardii, showing ramifying iterative pinnules. Reproduced from Hill (2001). Scale bar = 1 cm.
130 Response to GR24 Having identified root length, sporophyll number and size measurements and the percentage of pinnate-sporophylls as being Pi-responsive, these were measured in two replicates of treatment with GR24, using the same length of time and protocol as the low-phosphate experiment. The size parameters measured for the sporophylls showed no trend of response to GR24 in the first replicate, so were only measured once (Figure 4-14). However, as hypothesized from the phosphate experiment, GR24 did appear, at high concentrations, to have an effect on root length, although much less than the effect of withdrawing the phosphate supply. Addition of 10μM GR24 decreased the length of the longest root significantly (P=0.05 in Student s t-test, borderline significance) in the first replicate by 6.1mm on average compared to the mock treatment control, a reduction of approximately 12%. Lesser concentrations also appeared to have a slight effect. This response was much less than that of the response to phosphate (a 41% reduction). On the second replicate (Figure 4-14), although the trend of reduction in length on GR24 was repeated by a similar amount (5.7 mm on average) the difference was not significant and the trend was not repeated in the lower concentrations, which were actually longer than the control. Similarly, a (nonsignificant) trend in reduction of percentage of pinnate sporophylls on 1μM GR24 and 10μM GR24 in the first replicate was replaced, like the root response, by promotion at lower concentrations in the second, although there may still be some reduction on the highest concentration. Unlike for the phosphate treatment, total sporophyll number was not reduced in either replicate, so any reduction in number of divided sporophylls would, if real, be a GR24 specific effect. Larger sample sizes and further replicates might give better resolution and would confirm or refute these trends.
131 131 A B C D E F Figure Phenotypes of c-fern grown on GR24 or its acetone carrier for 28 days. N = 34-35
132 132 plants. A-D) Replicate 1, E- F) replicate 2. A) length of sporophylls, B) width of sporophylls, not replicated as showing no difference or trend. C) and E) length of longest root, D) and F) percentage of sporophylls with distinct pinnae. B-F) Mean averages were tested by ANOVA with Tukey s HSD post-hoc test. Shared letters indicate no significant differences at P Letters not shown for B) and D) as ANOVA results did not reject the no-difference null hypothesis. Error bars are standard error of the mean. 4.3 Lycopodiophytes - Selaginella kraussiana The extant lycopodiophytes are represented by only six genera, each in their own order the Selaginales, Isoetales and Lycopodiales. They have leaves of the microphyll type containing a single, unbranched vascular trace, which are often small and stem-hugging, with the long but thin leaves of Isoetes as the exception (Bell and Hemsley, 2000). Microphylls are one instance (and perhaps the first) of several independent evolutions of leaf-like structures, at least three of which share underlying molecular modules controlling their development (Harrison et al., 2005; reviewed in Tomescu, 2009). Although lycopodiophytes are generally described as branching dichotomously (i.e. by equal or unequal division of the growing shoot tip) some members of the Lycopodiales do form branches from lateral meristems, and only one of the Isoetes spp. actually branches at all (Bell and Hemsley, 2000; Imaichi, 2008). Selaginella species do branch dichotomously, splitting growth at the apex in two (and in S. kraussiana at least does so in a highly predictable manner every six or eight pairs of leaves, Harrison et al., 2007) many species of Selaginella have been shown to have dormant, lateral meristems. These angle meristems are placed at the branch points and usually grow out to produce organs called rhizophores. Although themselves derived from shoots, rhizophores are geotropic and produce root-like organs when they reach the soil, and their relationship to angiosperm roots or shoots has been the subject of much debate (reviewed by Webster, 1992). Recent reports of the expression of shoot meristem marker KNOX genes in angle meristems strongly support the growing consensus that the rhizophore is an adapted shoot (Kawai et al., 2010). This interpretation was previously supported by the fact that the angle meristems in some species routinely develop into shoots, and even those that normally develop into rhizophores under certain conditions (particularly loss of the
133 133 growing apex) may become specified as branches. Decapitation, inhibitor and hormone addition studies have indicated that the deciding factor for angle meristem fate and outgrowth speed is apical auxin supply (Webster, 1969; Wochok and Sussex, 1973; Wochok and Sussex, 1975). Angle meristems are maintained in a dormant state in part by auxin transported from the apex, and those meristems supplied with high auxin levels specify as rhizophores, whereas those in which auxin supply is reduced, either due to natural differences arising in development (such as the proximity of the apex or vascular traces), removal of the growing apex or experimental intervention (e.g. auxin transport inhibitors) develop as shoots (Webster, 1969; Wochok and Sussex, 1973; Wochok and Sussex, 1975; Jernstedt et al., 1994). The axillary position of this meristem and its delayed outgrowth under the control of apical auxin, led to the hypothesis that this meristem bears developmental and evolutionary similarity to that of the angiosperm axillary meristem. Indeed, even though these meristems are situated in the branch axils rather than the stem-leaf axils, the origin of seed plant leaves is proposed to be from the planation and webbing of dichotomously branched axes (Zimmerman s Telome theory, reviewed in Willis and McElwain, 2002; Beerling and Fleming, 2007). The branching in S. kraussiana is unequal, so that when the shoot apex splits, one branch will have two vascular traces and produce four leaves before branching, whereas the minor branch will only have one vascular trace and produce three leaves before dividing (Harrison et al., 2007). This minor branch might have some similarity to the overtopped branch, which corresponds to the leaf, of the Telome theory. Given this hypothesis, the possibility that outgrowth in Selaginella dormant meristems may, like angiosperm branches, be partly under the control of SL signalling was investigated Initial studies and protocol development To select an experimental subject for the effects of SLs, a number of different Selaginella spp. were examined for experimentation, including S. wildenowii and S. martensii, both previous models for branching experiments (Wochok and Sussex, 1975; e.g. Jernstedt et al., 1994), S. uncinata, a model for stomatal development ((Ruszala et al., 2011), and S. moellendorffii, the sequenced species (Banks et al., 2011). Although S. moellendorffii had the
134 134 distinct advantage of genomic information available, which would have allowed investigation of endogenous expression of orthologues as for the spruce, this species did not grow reliably in any of the conditions tried. Instead, S. kraussiana was chosen for its easy care, quick propagation from cuttings and well-described developmental pattern, similar to that of S. wildenowii but smaller and with a much faster rate of growth. Initial studies focused, like those on c-fern, on developing experimental protocols and establishing phenotypes that might be affected by SL application, although in the case of Selaginella this was done directly, without investigation of the phosphate limitation responses. Instead, investigation initially focussed on the hypothesis that SLs may be acting in a similar manner to their modus operandi in angiosperms. SLs have been shown to decrease polar auxin transport in the stems of Arabidopsis, by reduction of PIN auxin efflux proteins at the basal membrane of cells, and this restriction of transport contributes to its increase of the competition between axillary buds and reduction of their outgrowth (Bennett et al., 2006; Prusinkiewicz et al., 2009; Crawford et al., 2010). Selaginella does have conserved PIN orthologues (Křeček et al., 2009) and polar auxin transport associated with the vasculature (Wochok and Sussex, 1973), and there is some circumstantial evidence that in the case of the rhizophore this vasculature may be developmentally related to auxin canalisation. This evidence comes from the report of a distinct file of cells between the angle meristem and the vascular strands of the minor shoot before differentiation of the vascular strand connection to the minor shoot in particular would be expected if auxin sink strength is implicated in the patterning of vascular strands in Selaginella (Webster and Steeves, 1964). If the action of SLs on auxin transport were conserved in Selaginella SL application might be expected to dampen auxin transport, affect the activity and influence the identity of rhizophores and promote the formation of angle shoots. To this end, for the initial experiment, explants of Selaginella were cut from plants grown on soil, surface sterilised and grown on agar plates containing a medium adapted from that used for the ferns and two different concentrations of GR24 as well as the control. These explants were of course dichotomously branched,
 Selaginella explant with black arrows pointing to expanded branch points nodes - with stems surrounding it expanded, and white arrow showing younger, unexpanded node.")
135 135 so explants were chosen which had one expanded branch point or node (see Figure 4-15 for explanation of the terms used here). A B Apex 4 Tiers Node Figure A) Selaginella explant with black arrows pointing to expanded branch points nodes - with stems surrounding it expanded, and white arrow showing younger, unexpanded node. All nodes have rhizophores, some of the longer of which are visible here (e.g. red arrow). Grid of 10mm squares. (B) Diagram showing successive levels of dichotomous branching of Selaginella, here referred to as tiers. Unbranched tips are referred to apices, as labelled. The plants were grown for 3 months on three GR24 concentrations, transferring to new medium occasionally, during which time the number of apices (branch tips) were counted (Figure 4-16A) and inspected for the formation of shoots instead of rhizophores from the angle meristems. However, the formation of shoots were not observed in any plants, nor on plant material grown on soil. At the end of the experiment, plants were weighed and rhizophore and total explant lengths were measured. Although none of the phenotypes differed significantly in this experiment (small sample numbers were used) three phenotypes showed sufficient difference for further investigation the number of dichotomous branch points (nodes), the length of the rhizophores and the final weight of the explants (Figure 4-16A, C and D). The number of nodes showed some evidence of reduction on GR24, perhaps consistent with the shoot growth restriction phenotypes of GR24 and reduction in branching in angiosperms. The length of rhizophores, instead of being restricted by GR24 as dormant axillary meristems, actually seemed to be promoted on high levels of GR24, perhaps consistent with a nutrient foraging
 Number of apices (branch ends) counted at different times over the experiment.")
136 136 strategy. The weight of the explants was in line with the dichotomous branching data, suggesting a general restriction in growth on both concentrations of GR24. A B C D Figure Branching and phenotypes of Selaginella kraussiana grown on media containing GR24 for 3 months, n=6. A) Number of apices (branch ends) counted at different times over the experiment. B) Length of explants at the end of the experiment, measures from base to longest branch tip. C) Mean length of all rhizophores visible to the naked eye. D) Weight in grams of explants (fresh weight). All phenotypes tested with ANOVA, no significance between any treatment found.

137 Branching and rhizophore length response to decapitation To explore further the possibility that the rhizophore meristem is analogous to the seed plant axillary meristem, and that SLs may be acting in a similar manner to their modus operandi in angiosperms, a decapitation assay was attempted. This was done to promote the formation of shoots from angle meristems, and to see if this was reduced or further enhanced by GR24 application. In addition, where rhizophores were formed, the assay would allow investigation of whether their outgrowth was delayed by a growth restriction effect of GR24, or as suggested by the initial experiment, promoted. The initial explant protocol was adapted to use more plants, although this time explants were cut with two expanded tiers (like that in Figure 4-15A), and explants were kept on mock treatment or 1μM GR24 for only three weeks. At the start of the experiment explants were either left whole or decapitated by removal of the major branches above the youngest nodes discernible under a dissecting microscope (as shown in Figure 4-16). In the first experiment all suitable nodes were decapitated, and in the second every other node was Figure Young branch point of S. kraussiana, showing developing rhizophore (arrow) and point of decapitation (red line). decapitated. At the end of the three weeks, plants were photographed and easily visible rhizophores were measured directly. The unexpanded apices were then dissected under a microscope and developing angle meristems photographed and their lengths calculated using the image analysis software ImageJ (Rasband, 1997). The rhizophore lengths were then categorised and analysed by the branch tier of the node from which they grew. Explants (which did not necessarily have the same number of tiers) were then compared by normalising tier numbers to either the most basal or the tipmost tier, as shown in Figure 4-18.
138 A B Figure Diagram of Selaginella explants normalised to the most basal (A, red line) or apical/tipmost tier (B, red line). In two similar decapitation experiments, only one angle meristem showed any sign of developing into an angle shoot. As the development of angle shoots when both subtending branches are decapitated occurs within two weeks (Jernstedt, 1985), it was concluded that decapitation of a single branch is insufficient to promote angle shoot formation, with or without GR24. Nevertheless, in both experiments there was a reduction (in one case significant) in the growth of rhizophores on both decapitation and on addition of GR24 on at the tipmost two or three tiers, when tiers were aligned to the basal tier (Figure 4-19). However, when tiers were normalised by the tipmost tier, so that the youngest nodes were compared with each other, decapitation caused only a slight or no reduction in rhizophore growth, but GR24 appeared to promote it, including in explants that had also been decapitated.


139 139 A B C D Figure Decapitation response of Selaginella kraussiana rhizophores length when grown with GR24 for three weeks. Lengths of rhizophores by tier, aligned at basal tiers (A and B) or at tipmost
140 140 tiers (C and D). A) and C) experiment 1, n=9-10 for each treatment (n.b. control = undecapitated, grown on acetone carrier). B) and D) n=12-14, except for 1μM GR24 undecapitated where n=9. *** = significant difference to undecapitated acetone control at P<0.001 in a Kruskal-Wallis test, star colour indicating treatment. Error bars are standard error of the mean. To examine why such different results were gained from different alignments of the same data, the number of nodes actually present at each tier was compared. The major branch tends to grow more quickly than the minor one, and so although in S. kraussiana branching is dichotomous, and therefore the number of nodes in an explant would be expected to double at each successive tier, different rates of growth in different branches lead to variable numbers of nodes being produced. When aligned by the basal tier, the number of nodes present in decapitated plants was consistently increased in the third to fifth tiers from the base, although this effect was not significant (Figure 4-20), the first two tiers having been generally completely formed at the beginning of the experiment. GR24, however, appeared to have no consistent effect on node number. Taken together, these results could be interpreted to suggest that on decapitation of a single branch, rhizophore outgrowth is maintained or only slightly decreased, but branching by dichotomous division is increased. This increase in the number of new branches being formed would lead to a larger number of young nodes with shorter rhizophores, creating the reduction in rhizophore length when plants were aligned basally but less so when aligned at the tipmost tier. GR24 in contrast appears to have a promotive effect on rhizophore outgrowth in young nodes, but less effect on dichotomous branch outgrowth. The reduction in rhizophore length when aligned basally may indicate reduced growth of older rhizophores, something possibly supported by results from the older nodes of the tipmost alignments (Figure 4-19). However, attempts to repeat and confirm these experiments in more detail failed due to fungal contamination, to which the decapitated plants are particularly prone, and further repetition would be necessary to confirm the decapitation effects.

141 141 A B Figure Decapitation response of Selaginella kraussiana branching when grown with GR24 for three weeks. Number of nodes (branch points) by tier, aligned at basal tiers. Experiments and sample numbers as described previously, no significance found in a Kruskal-Wallis test. Error bars are standard error of the mean Branching and rhizophore length response to GR24 and decapitation To confirm the effect of GR24 identified from the decapitation experiments, the branching and rhizophore length phenotypes were investigated in more detail. The protocol used in the decapitation experiments was extended so plants were kept for four weeks on carrier control, 1μM or 10μM GR24, and were supplemented with vitamins in the growth medium. As seen previously, plants grown on GR24 showed a consistent and often significant elongation of rhizophores at the tipmost branch points compared to the mock treatment (Figure 4-21). In addition a significant reduction in the number of nodes produced at each tier was also seen, in contrast to the results from the undecapitated GR24 treated plants previously (Figure 4-20B). Other experiments carried out using only 1μM GR24 also showed similar results, although the data for these experiments are not shown due to smaller sample sizes and the use of only one GR24 concentration.

142 142 A B C D E F
 and B) Lengths of rhizophores at each tier, and C) and D) number of branch points at each tier, all aligned at tipmost tiers. E) and F) number of tiers of branches on explants.")
143 143 Figure Growth of Selaginella kraussiana on GR24 for four weeks. A) and B) Lengths of rhizophores at each tier, and C) and D) number of branch points at each tier, all aligned at tipmost tiers. E) and F) number of tiers of branches on explants. A), C) and E) all first replicate, n=20, 24 and 31 for acetone, 1μM GR24 and 10μM GR24 respectively, and for replicate 2 (B, D and F) n=27, 28 and 25 respectively. *** = significant difference to acetone at P<0.001, ** = P<0.01 and * = P<0.05 in a Kruskal-Wallis test, star colour indicating treatment. Error bars are standard error of the mean. In one replicate at least (Figure 4-21E) a significant reduction in the total number of tiers produced was also seen, although this effect was less consistent between replicates (including those not shown here). From this it seems that GR24 causes reduced dichotomous branching, in opposition to the possible increase in dichotomous branching in response to decapitation. This restriction of growth was also supported by a significant reduction in the final weights of the explants (only measured in the second replicate, Figure 4-22). However, this effect does not apply to the same extent to rhizophores, in which growth at the tipmost, youngest nodes appears to be maintained or even increased, whereas in older nodes it may be reduced. There is a possibility that the reduction in node production means that the youngest nodes in GR24 grown plants are older (and therefore have longer rhizophores) than those of plants grown without GR24, but even if this is the case it still suggests that rhizophores are not subject to the same growth restriction as node production, or else their growth at the youngest nodes would also be inhibited. Figure Weights of Selaginella kraussiana explants grown on GR24 for four weeks, second replicate. N=27, 28 and 25 for acetone, 1μM GR24 and 10μM GR24 respectively, * = significant difference to acetone at P<0.05 in Tukey s HSD test. Error bars are standard error of the mean.
144 144 Although these results do not match the hypothesis that GR24 would delay or restrict outgrowth of rhizophores as dormant meristems or promote angle shoot development by affecting auxin transport, they would still support a role for SLs in adaptation of plant development to nutrient limitation as seen in other species. Instead of reducing angle meristem outgrowth, it appears more likely that shoot meristem outgrowth is reduced. If SL signalling in nutrient limitation is conserved in Selaginella, regardless of the particular phenotypes under its control, restriction of growth to a smaller number of axes while maintaining growth in nutrient foraging organs (rhizophores) would make sense. 4.4 Discussion The conservation of genetic pathways infers a selection pressure to maintain these genes in living species - there is likely to be an adaptive significance, though this itself may not necessarily be conserved. The production and reception of SLs by a largely similar gene set in angiosperms and in moss implies that this pathway has had roles in plant development that preceded the divergence of these groups, close - in geological time at least - to the emergence of the land plants. That both groups have conserved SL signalling also implies that SLs have had an important influence on fitness for both groups for all of the time since that split. As the known biosynthetic and signal transduction gene sets are generally also conserved in lycopodiophytes (closest to mosses) and gymnosperms (closest to angiosperms), the physiological and developmental roles driving their continued presence in these genomes were explored. The moniliphytes, genomic orphans, were included as the major land plant group that falls between these two. To make the investigation of such a range of different species with, potentially, an equally broad range of SL-related phenotypes, lines of investigation focussed on the specific role of SLs in shoot branching control, and the more general and perhaps ancestrally-unifying concept of SLs as a global coordinator of nutrient limitation responses. This focus on specific hypotheses was all the more important because the tools available for the
145 145 confirmation that SLs play endogenous roles in development - tools such as mutants, inhibitors, and in some cases genetic orthologues are not necessarily available for these species. Without the ability to remove hormones, confirmation of the biological significance of the results of their addition is more difficult. For SLs, the existence of a well-characterised analogue, GR24, makes the experimental addition of SLs possible. However, there remains risk that the effects of GR24 are those of a toxin, rather than reflecting an endogenous role of SLs. Therefore the conclusions presented here must be considered with these caveats in mind, and require further investigation of mechanisms of action and relevance to endogenous events to confirm roles for strigolactone signalling in development in these species. In gymnosperms, a sufficient number of characteristics of axillary branching were conserved with those of angiosperms that it was considered possible that the roles of SLs in branch outgrowth might be shared with the angiosperms. Given some of the similarities of axillary bud dormancy to apical bud dormancy (Rohde and Bhalerao, 2007) this phenomenon was also investigated with regard to SLs. From the experiments detailed here, there is no clear evidence of an effect of application of the synthetic strigolactone GR24 on the maintenance of seasonally-related growth cessation in spruce apices, and only very tentative evidence in support of a role of GR24 in modulating branch outgrowth, and then only in response to decapitation and at high concentrations (10μM GR24). Even though this decapitation response is slight, it encourages further work to confirm it. In addition, although GR24 has been found to mimic SLs (although not as effectively as endogenous SLs) in angiosperms and in moss, the same may not hold true for gymnosperms, and even if it does, the active concentrations may differ (Gomez-Roldan et al., 2008; Umehara et al., 2008; Proust et al., 2011). Nevertheless, the isolation of natural SLs from gymnosperms (Pinus spp.) has been reported (Xie et al., 2010), demonstrating that the biosynthetic pathway is not only present but active in gymnosperms, and although the genes corresponding to that pathway have not been confirmed it appears highly likely that at least some of these are the MAX gene orthologues identified here. These orthologues also showed similar patterns of reaction to phosphate limitation to each other and to those in rice (as reported by Umehara
146 146 et al., 2010), with the signal transduction gene MAX2 being largely unaffected by treatment, but the biosynthetic genes showing generally lower expression in phosphate sufficient conditions than in phosphate starvation conditions. The purpose of this upregulation in low phosphate conditions is thought to be both to restrict shoot growth, and by exudation from the roots to encourage the formation of mycorrhizal symbioses, which improve plant phosphate acquisition (Bouwmeester et al., 2007). White spruce, like other gymnosperms, forms mycorrhizal symbioses, but like many in the pine and spruce families these are ectomycorrhizal, rather than AMy type symbioses (Wang and Qiu, 2006). These symbioses have also been shown to improve plant phosphate status in high- and low-phosphate containing soils in the gymnosperm Pinus pinaster, maritime pine (Torres Aquino and Plassard, 2004; Tatry et al., 2009). Although SL signalling in ectomycorrhizal symbioses has not yet been reported, convergent evolution of the use of rhizosphere SLs for detection of hosts has been found in AMy fungi and parasitic plants (for example, reviewed in Tsuchiya and McCourt, 2012), so conifer exudation of SLs to attract ectomycorrhizal symbionts would not be surprising. Even if not involved in promoting symbiosis, production of SLs could well be upregulated on phosphate limitation in conifers associated with other nutrient-signalling developmental effects, whether shoot branching related or otherwise, as it is in the non-mycorrhizal species Arabidopsis thaliana (Kohlen et al., 2011). In either case, it seems that the nutrient limitation response of the MAX pathway is conserved among the seed plants. The evidence for SL signalling in fern species is considerably less than it is even for the gymnosperms and lycopodiophytes, not least because the absence of a sequenced fern genome, and the very few EST sequencing projects, means that identification of full length MAX gene orthologues was not possible, although fragments of sequence available suggest that both MAX1 and MAX2 are conserved in some form in ferns. Nevertheless, some experimental evidence was found for a response to GR24 in c-fern root growth and perhaps frond development. These results need to be confirmed and further investigated, but the root length effect in particular was remarkably similar to the effects of GR24 on roots in Arabidopsis, in which primary root growth can be increased
147 147 by application of concentrations of GR24 between 1 and 2.5μM in a max2 dependent manner, but suppressed by concentrations of 10μM GR24 in a max2 independent manner (Ruyter-Spira et al., 2011). These effects are also controlled by endogenous SLs in Arabidopsis and are dependent on complex interactions between auxin signalling, auxin transport and SLs in Arabidopsis and tomato (Koltai et al., 2010; Ruyter-Spira et al., 2011). Changes in auxin sensitivity have also been proposed to mediate phosphate limitation responses, particularly in development of lateral roots in Arabidopsis, a process in which SL signalling has also been implicated (Perez-Torres et al., 2008; and reviewed in Koltai, 2011; Ruyter-Spira et al., 2011). Auxin is also involved in determining the length of roots in c-fern, although not the initiation of lateral roots (Hou et al., 2004), and in fern preliminary results indicate a strong reduction of root length in phosphate limited conditions. Further investigation of the dose-response to GR24 in c-fern roots is required. However, if the responses are confirmed, investigation of the interactions between GR24 and auxin signalling in the control of root length in the fern might be a way to start the process of confirming that these effects are those of an endogenous plant growth regulator, and not just those of an exogenous toxin. The combination of the manipulation of endogenous auxin (by decapitation) with GR24 addition was attempted in the experiments on Selaginella, and although the initial hypotheses on the effects of GR24 on rhizophore determination and outgrowth were not supported, the experiments did produce some interesting results. The decapitation experiment indicated that this kind of wounding might promote dichotomous branching, but did not have much effect on rhizophore outgrowth. Although an apical-dominance type release effect had been postulated for the outgrowth of angle shoots, and similar effects along these lines have previously been reported (Webster, 1969; Wochok and Sussex, 1975; Jernstedt, 1985) in this case apical dominance appeared to be operating at the level of the dichotomous division. Shoot division is a very regular process in S. kraussiana, occurring every four leaves or three leaves depending on whether the branch is major or minor (Harrison et al., 2007), and auxin has not been implicated in phyllotaxic patterning of either dichotomous branch or leaves, so whether the apical dominance effects reported here are mediated by auxin is a
148 148 fascinating question. However, in the GR24 addition experiment, rhizophore growth appears to be maintained at the tipmost nodes, but nodal branching is decreased, particularly at the higher concentration, consistent with a role for GR24 in increasing competition between branches produced by dichotomous division. Although this may be a toxicity effect, the apparent stimulation of rhizophore growth supports a more specific effect, and perhaps one replicating a nutrient-limitation response a hypothesis easily tested by investigating the effects of growing plants on low phosphate medium. As for ferns, should these effects be confirmed, further work investigating the effects of GR24 on auxin transport would be interesting, both for the purpose of understanding the developmental mechanisms of Selaginella and for the evolution of the mechanisms of SL signalling. Although few conclusions can be drawn with confidence from the results of SL action in ferns and lycopodiophytes, these preliminary experiments provide starting points for developing and testing further hypotheses about the conservation of strigolactone signalling across these wide phylogenetic distances. The development of efficient and specific SL signalling inhibitors, towards which steps have already been made (Sergeant et al., 2008; Ito et al., 2010; Ito et al., 2011), will be a boon towards such research, as will the development of mutants and genetic transformation systems in the ferns and lycopodiophytes particularly. If confirmed, the results presented here seem likely to support the hypothesis drawn from the angiosperm and moss phenotypes that SLs are ancestral regulators of development in response to nutrient limitation, whether due to competition from other colonies (as in moss, Proust et al., 2011) or limitation in the soil (Kohlen et al., 2011; Ruyter-Spira et al., 2011).
149 149 Chapter 5. MAX1 duplication in Angiosperms Although the actions of SLs outside the angiosperms are still relatively uncharacterised, the processes in which strigolactones are known to be involved within this group are ever more varied, a phenomenon shared with many other plant hormones. In comparison to its many different roles, the MAX genetic pathway is much less diverse, being quite conserved in terms of gene copy number (Figure 1-7), with few gene duplicates present in either monocot or dicot clades, except in soybean in which there was recent whole genome duplication (WGD) only ~13 mya, and in poplar which had a WGD event around mya, but has a relatively slow molecular clock (Tuskan et al., 2006; Schmutz et al., 2010). In the angiosperms, WGDs have been unusually frequent, with the ever-increasing number of sequenced plant genomes providing evidence of many paleopolyploidisations, including two events within the cereal lineage, compared to a probable triplication (the γ event) shared by most (if not all) eudicots, and followed by more recent WGDs that are family or genus-specific in both monocots and dicots, such as the β and α events in the eurosid/brassicaceae lineage to which Arabidopsis belongs (Cannon et al., 2006; Jaillon et al., 2007; reviewed in Paterson et al., 2010; Schmutz et al., 2010; Tang et al., 2010; Argout et al., 2011; Illa et al., 2011; Xu et al., 2011). These recurrent duplications have provided ample opportunity for the genes of the MAX pathway to multiply. Yet with the exception of MAX1, they generally do not seem to have done so. Although D14 and D27 each have duplicate clades, (two in the case of D14) these are separated by long branch lengths between clades, suggesting diversifying selection, and there is as yet no evidence that the D27like paralogue clade is involved in SL signalling, although D14like, which is involved in a parallel signalling pathway in the perception of germination signals from smoke, may retain an ancestral redundancy with SL signalling (Waters et al., 2012). In comparison, MAX1 has a very different pattern compared to the other genes, for while in the eudicots, orthologues are generally present as a single copy (although along with poplar, and probably pea, Medicago truncatula has two) there are multiple copies present in the monocots. Within monocots, three different clades are present, with each containing members from rice, maize, sorghum and Brachypodium (Nelson et
150 150 al., 2008, Challis, et al.. in preparation). In one clade in particular, further duplications have occurred resulting in five orthologues of MAX1 in rice. To investigate whether the proliferation of MAX1 in monocots, and to a lesser extent in dicots, was indicative of subfunctionalisation or diversification at the functional level, the complementation approach was expanded to include paralogous genes from the angiosperms. To compare the evolutionary paths of MAX1 in monocots and dicots, and in collaboration with Dr Céline Mouchel, two models were selected for complementation analysis, Medicago truncatula (a eudicot) and Oryza sativa as a monocot. 5.1 Medicago Medicago truncatula, or barrel medic, is a close relative of the agriculturally important crop Medicago sativa (alfalfa), and as a legume is a model for the study of nodulation - a symbiotic relationship with Rhizobia bacteria which shares signal transduction and regulatory components with, and has probably evolved from, the more ancient AMy symbiosis (and reviewed in Parniske, 2008; Maillet et al., 2011). Medicago is a plant with a prostrate growth habit, and little dormancy in its axillary buds, especially in the sequenced accession Jemalong A17 (pers. comm. C. Mouchel). However, the role of SLs in shoot branching control and dormancy are well characterised in pea, a key model for the understanding of these hormones and a close relative of Medicago (Gomez- Roldan et al., 2008; reviewed in Beveridge et al., 2009). MAX1 homologues and mutants have not been characterised in pea, a point suggested to be due to the presence of redundant copies of MAX1 (Gomez-Roldan et al., 2008). The investigation of the duplicate MAX1 orthologues present in Medicago was therefore of interest for understanding the evolution of the MAX pathway in legumes and investigation of redundancy and diversification of MAX1 in an angiosperm species with a different life history and roles for SLs compared to Arabidopsis Branching phenotype The MtMAX1 orthologues (Gene Identifiers Medtr3g and Medtr1g from the International Medicago Genome Annotation Group, annotated as Medtr3g and Medtr1g respectively in Phytozome
151 151 notation, which gives the more accurate gene model for Medtr1g019950, (Goodstein et al., 2012) were cloned from plasmids kindly provided by Dr Céline Mouchel, originally cloned from the Jemalong A17 cultivar used for the whole genome sequencing project. These were cloned into vectors to create constructs with the 35S promoter and nos terminator and transformed into plants as described for the PgMAX1 and SmMAX1 constructs previously. The resulting transgenic lines were then phenotyped and compared to wild-type Columbia-0, the parent max1-1 and with a single max1-1 line produced by Dr Sally Ward carrying an AtMAX1 construct, under the same promoter, as a positive control. Branching and height measurements were carried out as described for the PgMAX1 and SmMAX1 transgenics in Chapter 3. Overall comparison of the ability of the two MtMAX1 constructs to rescue indicated a clear divergence in function. 35S::Medtr3g104560, like the control 35S::AtMAX1 construct, was able to complement completely max1-1 in both branching (Figure 5-1) and height phenotypes (Figure 5-2 and Figure 5-3) and this rescue was consistent across all the transgenic lines. Taking all lines together, 35S::Medtr1g did not appear to be capable of rescuing (Figure 5-1A), but some individual lines did show a reduction in branching and an increase in height, indicating a weakly rescued phenotype. In particular branch numbers of lines 14.5 and 2.7 were not significantly different in Kruskal-Wallis tests (adjusted for repeat sampling) from 35S::AtMAX1 across two replicates, and were significantly different from max1-1 (at P 0.05) in the second replicate (14.5 was also not significantly different from Col-0 in terms of height in either replicate). In addition, lines 17.6, 7.2 and 3.9 showed some degree of rescue (no significant difference in between 7.2 and 3.9 and Columbia-0 in branching or heights in replicate 1, or between 17.6 and 35S::AtMAX1 in branching or heights in replicate 2). These lines produce a cluster with an intermediate phenotype between complete lack of rescue and full rescue which can be seen clearly in Figure 5-2. This suggested the possibility that although Medtr1g had diverged in its functional capability to catalyse the reaction occurring in Arabidopsis, it might have retained a weak ability to do so.
152 152 A B Figure 5-1. Rosette branching of Arabidopsis max1-1 mutants complemented with Medicago truncatula MAX1 orthologues under the 35S promoter. Second and representative of two replicates. Branching was assessed by short-day decapitation assay as described by Greb et al. (2003). A, shared letters indicates no significant difference in a Kruskal-Wallis test to P 0.001, data are mean averages for independent lines shown in B. B, * = significantly different to max1-1 at P 0.05, ** at P N for each line = 20, except for Columbia-0, max1-1 and 35S::AtMAX1 max1-1 for which n=40. Error bars show standard error of the mean.
153 Mean height (cm) Medtr3g max1-1 Medtr1g max1-1 Columbia-0 max1-1 AtMAX1 max Mean number of rosette branches Figure 5-2. Rosette branching plotted against height for individual MAX1 constructs derived from Medicago truncatula. N =19-20, except for max1-1 and Columbia-0 where n=40. Branching was assessed by short-day decapitation assay as described by Greb et al. (2003). Height (in centimetres) of the longest branch was measured the day of scoring for branching. Error bars show standard error of the mean. Note y axis starts at 20cm.

154 154 Figure 5-3. Photograph of Columbia-0, max1-1, 35S::AtMAX1 max1-1, 35S::Medtr3g max1-1 line 12.3, and 35S:: Medtr1g max1-1 line 7.2, from left to right, with AtMAX1 and Medtr3g transgenics showing rescue and Medtr1g showing very limited rescue. White bar = 40cm.
155 Mean number of rosette branches Comparison of expression to phenotype To further explore the possibility that Medtr1g retained some ability to substitute for MAX1 in Arabidopsis, branch patterns were compared with the expression of the transgene. Quantitative PCR (QPCR) was used to measure transgene expression in ten day old seedlings, as the CaMV 35S promoter is considered to be constitutive (Odell et al., 1985; Slater et al., 2007). Expression was normalised to the expression of an endogenous Arabidopsis serine/threonine protein phosphatase 2A gene, At1g69960, and an endogenous SAND-related gene, At2g28390, both of which had been selected by Dr Malgorzata Domagalska as being developmentally stable Expression of Medtr1g relative to the geometric mean of At1g69960 and At2g28390 endogenous controls, in log base 2 Figure 5-4. Branching rescue from second replicate results against expression for 35S::Medtr1g Data points are labelled with transgenic line numbers. Numbers of QPCR cycles of Medtr1g were normalised to the geometric mean number of cycles of At1g69960 and At2g28390 as the endogenous controls, and relative expression plotted in log 2. Standard errors are standard error of the mean of two biological replicates, each representing three technical replicates. Note y axis starts at 4 branches. The resulting estimates of expression were plotted against rosette branch numbers as a measure of rescue, shown in Figure 5-4 where four branches was
156 156 set as the zero point on the axis to represent the wild-type phenotype (in the replicate shown here, Columbia-0 had a mean of 4.85 branches, see Figure 5-1). There does not appear to be any relationship between expression and rescue, as the three lines with the highest branch numbers (10.6, 16.3 and 12.7) also have moderate to high expression. Tests with Pearson s coefficient confirmed the lack of correlation, indicating that the inability of the Medtr1g construct to complement fully max1-1 is not linked to low expression Leaf phenotype As leaf phenotyping proved of interest in distinguishing rescue ability between PgMAX1 and SmMAX1, leaves for each line of the Medicago constructs were compared to wild-type, mutant and the 35S::AtMAX1 max1-1 control at 6 weeks of age (Figure 5-5) to elucidate further the degree of rescue by Medtr1g At this age PC9 showed no significant difference between max1-1 and Columbia-0, while PC10, although still distinguishing significantly between Columbia-0 and max1-1, was unable to distinguish between rescued and non-rescued lines, with almost all lines showing no difference to either wild-type or mutant, and so neither were considered for assessment of rescue. For the three remaining phenotypes, the 35S::AtMAX1 control construct rescued completely, as does 35S::Medtr3g104560, although lines 2.5 and show some variation in rescue, especially in PC3 (Figure 5-5). The 35S::Medtr1g construct failed to rescue the centroid size or PC2 leaf phenotypes as it did branching, although interestingly, as a whole, the construct rescued PC3 to the same degree as 35S::AtMAX1. As for 35S::Medtr3g104560, different lines varied in the degree to which they rescued the various phenotypes, but these did not correspond as well to the branching phenotype as might have been expected. 14.5, a line with high expression and low branch numbers in the second replicate, is not rescued at all in its leaves, and nor is 2.7, another low-branching line. However, 7.2 and 3.9, also low-to-mid branching lines, are rescued in terms of PC2 and, along with 17.6, in terms of PC3.

 and standard deviations from the mean leaf for PC2 (width at centre, B), and PC3 (area distribution, C).")
157 157 A Centroid size B PC2 C PC3 Figure 5-5. Leaf shape analysis for Procrustes-fitted adult leaves four and above from max1-1 plants complemented with MtMAX1 orthologues. Error bars are standard error of the mean, calculated on number of plants as n, where n = 6 for Col-0 and AtMAX1 max1-1, 9 for max1-1, and 6-8 plants for all other lines with the exception of Medtr1g max (n=5) and Medtr3g max (n=3). Shown are mean centroid sizes (A) and standard deviations from the mean leaf for PC2 (width at centre, B), and PC3 (area distribution, C). Letters indicate non-significance in Tamhane s T2 post-hoc test at P>0.001 (centroid, PC2) or P>0.05 (PC3).
158 158 In the experiment with PgMAX1 and SmMAX1, lines showing rescue in branching were less likely to do so in PC3 or centroid size than in PC2, suggesting that these phenotypes require a higher level MAX1 activity for rescue. A test with Pearson s correlation between average line values for all the leaf phenotypes used here and for branching was significant for all combinations to p When the test was extended to consider PCs 9 and 10, correlations were also significant at p 0.001, except for those between PC9 and centroid size, PC3 and branching, which were p=0.018, p=0.024 and p=0.004 respectively. These generally strong correlations between measures of rescue support that all phenotypes are indeed responding to MAX1 activity of the transgenes, suggesting that variation in rescue between phenotypes does derive from differences in degree, or threshold of response. As a result, although centroid size does not seem to be much rescued by Medtr1g (although there is some move away from the max1-1 phenotype in the cases of 7.2, 14.5, 17.6 and surprisingly 20.9), the partial rescue of PC3 and PC2 in some lines probably reflects a weak ability of Medtr1g to carry out the Arabidopsis MAX1 function. Nevertheless, the low degree of rescue of all branching, height, leaf phenotypes demonstrate that overall, Medtr1g function has diverged significantly both from that of AtMAX1 and Medtr3g In planta expression of MtMAX orthologues The expression patterns of the MAX1 orthologues were explored to see whether they had also diverged. The expression of orthologues to all the MAX pathway genes known in Arabidopsis were compared by semi-quantitative RTPCR to see whether the expression of Medtr1g differed from that of Medtr3g104560, which might indicate that this orthologue had been co-opted to a new role, and whether gene expression patterns in Medicago were similar to those of Arabidopsis. Plants of Jemalong A17 were grown for 5 weeks, at which the most basal node had started to produce a branch, and then tissues were gathered for analysis. The expression of all MAX orthologues followed a similar pattern, with highest expression in the roots, lower stem and some expression in the most basal, branching node, except for MtMAX2, which appeared ubiquitous (Figure 5-6). The patterns for MtMAX2, MtMAX3 and to an extent MtMAX4 are similar to those of their Arabidopsis orthologues, although


159 159 MtMAX4 is more highly expressed in leaves and generally in non-root tissues than reported for AtMAX4 (Sorefan et al., 2003; Booker et al., 2004; Bainbridge et al., 2005; Stirnberg et al., 2007). The MtMAX1 orthologues, however, do not seem to be expressed as widely throughout the plant as AtMAX1, with expression undetectable in the upper stem and most concentrated in the roots, especially for Medtr3g (Booker et al., 2005). Nevertheless, given the similarity between the patterns of the two MtMAX1 orthologues, there seems to have been little diversification in the organ-level regulation of these genes at this particular developmental stage, and this study gives no information on differences between cell types, or the responses of the genes to different stimuli. A B Figure 5-6. Expression of Medicago truncatula MAX gene orthologues in 5 week old plants. A) Medicago orthologue of Elongation Factor 1α (Medtr8g014590) was used as an endogenous loading control. PCR cycles used: MtEF1α 35, Medtr3g , Medtr1g , MtMAX2 (Medtr4g ) 35, MtMAX3 (Medtr7g045370) 50, MtMAX4 (Medtr3g109610) 45. B) tissues used in RTPCR. As the RTPCR study was limited in the information it provides on expression, the expression of the MtMAX1 orthologues was checked in the Medicago Gene Expression Atlas database of publically available results from microarray experiments (Benedito et al., 2008; He et al., 2009). Probesets relating to both orthologues were available, and expression visualised using the Multitranscript Viewer at the Samuel Roberts Nobel Foundation website ( He et al., 2009). Two probesets were available for Medtr1g015860, which showed very similar expression patterns, although with
160 160 different signal strength. The probeset for Medtr3g revealed much higher values than those of Medtr1g015860, so that plotting on the same graph was impractical (Figure 5-7). Signal strengths are not directly comparable between different probes, and nor are the results of different primer sets in semi-quantitative RTPCR (as they are both influenced by other factors, such as the binding strength of probes and primers), but it is interesting that in both studies Medtr3g shows the stronger signal of the two, also requiring fewer cycles to amplify in the RTPCR experiment (Figure 5-6). In terms of tissues, Med3g is very low in shoot tissues with highest expression in the roots, although there is a little in the flowers. In comparison, Medtr1g seems to be only lowly expressed in roots, in contrast with Medtr3g and with the RTPCR results. Instead it seems to be only highly expressed in late embryogenesis-stage seeds. Despite these differences in plant-wide relative levels of expression in the root, both genes show similar responses within the roots to nodulation and mycorrhizal symbiosis, with lower expression in roots with nodules than those pre-infection or denodulated, and both increasing in roots with mycorrhizal symbioses, although the relative increase is greater in Medtr1g (Benedito et al., 2008). There are a few other differences - Medtr3g may show downregulation responses to biotic stress, as it is slightly reduced both in cell culture in response to yeast elicitors (YE) and in whole roots on infection with the root rot fungus Phymatotrichum, whereas Medtr1g does not seem to respond, but does seem to change on challenge with abiotic (salt) stress, although not with any clear pattern. However, the most interesting difference between the two genes is that found in the experiments described by Ruffel et al. (2008), in which split root systems were deprived of nitrate (NO - 3 ), (NH - 4 ), or for nodulating plants, nitrogen gas (N 2 ). While it shows relatively little response to NO - 3 or NH - 4 starvation, Medtr1g is upregulated by a fold change of 3.36 (for probe Mtr S1_at, or 3.46 for probe Mtr S1_at) by nodule deprivation of N 2. Interestingly, in this same set of conditions Ruffel et al. found that MtMAX2 was downregulated by 3.47 fold, although no significant changes to these or any other MAX genes (including Medtr3g104560) were found. Overall, these data strongly suggest that not only the function, but also the regulation of Medtr1g has diverged both from that of AtMAX1 and Medtr3g
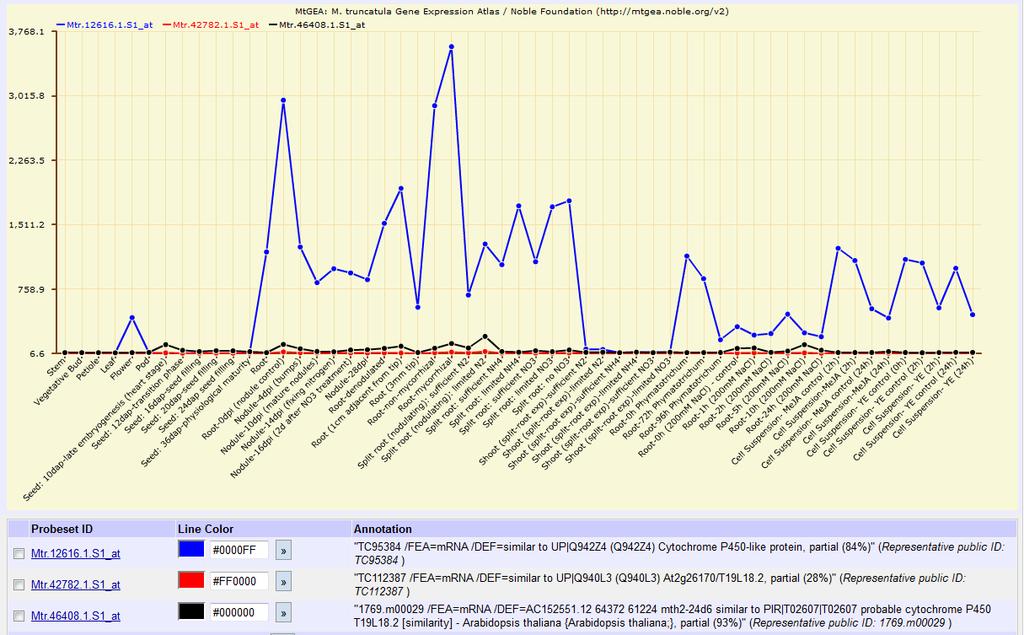
161 A 161
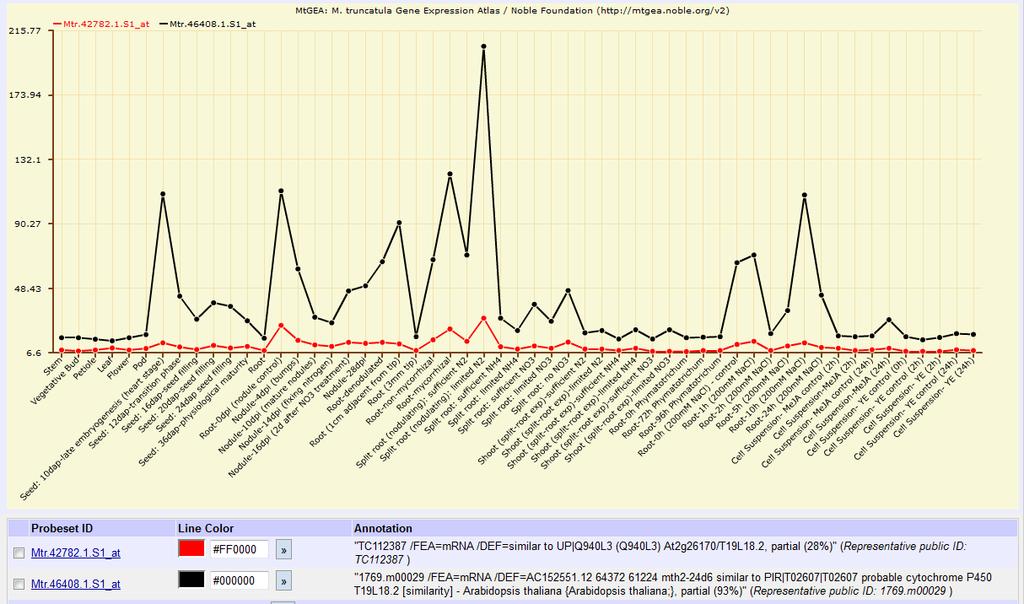
162 B 162
163 163 Figure 5-7. Outputs from the Medicago Gene Atlas (Benedito et al., 2008; He et al., 2009) for probesets Mtr S1_at (Medtr3g104560, A, blue line), Mtr S1_at (Medtr1g015860, A and B, red line) and Mt S1_at (Medtrg015860, A and B, black line). Probeset Mtr S1_at was removed from B so that the Medtr1g patterns were visible. Only results from Jemalong A17 are shown, and are sorted by experiment and contributing paper. Blue vertical lines divide data from different papers contributing to the dataset. Red circles highlight equivalent data points from nodulating roots deprived of N 2 from Ruffel et al. (2008). dap = days after pollination, dpi = days post inoculation, MeJA = methyl jasmonate, YE = yeast elicitor. 5.2 MAX1 diversity in rice Monocots are the most agriculturally important group of plants, with production of cereals alone comprising a quarter of global crop production, (2,433 million tonnes) in 2010 (FAO, 2012). The study of the evolution of SL signalling, which has impacts on the agricultural factors of parasitism, symbiotism and branching, the last being a character selected for in domestication of monocots since prehistoric times (Wang et al., 1999) is therefore of clear interest in this phylum. The proliferation of MAX1 copies within monocots makes it of especial interest for the study of this gene. Three separate, conserved clades within the monocots suggest that MAX1 may have found three different roles in monocots. Rice is the model monocot for the study of SL biosynthesis, in which all members of the SL pathway but MAX1 have been identified though mutant phenotype. The exception of MAX1 implies a high likelihood that at least two of the five OsMAX1s are redundantly involved in SL biosynthesis Branch phenotype Of the five orthologues present in rice, two (Os02g and Os06g , according to the Rice Annotation Project Database RAP-DB, (Tanaka et al., 2008) - or Os02g12890 and Os06g36920 respectively in Rice Genome Annotation Project RGAP, (Ouyang et al., 2007) notation,) represent single members of two of the different monocot clades, and were likely produced by whole genome duplication within the monocots, predating divergence of the cereals, as they form part of a syntenic block between chromosomes 2 and 6 dating to the pancereal ρ duplication of approximately mya, and are shared in maize and sorghum (Paterson et al., 2004; Salse et al., 2008; syntenic block identified using SyMAP, Soderlund et al., 2011). The 163
164 164 remaining three all belong to the third clade and fall on chromosome one, forming a set of three tandemly repeated genes that may be rice specific, although sorghum also has a tandem pair in this clade at an orthologous position. In the RGAP annotation, these were identified as five loci, designated Os01g50520 and Os01g50530 (together forming Os01g , RAP-DB), Os01g50570 and Os01g50580 (forming Os01g ) and Os01g50590, which corresponds to Os01g Of these, members from all three clades were cloned from Oryza sativa Japonica group cultivar Nipponbare, including two, Os01g and Os01g , from the chromosome 1 tandem repeat. Promoters were added as before and constructs were transformed into max1-1 plants and phenotyped as described for PgMAX1, SmMAX1 and the MtMAX1 constructs. As shown in Figure Figure 5-11, three out of the four constructs were capable of rescuing the branching and height of Arabidopsis max1-1 to at least the same degree as the 35S::AtMAX1 control, with a rescuing orthologue present in each clade. Unlike the case for Medtr1g015860, in no lines carrying the single non-rescuing construct, Os01g was there any indication of a significant rescue of the max1-1 phenotype in either branching or height, with nine of ten lines assayed in the first replicate, and four of five in the second, clustering with the phenotype of max1-1 in Figure The odd-one out, line 7.9 (see Figure 5-9) is actually more branchy and even shorter than max1-1, suggesting that in this line may have an addition genetic lesion contributing to its phenotype (perhaps caused by the insertion of the transgene at another locus with an effect on branching). Therefore, in the rice orthologues assayed, there appears to be a clear dichotomy in the capability of genes to function in Arabidopsis.
165 Columbia-0 max1-1 35S::AtMAX1 35S::Os01g S::Os01g S::Os02g S::Os06g Mean number of rosette branches per plant b b a c ad cd ad No-insert controls max1-1 background Figure 5-8. Rosette branching of Arabidopsis max1-1 mutants complemented with OsMAX1 orthologues under the constitutive 35S promoter. Second and representative of two replicates. Branching was assessed by short-day decapitation assay as described by Greb et al. (2003) and shared letters indicates no significant difference in a Kruskal-Wallis test to P Data for constructs are mean averages for 10 (Os01g ), 5 (Os01g ), 8 (Os02g ) and 9 (Os06g ) independent lines, n for each line = 19-20, except for Columbia-0, max1-1 and AtMAX1 max1-1 for which n=40. Error bars show standard error of the mean. 165
166 Columbia-0 max1-1 35S:AtMAX1 max1-1 Mean number of rosette branches S::Os02g max1-1 35S::Os01g max1-1 35S::Os01g max1-1 35S::Os06g max1-1 Controls Figure 5-9. Rosette branching of Arabidopsis max1-1 mutants complemented with OsMAX1 orthologues under the constitutive 35S promoter, showing independent transgenic lines. Second and representative of two replicates. Branching was assessed by short-day decapitation assay as described by Greb et al. (2003). N for each line = 19-20, except for Columbia- 0, max1-1 and AtMAX1 max1-1 for which n=40. Error bars show standard error of the mean.

167 Mean height (cm) 167 Figure Photograph of Columbia-0, max1-1, 35S::Os01g max1-1 line 3.1, 35S::Os01g max1-1 line 2.1, 35S:: Os02g max1-1 line 2.2, and 35S:: Os06g max1-1 line 11.4 from left to right, with all transgenics but 35S::Os01g showing rescue. White bar = 40cm Columbia-0 max1-1 35S:AtMAX1 max1-1 35S::Os01g max1-1 35S::Os01g max1-1 35S::Os02g max1-1 35S::Os06g max Mean number of rosette branches Figure Rosette branching and heights of Arabidopsis max1-1 mutants complemented with MAX1 orthologues from Oryza sativa under the constitutive 35S promoter. N =19-20, except for max1-1 and Columbia-0 where n=40. Height (in centimetres) of the longest branch was measured the day of scoring for branching. Error bars show standard error of the mean. Note y axis starts at 20cm. 167
168 Leaf phenotype The dichotomy of rice orthologues in rescue capability was also tested in their effect on leaf shape and size (Figure 5-12 and Figure 5-13). As for the non-angiosperm constructs, only two lines were used to explore this phenotype, with information from the first replicate of the branching assay (which did not include Os06g , or three of the Os02g lines) being used to select lines that showed the least and the most rescue, to reflect the full spread of the phenotypes generated. However, these differences were generally very small in terms of branch rescue, and translated into no significant differences between lines of the same construct for PC3 and PC10 leaf phenotypes. For Os01g , Os02g and Os06g leaf phenotypes largely mirrored those of branching phenotypes for all PCs, although for the two rescuing constructs, centroids were not completely returned to wild-type size, as was found to be the case for SmMAX1. Interestingly, although in the branching assay overall Os02g only showed rescue to the level of the AtMAX1 construct line, rather than to wild-type, the leaf experiment shows full rescue to the Columbia-0 phenotype. However, Os01g proves less capable of correcting centroid size, PC3 and PC10 than the others, despite matching their branching activity, suggesting that like PgMAX1, it either has been biased by a particularly poorly-rescuing line (which seems less likely here than for PgMAX1), or that it perhaps lacks some capability that specifically relates to leaf shape. If this were to be the case, it would be a further example of divergence in function among the rice MAX1s, which despite multiple different clades seem to share a high degree of function.

169 169 A Centroid size B PC2 Figure Leaf shape analysis for Procrustes-fitted adult leaves four and above from max1-1 plants complemented with OsMAX1 orthologues. Error bars are standard error of the mean, calculated on number of plants as n, where n = 15 for controls, and n=6-9 plants per individual transgenic line. Shown are mean centroid sizes (A) and standard deviations from the mean leaf for PC2 (width at centre, B). Line breakdowns are given for phenotypes in which lines of the same construct showed differences in degree of rescue. Letters indicate non-significance in Tamhane s T2 post-hoc test at P>


170 170 A PC9 B PC3 C PC10 Figure Leaf shape analysis for Procrustes-fitted adult leaves four and above from max1-1 plants complemented with OsMAX1 orthologues. Error bars are standard error of the mean, calculated on number of plants as n, where n = 15 for controls, and n=6-9 plants per individual transgenic line. Shown are standard deviations from the mean leaf for PC9 (A), PC3 (B) and PC10 (C). Line breakdowns are given for phenotypes in which lines of the same construct showed differences in degree of rescue. Letters indicate non-significance in Tamhane s T2 post-hoc test P>0.05 (PC10) and Tukey s Honestly Significant Difference at P>0.05 for PC9 and PC3.
171 In planta expression of OsMAX orthologues As at least three of the OsMAX1 orthologues were capable of complementing Atmax1-1 almost completely, publically available expression databases were again explored for signs of differential expression. The Rice Expression Profile Database (RiceXPro, uses the Agilent 44k microarray platform, one of only two with probesets for all five orthologues, and holds data from studies investigating anatomy, leaf development and root development of sequenced cultivar Nipponbare in the field (Sato et al., 2010; Sato et al., 2011). Data from the anatomy and leaf development series were visualised as heatmaps (Figure 5-14) using the metaanalysis database at the Rice Oligonucleotide Array Database (Jung et al., 2008) and do reveal expression differences between orthologues. Os02g stands out as being particularly expressed in the leaf blade, increasing over time, but also with some presence in stems and inflorescences. In comparison, Os06g is principally expressed in roots and stems, with perhaps some leaf expression. The three chromosome 1 genes show very similar patterns of expression in roots and a little in ripening stems, but do so in a clear series of decreasing overall expression from Os01g as the most highly expressed, through the weaker, but almost identical pattern of Os01g to Os01g , which barely shows expression even in roots. Analysis of the root tissue dataset (not shown as heatmaps were not available) indicated little spatial or developmental differences in expression within the roots for Os01g or Os02g In comparison Os06g was principally expressed in the endodermal, pericycle and stele tissues and down regulated in the root cap and division zone relative to its expression in the rest of the root, whereas both Os01g and Os01g showed greater expression in the cortex, and in the developmental series were highest in the elongation zone and younger parts of the maturation zone. 171


172 172 A B Figure Heatmaps generated from the meta-analysis database at the Rice Oligonucleotide Array Database (Jung et al., 2008) based on data from the RiceXPro project on the Agilent 44k microarray platform using sequenced cultivar Nipponbare (Sato et al., 2010; Sato et al., 2011) and divided by anatomy (A) and series of leaf development (B). DAF = days after flowering, DAT = days after transplantation to the paddy field.
173 Relating function to gene structure The functional information from the complementation analysis provided the opportunity to explore links between function and underlying genetic structure in the orthologues. Protein similarities showed no correlation with functional capabilities, as SmMAX1, with 34.9% identity to AtMAX1 rescues, whereas Medtr1g s capability is much reduced despite sharing 67% identity to AtMAX1. Therefore protein sequence alignments, shown in Figure 5-15, were inspected more closely to discover whether there were any residues that may have contributed to the incapability of Os01g and the reduced ability of Medtr1g to complement Arabidopsis. In the case of Os01g a deletion at the 3 end of the sequence presents a strong candidate for the explanation of its complete loss of MAX1- like function, as 19 residues have been lost compared to AtMAX1, including two highly conserved lysine residues (K), an otherwise completely conserved glycine (G) that is also found in many other cytochrome P450s from Arabidopsis (Paquette et al., 2009) and an arginine (R) residue that represents the end of the consensus sequence and which is conserved in all other MAX1 orthologues (see Figure 3-5). This deletion appears to have arisen from a mutation resulting in a premature TAG stop codon, possibly by C-to-T transition from the codon for tryptophan, the amino acid present at this position in PgMAX1, Os06g , and Os01g , the last being the closest relative Os01g Given the number of residues deleted, and their conservation not only in MAX1 sequences but in other CYPs (indeed, no annotated CYP in Arabidopsis has so few residues at the 3 end after the haembinding motif), it is quite possible that Os01g has not only lost MAX1 function, but all function, and is becoming a pseudogene. For Medtr1g015860, no deletion of conserved residues was found, but comparison of consensus sequences calculated with and without the two non- MAX1-function orthologues revealed only two residues in Medtr1g different to the consensus (highlighted in yellow in Figure 5-15). These are a change from an aspartic acid (D-286 in AtMAX1) to an asparagine and of a phenylalanine (F-431) in Arabidopsis) to a tyrosine. Of these two, D-286 is on 173
174 174 the edge of the fourth Substrate Recognition Sequence defined in Nelson et al. (2008), and might be a candidate for the change in function. However, there are several differences compared to the other sequences in non-conserved regions, which may also contribute to affect function. As the mutation(s) that have changed the MAX1-like function in Medtr1g do not seem to have abolished that function, without information on the structure of the CYP711A enzymes and their substrates, the sequence changes leading to function change in Medtr1g are much less easy to identify than those of Os01g
175 Figure Alignment of protein sequences for all constructs transformed into transgenics. Consensus sequences (100% identity threshold) were generated in BioEdit, both for all sequences, and for only those that showed the capability to completely rescue branching in Arabidopsis max Medtr3g MVFMDLEWLFPIPISVSFASTILALAGG--WLIYLYEPYWRVRKVPGPPSLPLVGHLHLLAKHGPDVFSVLAKQYGPIYRFHMGRQ At2g MKTQHQWWEVLDPFLTQHEALIAFLTFAAVV-IVIYLYRPSWSVCNVPGPTAMPLVGHLPLMAKYGPDVFSVLAKQYGPIFRFQMGRQ Medtr1g MLFISVILNVPL---ASTIFILVTLMGG--LVGYLYWPFWKLRKVPGPPSLPLVGHLPLLAKYGPDVFSVLAKQYGPIYRFHMGRQ Os01g MDISEVLGAT----AEWAVTLVAMAVGLLVVAYLYEPYRKVWHVPGPVPLPLIGHLHLLAMHGPDVFSVLARKHGPVFRFHMGRQ Os01g MEIISTVLGST----AEYAVTLVAMAVGLLLLGYLYEPYWKVRHVPGPVPLPFIGHLHLLAMHGPDVFTVLARKYGPVFRFHMGRQ Os01g MEISTVLGAIL---AEYAVTLVAMAVGFLVVGYLYEPYWKVRHVPGPVPLPLIGHLHLLAMHGPDVFSVLTRKYGPIFRFHMGRQ Os06g MEA----LVAAAAAAARDQPWLLLPWSWLAGVVVVVVYFYAPWWGVRRVPGPAALPVVGHLPLLAAHGPDVFAVLAKKYGPIFRFHLGRQ Os02g MQASSMEASNCSIALEISHVATPGLPVLLLGSSLALLAVFLVYFYAPFWSLRTVPGPPTRFPIGHLHLLAKNGPDVFRAITKEYGPIFRFHMGRQ P_glauca_MAX1 MASLCGLLTIFSTETDRFISTQDQFMNTTTILICVFILAAASITAWIYLATPTWKVRRVPSPPAFWLLGHLPLLAKHGPEVFIQLARKYGPIYRFNIGRQ SmMAX MALIIAVFFVILVTILIYLQWPAWKLSKIPAAPYISGLGHLPLMAKYQAGVFIKLAKQLGPIYRFQLGRQ Consensus for all Y P P GHL L A VF GP RF GRQ Consensus for rescuing orthologues only Y P W P GHL L A VF GP RF GRQ Medtr3g PLIIVADAELCKEVGIKKFKDIPNRSTPSPIKASPLHQKGLFFSRDSQWSTMRNTILSVYQPSHLSRLVPTMQSFIESATQNLDSQ--KED-IFFSNLSL At2g PLIIIAEAELCREVGIKKFKDLPNRSIPSPISASPLHKKGLFFTRDKRWSKMRNTILSLYQPSHLTSLIPTMHSFITSATHNLDSK--PRD-IVFSNLFL Medtr1g PLIIIADAELCKEVGIKKFKEIPNRSIPSPISASPLHQKGLFFTRNSQWSTMRNTILSVYQPSHLANLVPKMQSFIESATQNLDDTS-KED-IIFSNLSL Os01g PLIIVADAELCKEVGVKKFKSIPNRSMPSPIANSPIHKKGLFFIRGPRWTSMRNMIISIYQPSHLASLIPTMESCIQRASKNLDGQ---KE-ITFSDLSL Os01g PLVMVADAELCKEVGVKKFKSIPNRSMPSAIANSLINQKGLCFTRGSRWTALRNMIISIYQPSHLASLIPTMQSCIECVSKNLDGQ---ED-ITFSDLAL Os01g PLVMVADAELCKEVGVKKFKNFPNRSMPSPITNSPVHQKGLFFTSGSRWTTMRNMILSIYQPSHLATLIPSMESCIERAAENLEGQ---EE-INFSKLSL Os06g PLVIVAEAELCKEVGIRQFKSIANRSLPAPIAGSPLHQKGLFFTRDARWSAMRNTIISLYQPSHLAGLIPTMHSCVARAADAIAAAE-QRD-VDFSDLSL Os02g PLVIVANAELCKEVGIKKFKDIRNRSTPPPNVG-TLHQDALFLTRDSTWSSMRNMVIPLYQPARLAGLIPTMQSYVDALVDNIAGCP-DQDCIPFCQLSL P_glauca_MAX1 PLVVIADADLCREVGIKKFKQFSNRSIPSPIASSPLHQKGLFFTRDSRWSSMRGAIQPLYQTGRISNLLPVMERVVCVLKRKLAAKE-ETDDIDFSELLL SmMAX1 PIVFVASADLCQEIAIRKFKVFPNRVILPYMKESWIHLHGLFMTKAPDWARMRNILLPTFHTEKLSAYVPLMERVMGQVVEILDKHANAGEDVNMTQLLQ Consensus for all P A A LC E FK NR L W R P M L Consensus for rescuing orthologues only P A A LC E FK NR L W R P M L 175
176 176 Figure Medtr3g KLATDVIGQAAFGVNFGLSQSHSVHNESKNVATDNKDLMNASGSNEVTDFINQHIYSTTQLKMDLSGSFSIILGLLVPILQEPFRQILKRIPGTMDWKIE At2g KLTTDIIGQAAFGVDFGLSGKKPIKD VEVTDFINQHVYSTTQLKMDLSGSLSIILGLLIPILQEPFRQVLKRIPGTMDWRVE Medtr1g RLATDVIGDAAFGVNFGLSKPHSICESMNNVEQ------SSANSDEVSIFINQHIYSTTQLKMDLSGSFSIIIGLIAPILQEPIRQILKRIPGTMDWKME Os01g SLATDVIGLAAFGTDFGLSKLPVTPDDS-NIDKIAAD--TSVEAKASSEFIKMHMHATTSLKMDLSGSLSILVGMLLPFLQEPFRQVLKRIPGMGDYKID Os01g GFATDVIGQAAFGTDFGLSKISASSNDD-DIDKIATD--TSAEAKASSEFIRMHVHATTSLKMDLSGSLSIIIGQLLPFLQEPFRQVLKRIPWTADHEID Os01g SFTTDVLGQAAFGTDFGLSKKLASSDDDEDTRKIAAD--TCAEAKASSEFIKMHVHATTSLKMDMSGSLSIIVGQLLPFLHEPFRQVLKRLRWTADHEID Os06g KLATDVIGQAAFGVDFGLTAAAAAAPRSDDADA DGGE-AAEFIREHVHSTTSLKMDLSGSLSIVLGLVAPALQGPARRLLSRVPATADWRTA Os02g CMAIDIIGKTAFGIEFGLSRKAADTAAGDDGDG DDDDDVKEFLREYKKSMEFIKMDLSSSLSTILGLFLPCVQTPCKRLLRRVPGTADYKMD P_glauca_MAX1 RVATDIIGEAAFGERFGLTEETTTISSS NPAEVSEFIKQHVYSTSSLKMDLNGTFSILVGILFPIAQELFRQILSRIPGTGDWKVC SmMAX1 RMALDVIGESAFGTGFKLVKPSWADGRS EDKDMVNAVLNSLDTLTMNEKAPVSTFAGLFFPFLQHPIREIMKRIPGTGDWNQY Consensus for all D G AFG F L M S G P R D Consensus for rescuing orthologues only D G AFG F L M S G P R T D Medtr3g RTNEKLGGRLDEIVEKRTKDRTRS SKDFLSLILNARESKAVSEN--VFTPEYISAVTYEHLLAGSATTSFTLSSVVYLVAAHPEVEKKMLEE At2g KTNARLSGQLNEIVSKRAKEAETD SKDFLSLILKARESDPFAKN--IFTSDYISAVTYEHLLAGSATTAFTLSSVLYLVSGHLDVEKRLLQE Medtr1g CTNKNLTGRLDDIVKKRMEDKSRT SKNFLSLILNTRESKSVSEN--VFSFDYISAVTYEHLLAGSATTSFTLSSIVYLVAGHPNVEEKLLQE Os01g RVNRALKTHMDSIVAEREAAMEHDLAAS--QQRKDFLSVVLTARESNKSSRE--LLTPDYISALTYEHLLAGSTTTAFTLSTVLYLVAKHPEVEEKLLKE Os01g HVNLALGGQMDKIVAERAAAMERDQAAPHAQQRKDFLSVVLAARESNKSWRE--LLTPDYISALTYEHLLAGSATTAFTLSTVLYLVSKHPEVEEKLLRE Os01g RVNLTLGRQLDRIVAERTAAMKRDPAAL--QQRKDFLSVMLTARESNKSSRE--LLTPDYISALTYEHLLAGSATTAFTLTTALYLVAKHPEVEEKLLRE Os06g RANERLRARVGAVVARRERAGGEARR-----ARRDFLSAVLNARD-GGSDRMRALLTPDYVGALTYEHLLAGSATTAFTLSSAVYLVAGHPGVEAKLLDE Os02g QNERRLCRRIDAIIAGRRRDRDAGDG-----AALDFIAALLDARESGGGGHGGFALEDRHVRALAYEHLIAGTKTTAFTVSSVVYLVSCHPRVEERLLRE P_glauca_MAX1 INNRRLTHRLNAIVEKRKKDVVGKEK------RMDFLSTVT----GSKFSRE--LFSEEYISALTYEHLLAGSATTSFTISVILYLVSAHPDVESKLLRE SmMAX1 TGNLLLEAQMRALLERREAEMRDG------VVRSDALSLLLDARAKSQEMRE--LLTDERVLALAYELMMAGSESTGTNLCYTLYFIAAHPEVASKMVKE Consensus for all L R A YE AG T Y H V E Consensus for rescuing orthologues only L R D A YE AG T Y H V E
177 Figure Medtr3g IDGYGSLDQIPTSQDLHDKFPYLDQVIKEAMRFYIVSPLVARETSNEVEIGGYLLPKGTWVWLALGVLAKDHKNFPEPEKFKPERFDPNCEEMKQRHPYA At2g IDGFGNRDLIPTAHDLQHKFPYLDQVIKEAMRFYMVSPLVARETAKEVEIGGYLLPKGTWVWLALGVLAKDPKNFPEPEKFKPERFDPNGEEEKHRHPYA Medtr1g IDGFGPHDKIPNAKDLNESFPYLDQVIKEAMRIYTVSPLVARETSNEVEIGGYLLPKGTWVWLALGVLAKDSRNYAEPEKFKPERFDPKCGEMKRRHPYA Os01g IDAFGPRYCVPMADDLQTKFPYLDQVVKESMRFYIMSPLLARETLEQVEIGGYVLPKGTWVWLAPGVLAKDPKNFPEPEIFRPERFDPNGEEERRRHPYA Os01g IDGFGPHDHAPTAEDLQTKFPYLDQVVKESMRFYFLSPLIARETCEQVEIGGYALPKGTWVWLAPGVLAKDPKNFPEPEVFRPERFDPNGEEEKRRHPYA Os01g IDGFGPRDRVPTAEDLQTKFPYLDQVLKEAMRYYPSSPLIARELNQQLEIGGYPLPKGTWVWMAPGVLGKDPKNFPEPEVFRPERFDPNGEEEKRRHPYA Os06g VDRFGPPDAVPTADDLEHKFPYLDQVIKEAMRFYTVSPLIARETSEQVEVGGYTLPKGTWVWLAPGVLSRDEAQFRDAGEFRPERFDAGGEEERRRHAYA Os02g IDGFAPRGRVPGADELHAGLPYLNQVIKEAMRFHLVSPLIARETSEPVEIAGHLLPKGTYVWLAPGVLARDAAQFPEPEEFRPERFAAGAAEERARHPYA P_glauca_MAX1 IDEFGPPDRNPAAEDLDIKFPYLTQVIKEAMRFYTVSPLVAREASEPVQIGGYMLPKGTWVWMALNALAKDPRYFPEPEMFNPERFDPECEEEKNRHPYA SmMAX1 IDELAPLGSTVAFEDVD-KFKYVDQVIKESMRMITFSPVVAREAMEDIKVAGYHIPKGTWVWLVINALAQDEEDFPEPHLFRPERFDPDCAEAKKRHPYA Consensus for all D Y QV KE MR SP ARE G PKGT VW L D F PERF E RH YA Consensus for rescuing orthologues only D Y QV KE MR SP ARE G PKGT VW L D F F PERF E RH YA Medtr3g FIPFGIGPRACIGQKFSMQEIKLSLIHLYKKYLFRHSADMESPLELEYGIVLNFKHGVKFSVIKRTEMSC- At2g FIPFGIGPRACVGQRFALQEIKLTLLHLYRNYIFRHSLEMEIPLQLDYGIILSFKNGVKLRTIKR Medtr1g FIPFGIGPRACIGQKFSLQEIKLTLIHLYRKYIFRHSLNMEKPVELEYGLVLNFKHGIKLRVIKRT----- Os01g FIPFGIGPRVCIGQKFSIQEIKLSMIHLYRHYVFRHSPSMESPLEF Os01g FIPFGIGPRACIGQKFSIQEIKLSVIHLYRNYVFRHSPSMESPLEFQYSIVCNFKYGVKLRVIKRHTA--- Os01g LFPFGIGPRACIGQKFAIQEMKLSAIHFYRHYVFRPSPSMESPPEFVYSIVSNFKNGAKLQVIKRHI---- Os06g HVPFGLGPRACPGRRFALQEVKLAMAHLYRRFVFRRSPRMESPPELQFGMVLSFRRGVKLTAVERRHAAAA Os02g HIPFGIGPRACVGHRFALQQVKLAAVGLYRRYVFRHSPAMESPLQFDFDLVLAFRHGVKLRAIKRTNT--- P_glauca_MAX1 NSPFGIGPRACIGMKFAFQEIKVVLIHLYQLYTFDHSPAMENPLEFQFGIVVSVKYGIRLRLRHRRAQSPV SmMAX1 HSPFGIGPRMCIGYKLAYLEMKLALIHFYQRYTFEHSPAMENPLAVRLSIVVRPIHGVKLRVRKREIC--- Consensus for all PFG GPR C G K Y F S ME P Consensus for rescuing orthologues only PFG GPR C G K Y F S ME P G R 177
178 Discussion The concept that the duplication of genetic material provides the substrate for evolutionary novelties, through subfunctionalisation or neofunctionalisation, has a very long history (reviewed in Taylor and Raes, 2004). However, the majority of duplicates are lost through degeneration, and selection is required to maintain the duplicates in the population. Given the plethora of WGDs known in the angiosperm lineage, if every copy of the MAX paralogues deriving from the ancestral angiosperm had been conserved, Arabidopsis would by now have at least 12 parallel SL pathways (from the α and β duplications, and the γ hexaploidisation), and rice would have 4 (from the ρ and σ duplications) and both of these numbers exclude the contribution of local duplications to individual genes. However, the paralogues of most members of the pathway have degraded beyond recognition in most lineages, even those of MAX2, which as an F-box LRR protein is one of the more conserved members of a family with an otherwise high gene birth rate (Xu et al., 2009). The exceptions are the triplet- and twin-clades of D14 and D27, and MAX1, and within the D14 and D27 clades copy-numbers are conserved within the angiosperms (R. Challis et al., in preparation, and Waters et al., 2012). Even in MAX1, the most notable duplications have persisted principally in the monocot lineages, to which both WGDs and local tandem duplications have contributed. There are several driving forces for the maintenance of duplicates subfunctionalisation, neofunctionalisation or functional buffering (redundancy), the likelihood of each being influenced by many factors, including the mechanism of duplication and their original function (Chapman et al., 2006; reviewed in Lynch, 2007, Chapter 8; Wang et al., 2011b). Complementation and expression pattern analyses were therefore used to investigate why the duplicates of MAX1 present in some eudicot species and all monocot species had been retained. Three possibilities were considered that they had diverged in function or expression, providing added flexibility of control or new functions, that they were contributing to redundancy in the pathway, or that they were in the process of becoming non-functional. For the two paralogues of AtMAX1 in Medicago, divergence of function by one paralogue is clear both in terms of function and regulation (factors that may
179 179 not necessarily coevolve). These paralogues are part of a small region of microsynteny between chromosomes 1 and 3 remaining from a WGD estimated to have occurred between the emergence of the legumes and the papilinoid subfamily, to which both Medicago and pea belong, about 58 million years ago (Young et al., 2011). Glycine max (soybean) is also in the Papilinoideae group and shares this region of synteny on three chromosomes, having undergone a second, Glycine specific WGD approximately 13 mya, resulting in four MAX1 orthologues (Schmutz et al., 2010). This syntenic area is also shared with a region on chromosome 4, also containing a MAX1 orthologue, of the grapevine Vitis vinifera, regions on poplar chromosomes 6 and 18 (again, the locations of the PtMAX1 orthologues), and with the Arabidopsis chromosome 2 site of AtMAX1 itself. The legumes, poplar and Arabidopsis are all fabids (or belong to the eurosid I group), whereas grapevine does not belong to either of the eurosid groupings (although it is a rosid), and unlike the others is not thought to have undergone any WGD events since the γ hexaploidisation shared by all eudicots studied (Jaillon et al., 2007; Argout et al., 2011; Young et al., 2011). This suggests that this apparently shared locus is the ancestral site for a single-copy rosid MAX1. If, as the results from PgMAX1 and SmMAX1 suggest, and results from Drummond et al. suggest for a MAX1 orthologue for petunia (2012), the AtMAX1 function corresponds to that of the ancestral paleomax1 function, then it would appear that the Medtr3g paralogue has conserved this enzyme capability, whereas Medtr1g has diverged away from it. In either case, it implies that the functional redundancy supplied by Medtr1g to SL production is likely to be limited, raising the question of whether the mutants in the putative orthologues in pea are missing from SL mutant collections because they are hidden by MAX1 functional redundancy, or are currently just plain missing, like the pea equivalent of D27. It may be that the MAX1 functions of the pea orthologues have not diverged to the same extent or fate as those of Medtr1g and Medtr3g mutant, as peas and medics belong to different tribes of the Papillionoideae subfamily. Indeed, given the apparent conservation of the whole syntenic region of the eudicot MAX1 locations, it may be that the MAX1s have been shielded from the degradation, and especially the rearrangement particularly common in angiosperms, by the close presence of some other, particularly critical factor to eudicot fitness, so that for some of
180 180 evolutionary time their own fate has been or still is more dependent on that of another gene than on their own contribution to plant survival. Whether the functional divergence in Medtr3g is neo- or subfunctionalisation cannot be judged from the plant-scale phenotype rescue, as CYP450s may carry out several different reactions on the same or different substrates, and although Medtr1g appears to have lost most capacity to catalyse the ancestral reaction, it retains some. It may thus just have evolved to be optimally adapted to one of the different reactions within a subset that may have originally been catalysed by the ancestral protein. More detailed enzyme kinetic analysis would be required to resolve this point. The expression data, however, may support a hypothesis of subfunctionalisation at the level of regulation, as although the paralogues share very similar patterns, Medtr1g is specifically upregulated in response to the starvation of nodulating roots of N 2 (Ruffel et al., 2008). Both legumes and non-legumes are known to increase SL exudation in response to phosphate starvation (likely to increase AMy symbiosis), and there is increasing evidence that several plants also upregulate SL synthesis in response to nitrogen (N) starvation. The divide between those species that do or do not exude SLs on N limitation does not correspond to the legume/non legume divide for example, Medicago sativa (alfalfa) is among the legumes that do not increase SLs in response to N limitation (Yoneyama et al., 2012). However, SLs in pea roots have been implicated in promoting the formation of nodules, and this appears to be through an effect on plant development, rather than signalling to the rhizobia, as GR24 does not induce calcium signalling or nod gene expression in these bacteria (Moscatiello et al., 2010; Soto et al., 2010; Foo and Davies, 2011). Nevertheless, the production of SLs in Medicago truncatula was recently demonstrated to require NODULATION SIGNALLING PATHWAY1 (NSP1) and NSP2, transcription factors from the GRAS family (Liu et al., 2011). NSP1 and NSP2 are involved in both the nodulation- and AMy symbiotic signalling pathways in Medicago truncatula and Lotus japonicus, although NSP1 is nodulation-specific and the impact on mycorrhizal symbiosis in nsp2 mutants is only a 41% reduction in colonisation in M. truncatula (Maillet et al., 2011). However, these genes are widely conserved throughout the angiosperms and are
181 181 functionally conserved at the protein level (from complementation experiments similar to those used here) in both non-leguminous eudicots and in monocots, suggesting that their ancestral purpose, if symbiotically related at all, is more likely to be in the more ancient and wide-spread AMy symbiosis, similarly to SL signalling (Heckmann et al., 2006; Parniske, 2008; Yokota et al., 2010). Liu and co-workers investigated global gene expression in each of the M. truncatula nsp1 and nsp2 single mutants, identifying the MtDWARF27 orthologue and Medtr3g (termed MAX1 in that study) as being downregulated in both. Their subsequent investigations demonstrated that NSP1 is required for the production of SLs in Medicago, as well as for high expression and response to phosphate in MtD27. nsp2 still maintains some, lowered D27 expression and actually has upregulated production of orobanchol, although it is required for the production of didehydro-orobanchol, the major SL in M. truncatula. Likewise in rice, double knock-down of the single rice orthologues for NSP1 and NSP2 caused reduced expression of D27, reduced production of SLs, and like other SL deficient mutants, increased tiller numbers. Although shoot branching was not increased in the corresponding M. truncatula mutants, this does not rule out a role for SLs in Medicago shoot branching control, as the Jemalong A17 cultivar used does not show significant dormancy of axillary meristems, the branching phenotype under SL control, although some other M. truncatula accessions do, and both these and A17 respond to exogenously applied SLs (C. Mouchel, and O. Leyser, pers. comm.s). Interestingly, the authors also conclude that NSP1 and NSP2-dependent regulation of SLs is not affected by loss of other signal transduction elements in this pathway, and although their data on MtD27 expression in the corresponding mutants shows no downregulation, they may show some upregulation. This may be of interest, as if SLs are acting to promote nodulation, a lack of fungally- or rhizobiallyinitiated signalling might indeed be expected to upregulate SL production. If so, the specific upregulation of Medtr1g under nodulation stress may reflect this, perhaps, for example, as a result of a restriction to regulation by only the nodulation-specific NSP1, whereas Medtr3g is regulated by both NSPs more generally in response to symbiosis. If so, it would be fascinating to know whether the changed catalytic function of Medt1g reflected an adaptation to a nodulation-specific role. The mechanism (direct, indirect &c.) of
182 182 NSP regulation of SL genes is still not known, and nor is the regulation of Medtr1g in response to NSP1, as Liu et al. investigated only genes jointly regulated by both NSPs, but it might represent a hypothesis worth testing. Although the enzymatic functions of the legume MAX1 duplicates have not completely diverged, the ancestral MAX1 function of the rice orthologue Os01g has clearly been entirely lost from Oryza sativa cultivar Nipponbare. Unlike the two MtMAX1 genes the time of the duplication arising in Os01g is less easy to estimate, as it is at one end of the three-gene tandem repeat on chromosome one, one of which may originally derive from the first σ pancereal duplication. This set of repeats is probably rice specific, but sorghum also has a tandem pair in this clade at an orthologous position, and Brachypodium distachyon, a closer relative to rice in the same Pooideae subfamily, has two orthologues that are closely linked in this clade, perhaps suggesting a predilection to local duplication at the ancestral location. Although its age is in doubt, Os01g s evolutionary fate seems fairly clear losing at least 19 residues from the conserved 3 end would probably destine it to join the majority of duplicates in losing their function and degrading beyond recognition. However, Os01g still has an interesting role in the recent evolutionary history of Oryza sativa. A collaboration between the group of Dr Harro Bouwmeester at Wageningen University in the Netherlands and that of Dr Adam Price at the University of Aberdeen has identified quantitative trait loci (QTL) for tiller and strigolactone production in a cross between the hightillering, low SL producing Bala cultivar of the Indica group and the lowtillering, high SL producing Japonica cultivar Azucena (Cardoso et al., in review). This QTL centres on the MAX1 tandem repeat, which is present in the Azucena cultivar, but has been rearranged in the Bala cultivar, deleting Os01g and Os01g and repeating Os01g twice. In collaboration with these groups, both 35S::Os01g (as detailed here) and 35S::Os01g (by Yanxia Zhang at Wageningen) have been found to be capable of complementing Arabidopsis max1-1 branching phenotypes fully, suggesting that their deletion in Bala is the cause of the variation in tillering and SL production phenotypes. Further investigation by the groups in Wageningen
183 183 and Aberdeen on the presence of the deletion allele in the RiceHapMap cultivars have found that it consistently associated with low SL and high tillering phenotypes, and is far more frequent among cultivars of the Indica group (in 126 of 133 tested) than those of the Japonica group (34 of 190 tested, with 31 of those in the 94 tropical japonicas). The rearrangement seems closely associated with the Indica/Japonica divide, itself probably reflecting different domestication events, and perhaps the reduced need in wetland cultivars for SLs to signal to AMy, as phosphate is much more mobile in water than soil. However, the duplicated copies of Os01g in the sequenced Indica cultivar, 93-11, at least, do not have the 3 premature stop codon found in the Japonica Nipponbare genome sequence, instead having a tryptophan residue (as presumed to be mutated in the Japonica allele) followed by another 21 residues, including the conserved glycine, lysine and arginine residues. Whether these orthologues are active or not in SL production is unknown, as no complementation analysis has been carried out on them. Cultivars carrying the Bala/Indica allele do still produce SLs, and it is possible that the Os01g paralogues contribute to these (although clearly less efficiently than the Os01g Os01g haplotype). Equally this role could be carried entirely by the Os02g and Os06g paralogues, both of which are capable of completely rescuing Arabidopsis max1-1, in the case of some leaf phenotypes even more efficiently than the Os01g paralogue presumably also involved in Japonica. The rescue capability of Os02g in particular was somewhat surprising, as this clade has the longest branch length of any of the cereal MAX1 orthologous clades, but on detailed inspection the main signatures of selection on Os02g were indeed found to be of purifying selection (R. Challis, pers. comm.). In terms of functional capability, it would therefore appear that plants carrying the Azucena/Japonica haplotype have four orthologues with strong similarity and functional competence to catalyse the AtMAX1 function, and that plants carrying the Bala/Indica haplotype have at least two and possibly as many as four, although these are less competent in planta for SL production as those of the other haplotype. In summary, the Indica deletion story demonstrates that MAX1 orthologues in rice are contributing to SL production, and that these alleles are contributing to the
184 184 domestic selection, (if not necessarily the natural selection) of an important cereal (Cardoso et al., in review). If divergence in the roles of these orthologues has occurred, then it seems likely that these roles are defined by differences in regulation. Expression analysis of responses to phosphate limitation by all five Japonica genes in the Japonica cultivar Shiokari by Umehara et al. (2010) did reveal some regulatory differences. All but Os01g and Os06g were upregulated in the roots in response to phosphate starvation in similar patterns seen in the other SL biosynthesis genes, although only Os02g was upregulated in shoots, like the other biosynthesis genes. In fact, only Os01g , Os06g and Os02g were detectable in shoots at all, and Os02g was the only one expressed at comparable (even greater) level in shoots as in roots (Umehara et al., 2010). This compares well with the data from RiceXPro, in which Os02g was mainly leaf specific whereas the other genes were root- or stem expressed. Put together, the information from RiceXPro and Umehara et al. build a pattern of differential characteristics for the expression of all the orthologues; the expression patterns of Os06g , Os02g and the chromosome 1 clade are largely spatially defined, while within the chromosome 1 clade differentiation is provided between Os01g and Os01g by phosphate response, and between Os01g and everything else by its generally low level. However, although these data provide some evidence for subfunctionalisation, there is clearly a great deal of functional redundancy available in the cereal lineages, probably contributing to the lack of MAX1 orthologue mutants identified in rice.
185 185 Chapter 6. D27 and D27like The identification of the loci affected in the dwarf14 and dwarf27 rice mutants added new genes to the MAX pathway (Ishikawa et al., 2005; Arite et al., 2009; Gao et al., 2009; Lin et al., 2009; Liu et al., 2009). Phylogenetic analysis in the studies of Arite et al. and Lin et al. identified these genes as also being of interest for evolutionary study. Unlike MAX1, D14 and D14like family genes have not multiplied in copy number specifically in the angiosperms or monocots, but do show duplications early in land-plant evolution, leading to two clades being present in vascular plants as well as a third in angiosperms (Arite et al., 2009; Waters et al., 2012). The genetic locus affected in the d27 mutant is a novel protein, with no conserved domains that have any functional annotation (Lin et al., 2009). Despite this, by BLAST searches Lin and coworkers found that potential orthologues of D27 were found throughout the land plant kingdom, but not outside of it, suggesting that this may be a plant specific protein family. Further phylogenetic analysis by Dr Richard Challis found two land-plant clades, D27 and D27like, which appear to have diverged early in land plant evolution, perhaps between the emergence of the lycopodiophytes and the emergence of the gymnosperm clades. These clades are joined by long branch lengths (Figure 6-1) suggesting duplication was followed by sub- or neofunctionalisation. Figure 6-1. Maximum likelihood tree for D27, showing bootstrap support. Dicotyledons in green, monocotyledons in blue, non-angiosperms in black. Scale bar corresponds to one substitution per site. Kindly provided by Richard Challis.
186 186 As D27, like MAX1, is a biosynthetic component of the pathway (D14 being an uncertain case due to the GR24 resistance of its mutants) investigation of the contribution of its divergence to the production of SL-related hormones through evolution seemed very promising. Two genes in Arabidopsis show homology to D27; these are At1g03055, which corresponds to D27, although it shares only 36% sequence identity at protein level (Table 6-1); and At1g64680, which is much more similar (68% protein identity) with D27like. (The rice genes are annotated Os08g02210 (RGAP) or Os08g (RAP-DB), both for D27like, but there is no accurate annotation extant for D27 save that of the paper reporting it, although it was Os11g37650 in RGAP release 5). As a role for D27 in SL biosynthesis or shoot branching had not yet been shown in Arabidopsis, the functions of both genes were explored in Arabidopsis, and the hypothesis was raised that the divergence of the D27 clade from the D27like indicated that while D27 had either retained a role in, or been co-opted into, the SL production pathway (a role it would share in Arabidopsis), the D27like clade was involved in a different, non-sl related role. Table 6-1. Matrix of protein identities for A. thaliana and O. sativa D27 and D27like orthologues. Sequence Identity Matrix OsD27 AtD27 OsD27like AtD OsD27like AtD27like Expression of AtD27 and AtD27like Existing databases of gene expression were explored to investigate whether the Arabidopsis orthologues of D27 and D27like were expressed in similar patterns both to each other and to D27. Expression analysis from Genevestigator (Hruz et al., 2008) and AtGenExpress (Schmid et al., 2005) found that, although AtD27 signal was rarely significantly identified on the
187 187 microarray chip, where registered both orthologues were expressed in cotyledons, rosette and cauline leaves (particularly AtD27like), with some expression also in stems, within the sepals of flowers, and in the endosperm of seeds. In all of these tissues, except endosperm, AtD27like showed high expression compared to elsewhere in the plant, whereas AtD27 merely showed slightly more expression than otherwise. However in endosperm, this pattern was reversed, as AtD27 was particularly highly expressed whereas AtD27like showed slightly higher expression compared to elsewhere. Neither gene was expressed highly, if at all, in roots. This compares well with the expression of OsD27like in rice, as seen in data from RiceXPro, in which OsD27like is highly expressed in leaves, less so in stems and the lemma and palea of florets, and a little in endosperm. However, the expression seen in AtD27 appears to match less well to that of OsD27 as reported by Lin et al. (2009), possibly because the panicles, shoot bases, axillary meristems, and the vascular tissues, in which OsD27 was found to have highest expression are rarely dissected out for microarray analysis, with the exception of panicles (inflorescences in Arabidopsis), and so precise data for these tissues for AtD27 is unavailable. Exploring databases also contributed to identifying the subcellular location of the proteins encoded by AtD27like. Although no information was available for AtD27, the proteomics database AT_CHLORO indicates that protein fragments corresponding to the predicted product of At1g64680 have been identified in fractions purified from chloroplast envelopes and thylakoid membranes, a localisation for AtD27like which would match that of OsD27 (Lin et al., 2009; Ferro et al., 2010). 6.2 Function of D27 and D27like A genetic approach was used to investigate whether AtD27 and AtD27like had functions in the Arabidopsis SL pathway. Mutant collections in the Columbia-0 ecotype background were searched for insertions associated with either of AtD27 or AtD27like (At1g03055 and At1g64680 respectively, in the annotation of The Arabidopsis Information Resource). An insertion line, 134E08 from the Gabi-KAT collection (Rosso et al., 2003) was identified for AtD27. This line also carries a T-DNA insertion in At1g79110, but this was
188 188 easily segregated from the At1g03055 insertion and plants carrying the single insertion were then backcrossed twice to the Columbia-0 wildtype background. The insertion is within the fifth exon, but right at its beginning (at the 3 rd base pair of the exon, see Figure 6-2) according to sequence results using genespecific and T-DNA primers from the GABI-Kat database. This site is upstream of the site of the mutation in the rice d27, and is likely to create a premature stop codon. Neither full-length genomic nor cdna sequence could be amplified from the mutant using RTPCR, therefore the insertion likely results in complete loss of function of AtD27. Only in one out of five plants could transcript be amplified from the mutants, and only then at ten PCR cycles greater than that needed to bring the wildtype gene to plateau phase (Figure 6-3A). This line was therefore designated Atd27-1. In addition, seed for two RNAi lines targeting D27 in Arabidopsis were kindly donated by Dr Yonghong Wang of the Institute of Genetics and Developmental Biology, Beijing. Despite the incomplete knock-down of the AtD27 transcript in these lines (Figure 6-3) Dr Wang s group had found these lines to show increased rosette branching, although only to a fraction of the max mutant phenotype. AtD27 5 GK134E08 AtD27like 5 Figure 6-2. Exon structure for AtD27 and AtD27like, with untranslated regions in dark blue, and insertion point of GABI-Kat line 134E08. No insertion lines were available for AtD27like that showed an effect on transcript levels or a clear phenotypic effect, so a transcriptional knockdown approach was used (as opposed to post-transcriptional or RNAi approach), in which the promoter is targeted for methylation by use of an antisense hairpin construct. The vector used is an adaptation of the pfgc5941 vector (Kerschen et al., 2004), developed by Dr Louise Jones lab, in which a constitutive NOS
189 Columbia-0 max1-1 AtD27like KD12.2 Atd27-1 AtD27 RNAi 1-12 AtD27 RNAi 2-1 No RT control Columbia-0 max1-1 AtD27like KD12.2 Atd27-1 AtD27 RNAi 1-12 AtD27 RNAi 2-1 No RT control Columbia-0 dh 2 O Atd27-1 seg. 1 Atd27-1 seg. 2 Atd27-1 seg. 3 Atd27-1 seg. 4 Atd27-1 seg A 35 cycles 45 cycles B TUB9 28 cyc AtD27like 28 cyc AtD27like 33 cyc 10 day old seedlings 15 day old seedlings C Col-0 RNAi-1-12 RNAi-2-1 At1g03055 (32 cycles) At1g64680 (34 cycles) MAX1 MAX2 MAX3 MAX4 Tubulin (34 cycles) (30 cycles) (40cycles) (40 cycles) (28 cycles) (T2 progeny) Figure 6-3. Expression of MAX pathway genes in mutants and knockdown lines. A) Expression of AtD27 in adult rosette leaves of Atd27-1 (5 individual single-insertion segregants from the GABI-Kat
190 190 line 134E08 carrying an insertion in AtD27 only) compared to Columbia-0, B) expression of AtD27like in 10 and 15 day old seedlings (pooled RNA from 10 seedlings each) of the AtD27like knockdown line and Atd27 mutant and knockdown lines, and C) expression of MAX genes in AtD27 RNAi knockdowns. Figure C kindly courtesy of Yonghong Wang. Tubulin (TUB9) was used as loading controls. No RT (no reverse transcriptase) and dh 2 O were used as no-template controls. promoter (replacing the 35S promoter in the original vector) drives an inverted repeat of the target promoter to be silenced, with the repeats separated by an intron from the chalcone synthase gene. This approach was employed as it leaves open the possibility of re-complementation by the wild-type gene under the control of a different promoter (e.g. CaMV35S). A single line, KD12.2, showing substantial downregulation of the gene was obtained (Figure 6-3). Given that at least four extra cycles are required to produce a comparable band in the semi-quantitative RTPCR for the knockdown mutant compared to the wildtype, the knockdown may be estimated (assuming primer efficiency to be reasonable) to be approximately 16-fold lower than the wildtype expression level (i.e. less than 10% of it). Therefore, in the absence of any more efficient knock-out or knockdown, this line was used for phenotypic analysis Branching The branching of the knockdown lines and the insertion mutant was assessed as previously described for the max1 complementation transgenics. In the short day decapitation assay (Figure 6-4 and Figure 6-5) none of the three knock-down lines, AtD27 RNAi 1-12 and 2-1 and AtD27like KD12.2, were different to the Columbia-0 control. This is in contrast to the results seen by Prof. Wang s group for the RNAi lines in the T3 generation. However, a previous replicate, using the RNAi lines, of the experiment shown in Figure 6-4 gave the same result, suggesting that either the phenotype is too weak to be seen in this assay, or possibly that in the generation used by this author (T4) the RNAi construct itself had silenced. The Atd27-1 mutant, with a mean number of rosette branches of 9.2, was far less branchy than max1-1 (which had a mean of 13.7 rosette branches see also Figure 6-6), although it still has on average 3 more branches than Columbia-0, and was significantly different to it at P=0.002 in a Kruskal-Wallis test. Atd27-1 therefore seems to display an intermediate phenotype to that of max1-1 and Columbia-0. The branching phenotype does

191 191 not seem to be mirrored in the height phenotype (Figure 6-5), but height may be less sensitive to SL depletion. However, these phenotypes clearly show that AtD27 has a role in shoot branching control in Arabidopsis. Figure 6-4. Rosette branching of AtD27 and AtD27like knockdowns and mutants compared to wildtype and max1-1. Branching was assessed by short-day decapitation assay as described by Greb et al. (2003). N for Columbia-0 max1-1 and Atd27 = 40, for knockdown lines n = 20. Shared letters indicate no significant difference in a Kruskal-Wallis test to P 0.001, except letter c which indicates no significant difference to P Error bars show standard error of the mean.
. N for Columbia-0 max1-1 and Atd27 = 40, for knockdown lines n = 20.")

192 192 Figure 6-5. Rosette branching plotted against height for AtD27 and AtD27like knockdowns and mutants compared to wildtype and max1-1. Branching was assessed by short-day decapitation assay as described by Greb et al. (2003). N for Columbia-0 max1-1 and Atd27 = 40, for knockdown lines n = 20. Height (in centimetres) of the longest branch was measured the day of scoring for branching. Error bars show standard error of the mean. Note y axis starts at 20cm. Figure 6-6. Photograph of AtD27 and AtD27like knockdowns and mutants compared to wildtype and max1-1. Right to left, Columbia-0, Atd27-1, AtD27 RNAi 1-12, AtD27 RNAi 2-1, AtD27like KD12.2, max1-1.

193 193 If the Atd27 mutation results in decreased biosynthesis of strigolactones, it would be expected that supplementing Atd27 plants with strigolactones would reduce their more-branchy phenotype. Therefore a GR24 dose response assay was carried out on the Atd27-1, AtD27 and AtD27like knockdown lines. In this assay the number of rosette branches in all genotypes is reduced, which rendered the differences between Atd27-1 and Columbia-0 too small to be significant. Although no differences in branching between lines, or between different treatments of the same line were significant, except for the max1-1 control, across two of the three replicate experiments all lines, including that of Columbia-0, did show some reduction in branching on 1μM GR24 to levels the same or below that of the Columbia-0 acetone-carrier-treated control, suggesting that what little branching phenotype Atd27-1 possesses, it is not resistant to SL. Figure 6-7. Mean number of branches for plants grown on agar containing GR24 dissolved in acetone, with the acetone carrier as a control. 3 rd and representative of 3 replicates. Branches were scored after approximately five weeks when the first siliques had formed. Columbia and max1-1 are controls. Error bars are standard error of the mean. Samples treated with GR24 were compared to the samples of the same genotype treated with acetone, where ** = significant difference to P<0.001 in Kruskal-Wallis test (adjusted for multiple sampling).
Major Plant Hormones 1.Auxins 2.Cytokinins 3.Gibberelins 4.Ethylene 5.Abscisic acid
 Plant Hormones Lecture 9: Control Systems in Plants What is a Plant Hormone? Compound produced by one part of an organism that is translocated to other parts where it triggers a response in target cells
Reproduction, Seeds and Propagation
 Reproduction, Seeds and Propagation Diploid (2n) somatic cell Two diploid (2n) somatic cells Telophase Anaphase Metaphase Prophase I One pair of homologous chromosomes (homologues) II Homologues condense
Plant Stimuli pp Topic 3: Plant Behaviour Ch. 39. Plant Behavioural Responses. Plant Hormones. Plant Hormones pp
 Topic 3: Plant Behaviour Ch. 39 Plants exist in environments that are constantly changing. Like animals, plants must be able to detect and react to stimuli in the environment. Unlike animals, plants can
The mode of development in animals and plants is different
 The mode of development in animals and plants is different Outcome of animal embryogenesis is a mini edition of the adult Outcome of plant embryogenesis is a simple structure with -root apical meristem
Apical dominance models can generate basipetal patterns of bud activation
 Apical dominance models can generate basipetal patterns of bud activation Przemyslaw Prusinkiewicz 1, Richard S. Smith 1 and Ottoline Leyser 2 1 Department of Computer Science, University of Calgary 2
23-. Shoot and root development depend on ratio of IAA/CK
 Balance of Hormones regulate growth and development Environmental factors regulate hormone levels light- e.g. phototropism gravity- e.g. gravitropism temperature Mode of action of each hormone 1. Signal
10/4/2017. Chapter 39
 Chapter 39 1 Reception 1 Reception 2 Transduction CYTOPLASM CYTOPLASM Cell wall Plasma membrane Phytochrome activated by light Cell wall Plasma membrane Phytochrome activated by light cgmp Second messenger
Useful Propagation Terms. Propagation The application of specific biological principles and concepts in the multiplication of plants.
 Useful Propagation Terms Propagation The application of specific biological principles and concepts in the multiplication of plants. Adventitious Typically describes new organs such as roots that develop
Plant Development. Chapter 31 Part 1
 Plant Development Chapter 31 Part 1 Impacts, Issues Foolish Seedlings, Gorgeous Grapes Gibberellin and other plant hormones control the growth and development of plants environmental cues influence hormone
Molecular Genetics of. Plant Development STEPHEN H. HOWELL CAMBRIDGE UNIVERSITY PRESS
 Molecular Genetics of Plant Development STEPHEN H. HOWELL CAMBRIDGE UNIVERSITY PRESS Contents Preface A Word on Genetic Nomenclature page xiii xvii 1 Approaches to the Study of Plant Development 1 Pattern
CONTROL SYSTEMS IN PLANTS
 AP BIOLOGY PLANTS FORM & FUNCTION ACTIVITY #5 NAME DATE HOUR CONTROL SYSTEMS IN PLANTS HORMONES MECHANISM FOR HORMONE ACTION Plant Form and Function Activity #5 page 1 CONTROL OF CELL ELONGATION Plant
Pea Has Its Tendrils in Branching Discoveries Spanning a Century from Auxin to Strigolactones 1
 Update on Pea Shoot Branching Pea Has Its Tendrils in Branching Discoveries Spanning a Century from Auxin to Strigolactones 1 Christine A. Beveridge*, Elizabeth A. Dun, and Catherine Rameau School of Biological
CONTROL OF GROWTH BY HORMONES
 CONTROL OF GROWTH BY HORMONES Growth and organogenesis are controlled......by genes (independent of environment): e.g., number of primary vascular bundles, general shape of a leaf or flower...by genes
CONTROL OF PLANT GROWTH AND DEVELOPMENT BI-2232 RIZKITA R E
 CONTROL OF PLANT GROWTH AND DEVELOPMENT BI-2232 RIZKITA R E The development of a plant the series of progressive changes that take place throughout its life is regulated in complex ways. Factors take part
Plant Growth and Development
 Plant Growth and Development Concept 26.1 Plants Develop in Response to the Environment Factors involved in regulating plant growth and development: 1. Environmental cues (e.g., day length) 2. Receptors
Plant Structure, Growth, and Development
 Plant Structure, Growth, and Development Plant hierarchy: Cells Tissue: group of similar cells with similar function: Dermal, Ground, Vascular Organs: multiple kinds of tissue, very diverse function Organ
Cytokinin. Fig Cytokinin needed for growth of shoot apical meristem. F Cytokinin stimulates chloroplast development in the dark
 Cytokinin Abundant in young, dividing cells Shoot apical meristem Root apical meristem Synthesized in root tip, developing embryos, young leaves, fruits Transported passively via xylem into shoots from
Outline. Leaf Development. Leaf Structure - Morphology. Leaf Structure - Morphology
 Outline 1. Leaf Structure: Morphology & Anatomy 2. Leaf Development A. Anatomy B. Sector analysis C. Leaf Development Leaf Structure - Morphology Leaf Structure - Morphology 1 Leaf Structure - Morphology
Strigolactones enhance competition between shoot branches by dampening auxin transport
 RESEARCH ARTICLE 2905 Development 137, 2905-2913 (2010) doi:10.1242/dev.051987 2010. Published by The Company of Biologists Ltd Strigolactones enhance competition between shoot branches by dampening auxin
BIO1PS 2012 Plant Science Lecture 4 Hormones Pt. I
 BIO1PS 2012 Plant Science Lecture 4 Hormones Pt. I Dr. Michael Emmerling Department of Botany Room 410 m.emmerling@latrobe.edu.au Hormones and Ghost gum Eucalyptus papuana Coordination ~3 Lectures Leaves
can affect division, elongation, & differentiation of cells to another region of plant where they have an effect
 Note that the following is a rudimentary outline of the class lecture; it does not contain everything discussed in class. Plant Hormones Plant Hormones compounds regulators growth or can affect division,
PLANTS FORM AND FUNCTION PLANT MORPHOLOGY PART I: BASIC MORPHOLOGY. Plant Form & Function Activity #1 page 1
 AP BIOLOGY PLANTS FORM AND FUNCTION ACTIVITY #1 NAME DATE HOUR PLANT MORPHOLOGY PART I: BASIC MORPHOLOGY Plant Form & Function Activity #1 page 1 PART II: ROOTS 1. Examine the examples of the two root
COMPETITIVE CANALIZATION OF AUXIN IN PEA CAN BE INVOLVED IN INITIATION OF AXILLARY BUD OUTGROWTH
 COMPETITIVE CANALIZATION OF AUXIN IN PEA CAN BE INVOLVED IN INITIATION OF AXILLARY BUD OUTGROWTH Medveďová Z. 1, Balla J. 1, 2, Procházka S. 1 1 CEITEC - Central European Institute of Technology, Mendel
Plant hormones: a. produced in many parts of the plant b. have many functions
 Plant hormones: a. produced in many parts of the plant b. have many functions Illustrated with 4 plant hormones: Gibberellins Auxin Cytokinins Ethylene Gibberellins Gibberellins illustrate how plant hormones
Plant Structure and Organization - 1
 Plant Structure and Organization - 1 In our first unit of Biology 203 we will focus on the structure and function of the higher plants, in particular the angiosperms, or flowering plants. We will look
CBSE Quick Revision Notes (Class-11 Biology) CHAPTER-15 PLANT GROWTH AND DEVELOPMENT
 CHAPTER-15 PLANT GROWTH AND DEVELOPMENT") CBSE Quick Revision Notes (Class-11 Biology) CHAPTER-15 PLANT GROWTH AND DEVELOPMENT Root, stem leaves, flower, fruits and seeds arise in orderly manner in plants. The sequence of growth is as follows-
CBSE Quick Revision Notes (Class-11 Biology) CHAPTER-15 PLANT GROWTH AND DEVELOPMENT Root, stem leaves, flower, fruits and seeds arise in orderly manner in plants. The sequence of growth is as follows-
Chapter 39. Plant Reactions. Plant Hormones 2/25/2013. Plants Response. What mechanisms causes this response? Signal Transduction Pathway model
 Chapter 39 Plants Response Plant Reactions Stimuli & a Stationary life Animals respond to stimuli by changing behavior Move toward positive stimuli Move away from negative stimuli Plants respond to stimuli
Class XI Chapter 15 Plant Growth and Development Biology
 Question 1: Define growth, differentiation, development, dedifferentiation, redifferentiation, determinate growth, meristem and growth rate. (a) Growth It is an irreversible and permanent process, accomplished
REVIEW 7: PLANT ANATOMY & PHYSIOLOGY UNIT. A. Top 10 If you learned anything from this unit, you should have learned:
 Period Date REVIEW 7: PLANT ANATOMY & PHYSIOLOGY UNIT A. Top 10 If you learned anything from this unit, you should have learned: 1. Gas exchange a. structure: stomates b. function: diffusion, supports
Class XI Chapter 15 Plant Growth and Development Biology
 Question 1: Define growth, differentiation, development, dedifferentiation, redifferentiation, determinate growth, meristem and growth rate. (a) Growth It is an irreversible and permanent process, accomplished
Unit 11: Plants Guided Reading Questions (75 pts total)
") Name: AP Biology Biology, Campbell and Reece, 7th Edition Adapted from chapter reading guides originally created by Lynn Miriello Unit 11: Plants Guided Reading Questions (75 pts total) Chapter 29 Plant
Name: AP Biology Biology, Campbell and Reece, 7th Edition Adapted from chapter reading guides originally created by Lynn Miriello Unit 11: Plants Guided Reading Questions (75 pts total) Chapter 29 Plant
d. Abscisic Acid (ABA) e. Ethylene
 e. Ethylene") AP Bio Plant Unit Review Guide and FRQs Plant Diversity Ch 23 1. List characteristics that distinguish plants from other organisms in other kingdoms. 2. Distinguish between sporophyte or gametophyte, which
AP Bio Plant Unit Review Guide and FRQs Plant Diversity Ch 23 1. List characteristics that distinguish plants from other organisms in other kingdoms. 2. Distinguish between sporophyte or gametophyte, which
Chapter 39. Plant Response. AP Biology
 Chapter 39. Plant Response 1 Plant Reactions Stimuli & a Stationary Life u animals respond to stimuli by changing behavior move toward positive stimuli move away from negative stimuli u plants respond
ORGANISMS RESPOND TO CHANGES IN THEIR INTERNAL AND EXTERNAL ENVIRONMENTS
 MODULE 6 ORGANISMS RESPOND TO CHANGES IN THEIR INTERNAL AND EXTERNAL ENVIRONMENTS BIOLOGY NOTES I have designed and compiled these beautiful notes to provide a detailed but concise summary of this module.
Electromagenetic spectrum
 Light Controls of Plant Development 1 Electromagenetic spectrum 2 Light It is vital for photosynthesis and is also necessary to direct plant growth and development. It acts as a signal to initiate and
Biology 213 Exam 3 Practice Key
 Biology 213 Practice Key 1. (4) Explain the difference between a macronutrient and a micronutrient and cite two examples of each category? Macronutrients are the minerals needed by the plant in greater
plant physiology and energy conversion to plant systems. identify the components and the functions of plant describe the processes of
 Plant Systems-AG1 Essential Questions: 1. How do plant classification, plant anatomy, and plant physiology affect the production and management of plants? 2. What are the necessary steps to Prepare and
Autotrophs/producers- make own energy through
 Name Class EXAM Date Unit 11 Plant Kingdom Characteristics of Plants Multicellular- made of cells Eukaryotes- have & membrane bound organelles Cell - made of Autotrophs/producers- make own energy through
Plant. Responses and Adaptations. Plant Hormones. Plant Hormones. Auxins. Auxins. Hormones tell plants:
 Plant Responses and Adaptations Plant Hormones Hormone - a substance that is produced in 1 part of an organism & affects another part of the same individual (a chemical messenger) Plant hormones are chemical
Actions of auxin. Hormones: communicating with chemicals History: Discovery of a growth substance (hormone- auxin)
") Hormones: communicating with chemicals History- discovery of plant hormone. Auxin Concepts of hormones Auxin levels are regulated by synthesis/degradation, transport, compartmentation, conjugation. Polar
Hormones: communicating with chemicals History- discovery of plant hormone. Auxin Concepts of hormones Auxin levels are regulated by synthesis/degradation, transport, compartmentation, conjugation. Polar
Plant Responses and Adaptations Video
 Plant Responses and Adaptations Video Hormone -a substance that is produced in one part of an organism & affects another part of the same individual Plant hormones are chemical substances Control a plant
Trees are: woody complex, large, long-lived self-feeding shedding generating systems compartmented, self optimizing
 BASIC TREE BIOLOGY Trees are: woody complex, large, long-lived self-feeding shedding generating systems compartmented, self optimizing Roots: absorb water and minerals store energy support and anchor
Bio 100 Guide 27.
 Bio 100 Guide 27 http://www.offthemarkcartoons.com/cartoons/1994-11-09.gif http://www.cneccc.edu.hk/subjects/bio/album/chapter20/images/plant_growth.jpg http://pgjennielove.files.wordpress.com/2008/06/apical_meristem.png
Topic 14. The Root System. II. Anatomy of an Actively Growing Root Tip
 Topic 14. The Root System Introduction. This is the first of two lab topics that focus on the three plant organs (root, stem, leaf). In these labs we want you to recognize how tissues are organized in
Plants. Tissues, Organs, and Systems
 Plants Tissues, Organs, and Systems Meristematic cells Specialized cells that are responsible for producing specialized cells, they produce three types of tissue in the body of a plant. Meristematic Cells
AP Plants II Practice test
 AP Plants II Practice test Multiple Choice Identify the letter of the choice that best completes the statement or answers the question. The figure below shows the results of a study to determine the effect
Plants are sessile. 10d-17/giraffe-grazing.jpg
 Plants are sessile www.mccullagh.org/db9/ 10d-17/giraffe-grazing.jpg Plants have distinct requirements because of their sessile nature Organism-level requirements Must adjust to environment at given location
Leucine-rich repeat receptor-like kinases (LRR-RLKs), HAESA, ERECTA-family
, HAESA, ERECTA-family") Leucine-rich repeat receptor-like kinases (LRR-RLKs), HAESA, ERECTA-family GENES & DEVELOPMENT (2000) 14: 108 117 INTRODUCTION Flower Diagram INTRODUCTION Abscission In plant, the process by which a plant
Leucine-rich repeat receptor-like kinases (LRR-RLKs), HAESA, ERECTA-family GENES & DEVELOPMENT (2000) 14: 108 117 INTRODUCTION Flower Diagram INTRODUCTION Abscission In plant, the process by which a plant
Plant Growth and Development Part I. Levels of Organization
 Plant Growth and Development Part I Levels of Organization Whole Plant Organs Tissues Cells Organelles Macromolecules Levels of Organization Whole Plant Organs Tissues Cells Organelles Macromolecules 1
Ch 25 - Plant Hormones and Plant Growth
 Ch 25 - Plant Hormones and Plant Growth I. Patterns of plant growth A. Plant continue to grow, even in old age. i.e. new leaves, needles, new wood, new cones, new flowers, etc. B. Meristem continues to
Ch Plants.Biology.Landis
 Nom de plume Chapt2 Chapter 22 - Plant Diversity Section 22 1 Introduction to Plants (pages 551 555) This section explains what a plant is and describes what plants need to survive. It also explains how
TREES. Functions, structure, physiology
 TREES Functions, structure, physiology Trees in Agroecosystems - 1 Microclimate effects lower soil temperature alter soil moisture reduce temperature fluctuations Maintain or increase soil fertility biological
The three principal organs of seed plants are roots, stems, and leaves.
 23 1 Specialized Tissues in Plants Seed Plant Structure The three principal organs of seed plants are roots, stems, and leaves. 1 of 34 23 1 Specialized Tissues in Plants Seed Plant Structure Roots: absorb
Plant Growth Regulators(NCERT)
") Plant Growth Regulators(NCERT) Promoters: 1. Auxins: -first isolated from urine, contains Zinc. -Natural: Indole Acetic Acid (IAA) Indole Butyric Acid (IBA) -Synthetic: Naphthalene Acetic Acid (NAA) 2-4
Plant Growth Regulators(NCERT) Promoters: 1. Auxins: -first isolated from urine, contains Zinc. -Natural: Indole Acetic Acid (IAA) Indole Butyric Acid (IBA) -Synthetic: Naphthalene Acetic Acid (NAA) 2-4
The Plant Cell, November. 2017, American Society of Plant Biologists. All rights reserved
 The Genetics of Floral Development Teaching Guide Overview The development of flowers in angiosperm plants provided a critical evolutionary advantage, allowing more options for pollen dispersal and seed
Big Advantage!:Vegetative reproduction is a faster way to reproduce compared to sexual reproduction if the environment is favorable.
 DAY 5 OF CHAPTER 25 NOTES http://www.toto.com/misha/mavica/folliage2.jpg Asexual reproduction in plants is also known as vegetative reproduction. Methods of vegetative reproduction include plant structures
Embryo Development. Embryo Development. Embryo Development. Embryo Development (Cont.) Vegetative Plant Development
 Vegetative Plant Development") Vegetative Plant Development Chapter 37 Embryo Development Begins once the egg cell is fertilized -The growing pollen tube enters angiosperm embryo sac and releases two sperm cells -One sperm fertilizes
Vegetative Plant Development Chapter 37 Embryo Development Begins once the egg cell is fertilized -The growing pollen tube enters angiosperm embryo sac and releases two sperm cells -One sperm fertilizes
black and white in the print edition. [W] The online version of this article contains Web-only data.
![black and white in the print edition. [W] The online version of this article contains Web-only data.](/thumbs/93/111320531.jpg "black and white in the print edition. [W] The online version of this article contains Web-only data.") Physiological Effects of the Synthetic Strigolactone Analog GR24 on Root System Architecture in Arabidopsis: Another Belowground Role for Strigolactones? 1[C][W][OA] Carolien Ruyter-Spira 2, Wouter Kohlen
Physiological Effects of the Synthetic Strigolactone Analog GR24 on Root System Architecture in Arabidopsis: Another Belowground Role for Strigolactones? 1[C][W][OA] Carolien Ruyter-Spira 2, Wouter Kohlen
PLANT HORMONES-Introduction
 PLANT HORMONES-Introduction By convention hormone are said to be a substances whose site of synthesis and site of action are different; the two events are separated by space and time. Hormones are known
STEMS Anytime you use something made of wood, you re using something made from the stem of a plant. Stems are linear structures with attached leaves
 STEMS OUTLINE External Form of a Woody Twig Stem Origin and Development Stem Tissue Patterns Herbaceous Dicotyledonous Stems Woody Dicotyledonous Stems Monocotyledonous Stems Specialized Stems Wood and
Water Potential. The physical property predicting the direction in which water will flow. Pressure
 Transport In Plants Water Potential The physical property predicting the direction in which water will flow Pressure water moves from high water potential to low water potential Water Potential (a) Left
Level 2 Plant Growth and Development Part I Toby Day MSU Extension Horticulture Associate Specialist
 Level 2 Plant Growth and Development Part I Toby Day MSU Extension Horticulture Associate Specialist Pages 24-38 Montana Master Gardener Handbook Plant Growth and Development Whole Plant Organs Tissues
PLANT GROWTH. IB Topic 9.3 & 9.4 Urry text ref: Ch 28 & 31
 PLANT GROWTH IB Topic 9.3 & 9.4 Urry text ref: Ch 28 & 31 INDETERMINATE GROWTH = throughout life meristems like stem cells in humans Shoot tip (shoot apical meristem and young leaves) lateral Axillary
PLANT STRUCTURE AND FUNCTION Read pages Re-read and then complete the questions below.
 PLANT STRUCTURE AND FUNCTION Read pages 600-602. Re-read and then complete the questions below. 1. PLANT TISSUES - plant tissues are made up of 3 basic cell types: Parenchyma, Collenchyma or Sclerenchyma
Levels of Organization
 Plant Growth and Development Part I Levels of Organization Whole Plant Organs Tissues Cells Organelles Macromolecules Levels of Organization Whole Plant Organs Tissues Cells Organelles Macromolecules Plant
LECTURE 4: PHOTOTROPISM
 http://smtom.lecture.ub.ac.id/ Password: https://syukur16tom.wordpress.com/ LECTURE 4: PHOTOTROPISM LECTURE FLOW 1. 2. 3. 4. 5. INTRODUCTION DEFINITION INITIAL STUDY PHOTROPISM MECHANISM PHOTORECEPTORS
Plant Propagation PLS 3221/5222
 Plant Propagation PLS 3221/5222 Dr. Sandra Wilson Dr. Mack Thetford Chapter 2 Introduction to the Biology of Plant Propagation -A review- 1 5. Plant Hormones and Plant development Phytohormones Nt Naturally
Chapter 4. Biology of Flowering Plants. Regulation of Plant Growth by Plant Hormones
 BOT 3015L (Sherdan/Outlaw/Aghoram); Page 1 of 8 Chapter 4 Biology of Flowering Plants Regulation of Plant Growth by Plant Hormones Objectives Plant Growth Regulators. Know the names of the plant growth
Chapter 39 Plant Responses to Internal and External Signals
 Chapter 39 Plant Responses to Internal and External Signals Overview: Stimuli and a Stationary Life Plants, being rooted to the ground, must respond to whatever environmental change comes their way For
What is Growth? Increment in biomass Increase in volume Increase in length or area Cell division, expansion and differentiation. Fig. 35.
 What is Growth? Increment in biomass Increase in volume Increase in length or area Cell division, expansion and differentiation Fig. 35.18 Copyright 2002 Pearson Education, Inc., publishing as Benjamin
Plant Structure. Objectives At the end of this sub section students should be able to:
 Name: 3.2 Organisation and the Vascular Structures 3.2.1 Flowering plant structure and root structure Objectives At the end of this sub section students should be able to: 1. Label a diagram of the external
Forms strands that conduct water, minerals, and organic compounds. Much of the inside of nonwoody parts of plants. Includes roots, stems, and leaves
 Biology II Vascular plants have 3 tissue systems: Dermal Protective outer layer of plant Vascular Forms strands that conduct water, minerals, and organic compounds Ground Much of the inside of nonwoody
What were some challenges that plants had to overcome as they moved to land? Drying out in the sun Conserving water Reproduction without water
 Classification of Plants (Ch. 22) The 3 major characteristics that make an organism a plant are: Multicellular eukaryote Cell walls with cellulose Carry out photosynthesis Plants most likely evolved from:
Primary Plant Body: Embryogenesis and the Seedling
 BIOL 221 Concepts of Botany Primary Plant Body: Embryogenesis and the Seedling (Photo Atlas: Figures 1.29, 9.147, 9.148, 9.149, 9.150, 9.1, 9.2) A. Introduction Plants are composed of fewer cell types,
Unit 8: ECE/AP Biology Plants 9 Class Meeting. Essential Questions. Enduring Understanding with Unit Goal
 Essential Questions How are plants unique in their growth, organs, tissues and cells? How to plants acquire nutrients from the environment? How do different plants conduct photosynthesis? Enduring Understanding
Unit 5: Plant Science. Mr. Nagel Meade High School
 Unit 5: Plant Science Mr. Nagel Meade High School Warm Up What significant roles do plants perform on Earth? How do you know? Name two modern issues that could be interrelated with plants. IB Syllabus
Chapter 18 Lecture. Concepts of Genetics. Tenth Edition. Developmental Genetics
 Chapter 18 Lecture Concepts of Genetics Tenth Edition Developmental Genetics Chapter Contents 18.1 Differentiated States Develop from Coordinated Programs of Gene Expression 18.2 Evolutionary Conservation
NOTES: CH 35 - Plant Structure & Growth
 NOTES: CH 35 - Plant Structure & Growth In their evolutionary journey, plants adapted to the problems of a terrestrial existence as they moved from water to land ANGIOSPERMS (flowering plants) -most diverse
Arabidopsis thaliana. A Thesis NAN-YEN CHOU
 REGULATION OF BRANCHING BY PHYTOCHROME B AND PPFD IN Arabidopsis thaliana A Thesis by NAN-YEN CHOU Submitted to the Office of Graduate Studies of Texas A&M University in partial fulfillment of the requirements
Plant Molecular and Cellular Biology Lecture 10: Plant Cell Cycle Gary Peter
 Plant Molecular and Cellular Biology Lecture 10: Plant Cell Cycle Gary Peter 9/10/2008 1 Learning Objectives Explain similarities and differences between fungal, mammalian and plant cell cycles Explain
The Science of Plants in Agriculture Pl.Sci 102. Getting to Know Plants
 The Science of Plants in Agriculture Pl.Sci 102 Getting to Know Plants Growth and Development of Plants Growth and Development of Plants Why it s important to have knowledge about plant development. What
Selective Mimics of Strigolactone Actions and Their Potential Use for Controlling Damage Caused by Root Parasitic Weeds
 Molecular Plant Volume 6 Number 1 Pages 88 99 January 2013 RESEARCH ARTICLE Selective Mimics of Strigolactone Actions and Their Potential Use for Controlling Damage Caused by Root Parasitic Weeds Kosuke
Plant Growth and Development
 1. Define plasticity. Give an example? A: Plant Growth and Development The ability of the plants to follow different pathways in response to the environment or phases of life to form different kinds of
C MPETENC EN I C ES LECT EC UR U E R
 LECTURE 7: SUGAR TRANSPORT COMPETENCIES Students, after mastering the materials of Plant Physiology course, should be able to: 1. To explain the pathway of sugar transport in plants 2. To explain the mechanism
Questions for Biology IIB (SS 2006) Wilhelm Gruissem
 Wilhelm Gruissem") Questions for Biology IIB (SS 2006) Plant biology Wilhelm Gruissem The questions for my part of Biology IIB, Plant Biology, are provided for self-study and as material for the exam. Please note that the
Questions for Biology IIB (SS 2006) Plant biology Wilhelm Gruissem The questions for my part of Biology IIB, Plant Biology, are provided for self-study and as material for the exam. Please note that the
Unit Two: Chemical Control
 Unit Two: Chemical Control 3.1 Plant growth and development are regulated by hormones Tropism is a biological phenomenon in which plants grow toward or away from an environmental stimulus, such as light,
Part III. Characterization and mapping of a new locus involved in the regulation of branching in Arabidopsis
 Part III Characterization and mapping of a new locus involved in the regulation of branching in Arabidopsis 73 Abstract The final plant architecture depends on the number and the position of lateral inflorescences,
Mutation of the cytosolic ribosomal protein-encoding RPS10B gene affects shoot meristematic function in Arabidopsis
 Stirnberg et al. BMC Plant Biology 2012, 12:160 RESEARCH ARTICLE Mutation of the cytosolic ribosomal protein-encoding RPS10B gene affects shoot meristematic function in Arabidopsis Petra Stirnberg 1, Jin-Ping
Simon Scofield, Walter Dewitte, and James AH Murray* School of Biosciences; Cardiff University; Cardiff, UK
 Short Communication Plant Signaling & Behavior 9, e28934; April; 2014 Landes Bioscience Short Communication STM sustains stem cell function in the Arabidopsis shoot apical meristem and controls KNOX gene
Ch Plant Hormones
 Ch. 39 Plant Hormones I. Plant Hormones Chemical signals that coordinate the parts of an organism. Only minute amounts are needed to get the desired response. Control plant growth and development by affecting
By Jonathan I. Watkinson. Virginia Polytechnic Institute and State University. Doctor of Philosophy Horticulture
 Characterization of two genes, trehalose-6-phosphate synthase/phosphatase and nucleotide binding protein, shown to be differentially regulated in roots of Cypripedium parviflorum var. pubescens grown with
Is that artificial turf or real grass? Its thicker than Bermuda!
 Is that artificial turf or real grass? Its thicker than Bermuda! 1 Using Plant Growth Regulators Growth regulators DO NOT interfere with plant respiration, photosynthesis, or other internal plant functions
Plant hormones. Characteristics
 Plant hormones Plant hormones (also known as phytohormones) are chemicals that regulate plant growth, which, in the UK, are termed 'plant growth substances'. Plant hormones are signal molecules produced
Anatomy of Plants Student Notes
 Directions: Fill in the blanks. Anatomy of Plants Student Notes Plant Cell Biology Segment 1. Plants Plants are organisms are incapable of movement produce food through 2. Animals Animals are multicellular
Plant Growth and Development
 Plant Growth and Development Growth : An irreversible permanent increase in size of an organ or its parts or even of an individual cell. Growth is accompanied by metabolic process that occurs at the expense
Plants Notes. Plant Behavior Phototropism - growing towards light
 Plants Notes Plant Behavior Phototropism - growing towards light Geotropism - roots knowing which direction is down Thigmotropism - a plant's response to touch Ex. a vine wrapping around and climbing a
Biological Roles of Cytokinins
 Direct Control of Shoot Meristem Activity by a Cytokinin-Activating Enzyme By Kurakawa et. Al. Published in Nature Presented by Boyana Grigorova Biological Roles of Cytokinins Cytokinins are positive regulators
Essential idea: Plants adapt their growth to environmental conditions.
 9.3 Growth in plants AHL https://c1.staticflickr.com/3/2347/2573372542_a959ecfd4f_b.jpg Essential idea: Plants adapt their growth to environmental conditions. Boxwood, Pivet and Yew are plants commonly
Types of Plants. Unit 6 Review 5/2/2011. Plants. A. pine B. moss C. corn plant D. bean plant E. liverwort
 Unit 6 Review Plants Initial questions are worth 1 point each. Each question will be followed by an explanation All questions will be asked a second time at the very end, each of those questions will be
Plant Responses to Internal and External Signals
 LECTURE PRESENTATIONS For CAMPBELL BIOLOGY, NINTH EDITION Jane B. Reece, Lisa A. Urry, Michael L. Cain, Steven A. Wasserman, Peter V. Minorsky, Robert B. Jackson Chapter 39 Plant Responses to Internal