저작권법에따른이용자의권리는위의내용에의하여영향을받지않습니다.
|
|
|
- Oswin Foster
- 5 years ago
- Views:
Transcription


1 저작자표시 - 비영리 - 변경금지 2.0 대한민국 이용자는아래의조건을따르는경우에한하여자유롭게 이저작물을복제, 배포, 전송, 전시, 공연및방송할수있습니다. 다음과같은조건을따라야합니다 : 저작자표시. 귀하는원저작자를표시하여야합니다. 비영리. 귀하는이저작물을영리목적으로이용할수없습니다. 변경금지. 귀하는이저작물을개작, 변형또는가공할수없습니다. 귀하는, 이저작물의재이용이나배포의경우, 이저작물에적용된이용허락조건을명확하게나타내어야합니다. 저작권자로부터별도의허가를받으면이러한조건들은적용되지않습니다. 저작권법에따른이용자의권리는위의내용에의하여영향을받지않습니다. 이것은이용허락규약 (Legal Code) 을이해하기쉽게요약한것입니다. Disclaimer
2 이학박사학위논문 Ecology of the azaspiracid producer dinoflagellate Azadinium poporum from Shiwha bay, Korea: - taxonomy, population dynamics, azaspiracid content, predation, and growth 한국시화호해역의 azaspiracid 생산자인 Azadinium poporum 의생태연구 : 분류, 개체군동태, azaspiracid, 포식및성장 2014 년 8 월 서울대학교대학원 지구환경과학부해양학전공 Éric Potvin
3 Ecology of the azaspiracid producer dinoflagellate Azadinium poporum from Shiwha bay, Korea: - taxonomy, population dynamics, azaspiracid content, predation, and growth - 지도교수정해진이논문을이학박사학위논문으로제출함 2014 년 08 월 서울대학교대학원지구환경과학부해양학전공 Éric Potvin Éric Potvin의박사학위논문을인준함 2014 년 08 월 위원장 ( 인 ) 부위원장 ( 인 ) 위원 ( 인 ) 위원 ( 인 ) 위원 ( 인 )
4 To my family and friends who were far away, To those who are gone, To the one who came before, To those of the future
5 List of abbreviations Abbreviation ASP AT ATP AZA AZP BTX CAD CE Chl-a CID COI CT CTX DA DNA dntp DO DSP DTX EPI ESD FE-SEM FISH FTICR-MS GGE GYM HPLC Definition Amnesic shellfish poisoning Annealing temperature Adenosine triphosphate Azaspiracid Azaspiracid poisoning Brevetoxin-b Collisionally activated dissociation Collision energy Chlorophyll a Collision-induced dissociation Mitochondrial cytochrome oxidase I Cycle threshold Ciguatoxin-P Domoic acid Deoxyribonucleic acid Deoxyribonucleotide triphosphate Dissolved oxygen Diarrhetic shellfish poisoning Dinophysistoxin Enhanced product ion Equivalent spherical diameter Field emission-scanning electron microscopy Fluorescence in situ hybridization Fourier transform ion cyclotron resonance-mass spectrometry Gross growth efficiency Gymnodimine High performance liquid chromatography
6 HTD ITS rdna LC LCMS LSU rdna ML MP MRM MS MS/MS m/z NH 4 + NJ NMR - NO 2 - NO 3 NSP OA PC PCL PCR PLTX PnTX PO 4 3- PSP PTX qpcr RDA rdna RMGI RNA Heterotrophic dinoflagellate Internal transcribed spacer ribosomal DNA Liquid chromatography Liquid chromatography mass spectrometry Large subunit ribosomal RNA gene Maximum likelihood Maximum parsimony Multiple reaction monitoring Mass spectrometry Tandem mass spectrometry Mass to charge ratio Ammonium Neighbor joining Nuclear magnetic resonance Nitrite Nitrate Neurotoxic shellfish poisoning Okadaic acid Polycarbonate Prorocentrolide Polymerase chain reaction Palytoxin Pinnatoxin Phosphate Paralytic shellfish poisoning Pectenotoxin-2 Quantitative polymerase chain reaction Retro-Diels-Alder reaction Ribosomal DNA µ m to I max ratio Ribonucleic acid
7 SD SEM SiO 3 2- SPX SRC SSU rdna STX Taq TMSDM UV v/v w/v YTX Secchi depth Scanning electron microscopy Silicate Spirolide Sedgwick-Rafter chamber Small subunit ribosomal RNA gene Saxitoxin Thermus aquaticus Trimethylsilyl diazomethane Ultraviolet Volume to volume ratio Weight to volume ratio Yessotoxin
8 Abstract Ecology of the azaspiracid producer dinoflagellate Azadinium poporum from Shiwha bay, Korea: - taxonomy, population dynamics, azaspiracid content, predation, and growth - Éric Potvin Oceanography School of Earth and Environmental Sciences College of Natural Sciences Seoul National University The azaspiracids (AZAs) are the most recently discovered group of lipophilic marine biotoxins of microalgal origin associated with cases of shellfish poisoning in humans. Since the discovery of Azadinium spinosum as a primary producer of AZA, there has been an urgent need to know more about closely related species and their distribution, the variety of AZA analogues they are producing, their population dynamics in the field, their ecophysiology, and their ecological niche within the planktonic food web. At the initiation of that work, species of the genus Azadinium were only i
9 known from northern European waters. Following the isolation of another strain of the genus Azadinium in 2010 from Shiwha bay, a highly eutrophic area from Korea, works were undertaken in order to explore the taxonomic identity, content of AZA, population dynamics in the field, variety of grazers, and physiology of the new isolate. The morphology based on optical and scanning electron microscopy as well as the ITS rdna region and LSU rrna gene phylogenies demonstrated that the strain was closely related to Azadinium poporum, but minor morphological dissimilarities and an instable phylogenetic position led us to designate it as Azadinium cf. poporum at the time. Later work revealed that the strain was conspecific with Azadinium poporum. This work extended the known distribution of the genus Azadinium further south. The strain isolated from Shiwha bay preliminarily showed not to contain any known AZA. However, further analyses of the Korean strain by triple quadrupole mass spectrometry on the precursor and product ion mode revealed a new compound, or analogue, with high similarity to AZAs. The structure of the new compound was proposed by interpretation of fragmentation patterns and high resolution mass measurements using Fourier transform ion cyclotron resonancemass spectrometry. This work increased the known molecular diversity of AZA produced by species in the genus Azadinium. The long term temporal dynamics of species of the genus Azadinium in the field was completely unknown. Therefore, the population dynamics of A. poporum from Shiwha bay was investigated by qpcr (quantitative polymerase chain ii
10 reaction). A. poporum revealed to occur always in relatively low concentration from 2009 to 2011 in comparison to common species found in Shiwha bay. The reduced knowledge on interactions implicating Azadinium within the planktonic food web, the relevance of the Korean isolate of A. poporum as an AZA producer, and the possible role of predation in its field dynamics led us to determine its protistan and metazoan grazers. Furthermore, grazing and growth rates as well as gross growth efficiencies were established for some grazers. Many protistan grazers and copepods were able to feed on A. poporum. However, only two species, the heterotrophic dinoflagellate Oxyrrhis marina and the ciliate Strobilidium sp., were able to achieve sustained growth on A. poporum as the sole prey. Furthermore, for these predators, the maximum ingestion rates and maximum growth rates were the highest and lowest when compared with other prey species, respectively. This suggests that A. poporum was a low quality prey. In addition, the field concentrations of A. poporum assessed by qpcr were generally too low to affect the dynamics of the predators found in this study. Therefore, predation reveals unlikely to be a driving force in the dynamics of A. poporum in the field. In order to further determine the causes explaining the dynamics of A. poporum in Shiwha bay, we assessed the tendency and seasonality of some environmental parameters through time such as the temperature, the salinity, the ph, the dissolved oxygen, the Secchi depth, the concentration of nutrients, and the concentration of chlorophyll a. We also determined if the previous parameters had an effect on A. poporum in the field as well as the effects of temperature, salinity, and light on the growth of A. poporum in laboratory. The species revealed to grow on a wide range of temperature and salinity and was therefore generally well adapted to the highly variable field conditions observed in Shiwha iii
11 bay. Furthermore, the species revealed to be well adapted to low irradiance. The growth rates of A. poporum estimated in laboratory were also relatively high compared with other photosynthetic and mixotrophic dinoflagellates under photosynthetic growth. Such features do not explain the low abundances obtained from the field samples. However, A. poporum revealed to be more represented in the field when the concentrations of nitrite and nitrate, silicate, as well as chlorophyll a were lower and the transparency was higher. This suggests that A. poporum use reduced trophic state as windows of opportunity. Considering the low concentrations of A. poporum obtained from field samples during the survey of three years, these opportunities might represent a survival strategy in eutrophic environment. The multifaceted studies cumulated in this thesis strengthen previous area of research related to the genus Azadinium and established new foundations in unexplored areas from which further studies can rise. Keywords: morphology, rdna, distribution, toxin, grazing, tolerance, salinity, temperature, light, ph, dissolved oxygen, transparency, nutrients, chlorophyll a Student Number: iv
12 Contents Chapter 1 Introduction Generalities Dinoflagellates Ecology of toxic dinoflagellate Biotic factors Toxic potency Predation Mixotrophy Allelopathy and cell contact Abiotic factors Temperature Salinity Light intensity Turbulence ph Nutritional factors Macronutrients Micronutrients Study area Context of the study Chapter 2 Taxonomy Abstract Keywords v
13 2.3 Introduction Materials and methods Collection and culturing of Azadinium cf. poporum Morphology of Azadinium cf. poporum DNA extraction, PCR amplification, and sequencing Sequence availability and phylogenetic analysis Chemical analysis of azaspiracids Results Morphology of Azadinium cf. poporum Molecular characterization of Azadinium cf. poporum Azaspiracids Discussion Distribution Morphology Molecular characterization Azaspiracids Chapter 3 Azaspiracid Abstract Keywords Introduction Materials and methods Algal culture Toxin extraction and preparation Multiple reaction monitoring (MRM) measurements Precursor ion experiments Product ion spectra vi
14 3.4.6 FTICR-MS measurements Methylation of AZAs Results and discussion Chapter 4 Predation Abstract Keywords Introduction Materials and methods Preparation of experimental organisms Feeding Growth, ingestion, and gross growth efficiency Field data Grazing impact Swimming speed Results Growth rate Ingestion rate Gross growth efficiency Dynamics of Azadinium cf. poporum Grazing impact Swimming speed Discussion Feeding Growth and ingestion rates Dynamics of Azadinium cf. poporum Grazing impact vii
15 4.6.5 Ecological implications Chapter 5 Physiology Abstract Keywords Introduction Materials and methods Study area Field data Maintenance of the experimental organism Effect of temperature, salinity, and light on growth Occurrence Results Field Effect of temperature, salinity, and light on growth Occurrence Discussion Conclusion Bibliography Acknowledgments viii
16 List of Tables Table 1.1 The principal marine phycotoxins, their source, their affinity, their chemical formula, and the type of poisoning caused... 3 Table 1.2 Food poisoning caused by azaspiracids and reported between 1995 and Table 1.3 Morphological features for species of the genus Azadinium Table 2.1 Taxa used to establish the phylogenies based on SSU rdna, ITS rdna, and LSU rdna Table 2.2 Dissimilarity matrix comparing Azadinium cf. poporum from Korea to other species in the genus Azadinium Table 2.3 Comparison of distinctive morphological and toxigenic features of species in the genus Azadinium Table 3.1 Exact masses of [M+H] + ions and characteristic group fragments of AZA-1 and the compound Table 4.1 Isolation and maintenance conditions of the experimental organisms Table 4.2 Experimental design to assess predation by various planktonic predator species on the prey species Azadinium cf. poporum Table 4.3 Isolation conditions of the dinoflagellates used in the qpcr specificity test Table 5.1 Pearson correlation coefficient matrix (absolute value) between physical and chemical properties of Shiwha bay, Korea, from January 2009 to December Table 5.2 Pearson correlation coefficients (absolute value) between Azadinium poporum (concentration and representation) and physical/chemical ix
17 properties of Shiwha bay, Korea, from January 2009 to December Table 5.3 Compensation irradiance (I 0, µe m -2 s -1 ), half-saturation light intensity (K s, µe m -2 s -1 ) and competition coefficient (α) reported for phytoplankton x
18 List of Figures Figure 1.1 Worldwide detection of azaspiracids Figure 1.2 Worldwide distribution of Azadinium spp. and Amphidoma languida Figure 2.1 Micrographs of cells of Azadinium cf. poporum taken using an inverted microscope Figure 2.2 Micrographs of cells of Azadinium cf. poporum taken using a scanning electron microscope Figure 2.3 Micrographs of cells of Azadinium cf. poporum taken using a scanning electron microscope Figure 2.4 Micrographs of cells of Azadinium cf. poporum taken using a scanning electron microscope showing the apical pore complex and other related features Figure 2.5 Micrographs of cells of Azadinium cf. poporum taken using a scanning electron microscope showing the sulcal area Figure 2.6 Micrographs of cells of Azadinium cf. poporum taken using a scanning electron microscope showing plate modifications Figure 2.7 Maximum likelihood phylogenetic trees based on SSU rdna, ITS rdna, and LSU rdna Figure 2.8 Comparison between the shape of the third apical plate of Azadinium cf. poporum from Korea (top) and Azadinium poporum from North Sea (bottom) Figure 3.1 Structures of the fully structurally characterized azaspiracids AZA-1 to AZA Figure 3.2 Product ion scan of AZA-1 (m/z 842) (top) and the compound xi
19 (m/z 858) (bottom) Figure 3.3 Structure of AZA-1 and CID cleavage sites Figure 3.4 Ion traces of the [M+H] + ion masses of the compound and the corresponding methylated compound Figure 3.5 Enlargements of the [M+H] + ion clusters of the product ion spectrum of the compound Figure 3.6 Proposed fragmentation scheme for the elimination of C 2 H 6 O 3 from the compound Figure 3.7 Structure of AZA-1 (left) and proposed structure for the compound (right) Figure 4.1 Shiwha bay, Korea, and fixed stations where water samples were collected Figure 4.2 Feeding by (A E) heterotrophic dinoflagellates and (F) a ciliate on Azadinium cf. poporum Figure 4.3 Oxyrrhis marina and Strobilidium sp. Specific growth rate (μ, d 1 ) of (A) the heterotrophic dinoflagellate and (B) a ciliate feeding on the dinoflagellate Azadinium cf. poporum as a function of mean prey concentration (X) Figure 4.4 Oxyrrhis marina, Strobilidium sp., and Acartia spp. Ingestion rate (IR) of (A) the heterotrophic dinoflagellate, (B) a ciliate, and (C) copepods feeding on the dinoflagellate Azadinium cf. poporum as a function of mean prey concentration (X) Figure 4.5 Oxyrrhis marina and Strobilidium sp. Mean gross growth efficiencies (GGEs) of (A) the heterotrophic dinoflagellate and (B) a ciliate on Azadinium cf. poporum as a function of mean prey concentration Figure 4.6 Azadinium cf. poporum. Dynamics of abundances quantified by qpcr in Shiwha bay, Korea, from 2009 to xii
20 Figure 4.7 Strobilidium sp.-sized naked ciliates (25 to 60 μm in length). Calculated grazing coefficients of the ciliates (n = 7) in relation to the concentration of co-occurring Azadinium cf. poporum Figure 4.8 Oxyrrhis marina. (A) Maximum growth (μ max, d 1 ) and (B) ingestion rates (I max, ng C predator 1 d 1 ) of the heterotrophic dinoflagellate feeding on photosynthetic or mixotrophic algal prey as a function of prey size (equivalent spherical diameter, ESD, μm), and (C) μ max as a function of I max Figure 4.9 Strobilidium spp. (A) Maximum growth (μ max, d 1 ) and (B) ingestion rates (I max, ng C predator 1 d 1 ) of the ciliates feeding on photosynthetic or mixotrophic algal prey as a function of prey size (equivalent spherical diameter, ESD, μm) and (C) μ max as a function of I max Figure 4.10 Acartia spp. Maximum ingestion rate (I max, μg C predator 1 d 1 ) of the copepods on photosynthetic or mixotrophic algal prey as a function of prey size (equivalent spherical diameter, ESD, μm) Figure 5.1 Variation of physical and chemical parameters in Shiwha bay, Korea, from 2009 to 2011 (left) and integrated values through the year (right) Figure 5.2 Azadinium cf. poporum. Specific growth rates (d -1 ) obtained when the species was adapted to various temperatures and salinities Figure 5.3 Specific growth rates (GR) of Azadinium poporum at 8 different light intensities Figure 5.4 Physical and chemical parameters in relation with the abundance of Azadinium poporum based on qpcr and the ratio of biomass of A. poporum to Chl-a Figure 5.5 Maximum growth rate of photosynthetic or mixotrophic dinoflagellate species when growing photosynthetically xiii
21 Chapter 1: Introduction 1.1 Generalities The marine ecosystem food web relied on unicellular photosynthetic microscopic organisms. They can occupy the pelagic environment or be more closely related to the benthic zone. The different species co-exist to produce natural assemblages. Abiotic factors such as the temperature, the salinity, the light, and the nutrients, as well as biotic factors as grazing, cell contact, allelopathy, viruses, and parasites might affect the abundance of photosynthetic organisms. The hydrodynamics might also affect the distribution of a species and therefore its field dynamics. Occasionally, one or multiple species can dominate blooms that can last for weeks (Granéli & Turner 2006). These blooms can be harmful. They can degrade the quality of the water, lower the concentration of oxygen, and/or obstruct fish gills. Some blooms are constituted of toxic microalgae. When the predator at the end of the food web is the human being, these blooms generate indirectly food poisoning of various types. Of the approximately species of known phytoplankton (Falkowski et al. 2004), only about 300 species are harmful for marine organisms and about 80 of these species are known to produce phycotoxins (Granéli & Turner 2006). The marine phycotoxins are secondary metabolites produced by some prokaryotic or eukaryotic microalgae species. These metabolites are generally nonharmful for the producer organism and concentrate through the food web in 1
22 consumers. They move up the food web until they intoxicate the superior mammals. Among the consumers, protistan predators, zooplanktons, bivalve filter molluscs, gastropods, or herbivory fish will contaminate their predators. In marine environment, the phycotoxins are mainly produced by the Dinophyceae (the dinoflagellates) and the Bacillariophyceae (the diatoms), but also the Prymnesiophyceae, the Raphidophyceae, and the Cyanophyceae (the cyanobacteria). These toxins are classified based on their affinity, chemical structure, and the symptoms that they produced on human when seafood is consumed (Table 1.1). Based on their affinity, these toxins can be hydrophilic, lipophilic, or amphiphilic. The classification based on symptoms includes the paralytic shellfish poisoning (PSP), the diarrhetic shellfish poisoning (DSP), the amnesic shellfish poisoning (ASP), and the neurotoxic shellfish poisoning (NSP). Microalgae can produce toxins with different structures by slight variation of the main structure. Therefore, most of the groups of marine toxins also have numerous analogues. Phytoplankton toxins can accumulate in shellfish and subsequently poison humans (Shumway 1990). The organisms at their origin can form blooms which have sometimes caused large-scale mortalities of finfish and shellfish and thus great losses to the aquaculture and tourist industries of many countries (Steidinger 1983, ECOHAB 1995, Burkholder et al. 1995). Phycotoxins can also affect higher trophic level through the food web as indicated by mortality of whales, dolphins, and seabirds (Geraci et al. 1989, Anderson & White 1992, Work et al. 1993). The distribution and dynamics of such species is of particular interest in order to have a 2
23 Table 1.1 The principal marine phycotoxins, their source, their affinity, their chemical formula, and the type of poisoning caused Toxins Abbreviation Producers Affinity Formula Poisoning Domoic acid DA Pseudo-nitzchia spp. 1, 2, 3, 4 Hydrophilic C 15 H 21 N O6 ASP Okadaic acid OA Dinophysis spp. 5 Lipophilic C 44 H 68 O 13 DSP Prorocentrum spp. 6,7,8 9, 10 Azaspiracid AZA Azadinium spp. Lipophilic C 47 H 71 NO 12 DSP Amphidoma languida , 12, 13, 14 Brevetoxin-b BTX Karenia brevis Chattonella spp. 15,16,17 Lipophilic C 50 H 70 O 14 NSP Ciguatoxin-P CTX Gambierdiscus toxicus 18,19,20 Lipophilic C 60 H 85 O 16 NSP Gymnodimine GYM Karenia selliformis 21,22 Lipophilic C 32 H 45 NO 4 NSP Palytoxin PLTX Ostreopsis spp. 23 Amphiphilic C 129 H 223 N 3 O 54 NSP Pectenotoxin-2 PTX Dinophysis spp. 24 Lipophilic C 47 H 70 O 14 DSP Pinnatoxin PnTX Vulcanodinium rugosum 25 Lipophilic C 41 H 61 NO 9 NSP Prorocentrolide PCL Prorocentrum spp. 26 Lipophilic C 56 H 85 NO 13 NSP
24 Table 1.1 (continued) Toxins Abbreviation Producers Affinity Formula Poisoning 27, 28 Saxitoxin STX Alexandrium spp. Hydrophilic C 10 H 17 N 7 O 4 PSP Gymnodinium catenatum 29 Pyrodinium bahamense 29 Spirolide SPX Alexandrium ostenfeldii 30 Lipophilic C 41 H 61 NO 7 NSP Yessotoxin YTX Protoceratium reticulatum 31 Amphiphilic C 55 H 82 O 21 S 2 DSP 4 Lingulodinium polyedrum 32 Gonyaulax spinifera 33 Abbreviations used: paralytic shellfish poisoning (PSP), diarrhetic shellfish poisoning (DSP), amnesic shellfish poisoning (ASP), neurotoxic shellfish poisoning (NSP) References. 1 Garrison et al. 1992, 2 Laycock et al. 1989, 3 Maranda et al. 1989, 4 Shimizu et al. 1989, 5 Yasumoto et al. 1980, 6 Dickey et al. 1990, 7 Hu et al. 1995, 8 Murakami et al. 1982, 9 Tillmann et al. 2009, 10 Krock et al. 2012, 11 Baden 1983, 12 Lin et al. 1981, 13 Prasad & Shimizu 1989, 14 Shimizu 1982, 15 Bourdelais et al. 2002, 16 Khan et al. 1995a, 17 Khan et al. 1995b, 18 Legrand et al. 1990, 19 Murata et al. 1990, 20 Yasumoto et al. 1977, 21 Seki et al. 1995, 22 Miles et al. 2000, 23 Usami et al. 1995, 24 Kamiyama et al. 2010, 25 Rhodes et al. 2011, 26 Torigoe et al. 1988, 27 Schantz et al. 1966, 28 Sommer & Meyer 1937, 29 FAO 2004, 30 Cembella et al. 2000, 31 Satake et al. 1997, 32 Tubaro et al. 1998, 33 Rhodes et al. 2006
25 better understanding of the factors implicated in their increase and decrease. Such knowledge will help to better predict the insurgence of blooms as well as to develop methods to prevent or decrease the effect of these blooms. The use of FISH (fluorescence in situ hybridization) and qpcr (quantitative polymerase chain reaction) as species-specific detection methods as well as the next generation high throughput sequencing is expected to increase our knowledge on these species. 1.2 Dinoflagellates The number of living dinoflagellates is usually estimated to be approximately 2000, with 2500 named fossil species. In a recent revision Gómez (2005) recognized 1555 free-living marine species. Approximately 160 marine species are benthic (Taylor et al. 2008). Dinoflagellates are a highly diverse group of flagellates, consisting of both photosynthetic and non-photosynthetic taxa in equal proportions (Taylor 1987). Many of the photosynthetic members are mixotrophic, and the heterotrophs feed by a wide variety of mechanisms (Gaines & Elbrächter 1987, Schnepf & Elbrächter 1992). The phycotoxins are produced in most part by dinoflagellates (Table 1.1). 1.3 Ecology of toxic dinoflagellate Biotic factors As toxic dinoflagellates have potential impact on consumers, grazing on toxic dinoflagellate can have potential impact on preventing or terminating blooms. Toxic dinoflagellates can also graze on preys and thereafter maintain or increase 5
26 their abundance. Furthermore, allelopathy and cell contact are factors that can affect both toxic dinoflagellates and co-occurring species Toxic potency Toxic dinoflagellates might contain mechanisms that able them to be recognized by predators and induced behavioral change. A toxic strain of Alexandrium tamarense inhibited feeding by Favella spp. (Hansen 1989). Some copepods are known to reject some toxic dinoflagellates (Huntley et al. 1983, 1986, Turner & Anderson 1983, Uye & Takamatsu 1990). Toxic dinoflagellates might also have mechanisms to reduce the growth or kill some predators after ingestion. Strombidinopsis sp. and Tiarina fusus did not grow on the toxic dinoflagellate Amphidinium carterae (Jeong et al. 1999, 2002). The toxic naked dinoflagellate Gymnodinium aureolum suppressed the growth of F. ehrenbergii (Hansen 1995). Some toxic dinoflagellate species that produce a paralytic shellfish poisoning toxin are harmful to Oxyrrhis marina and Polykrikos kofoidii (Matsuoka et al. 2000). Furthermore, some Alexandrium strains caused loss of motility and cell lysis of the heterotrophic dinoflagellates Oblea rotunda and O. marina by secretion of extracellular substances (Tillmann & John 2002). Therefore, the toxic potency of toxic dinoflagellates can act in various ways on predators Predation Heterotrophic protists such as dinoflagellates and ciliates are known to feed on toxic dinoflagellates (Hansen 1989, Maneiro et al. 2000, Jeong et al. 2001, 2003a, Kamiyama & Arima 2001, Kamiyama et al. 2005, Adolf et al. 2007, Yoo et al. 2013). The heterotrophic dinoflagellate Polykrikos kofoidii grew well while 6
27 feeding on the toxic dinoflagellate Gymnodinium catenatum. Another heterotrophic dinoflagellate, Oxyrrhis marina, also grew well while feeding on the toxic dinoflagellates Amphidinium carterae and Karlodinium veneficum. Recently, Gyrodinium moestrupii was shown to feed and grow on toxic strains of Alexandrium minutum, A. tamarense, and Karenia brevis. Furthermore, the large tintinnid ciliates Favella spp. can feed well on Alexandrium tamarense, A. catenella, and Dinophysis acuminate. Several metazooplankters can also ingest toxic dinoflagellates without apparent harm (Calbet et al. 2003, Turner & Borkman 2005). This suggests that heterotrophic protists and metazoans can affect the dynamics of toxic dinoflagellates in the field Mixotrophy Toxic dinoflagellates are known to be, in most cases, primarily photosynthetic. Many dinoflagellate species associated with toxin production were previously thought to be photosynthetic, but revealed to be mixotrophic (Jeong et al. 2005a b, Glibert et al. 2009, Blossom et al. 2012). Mixotrophy can enhance the growth of toxic dinoflagellates and therefore play a role in their dynamics Allelopathy and cell contact Allelopathy or cell contact have been discussed as phenomena affecting phytoplankton bloom formation and are potential factors that can enhance or reduce the dynamics of toxic dinoflagellates. Legrand et al. (2003) and Granéli & Hansen (2006) reviewed allelopathy in phytoplankton. Allelochemicals are generally characterized as specific metabolites 7
28 that stimulate or suppress growth of other organisms, or elicit other physiological responses in target cells. In marine environments, allelochemicals may function as chemical defence by deterring, incapacitating, and/or killing competitors or grazers (McClintock & Baker 2001, Cembella 2003, Legrand et al. 2003, Granéli & Hansen 2006). Uchida (2001) reported the role of cell contact in some dinoflagellate species. Studies have previously reported the importance of cell contact in interactions involving dinoflagellates (Yamasaki et al. 2011, Qiu et al. 2012). However, while knowledge on allelopathy is increasing, further investigations on the role of cell contact are required in order to appreciate its relevance in the dynamics of dinoflagellates Abiotic factors In marine environment, the temperature, the salinity, the light intensity, the turbulence, the ph, and the nutritional factors are important physicochemical factors for the regulation of growth and metabolism (enzymatic activity and secondary metabolite production) Temperature The temperature will influence the enzymatic activity of microalgae. The enzymes have an optimal temperature of operation under which the reaction speeds are slower and over which the enzymes degrade more quickly (Grzebyk & Séchet 2003). The temperature is then a parameter with an important effect on growth (Nielsen 1996, Matsubara et al. 2007, Xu et al. 2010). 8
29 Salinity Unfavorable salinities to microalgae will act on enzymatic activity and on the consumption of energy allocated to the osmotic regulation (Grzebyk & Séchet, 2003). Salinity will therefore act on the cellular metabolism and on growth. The freshwater species will have a weak tolerance to variation of salinities, while estuarine species are euryhaline and the coastal and marine species have a wider tolerance to salinity variations in culture (Taylor & Pollingher 1987, Grzebyk et al. 2003, Nagasoe et al. 2006, Matsubara et al. 2007). However, some species are stenohaline and can be sensible to salinity variations (Kim et al. 2004a) Light intensity Photosynthetic dinoflagellates can adapt quickly to variations of light intensity. At weak light intensities, for example, dinoflagellates can increase the size and/or the number of photosynthetic units (Smayda 1997). This factor is the one affecting the most the nutrition of microalgae through the photosynthesis. An insufficient light can reduce or stop the growth (Grzebyk & Séchet 2003, Paz et al. 2006) Turbulence For multiple dinoflagellate species, the turbulence generated experimentally caused deleterious effects, notably a diminution of the cell division (Pollingher & Zemel 1981, Berdalet 1992, Sullivan et al. 2003), morphological changes (Zirbel et al. 2000), a modification of the swimming behavior (Karp-Boss et al. 2000, 9
30 Berdalet et al. 2007), or breaks of the cellular membrane (White 1976). Therefore, turbulence in the field might affect the dynamics and abundances of species ph Knowledge on the effect of ph on dinoflagellates is limited and needs to be further assessed. The effect of ph on growth appears to be species specific. Furthermore, the ph might be implicated in species succession (Hansen 2002). Therefore, the effect of ph should be determined in order to have a better idea of species dynamics in the field Nutritional factors Macronutrients The macronutrients that are the most important to dinoflagellate growth are nitrogen and phosphorus. They affect the development of algal blooms (Paerl 1998, Sakka et al. 1999, Shi et al. 2005). Phosphorus is a component of ATP (adenosine triphosphate) as well as DNA (deoxyribonucleic acid), RNA (ribonucleic acid), and phospholipids. Since ATP can be used for the biosynthesis of many biomolecules, phosphorus is important for growth. Phosphorus can also be used to modify the activity of various enzymes by phosphorylation and can be used for cell signaling. The importance of nitrogen comes from its necessity as component of all proteins. The concentrations of these macronutrients as well as their interactions in the metabolism of toxic dinoflagellates will affect the dynamics of growth Micronutrients 10
31 A limited amount of data is available on the effect of micronutrients (vitamins and trace metals) on growth of dinoflagellates. If phosphorus and nitrogen are not limiting, the micronutrient will eventually limit growth. The micronutrients are implicated in the metabolism of microalgae as cofactor of enzymes or as metalloprotein involved in the photosynthesis and/or the assimilation of nitrogen (Grzebyk & Séchet 2003). Micronutrients such as selenium and iron are required in the growth of some toxic dinoflagellates. Without addition of selenium, the growth rate of Protoceratium reticulatum is reduced and morphological changes are observed. Without addition of iron, the growth rate is also reduced (Mitrovic et al. 2004). The selenium was also observed to be essential for Alexandrium minutum and Gymnodinium catenatum (Doblin et al. 1999). 1.4 Study area The Gyeonggi bay is located on the Korean West coast. The Gyeonggi bay is a shallow macrotidal and well-mixed estuary. The accumulation of organic matter is generally limited. The Gyeonggi bay is characterized by a broad shallow channel of m depth flanked by tidal flats >3 km width (Choi & Shim 1986a). The macrotidal bay (tidal amplitude >10 m) is characterized by semi-diurnal strong tidal currents ( and m s -1 during spring and neap tides, respectively) and strong winter monsoon sweeps (3.77 m s -1 ) that introduce vertical mixing causing the suspension of the bottom sediment (KMA 2010). Unpredictable discharges from Han River ( m 3 d -1 ) in the wet summer season bring nutrients into the system. 11
32 From 1986 to 1994, a 12.7 km sea dike was constructed within the Gyeonggi bay in order to create an artificial water body at proximity of Shiwha. This water body had a surface area of 42.3 km 2, a water storage capacity of 332 million tons, a maximum depth of 18 m, and a total seawater flux of 380 million tons per year (MOMAF 2006). The main tributaries of the Shiwha artificial water body consist of nine streams: the Okgu, Gunga, Jeongwang, Siheung, Singil, Ansan, Banweol, Dongwha, and Samwha streams (Oh et al. 2010). The Shiwha artificial water body was expected to transform into a freshwater lake and then be used for irrigation. However, the structures in place and the inputs from tributaries never enabled the establishment of a full freshwater body. Furthermore, eutrophication brought by the untreated sewage and wastewater flowing in from the Shiwha adjacent area caused a severe deterioration of the water quality in the middle of the 90s (Kim et al. 2004b). The majority of the Gyeonggi bay shows a non-eutrophic state through the year. The reduced depth and mixing capacity of the system reduced stratification and the development of algal bloom. However, the Upper Gyeonggi bay and the Shiwha artificial water body show a eutrophic state in summer. These regions are characterized by enhanced nutrients and algal blooms. Moreover, strong stratification produced by freshwater inputs into the surface layer from precipitation and rainfall (NFRDI 2008) has accelerated harmful algal blooms and hypoxia. The region is highly variable in regards of various environmental parameters such as the temperature, the salinity, the ph, the dissolved oxygen, the nutrients, and the phytoplankton biomass (i.e. chlorophyll a). The water temperature ranges 12
33 from 0.0 to 30.0 ºC with lower values during winter and maximum values in summer. Salinity variations are a reverse trend of temperature. Salinity ranges from 7.1 to 33.2 with lower values during the summer wet season and higher values in winter (Jahan et al. 2013). The ph is slightly higher in spring and autumn and dissolved oxygen concentrations are highest in winter. The nutrient concentrations are the highest in summer and eutrophic areas reaching values of approximately 50 µm dissolved inorganic nitrogen and 1 µm phosphate. In other seasons than summer, the system is characterized by lower nutrient concentrations. Chlorophyll a concentration can range from 0.7 to µg L -1 (Jahan et al. 2013). The highest chlorophyll a concentrations are detected in summer in eutrophic areas which are considerably influenced by massive nutrient inputs. The chlorophyll a concentrations are considerably lower in other seasons than summer. The chlorophyll a experienced an increasing trend associated with an increase in dissolved inorganic nitrogen during the past decades (Park & Park 2000, NFRDI 2008). The same tendencies observe in the region in regards of the temperature, the salinity, the nutrients, and the chlorophyll a are observed in the Shiwha artificial water body with the exception of both the ph and the dissolved oxygen for which there is no tendency (this study). The Shiwha artificial water body experiences similar water temperature ranging from 0.9 to 29.9 ºC and similar salinity ranging from 3.0 to 32.3 (this study). The nutrients reach higher concentrations than what is known for the region, the dissolved inorganic nitrogen getting up to µm and the phosphate up to 3.8 µm. However, the phytoplankton biomass reaches lower value, the chlorophyll a getting up to µg L -1 (this study). 13
34 The Upper Gyeonggi bay summer blooms are more dependent on physical processes rather than nutrients (Jahan et al. 2013). The huge discharges of the Han River not only deliver nutrients to the Upper Gyeonggi bay but also determine the hydrological properties of the water column, including high temperature, low salinity, vertical thermal stability, low turbidity as well as high light conditions. All of these properties trigger phytoplankton growth most likely by supplying proper temperature, increasing the light intensity, and retaining the algal cells in the euphotic zone. The Gyeonggi bay summer blooms are mostly dominated by the nano-size phytoplankton (2-20 µm). During , cryptomands (<5 µm) were the most dominant phytoplankton species associated with co-dominant diatoms, whereas the diatoms Skeletonema costatum and Chaetoceros spp. were the only dominant group in the past ( ) (Choi & Shim 1986b). The mechanism for summer blooms in the Shiwha artificial water body implicates huge freshwater inputs from the neighbouring municipal and industrial complexes through the adjacent streams. These inputs are large enough to offset the effects of tidal and wind stirring. As a result, the water column remains stratified at a depth range of 6-8 m for a period of time sufficient to promote phytoplankton growth and to generate frequent red tides indicating a hypertrophic condition (Choi et al. 1997, Han & Park 1999, Kim et al. 2004b). Summer harmful algal blooms are frequently caused by dinoflagellates (Prorocentrum minimum), cryptomonads, and Chrysophyceae, whereas diatoms (Cyclotella atomas, Nitzchia sp., and Chaetoceros sp.) are dominant in autumn and winter (Choi et al. 1997). This study will particularly focus on the Shiwha artificial water body hereafter referred as Shiwha bay. 14
35 1.5 Context of the study The azaspiracids (AZAs) were first identified following an outbreak of human illness in the Netherlands that was associated with ingestion of contaminated shellfish originating from Killary Harbour, Ireland (Twiner et al. 2008, Furey et al. 2010). Although the symptoms were typical of diarrhetic shellfish poisoning (DSP) toxins such as okadaic acid (OA) and dinophysistoxins (DTX), the levels of DSP toxins in these shellfish were well below the regulatory level. The shellfish were contaminated with a unique marine toxin, originally named Killary-toxin (Satake et al. 1998a). Thereafter, the toxin was renamed to azaspiracid (AZA) to more appropriately reflect its chemical structure: a cyclic amine, or aza group, with a tri-spiro assembly and carboxylic acid group (Satake et al. 1998a b). To date, over 20 AZA analogues have been identified in phytoplankton and shellfish (Satake et al. 1998a b, Ofuji et al. 1999, Ofuji et al. 2001, Lehane et al. 2002, James et al. 2003a, Rehmann et al. 2008, McCarron et al. 2009, Jauffrais et al. 2012). The structure of these analogues was determined by using mass spectrometry in tandem mode and nuclear magnetic resonance (NMR) (Ofuji et al. 1999, Ofuji et al. 2001). The fragmentation of AZA molecules obtained by mass spectrometry produced characteristic ions of this molecular family (Brombacher et al. 2002, Diaz Sierra et al. 2003, James et al. 2003a, Rehmann et al. 2008). Only the AZA-1 to -5 were isolated and structurally confirmed by using NMR. The AZA-6 joined this list in 2012 (Kilcoyne et al. 2012). AZAs have been reported in shellfish from many coastal regions of western Europe (James et al. 2002, Braña Magdalena et al. 2003, Furey et al. 2003, Amzil 15
36 et al. 2008), South America (Álvarez et al. 2010, López-Rivera et al. 2010), and northern Africa (Taleb et al. 2006, Elgarch et al. 2008). In addition, AZAs have been found in Scandinavian crabs (Torgersen et al. 2008) and Japanese sponges (Ueoka et al. 2009). Since the first poisoning event in 1995, five new episodes of food poisoning occurred as the result of the consumption of contaminated Irish mussels (Table 1.2) in Irland, Italy, France, United kingdom and United States (Twiner et al. 2008, Klontz et al. 2009). While the consumption of contaminated mussels by AZA caused multiple health problems, it is only in 2003 that the AZAs were detected for the first time in the phytoplankton species Protoperidinium crassipes, a dinoflagellate (James et al. 2003b). However, most of the toxin producers are photosynthetic or mixotrophic. Since P. crassipes, a heterotrophic dinoflagellate, is able to accumulate phycotoxins from its preys (Miles et al. 2004a), it was questionable whether it was a primary producer of AZA or not (Miles et al. 2004b, Hess et al. 2005). In 2007, in North Sea, a species producing AZA was isolated for the first time off Scotland (Krock et al. 2008). This organism was a producer of AZA-1 and -2 in situ and in axenic culture (Krock et al. 2009, Tillmann et al. 2009). The organism, a small thecal dinoflagellate (12-16 μm long; 7-11 μm wide), belonged to a new genus and was officially described as Azadinium spinosum (Tillmann et al. 2009). 16
37 Table 1.2 Food poisoning caused by azaspiracids and reported between 1995 and Poisoning location Date Poisoning source Production location Number of intoxication The November 1995 Mussels (Mytilus edulis) Killary Harbour, Ireland 8 Netherlands 1,2 Ireland 1,2 September/October 1997 Mussels (Mytilus edulis) Arranmore Island, Ireland ca Italy, September 1998 Mussels (Mytilus edulis) Clew bay, Ireland 10 Ravenna 1,2 France 1,2 September 1998 Mussels (Mytilus edulis) Bantry bay, Ireland ca United August 2000 Mussels (Mytilus edulis) Bantry bay, Ireland ca Kingdom 1,2 France 2,3 April 2008 Mussels (Mytilus edulis) Ireland outbreak United States 4 July 2008 Mussels (Mytilus edulis) Bantry bay, Ireland 2 References. 1 Twiner et al. 2008, 2 Furey et al. 2010, 3 RASFF 2008, 4 Klontz et al. 2009
38 Following the discovery of Azadinium spinosum as a source of AZA, multiple other species were discovered or transferred to this recently discovered genus, namely A. obesum, A. poporum, A. caudatum, and A. polongum (Tillmann et al. 2010, 2011, 2012a, Nézan et al. 2012). All species of the genus Azadinium are thecal. Most species of Azadinium are small (size of about µm) and ovoid to elliptical in shape with a hemispherical hyposome. A. caudatum is distinctly larger and, with a characteristic biconical outline, significantly different in shape as well. In all species, the episome is larger than the hyposome. All species are photosynthetic and possess a presumably single chloroplast which is parietally arranged, lobed, and normally extends into both the epi- and hyposome. A compilation of distinctive features of the species of the genus Azadinium are compiled in Table 1.3. The repartitions of AZAs (Fig. 1.1) and their progenitors (Fig. 1.2) in the multiple oceans of the world make these organisms a worldwide preoccupation. Knowledge on their classification, distribution, toxin analogues, field dynamics, interactions within the food web, and physiology is primordial to our understanding of their evolution and dynamics in the field. In this context, this thesis aims to: (1) establish the occurrence of species of the genus Azadinium in Korea, (2) determine the AZA present in the species isolated, (3) determine the population dynamics of the species, (4) establish the growth and/or grazing capacity of protistan predators and copepods on the isolated species, and (5) assess the physiology of the species. 18
39 19 Table 1.3 Morphological features for species of the genus Azadinium Feature Azadinium spinosum 1 Azadinium obesum 2 Azadinium poporum 3 Azadinium caudatum 4 Azadinium polongum 5 var. margalefii var. caudatum Length x Width 13.8 x x x x 22.4 a 41.7 x 28.7 a 13.0 x 9.7 (µm) Length/Width b 1.2 b 1.3 ratio Stalked pyrenoid(s) number Central episome Antapical Small spine No No Short horn Long horn Small spine projection Long spine Short spine Location "ventral" pore Left side of 1' (median position) Left side of 1' (median position) Left side of pore plate Right side of pore plate Right side of 1' (posterior position) Left side, suture of 1'and 1'' (slightly posterior) Shape of pore plate Round Ellipsoid Round Ellipsoid Round Ellipsoid Round Elipsoid Round Ellipsoid Distinctly elongated
40 20 Table 1.3 (continued) Feature Azadinium spinosum 1 Azadinium obesum 2 Azadinium poporum 3 Azadinium caudatum 4 var. margalefii var. caudatum Contact of Ventral 1'' in No Ventral 1'' in Ventral 1'' in Ventral 1'' in ventral contact to 1a contact to 1a contact to 1a contact to 1a, precingulars Ventral 6'' in Ventral 6'' in with contact to 3a contact to 3a intercalaries Shape of plate Similar size as Similar size as Similar size as Smaller than Smaller than 4'' other other other other other precingulars, in precingulars, in precingulars, in precingulars, no precingulars, no contact to 3a contact to 3a contact to 3a contact to 3a contact to 3a Azaspiracids AZA-1,-2, -716 Not detected Large strain Not detected No culture variability, AZA- available, not 846, -876, -2 analyzed yet AZA new china a Cell length including antapical projection (horn and spine) b Length excluding antapical projection Azadinium polongum 5 Ventral 1'' in contact to 1a Similar size as other precingulars, in contact to 3a Not detected References. 1 Tillmann et al. 2009; 2 Tillmann et al. 2010; 3 Tillmann et al. 2011, Krock et al. 2012; 4 Nézan et al Tillmann et al. 2012a


41 Fig. 1.1 Worldwide detection of azaspiracids References. 1 Álvarez et al. 2010, 2 Amzil et al. 2008, 3 Braña Magdalena et al. 2003, 4 Taleb et al. 2006, 4 Elgarch et al. 2008, 5 Ueoka et al. 2009, 6 Vale et al. 2008, 7 James et al. 2002, 8 Furey et al. 2003, 9 López-Rivera et al. 2010, 10 Torgersen et al

42 Fig. 1.2 Worldwide distribution of Azadinium spp. and Amphidoma languida References. 1 Tillmann et al. 2009, 2010, 2 Tillmann et al. 2011, 3 Salas et al. 2011, 3 Tillmann et al. 2012a, 4 Tillmann et al. 2012b, 5 Nézan et al. 2012, 6 Hernández-Becerril et al. 2012, 7 Akselman & Negri 2012, 8 Potvin et al. 2012, 9 Gu et al
43 This first chapter made a brief overview of the marine organisms producing phycotoxins, their toxins, and the main environmental factors as well as interspecies factors affecting the dynamics of toxic dinoflagellates. The second chapter establishes the morphology with optical and scanning election microscopy, the phylogenetic position based on the SSU rrna gene, the ITS rdna region, and LSU rrna gene, and if known AZA occurred in the strain of the genus Azadinium isolated from Shiwha bay, Korea. The third chapter analyses, with a closer look, the content of AZA in the Korean strain of the genus Azadinium using triple quadrupole mass spectrometry in the precursor and product ion mode. The structure of a new compound related to AZA is proposed by interpretation of fragmentation patterns and high resolution mass measurements using Fourier transform ion cyclotron resonance-mass spectrometry (FTICR-MS). The fourth chapter determines protistan and metazoan predators of the strain of the genus Azadinium, their physiology in regards of growth and/or grazing based on prey concentration, and their gross growth efficiency. Furthermore, qpcr is used to determine the population dynamics of the isolated species of the genus Azadinium from Shiwha bay for three years. Finally, the fifth chapter looks at the tendency of various physical and chemical factors through time and seasons in Shiwha bay, the effect of some environmental factors on the growth of the strain in laboratory, and the 23
44 relationships between environmental factors and the occurrence of the strain of the genus Azadinium in the field. 24
45 Chapter 2: Taxonomy First Report of the photosynthetic dinoflagellate genus Azadinium in the Pacific Ocean: morphology and molecular characterization of Azadinium cf. poporum 2.1 Abstract A strain of a dinoflagellate belonging to the genus Azadinium was obtained by the incubation of sediments collected from Shiwha bay, Korea. This report of the genus Azadinium is the first outside of northern Europe and furthermore from the Pacific Ocean. The diagnostic morphological features of the isolate very closely resemble the recently described species Azadinium poporum isolated from the North Sea. However, the shape of the 3 apical plate and the occasional morphological variations unreported from A. poporum bring minor distinctions between strains from different locations. The sequences of the SSU rdna, ITS rdna, and LSU rdna differed by 0.2 %, 2.6 %, and 3.6 %, respectively, from those of A. poporum, whereas the COI gene was identical to those found in all strains of Azadinium. Phylogenetic analyses of the ribosomal DNA regions generally positioned the Korean strain as a sister taxon of A. poporum. However, the Korean isolate tends to occupy a basal position within Azadinium species with ITS rdna and LSU rdna. Using liquid chromatography coupled with tandem mass spectrometry, no known azaspiracids were detected. The slight but discernible morphological differences, the distinct rdna sequences, and the tendency of the Korean strain to diverge phylogenetically based on ITS rdna and LSU rdna from A. poporum do not enable us to clearly assign the isolate to A. 25
46 poporum. It is therefore designated as Azadinium cf. poporum. The examination of more strains to find more diagnostic characteristics might enable the attribution of this material to a well-defined taxonomic position. 2.2 Keywords Asia, azaspiracids, harmful algal blooms, rdna, toxin 2.3 Introduction Dinoflagellates are among the major components of marine ecosystems (Lessard 1991, Jeong 1999, Sherr & Sherr 2007, Terrado et al. 2009). Many dinoflagellate species cause red tides or harmful algal blooms (Lu & Hodgkiss 2004, Phlips et al. 2011). In particular, some toxic species are harmful to marine organisms and humans (Bagnis et al. 1980, Frangópulos et al. 2000, Prince et al. 2008, Tillmann & Hansen 2009, Tang & Gobler 2010, Pelin et al. 2011). Azaspiracids (AZAs) are the most recently discovered group of lipophilic marine biotoxins of microalgal origin associated with cases of shellfish poisoning in humans (Twiner et al. 2008). The heterotrophic dinoflagellate Protoperidinium crassipes was initially thought to be a causative species (James et al. 2003b), but further research identified a small phototrophic dinoflagellate as the source of the AZAs (Krock et al. 2009). This species, Azadinium spinosum Elbrächter et Tillmann, was assigned to a new genus (Tillmann et al. 2009). The relevance of this species attracted attention to species similar in morphology, size, and swimming pattern. Soon afterward, a new nontoxic species closely related to A. spinosum was discovered in the coastal waters off Scotland and described as Azadinium obesum Tillmann et Elbrächter (Tillmann et al. 2010). Recently, 26
47 another new nontoxic species of the genus Azadinium has been described as Azadinium poporum Tillmann et Elbrächter (Tillmann et al. 2011) from the North Sea off Denmark. Therefore, all the known species of the genus Azadinium were to date described from the North Sea. The usual tabulation of the genus Azadinium follows the Kofoidian formula Po, cp, X, 4', 3a, 6'', 6c, 5?S, 6''', 2''''. The distinctive morphological characters proposed so far for differentiating each species in this genus are the presence of an antapical spine, the location of a conspicuous pore (initially described as a ventral pore, but subsequently shown to occur apically on the Po plate depending of the species), the relative size of the anterior intercalary plates, the width of the first apical plate (1') in its lower part, the presence of stalked pyrenoids and the presence of a contact between the 1'' and 1a plates (Tillmann et al. 2009, 2010, 2011). The phylogenetic reconstructions support the separation of all three previously described species within the genus Azadinium. The genus Azadinium is stable and produces well-defined clades. Azadinium spinosum and A. obesum seem to be more closely related to each other than to A. poporum (Tillmann et al. 2011). Based on pairwise comparison of sequences when available, there is no intraspecific variability in actual species even though some stains were isolated from different locations such as A. spinosum. We recently isolated a small dinoflagellate able to grow photosynthetically from Shiwha bay, Korea, and established a clonal culture. In this study, we report the morphological and genetic characteristics of this Korean strain and present phylogenetic trees based on SSU rdna, ITS rdna, and LSU rdna. Furthermore, we test the occurrence of known AZAs. This is the first report of the genus 27
48 Azadinium in Korean waters and the Pacific Ocean. 2.4 Materials and methods Collection and culturing of Azadinium cf. poporum For the isolation and culture of Azadinium cf. poporum, surface sediment samples from Shiwha bay, Korea (37 18'N, 'E), were collected in June 2010 using an Ekman grab (WILDCO,Wildlife Supply Company, Buffalo, NY), and stored in the dark at 4 C. The sediment samples were sieved consecutively through 100 and 15 µm Nitex meshes. The fraction retained on the 15 µm Nitex mesh was used for further processing. Cells and particles of similar density were then separated from the gross sand by the application of a manual vortex in filtered seawater and the recovery of the suspended fraction. The clean sediment fraction was then incubated in F/2 medium-si (Guillard & Ryther 1962) in a growth chamber at 20 C under an illumination of 20 µe m -2 s -1 on a 14:10 h light: dark cycle. The incubated sediment was regularly observed for motile cells under a stereomicroscope (Olympus, SZX-12, Tokyo, Japan). Individual cells normally swimming at low speed and interrupted by short high-speed jumps in various directions, typical of the genus Azadinium (Tillmann et al. 2009), were isolated by micromanipulation in well plates (SPL Life Sciences, Pocheon, Korea). Each well contained ca. 360 µl F/2 medium-si. When the cells reached a high density, they were isolated a second time and subsequently brought in 1 L volume Morphology of Azadinium cf. poporum The morphology of living cells of A. cf. poporum was examined using a 28
49 transmitted light inverted microscope (Zeiss Axiovert 200M, Carl Zeiss Ltd., Göttingen, Germany) equipped with differential interference contrast optics at magnifications of x. In addition, the length and width of cells were measured with a Zeiss AxioCam MRc5 digital camera (Carl Zeiss Ltd). For scanning electron microscopy (SEM), cells from 50 ml of a dense culture were collected in conical centrifuge tubes (SPL Life Sciences) by centrifugation for 5 min at 2190 g (Hanil Science Industrial Co., Ltd., model FLETA 5, Incheon, Korea). The supernatant was removed and the cell pellet resuspended in 60 % ethanol for 1 h at 4 C or room temperature to strip off the outer cell membrane similarly to Tillmann et al. (2011). Subsequently, the cells were pelleted by centrifugation and resuspended in 50 % filtered seawater for 30 min at 4 C or room temperature. After centrifugation, the seawater supernatant was removed, and the cell pellet was resuspended and fixed in 50 % filtered seawater with 5 % (w/v) paraformaldehyde for 3 h at 4 C. The cells were then collected on polycarbonate membrane filters (Whatman Nucleopore Track-Etch, 25 mm, 3 µm or 5 µm pore size, Dassel, Germany) in filter funnels without additional pressure. The cells were washed for 15 min with 50 % filtered seawater followed by 15 min of reverse osmosis purified water (Human RO 180, Human Corporation, Seoul, Korea). The washings were followed by a dehydration series in ethanol (i.e. 10 %, 30 %, 50 %, 70 %, 90 %, 100 % x 3). The filters were dried using a critical point dryer (BAL-TEC, CPD 030, Balzers, Liechtenstein). Finally, the filters were mounted on stubs, sputtercoated (BAL-TEC, SCD 005, Balzers) with goldpalladium and observed with a FE-scanning electron microscope (AURIGA, Carl Zeiss). The specimens were photographed using a digital camera. Some SEM micrographs were presented on a black background using Adobe Photoshop CS4 Extended (Adobe Systems Inc., San Jose, CA). Measurements of detailed features 29
50 of the theca obtained from SEM pictures were made using the software Engauge Digitizer. In describing the thecal plate tabulation, we employed the nomenclature of Kofoid (1909). The designation of the putatively subdivided thecal plates is adopted from Morrill & Loeblich (1981). The terminology used to describe plate modifications from the usual plate pattern followed Lefèvre (1932) DNA extraction, PCR amplification, and sequencing A 50 ml sample of an exponentially growing culture was filtered on a polycarbonate membrane (Whatman Nucleopore Track-Etch, 25 mm, 3 µm pore size) and resuspended by vortexing in sterile reverse osmosis purified water in a 1.5 ml microtube (Scientific Specialties Inc., Lodi, CA). The sample was subsequently centrifuged (DAIHAN Scientific Co., Ltd., WiseSpin CF-10 Microcentrifuge, Namyangju, Korea) at 7500 g for 5 min at room temperature. The cells were immediately subjected to total DNA extraction using the AccuPrep Genomic DNA extraction kit (Bioneer Corp., Daejeon, Korea) according to the manufacturer s instructions. A thermal cycler (Eppendorf AG, Mastercycler ep, model 5341, Hamburg, Germany) was used for PCR reactions. The final concentrations of PCR products were as follows: 1X PCR f-taq buffer (SolGent Co., Ltd., ftaq DNA Polymerase, Daejeon, Korea), 0.2 mm of dntp mix (SolGent Co., Ltd., ftaq DNA Polymerase), 0.4 µm of each primer, U µl -1 of f-taq DNA polymerase (SolGent Co., Ltd., ftaq DNA Polymerase), and 1.5 mm of MgCl 2. A volume of 1.0 µl of the DNA extraction was used as template in individual reactions, with a 30
51 final volume of 50 µl. The SSU rdna, ITS rdna, LSU rdna, and COI mitochondrial DNA were obtained with these respective primer pairs: EukA (5'- CTG GTT GAT CCT GCC AG-3'; Medlin et al. 1988) and G23R (5'-TTC AGC CTT GCG ACC ATA C-3'; Litaker et al. 2003); G17F (5'-ATA CCG TCC TAG TCT TAA CC-3'; Litaker et al. 2003) and 5.8SR (5'-CAT CGT TGT TCG AGC CGA GAC-3'; Litaker et al. 2003); Euk 1209F (5'-CAG GTC TGT GAT GCC C- 3') and ITSR2 (5'-TCC CTG TTC ATT CGC CAT TAC-3'; Litaker et al. 2003); 5.8SF (5'-CAT TGT GAA TTG CAG AAT TCC-3'; Litaker et al. 2003) and LSUB (5'-ACG AAC GAT TTG CAC GTC AG-3'; Litaker et al. 2003); and DINOCOX1F (5'-AAA AAT TGT AAT CAT AAA CGC TTA GG-3'; Lin et al. 2002) and DINOCOX1R (5'-TGT TGA GCC ACC TAT AGT AAA CAT TA-3'; Lin et al. 2002). The PCRs were produced as follows: one activation step at 95 C for 2 min, followed by 35 cycles at 95 C for 20 s, the selected annealing temperature (AT) for 40 s, and 72 C for 1 min, and a final elongation step at 72 C for 5 min. The AT was adjusted depending on the primers used according to the manufacturer s instructions. Positive and negative controls were used for all amplification reactions. The purity of the amplicons was controlled by the migration of 3 µl of PCR products in 1.0 % agarose containing ethidium bromide and its observation under a UV lamp. The PCR products were purified using the AccuPrep PCR purification kit (Bioneer Corp.) according to the manufacturer s instructions. The purified DNA was sent to the Genome Research Facility (School of Biological Science, Seoul National University, Korea) and sequenced with an ABI PRISM 3700 DNA Analyzer (Applied Biosystems, Foster City, CA) Sequence availability and phylogenetic analysis 31
52 Partial DNA sequences were combined with BioEdit v (Hall 1999). Sequences of taxa used to construct the phylogenies (Table 2.1) were aligned using CLUSTAL X v2.0 (Larkin et al. 2007). The alignment was refined manually to remove ambiguities. The matrix was then analyzed with PAUP v4.0b10 (Swofford 2002). Three phylogenetic methods were used with PAUP: neighbor joining (NJ); maximum parsimony (MP); and maximum likelihood (ML). The Kimura 2- parameter model (Kimura 1980) was used as a nucleotide substitution model for NJ analysis. Models of nucleotide substitution were determined for ML with Modeltest v7.3 (Posada & Crandall 1998) based on the Akaike information criterion (Posada & Buckley 2004). A heuristic tree search was used to determine the optimal trees for the MP and ML methods. The tree bisection-reconnection algorithm was used with 1000 and five random additions of sequences for MP and ML, respectively. The characters were equally weighted and spaces in the alignment were treated as missing data. RAxML v7.0.4 (Stamatakis 2006) was used to calculate ML bootstrap values using the default algorithm with the general time reversible + Γ model of nucleotide substitution and 1000 replicates. The matrix was also analyzed with MrBayes v3.1.2 (Huelsenbeck & Ronquist 2001) for Bayesian analyses. The models previously selected by Modeltest 7.3 were used. Four independent Markov chain Monte Carlo simulations were run simultaneously for generations. Trees were sampled every 1000 generations, and the first 800 trees were deleted to ensure that the likelihood had reached convergence. A majority-rule consensus tree was created from the remaining 1201 trees to examine the posterior probabilities of each clade. 32
53 Table 2.1 Taxa used to establish the phylogenies based on SSU rdna, ITS rdna, and LSU rdna SSU rdna ITS rdna LSU rdna Akashiwo sanguinea AY AF EF Alexandrium affine DQ AY Alexandrium catenella - - AB Alexandrium minutum AJ Alexandrium ostenfeldii AJ Alexandrium tamarense - - AB Alexandrium taylorii AJ Amphidinium herdmanii AF AY Amphidinium semilunatum AF AY Azadinium obesum 2E10 GQ FJ GQ Azadinium poporum UTHD4 HQ HQ HQ Azadinium poporum UTHC5 HQ HQ HQ Azadinium poporum UTHC8 HQ HQ HQ Azadinium spinosum 3D9 FJ FJ HQ Azadinium spinosum UTHE2 HQ HQ HQ Azadinium cf. poporum FR FR FR Calciodinellum albatrosianum - - DQ Calciodinellum levantinum - - DQ Ceratium fusus AF AF Ceratium lineatum - - AF Crypthecodinium cohnii Cryptoperidiniopsis sp. - - AY Dinophysis acuminata EU EF Ensiculifera aff. imariensis - - DQ Ensiculifera cf. loeblichii - - DQ Fragilidium subglobosum - - AF Gonyaulax baltica - - AF Gonyaulax polygramma AY Gymnodinium aureolum AJ AY
54 Table 2.1 (continued) SSU rdna ITS rdna LSU rdna Gymnodinium catenatum AY AF Gymnodinium fuscum AF AF Gymnodinium impudicum AF AF Gymnodinium instriatum DQ DQ Gymnodinium mikimotoi - - AF Gymnodinium simplex DQ AF Gymnodinium sp. AF Gyrodinium fissum - - EF Heterocapsa arctica - - AY Heterocapsa circularisquama - - AB Heterocapsa hallii AF AF Heterocapsa niei AF Heterocapsa pygmaea AF Heterocapsa rotundata AF AF Heterocapsa triquetra AJ AF EF Heterocapsa sp. AB AY AF Karenia brevis AF AY Karenia umbella - - AY Karlodinium antarcticum - - EF Karlodinium micrum AM AF AY Lingulodinium polyedra AF Oxyrrhis marina AF EF Pentapharsodinium tyrrhenicum AF DQ Peridiniella catenata - - AF Peridiniopsis polonicum AY Peridinium aciculiferum AY Peridinium bipes f. globosum EF Peridinium cinctum EF
55 Table 2.1 (continued) SSU rdna ITS rdna LSU rdna Peridinium limbatum DQ Peridinium palatinum - - AF Peridinium umbonatum AF Peridinium wierzejskii AY Peridinium willei AF Pernambugia tuberosa - - DQ Prorocentrum compressum - - AY Prorocentrum dentatum DQ AY Prorocentrum donghaiense DQ Prorocentrum mexicanum Y DQ Prorocentrum micans AJ EF Prorocentrum minimum DQ AF DQ Prorocentrum triestinum AB AY Protoceratium reticulatum - - AF Pseudopfiesteria shumwayae AF Pyrodinium bahamense AF Rhinodinium broomeense - - DQ Scrippsiella nutricula U Scrippsiella precaria DQ DQ Scrippsiella rotunda - - DQ Scrippsiella sweeneyae AF AY Scrippsiella trochoidea AY EF DQ Symbiodinium sp. - - AF Takayama cf. pulchella AY AY U92254 Takayama tasmanica - - AY Togula britannica AY AY Togula jolla - - AY
56 2.4.5 Chemical analysis of azaspiracids After approximately 3 wk of growth, 300 ml of A. cf. poporum culture was harvested at a concentration of 1.78 x 10 5 cells ml -1 determined by microscopical cell counts using a Sedgwick-Rafter chamber. The samples were centrifuged at 2190 g for 10 min in 50 ml conical centrifuge tubes (SPL Life Sciences). The cell pellets were combined in 1.5 ml microtubes (Scientific Specialties Inc.) and centrifuged again at 7500 g for 5 min. The cells were then frozen at 20 C until analyzed. A quantity of 250 µl of methanol was added to cells. The mixture was vigorously shaken and subsequently transferred to FastPrep vials containing 0.9 g lysing matrix D (Thermo-Savant, Illkirch, France). The procedure was repeated with another 250 µl of methanol, and corresponding samples were combined. The samples were homogenized by reciprocal shaking for 45 s at 6.5 m s -1. The homogenates were centrifuged at g for 15 min at 4 C, and the supernatants were filtered through 0.45 µm cut-off spin filters by centrifugation for 30 s at 800 g. The filtrates were then transferred to HPLC vials and analyzed by liquid chromatography coupled to tandem mass spectrometry (LC-MS/MS) according to the methods described in detail by Tillmann et al. (2009). Selected reaction monitoring experiments were carried out in the positive ion mode for the most abundant AZA variants by selecting the following transitions (precursor ion > fragment ion): (1) AZA-1 and AZA-6: m/z 842 > 824 collision energy (CE): 40 V and m/z 842 > 672 CE: 70 V; (2) AZA-2 and Me-AZA-1: m/z 856 > 838 CE: 40 V and m/z 856 > 672 CE: 70 V; (3) AZA-3: m/z 828 > 810 CE: 40 V and m/z 828 > 658 CE: 70 V; and (4) Me-AZA-2: m/z 870 > 672 CE: 40 V and m/z 870 > 362 CE: 70 V. Precursor ion experiments were performed to detect putative unknown 36
57 AZA variants. Precursors of the characteristic AZA fragment m/z 362 were scanned in the range between m/z 300 and Results Morphology of Azadinium cf. poporum The living cells of A. cf. poporum were ovoid and dorsoventrally compressed (Fig. 2.1 A-C). The hypotheca was generally semi-spherical and tended to be asymmetric, the left and right sides differing in length (Fig. 2.2 A-C). The hypotheca occasionally produced a protuberance at the antapex (Fig. 2.2 D). The episome was connected to the smaller hyposome by a deep and wide cingulum (Fig. 2.2 A-D). The large nucleus was spherical to slightly elongated and located in the central part of the cell (Fig. 2.1 A-B). Pyrenoids (> 1) were visible in most cells using light microscopy (Fig. 2.1 A). The exact number of pyrenoids was not determined. The antero-posterior (AP) length and width of cells fixed with Lugol s solution were µm (mean ± standard deviation = 12.5 ± 0.9, n = 100) and µm (mean ± SD = 9.2 ± 0.8, n = 100), respectively. The ratio of the AP length to the width of the cells was (mean ± SD = 1.4 ± 0.1, n = 100). The usual plate pattern of the Korean strain was arranged in the Kofoidian series Po, cp, X, 4', 3a, 6'', 6C, 5(?)S, 6''', 2'''' (Fig. 2.3 A-B). The episome ended with a conspicuous apical pore complex (APC) (Fig. 2.4 A-D). The round or slightly ellipsoid apical pore, located in the center of the pore plate (Po), was overlaid by a cover plate (cp) (Fig. 2.4 A-D). The length and width of the apical pore were µm (mean ± SD = 0.71 ± 0.07, n = 27) and µm (mean ± SD = 0.51 ± 0.06, n = 27), respectively. The X plate, which was connected 37


58 Fig. 2.1 Micrographs of cells of Azadinium cf. poporum taken using an inverted microscope. A-B. Mid-focus ventral view of live cells showing the nucleus and pyrenoids (white arrows) in both epitheca and hypotheca. C. Mid-focus lateral view of live cells showing the cingulum and the dorso-ventral compression. N: nucleus, C: cingulum. Scale bars = 5 µm 38
 and a protuberance at the antapex.")
59 Fig. 2.2 Micrographs of cells of Azadinium cf. poporum taken using a scanning electron microscope. A. Ventral view. B. Left lateral view. C. Dorsal right lateral view. D. Right lateral view showing the sulcal list (arrow) and a protuberance at the antapex. The nomenclature of Kofoid (1909) was used to describe the thecal plate tabulation. S: sulcus. Scale bars = 1 µm 39
 was used to describe the thecal plate tabulation.")
60 Fig. 2.3 Micrographs of cells of Azadinium cf. poporum taken using a scanning electron microscope. A. Apical view showing the whole series of epithecal plates. B. Antapical view showing the whole series of hypothecal plates. The nomenclature of Kofoid (1909) was used to describe the thecal plate tabulation. Po: pore plate, cp: cover plate, X: X plate, S: sulcus. Scale bars = 1 µm 40
. C.")
. The nomenclature of Kofoid (1909) was used to describe the thecal plate tabulation.")
61 Fig. 2.4 Micrographs of cells of Azadinium cf. poporum taken using a scanning electron microscope showing the apical pore complex and other related features. A. Typical apical pore complex longer than wide with the ventral pore located at the intersection of the sutures of 1', 2' and Po (arrow). B. Apical pore complex almost as long as wide with the ventral pore located at the intersection of the sutures from 1', 2' and Po (arrow). C. Highly displaced ventral pore located unusually in a ventral position along the suture between 1' and 1'' (arrow). D. Apical pore complex with a slightly displaced ventral pore located along the suture between 2' and Po (arrow). The nomenclature of Kofoid (1909) was used to describe the thecal plate tabulation. Po: pore plate, cp: cover plate, X: X plate. Scale bars = 0.5 µm 41
62 to the cp, was slightly intruded in the first apical plate (1') (Fig. 2.4 A-D). The Po was bordered by a conspicuous rim produced by the second, third, and fourth apical plates (Fig. 2.4 A-B) and was either elongated (Fig. 2.4 A) or of similar length and width (Fig. 2.4 B). The border of the Po was either sharply polygonal (Fig. 2.4 A) or rounded (Fig. 2.4 B-D). A conspicuous pore was usually located at the intersection of the Po, 1', and 2' plates (Fig. 2.4 A-B). This pore is assumed to be homologous to the ventral pore of A. spinosum and A. obesum (Tillmann et al. 2011). In the Korean strain, this pore was rarely located on the contact between the 2' plate and the Po plate of the APC (observed twice; Fig. 2.4 D) and found once on the contact between the 1' plate and 1'' plate (Fig. 2.4 C). The length and width of the ventral pore, which was round or slightly ellipsoid (Fig. 2.4 A-D), were µm (mean ± SD = 0.26 ± 0.04, n = 21) and µm (mean ± SD = 0.22 ± 0.04, n = 21), respectively. Small pores were present on almost every plate. No pore was observed on the plates that formed the APC and the Sm and Sd plates of the sulcus. Small pores of different size were generally distributed randomly, but a group of small pores was often present on the 2'''' plate (Fig. 2.3 B). The first apical plate (1') touched the Po, X, 2', 4', 1'', 6'', and anterior sulcal (Sa) plates (Fig. 2.2 A). The 1' plate was slightly asymmetric. The contact with the 2' plate was smaller than the contact with the 4' plate. The size of the pentagonal 2' plate was similar to that of the hexagonal 3' plate, but smaller than the hexagonal 4' plate (Fig. 2.3 A). The quadrangular second anterior intercalary plate (2a), which touched the 3', 1a, 3a, and 3'' plates, was usually smaller than the 1a and 3a plates (Fig. 2.3 A). The first precingular plate (1'') was the biggest episomal plate (Fig. 2.3 A) and was in contact with the first intercalary plate 1a. The 3'' and 5'' plates were larger than the 2'', 4'', and 6'' plates (Fig. 2.3 A). 42
63 The width of the left side of the cingulum (mean ± SD = 2.54 µm ± 0.21, n = 27) was similar to that of the right side (mean ± SD = 2.30 µm ± 0.19, n = 27). The cingulum was descending (Fig. 2.2 A), and was displaced by approximately half of its width (mean ± SD = 0.54 µm ± 0.15, n = 27) or by approximately one-tenth of cell length (mean ± SD = 0.13 ± 0.04, n = 27). Six cingular plates, similar to one another in size, were usually present (Fig. 2.2 A-D). In addition, narrow cingular lists were present (Fig. 2.2 A-D). A sulcal list was present at the right side of the cingulum and covered a part of the sulcal area (Fig. 2.5 A-D). Five sulcal plates occurred in a deeply concave sulcus: the anterior sulcal plate (Sa); the right sulcal plate (Sd); the left sulcal plate (Ss); the median sulcal plate (Sm); and the posterior sulcal plate (Sp). The Sa and Sp were much larger than the Sd and Sm, whereas the Ss was latitudinally extended (Fig. 2.5 A-D). The Sa, which extended toward the episome, touched the 1', 1'', 6'', C1, C6, and Ss plates and covered the Sm plate slightly (Fig. 2.5 A-D). The Ss plate, which touched the Sd, Sm, Sa, Sp, C6, and 1''' plates, intruded the C1 plate (Fig. 2.5 A-D). The wide Sp touched the C6, Ss, 1''', 6''', 1'''', and 2'''' plates (Fig. 2.5 A-C). The hypotheca was usually composed of six postcingular plates and two antapical plates. The 2'''' was usually the biggest hyposomal plate (Fig. 2.3 B). Departures occurred from the usual tabulation pattern outlined above. Individual cells showed thecal modifications, including the fusion of plates (i.e. simplex modifications), the division of plates (i.e. complex modifications), and the displacement of sutures (i.e. travectum modifications) (see Fig. 2.6 A-H for examples). The plasticity was estimated to be ca. 40 % based on ca. 200 observations of scanning electron micrographs. 43


64 Fig. 2.5 Micrographs of cells of Azadinium cf. poporum taken using a scanning electron microscope showing the sulcal area. A. Right-lateral view of the sulcus. B. Ventral view of the sulcus. C. Left-lateral view of the sulcus. D. Apical view of the sulcus. The nomenclature of Kofoid (1909) was used to describe the thecal plate tabulation. Sa: anterior sulcal plate, Sd: right sulcal plate, Ss: left sulcal plate, Sm: median sulcal plate, Sp: posterior sulcal plate. Scale bars = 1 µm 44
65 Fig. 2.6 Micrographs of cells of Azadinium cf. poporum taken using a scanning electron microscope showing plate modifications. A. Complex modification of the 3' and 3a plates producing a supplementary apical and anterior intercalary plate. B. Complex modifications of the 3'' and C3 plates producing a supplementary precingular and cingular plate, respectively. C. Complex modification of 6'' producing a supplementary precingular plate. D. Simplex modification involving 2' and 3' plates. The nomenclature of Kofoid (1909) was used to describe the thecal plate tabulation. Sa: anterior sulcal plate, Ss: left sulcal plate, Sp: posterior sulcal plate. Scale bars = 1 µm 45
66 Fig. 2.6 (continued) E. Complex modification of the 1''' plate producing a supplementary intercalary plate. Travectum modification of the contact between 1'''' and 2'''' plates producing two antapical plates of similar size. F. Complex modifications of 5''' plate producing an additionnal postcingular plate. Travectum modification of 1'''' embedding all the Sp plate. Complex modification of the reduced 2'''' producing an additional antapical plate. G. Simplex modification reducing the number of antapical plate to one. H. Complex modification of the 2''' and 2'''' plates producing a supplementary postcingular and antapical plate. The nomenclature of Kofoid (1909) was used to describe the thecal plate tabulation. Sp: posterior sulcal plate. Scale bars = 1 µm 46
67 2.5.2 Molecular characterization of Azadinium cf. poporum The partial SSU, ITS, and partial LSU rdna of A. cf. poporum (GenBank accession number = FR877580) were analyzed and provided a sequence of 3267 bp. The mitochondrial gene COI of the Korean strain of A. cf. poporum (GenBank accession number = FR877581) was also analyzed and provided a sequence of 960 bp. The simplest measure of evolutionary distance in molecular phylogenetics is the number of nucleotide differences between species. We calculated nucleotide differences between strains of Azadinium (i.e. 3D9, UTHE2, 2E10, UTHD4, UTHC5, and UTHC8) for the SSU, ITS, and LSU rdna, and COI mitochondrial DNA by pairwise comparison of aligned sequences. No intraspecific variability was found if we excluded ambiguous nucleotides. However, the interspecific DNA variability depended on the DNA region analyzed. The interspecific variability was < 0.4 % for the SSU rdna, < 10.2 % for the ITS rdna, < 6.3 % for the LSU rdna, and nonexistent for the mitochondrial DNA gene COI. Therefore, the ITS rdna and the LSU rdna are more likely to resolve the relationships between species of the genus Azadinium. The rdna sequences of the Korean strain of A. cf. poporum were more similar to A. poporum from the North Sea (Table 2.2). In the phylogenetic tree based on the SSU rdna, all the known species of the genus Azadinium formed a monophyletic clade with moderate support (Fig. 2.7). The three strains of A. poporum from the North Sea produced a polytomic clade that showed high support. All the phylogenetic methods used showed that the Korean strain of A. cf. poporum clustered with A. poporum from the North Sea as a sister taxon. The relationship between A. cf. poporum from Korea and A. poporum from the North Sea had low support with ML method and high support with Bayesian analysis. The relationships between species of the genus Azadinium other 47
68 Table 2.2 Dissimilarity matrix comparing Azadinium cf. poporum from Korea to other species in the genus Azadinium. a Gaps occurring in the alignment when sequences were compared were considered as dissimilarities. Ambiguous nucleotides were not considered as dissimilarities DNA Azadinium poporum Azadinium spinosum Azadinium obesum region SSU rdna 3/1410 (0.2 %) 4/1410 (0.3 %) 6/1410 (0.4 %) Gap 0/1410 (0.0 %) 0/1410 (0.0 %) 0/1410 (0.0 %) ITS rdna 16/619 (2.6 %) 63/623 (10.1 %) 40/621 (6.4 %) Gap 5/619 (0.8 %) 21/623 (3.4 %) 13/621 (2.1 %) LSU rdna 26/715 (3.6 %) 38/716 (5.3 %) 45/716 (6.3 %) Gap 1/715 (0.1 %) 2/716 (0.3 %) 2/716 (0.3 %) COI 0/913 (0 %) 0/913 (0 %) 0/913 (0 %) Gap 0/913 (0 %) 0/913 (0 %) 0/913 (0 %) a Sequences used in the comparison were obtained from Genbank 48
69 SSU rdna. Tree based on 1080 aligned nucleotides of the nuclear SSU rdna using the GTR+I+G model with Oxyrrhis marina as outgroup taxa. Alignment length includes gaps. The parameters were as follows: assumed nucleotide frequencies A=0.2819, C=0.1741, G= and T=0.2890; substitution rate matrix with G-T=1.0000, A- C=0.8776, A-G=4.0977, A-T=1.3425, C- G=0.6189, C-T= ; proportion of invariable sites= and rates for variable sites assumed to follow a gamma distribution with shape parameter= ITS rdna. Tree based on 604 aligned nucleotides of the nuclear ITS rdna using the K81uf+G model with Prorocentrum minimum as outgroup taxa. Alignment length includes gaps. The parameters were as follows: assumed nucleotide frequencies A=0.2065, C=0.2489, G= and T=0.2976; substitution rate matrix with G-T=1.0000, A-C=1.0000, A- G=2.6949, A-T=0.3832, C-G=0.3832, C- T=2.6949; proportion of invariable sites=0 and rates for variable sites assumed to follow a gamma distribution with shape parameter= LSU rdna. Tree based on 459 aligned nucleotides of the nuclear LSU rdna using the GTR+I+G model with Oxyrrhis marina as outgroup taxa. Alignment length includes gaps. The parameters were as follows: assumed nucleotide frequencies A=0.2337, C=0.1959, G= and T=0.2977; substitution rate matrix with G-T=1.0000, A- C=0.6504, A-G=2.2359, A-T=0.7607, C- G=0.5000, C-T=4.9494; proportion of sites assumed to be invariable= and rates for variable sites assumed to follow a gamma distribution with shape parameter= Fig. 2.7 Maximum likelihood phylogenetic trees based on SSU rdna, ITS rdna, and LSU rdna. The numbers at the nodes of the branches indicate the ML bootstrap (left) and Bayesian posterior probability (right) values; only values 50% or 0.5 are shown. The dashed line illustrate the alternative phylogenetic position of Azadinium cf. poporum as a sister taxon of Azadinium poporum. 49
70 than A. cf. poporum and A. poporum were not well defined. The sequences of the SSU rdna in Azadinium species have a low number of variable characters (i.e. 0.6 % of variable sites based on 1410 aligned bp, including gaps) and therefore has a low resolution. The ITS rdna is more variable for the species of the genus Azadinium (i.e % of variable sites based on 631 aligned bp, including gaps) and relationships between species are likely to be better defined. The results based on the ITS rdna positioned A. cf. poporum as a sister taxon of A. poporum with NJ and MP analyses. However, A. cf. poporum is in basal position among Azadinium species based on ML method (Fig. 2.7) and Bayesian analysis (not shown). In the two last mentioned methods, the strains of A. spinosum, A. obesum, and A. poporum produced a clade that was not supported. The relationship between A. spinosum and A. obesum was either not or highly supported depending on the method used. The three strains of A. poporum from the North Sea produced a polytomic clade that was well supported. However, the relationships between Azadinium species were unstable, A. cf. poporum being a sister taxon to the other strains of A. poporum in some occasions depending of the outgroup used. The variability of the LSU rdna is similar to the ITS rdna for the species of the genus Azadinium (i.e. 9.6 % of variable sites based on 717 aligned bp, including gaps). The results based on the LSU rdna positioned A. cf. poporum basal to Azadinium species with NJ method and basal to Azadinium species or occasionally as a sister taxon of A. poporum with MP method. Azadinium species generally produced a monophyletic clade based on ML method (Fig. 2.7) and Bayesian analysis (not shown). This clade was very well supported. The strains of A. spinosum, A. obesum, and A. poporum produced a clade that was weakly 50
71 supported. The relationship between A. spinosum and A. obesum was also weakly supported. The three strains of A. poporum from the North Sea produced a wellsupported polytomic clade. The relationships between Azadinium species were, however, unstable as it also occurred for the ITS rdna with ML method and Bayesian analysis. A. cf. poporum was either basal to all other known species in the genus Azadinium or a sister taxon to the other strains of A. poporum depending of the species included in the phylogeny. On one occasion, Amphidinium herdmanii was included in the clade composed of Azadinium species and thus made the genus paraphyletic (not shown) Azaspiracids No trace of known AZAs was detected. The limit of detection per cell as AZA-1 equivalents was estimated to be 4.9 x 10⁻⁷ pg, which is at least four orders of magnitude below the cell quota reported for A. spinosum (Krock et al. 2009). However, mass spectrometry yielded some indications that A. cf. poporum might contain some other potentially related compounds (not shown). 2.6 Discussion Distribution Species of the genus Azadinium have so far only been reported in northern Europe: from the North Sea (Tillmann et al. 2009, 2010, 2011) and the Irish coast of the eastern Atlantic (Salas et al. 2011). The type of the genus is the only species actually known to produce AZAs (Tillmann et al. 2009). These toxins were originally characterized from the shellfish Mytilus edulis of Ireland (Satake et al. 51
72 1998b). Following the development of sensitive LC-MS methods for the determination of AZAs, the toxins have been detected in additional locations, including Norway (James et al. 2002, Torgersen et al. 2008), England (James et al. 2002), Spain (Magdalena et al. 2003), France (Magdalena et al. 2003), Denmark (De Schrijver et al. 2002), Portugal (Vale 2004), Morocco (Taleb et al. 2006), Canada (Quilliam, M. pers. commun. in Twiner et al. 2008), and Sweden (Torgersen et al. 2008). It was therefore reasonable to suppose that the genus Azadinium had a more widespread distribution. This study is the first report of a species of the genus Azadinium from a locality other than northern Europe extending the latitudinal range of the genus further south Morphology Azadinium cf. poporum can be easily differentiated from A. spinosum by multiple features, such as the absence of an antapical spine. Furthermore, its length to width ratio is lower than that of A. spinosum. A conspicuous pore, regarded as homologous to the ventral pore of A. spinosum and A. obesum, is located typically on the Po plate. A. cf. poporum can also be easily distinguished from A. obesum by the presence of pyrenoids, the location of the ventral pore on the Po plate, the presence of a contact between the 1'' and 1a plates, the distinctive difference in the relative sizes of the anterior intercalary plates, and the absence of a narrow portion in the lower part of the 1' plate (Table 2.3). Although the morphological differences between A. cf. poporum and A. spinosum or A. obesum are relatively easy to determine, the differentiation of A. cf. poporum from A. poporum is more difficult. The ovoid and dorsoventrally compressed shape of A. cf. poporum is very similar to that of A. poporum (Table 52
73 Table 2.3 Comparison of distinctive morphological and toxigenic features of species in the genus Azadinium. Y: the organism has. N: the organism does not have. Feature in bold distinguish A. cf. poporum from Korea and A. poporum from North Sea Features Azadinium cf. poporum Azadinium poporum Azadinium spinosum Azadinium obesum Localities (latitude, longitude) Shiwha bay, Korea, (37 18 N, E) North Sea off Denmark ( N, E) North Sea off Scotland 3 ( N, W) and Denmark 2 ( N, E) North Sea, off Scotland ( N, W) Shape Ovoid and dorso- Ovoid and dorso- Elliptical, slightly Ovoid and dorso- 53 ventrally compressed ventrally compressed elongated, and dorsoventrally compressed ventrally compressed Cell length, µm (Median) (12.5, n=100) (13.0, n=48) (13.8, n=73) (15.3, n=36) Cell width, µm (Median) (9.2, n=100) (9.8, n=48) (8.8, n=73) (11.7, n=36) Median ratio of length to 1.4 ( ) width (n=100) (n=48) (n=73) (n=36) Ratio of cingulum width to ca ca ca cell length (n=27)
74 Table 2.3 (continued) 54 Features Azadinium cf. poporum Azadinium poporum Azadinium spinosum Azadinium obesum Displacement relative to ca. 0.5 ca. 0.5 ca. 0.5 cingulum width (n=27) Antapical spine N N Y N Pyrenoids (number) Y (>1?) Y (>1 2-4?) Y (1) N (0) Location of ventral pore Po a Po 1' 1' 1'' plate in contact with 1a Y Y Y N plate 1a and 3a plates large Y Y Y N Lower part of 1' plate N N N Y narrow 3' plate symmetry Antero-posterior and Antero-posterior axis Antero-posterior axis Antero-posterior axis lateral axes Azaspiracid production N N Y N References (1) (2) (2), (3) (4) a The ventral pore has been occasionally observed along the 1' plate References. 1 This study, 2 Tillmann et al. 2011, 3 Tillmann et al. 2009, 4 Tillmann et al. 2010
75 2.3). The AP length and width of the cells of A. cf. poporum (10-16 and 7-11 µm, respectively) are highly similar to the corresponding dimensions of A. poporum (11-16 and 8-12 µm, respectively). The median of the ratio of the AP length to width of A. cf. poporum (1.4) is also highly similar to that of A. poporum (1.3). The absence of an antapical spine, the presence of pyrenoids, the usual location of the ventral pore on the Po plate, the contact between the 1'' and 1a plates, the relative size of 1a and 3a plates in the anterior intercalary plate series, and the absence of a narrow portion in the lower part of the 1' plate are features shared by both A. cf. poporum and A. poporum (Table 2.3). However, the 3' apical plate is usually symmetric on the AP and lateral axes for A. cf. poporum, whereas it is only symmetric on the AP axis for A. poporum (Table 2.3 and Fig. 2.8). This feature allows distinction between the strains from Korean waters and the North Sea. Variations from the usual plate pattern were quite common in the cultured strain of A. cf. poporum. The number of plates was observed to vary in all plate series, beside the sulcal series. Individual variations in shape were observed for many plates, with the exceptions of the first apical plate, many precingular plates, and a few postcingular plates. A high variability in plate patterns seems to be a common feature of all Azadinium cultures so far (Tillmann et al. 2009, 2010, 2011). The observed variability for A. cf. poporum is higher than the variability of A. poporum described by Tillmann et al. (2011). However, it is unknown whether the presence and/or degree of variability is an inherited feature of the genus Azadinium, is distinct at the strain or species level or is simply a culture artifact. Clearly, detailed morphological investigations of field populations are needed to answer these questions. 55
76 Fig. 2.8 Comparison between the shape of the third apical plate of Azadinium cf. poporum from Korea (top) and Azadinium poporum from North Sea (bottom; from Tillmann et al. 2011). The nomenclature of Kofoid (1909) was used to describe the thecal plate tabulation. 56
77 2.6.3 Molecular characterization The Korean isolate revealed haplotypes of SSU rdna, ITS rdna, and LSU rdna not previously reported. The haplotypes of the previously described Azadinium species are similar, but they are distinct even if the species occur in the same geographical area. Moreover, the defined species are morphologically distinguishable. These observations suggest that each previously defined species is biologically distinct. The high stability of each haplotype observed when multiple strains were available (i.e. A. spinosum and A. poporum) further suggests distinct biological species. Therefore, the distinct haplotype from Korea might represent a recently diverged or new species or a different strain inhabiting a distinct geographical area. The position of A. cf. poporum is variable among DNA regions. The SSU rdna showed a close relationship between A. cf. poporum and A. poporum. The rate of evolution of the SSU rdna is much slower than that of the ITS rdna and the D1/D2 region of the LSU rdna. The relationships between species based on SSU rdna can therefore be misleading and analyses based on the ITS rdna and the LSU rdna are more likely to reveal proper relationships among Azadinium species. The ITS rdna region has been used before to infer phylogenetic relationships among strains of the same or closely related species. The relatively rapid divergence rates of the ITS rdna make this region useful for inferring genetic relationships at the inter and intraspecific level (Adachi et al. 1996, 1997, Coleman & Mai 1997, LaJeunesse 2001). This region has also been used to suggest the existence of cryptic species (Montresor et al. 2003). The genetic relationships 57
78 based on ITS rdna also reflected in some occasions biogeographical patterns (Montresor et al. 2003). Phylogenetic relationship based on LSU rdna have also shown to reflect biogeographical aspects (John et al. 2003). The ITS and LSU rdna depict the same relationships between species in the genus Azadinium including the variable position of A. cf. poporum. Strains from the same species from different biogeographical areas are expected to produce a monophyletic clade in phylogenetic analyses. This condition is not respected with A. poporum from North Sea and A. cf. poporum from Korea when the latter adopts a basal position among Azadinium species. The unstable position of A. cf. poporum and the occasional absence of monophyly between strains from different localities suggest that A. poporum and A. cf. poporum are recently diverged species Azaspiracids No trace of known AZAs was detected. However, both toxic and nontoxic species of the genus Azadinium are known to co-occur in the same geographical area. It is therefore likely that other species of the genus Azadinium could be present at proximity of Korea. The recent detection of AZAs in Japan (Ueoka et al. 2009) underscores the need to look further for the presence of other Azadinium species in Asia. On morphological grounds, the Korean isolate is apparently associated more closely with the species A. poporum described by Tillmann et al. (2011). However, differences in morphology, DNA sequences, and phylogenetic relationships, particularly those derived from the ITS rdna and the LSU rdna regions, led us to designate the Korean strain as A. cf. poporum. The characterization of further strains belonging to the genus Azadinium is likely to bring more reliable diagnostic 58
79 features that might help to stabilize the taxonomic position of A. cf. poporum. 59
80 Chapter 3: Azaspiracid New azaspiracids in Amphidomataceae (Dinophyceae) 3.1 Abstract Azaspiracids (AZAs) are a group of lipophilic polyether toxins implicated in incidents of shellfish poisoning in humans, particularly in northern Europe, which are produced by the small marine dinoflagellate Azadinium spinosum. Other related species/strains of the Amphidomataceae have not been proven to date to contain any of the known azaspiracids. Closer analyses of these species/strains by triple quadrupole mass spectrometry in the precursor and product ion mode now revealed a new compound with high similarity to azaspiracids, with a characteristic m/z 348 fragment but with absence of the m/z 362 fragment. This compound was detected in the Korean isolate of A. poporum (molecular mass: Da). Cell quota of roughly 2 fg per cell was in the same range as found for AZA-1 and -2 in A. spinosum. Structure for the compound was proposed by interpretation of fragmentation patterns and high resolution mass measurements using Fourier transform ion cyclotron resonance-mass spectrometry (FTICR-MS). 3.2 Keywords Azaspiracids, Azadinium poporum, LC-MS/MS, Phycotoxin 3.3 Introduction 60
81 Azaspiracids (AZAs) are a group of lipophilic polyether toxins at first associated with the diarrhetic shellfish poisoning (DSP) syndrome, based upon provisional epidemiological and etiological characteristics. AZAs consist of a sixmembered cyclic imine ring and like most polyketides of a linear carbon chain, which is cyclized at several points in the molecule by ether bridges (Satake et al. 1998b, Nicolaou et al. 2006). The first azaspiracid poisoning (AZP) event was recorded after eight people in the Netherlands became ill in November 1995 after consumption of mussels from the Irish west coast. Symptoms of the affected persons nausea, vomiting, severe diarrhea and stomach cramps were typical for DSP. The mouse bioassay for DSP toxicity was also strongly positive, however, the DSP toxins in the mussels (okadaic acid and dinophysistoxin-2) were present at only very low concentrations, and thus could not account for the observed severe intoxications (McMahon & Silke 1996). A few years after this unattributed toxic incident, the first member of a novel group of marine biotoxins designated as azaspiracid (AZA) was isolated and characterized from shellfish (as AZA-1) (Satake et al. 1998b) and later structurally revised (Nicolaou et al. 2006). Following confirmation of AZA-1 as the cause of human poisoning, other cases of intoxication from consumption of mussels from Ireland, France, and Italy were also unambiguously attributed to the AZP syndrome (James et al. 2000). Detailed global surveys on the biogeographical distribution of AZA toxins have not been conducted, but AZA-contaminated mussels have been found on the east coast of England and along the Norwegian west coast (Lehane et al. 2002). Reported AZA occurrences outside of northern European waters, include the coast of Portugal (Vale et al. 2008), Morocco (Taleb et al. 2006) and Chile (Álvarez et al. 2010), but monitoring of lipophilic phycotoxins in mussels from the White Sea, northern Russia did not reveal the presence of AZAs (Vershinin et al. 61
82 2006). So far, shellfish from areas outside Europe have not caused yet cases of human intoxication due to AZP. Although most research has focused on AZA-1 as the first discovered and most accessible AZA analogue, other structural variants have been isolated and characterized from shellfish (Ofuji et al. 1999, 2001, James et al. 2003a b). The current list comprises two dozen naturally occurring structural variants of AZA-1 (Rehmann et al. 2008) (Fig. 3.1), of which only AZA-1, AZA-2 and AZA-3 have been found in plankton samples (James et al. 2003a b), while all other variants were detected in shellfish and are regarded as shellfish metabolites. Recently an AZA producing organism was isolated (Krock et al. 2009) and identified as Azadinium spinosum Elbrächter et Tillmann (Tillmann et al. 2009). Several strains from the Scottish east coast, the Danish west coast, and the Irish west coast showed all similar toxin profiles consisting only of AZA-1 and AZA-2 (Salas et al. 2011). Subsequently, a number of new species of the genus Azadinium were described from the North Sea (Tillmann et al. 2010, 2011). Nevertheless, Azadinium species probably have a worldwide distribution. We now have a strain available from Korean coastal waters, which morphologically closely resembles A. poporum but in relation to their ITS and LSU rdna sequences differs considerably. This strain at present has been designated as A. cf. poporum (Potvin et al. 2012). No known AZAs were previously detected in A. cf. poporum (Potvin et al. 2012). However, we now detected a compound that shows fragmentation patterns with high similarities to those of AZAs. Here we summarize structural information of this new compound and propose its structure by mass spectrometric techniques. 62
83 Fig. 3.1 Structures of the fully structurally characterized azaspiracids AZA-1 to AZA-11. The m/z values are given for the [M+H] + ions. 63
84 3.4 Materials and methods Algal culture The alga was grown as described in detail by Potvin et al. (2012) for A. cf. poporum. A dense culture was sampled for cell counts (inverted microscope) and approx cells were harvested by centrifugation (15 min, x g). The cell pellet was stored at -20 C until use Toxin extraction and preparation The cell pellet was suspended in 300 µl acetonitrile, and subsequently transferred into a FastPrep tube containing 0.9 g of lysing matrix D (Thermo Savant, Illkirch, France). The sample was homogenized by reciprocal shaking at maximum speed (6.5 m s -1 ) for 45 s in a Bio101 FastPrep instrument (Thermo Savant, Illkirch, France). After homogenization, the sample was centrifuged (Eppendorf 5415 R, Hamburg, Germany) at x g at 4 C for 15 min. The supernatant (250 µl) was transferred to a 0.45 µm pore-size spin-filter (Millipore Ultrafree, Eschborn, Germany) and centrifuged for 30 s at 800 x g. The filtrate was transferred into an LC autosampler vial for LC-MS/MS analyses Multiple reaction monitoring (MRM) measurements Water was deionized and purified (Milli-Q, Millipore, Eschborn, Germany) to 18 MΩ cm -1 or better quality. Formic acid (90 %, p.a.), acetic acid (p.a.) and ammonium formate (p.a.) were purchased from Merck (Darmstadt, Germany). The solvents, methanol and acetonitrile, were high performance liquid chromatography (HPLC) grade (Merck, Darmstadt, Germany). 64
85 Mass spectral experiments were performed to survey for a wide array of AZAs. The analytical system consisted of an ABI-SCIEX-4000 Q Trap, triple quadrupole mass spectrometer equipped with a TurboSpray interface coupled to an Agilent model 1100 LC. The LC equipment included a solvent reservoir, in-line degasser (G1379A), binary pump (G1311A), refrigerated autosampler (G1329A/G1330B), and temperature-controlled column oven (G1316A). Separation of the AZA (5 µl sample injection volume) was performed by reverse-phase chromatography on a C8 phase. The analytical column (50 x 2 mm) was packed with 3 µm Hypersil BDS 120 Å (Phenomenex, Aschaffenburg, Germany) and maintained at 20 C. The flow rate was 0.2 ml min -1 and gradient elution was performed with two eluants, where eluant A was water and B was acetonitrile/water (95:5 v/v), both containing 2.0 mm ammonium formate and 50 mm formic acid. Initial conditions were 8 min column equilibration with 30 % B, followed by a linear gradient to 100 % B in 8 min and isocratic elution until 18 min with 100 % B then returning to initial conditions until 21 min (total run time: 29 min). AZA profiles were determined in one period (0-18) min under mass spectrometer conditions: curtain gas: 10 psi, CAD: medium, ion spray voltage: 5500 V, temperature: ambient, nebulizer gas: 10 psi, auxiliary gas: off, interface heater: on, declustering potential: 100 V, entrance potential: 10 V, exit potential: 30 V). MRM experiments were carried out in positive ion mode by selecting the following transitions (precursor ion > fragment ion): 1) AZA-1 and AZA-6: m/z 842 > 824 collision energy (CE): 40 V and m/z 842 > 672 (AZA-1 only) CE: 70 V), 2) AZA-2: m/z 856 > 838 CE: 40 V and m/z 856 > 672 CE: 70 V, 3) AZA-3: m/z 65
86 828 > 810 CE: 40 V and m/z 828 > 658 CE: 70 V, 4) AZA-4 and AZA-5: m/z 844 > 826 CE: 40 V, 5) AZA-7, AZA-8, AZA-9 and AZA-10: m/z 858 > 840 CE: 40 V, 6) AZA-11 and AZA-12: m/z 872 > 854 CE: 40 V and 7) new compound and their methyl esters 816 > 798 CE: 40 V, 816 > 348 CE: 70 V, 830 > 812 CE: 40 V, 830 > 348 CE: 70 V, 844 > 826 CE: 40 V 846 > 828 CE: 40 V, 846 > 348 CE: 70 V, 858 > 348 CE: 70 V, 860 > 842 CE: 40 V and 872 > 854 CE: 40 V Precursor ion experiments Precursors of the fragment m/z 348 were scanned in the positive ion mode from m/z 400 to 950 under the following conditions: curtain gas: 10 psi, CAD: medium, ion spray voltage: 5500 V, temperature: ambient, nebulizer gas: 10 psi, auxiliary gas: off, interface heater: on, declustering potential: 100 V, entrance potential: 10 V, collision energy: 70 V, exit potential: 12 V Product ion spectra Product ion spectra were recorded in the Enhanced Product Ion (EPI) mode in the mass range from m/z 150 to 860. Positive ionization and unit resolution mode were used. The following parameters were applied: curtain gas: 10 psi, CAD: medium, ion spray voltage: 5500 V, temperature: ambient, nebulizer gas: 10 psi, auxiliary gas: off, interface heater: on, declustering potential: 100 V, collision energy spread: 0, 10 V, collision energy: 70 V FTICR-MS measurements 66
87 Mass spectra were acquired with a Solarix 12T with Dual source Fourier transform ion cyclotron resonance-mass spectrometer (FTICR-MS; Bruker Daltonik GmbH, Bremen, Germany) equipped with a 12 T refrigerated actively shielded superconducting magnet (Bruker Biospin, Wissembourg, France) and Infinity ICR analyzer cell. The sample was ionized using a dual ion source in electrospray positive ion mode (Bruker Daltonik GmbH, Bremen, Germany). The sample solution was continuously infused using a syringe at a flow rate of 2 µl min -1. The detection mass range was set to m/z Ion accumulation time was set to 0.1 s. Data sets were acquired with 4 MW data points resulting in a resolving power of at m/z 400. Spectra were zero-filled to process size of 8M data points before sine apodization. Mass spectra were calibrated with arginine cluster using a linear calibration. A 10 µg ml -1 solution of arginine in 50 % methanol was used to generate the clusters. For MS/MS experiments accumulation time was up to several seconds, the isolation window was 0.5 Da and collision energy set to 30 ev Methylation of AZAs 50 µl of a 2 M ethereal solution of trimethylsilyl diazomethane (TMSDM, Sigma-Aldrich, Steinheim, Germany) were added to 50 µl sample extract. The mixture was vortexed every 5 min for half an hour. Subsequently 5 µl acetic acid (100 %, Merck KGaA, Darmstadt, Germany) were added and the sample was vortexed again. The sample was taken to dryness in a gentle nitrogen stream and taken up again in 50 µl methanol prior to LCMS analyses. 67
88 3.5 Results and discussion A MRM scan of the Korean strain of A. cf. poporum revealed a peak at the ion trace m/z 858 > 840, which is characteristic for AZA-7, -8, -9 and -10 (Fig. 3.1). However, this finding was unexpected because these AZAs are regarded as shellfish metabolites and not as original phycotoxins as they are found in shellfish (McCarron et al. 2009) but they could not be detected by passive water samplers in environmental samples (Fux et al. 2009, Rundberget et al. 2009) and in planktonic samples (Krock et al. 2009). Consequently we recorded a product ion spectrum of the compound (Fig. 3.2) and found very similar fragment clusters as in AZA-1, but clearly not identical with those of AZA-7, -8, -9 and -10 (Rehmann et al. 2008). All fragment clusters of AZA-1 were present in the spectrum of the new compound, but shifted 14 mass units to lower masses. The estimated cell quota of the new compound is in the same order of magnitude as of AZA-1 and -2 in A. spinosum, namely 2 fg cell -1 (estimated as AZA-1 equivalent). A common structural element of all AZAs is a free carboxylic group at the end of the side chain (Fig. 3.3). In order to prove the presence of carboxylic groups in the new compound, we treated the extracts with trimethylsilyl diazomethane (TMSDM), which is a specific methylation reagent for carboxylic groups. After TMSDM treatment the ion traces of the compound disappeared and peaks at 14 Da higher masses and longer retention times appeared instead, which is consistent with methylation (Fig. 3.4). By this experiment the presence of a carboxylic group in the compound could be corroborated. CID mass spectra of AZAs are characterized by cleavages at certain points of the polyketide chain and subsequent water losses of each of these fragments, so 68
89 Fig. 3.2 Product ion scan of AZA-1 (m/z 842) (top) and the compound (m/z 858) (bottom) 69
90 Fig. 3.3 Structure of AZA-1 and CID cleavage sites Fig. 3.4 Ion traces of the [M + H] + ion masses of the compound and the corresponding methylated compound 70
91 that each chain cleavage results in a fragment cluster with m/z 18 differences. Main cleavages of AZAs include a pseudo Retro-Diels-Alder reaction (RDA) of ring A of the molecule (Rehmann et al. 2008) resulting in a simultaneous cleavage between C6 and the A-ring O and C9 and C10, respectively. The remaining fragment is detected at m/z 672 in the case of AZA-1. Other characteristic cleavages are between C18 and C19 resulting in m/z 462, a second pseudo RDA of ring E resulting in m/z 362, the cleavage between C27 and C28 (m/z 262) and another pseudo RDA of ring G resulting in m/z 168 (Fig. 3.3). All known AZAs show these fragmentation patterns (Brombacher et al. 2002, Rehmann et al. 2008). These fragmentation patterns are also observed in the compound with the only difference that fragment groups 3 6 are shifted to 14 Da smaller m/z values (Table 3.1). The CID spectra of the compound will be discussed in more detail. The molecular ion [M+H] + of the compound is m/z 858 (Fig. 3.2), which is 16 Da more than that of AZA-1. FTICR-MS results in a molecular formula of C 47 H 71 NO 13 with 13 double bond equivalents (Koch & Dittmar 2006) for the compound, which confirms this assumption (Table 3.1). Group 2 fragment (Fig. 3.3) of the compound is m/z 658 and all other fragments are 14 Da smaller than the corresponding group 2-6 fragments of AZA-1. This means that a methyl (or methylene) group is missing in the part of the molecule consisting of ring H and I. This methyl (or methylene) group instead must be located at carbon atoms 2-9 of the carboxylic side chain and part of ring A. Furthermore, the presence of an additional oxygen atom could be also deduced from the molecular formula. But there is another obvious difference between the CID spectra of AZA-1 and the compound: whereas the [M+H] + peak of AZA-1 shows only 5 subsequent 71
92 Table 3.1 Exact masses of [M +H] + ions and characteristic group fragments of AZA-1 and the compound 72 Group 1 Group 2 Group 3 Group 4 Group 5 Group 6 AZA-1 m/z Composition C 47 H 72 NO 12 C 38 H 58 NO 12 C 27 H 44 NO 5 C 22 H 36 NO 3 C 16 H 24 NO 2 C 10 H 18 NO Compound Observed Composition C 47 H 72 NO 13 C 37 H 56 NO 9 C 26 H 42 NO 5 C 23 H 34 NO 3 C 15 H 22 NO 2 C 9 H 16 NO ±ppm Note that there is no consistent fragment group numbering in the literature
93 water losses, the [M+H] + ion cluster of the compound is more complex (Fig. 3.5 A). Besides the water losses of the [M+H] + ion there is an additional loss of CO 2 (mass difference of m/z 44) followed by water losses, which is not observed in any of the known AZAs. The fact that the compound eliminates CO 2 under CID conditions, but known AZAs do not, is strong evidence that chemistry in close vicinity of the carboxylic function of the compound differs in relation to the known AZAs. Another interesting difference in the molecular ion cluster of the compound is the mass difference of m/z 78 also followed by water losses, which is also unique for the compound and absent in all described AZAs to date. FTICR-MS measurement of fragment [M+H] + gave a mass formula of C 45 H 66 NO 10, which represents a difference of C 2 H 6 O 3. Such unusual fragments have been observed for the CID of hexoses without any further interpretation (Zhu & Sato 2007). The elimination of a fragment C 2 H 6 O 3 cannot easily be explained. However, with an additional hydroxyl group at C2 and a methyl group at C3, a cyclic transition state can be postulated, which could be stabilized by a simultaneous elimination of a molecule of water and a C 2 H 4 O 2 unit under formation of an allylic system (Fig. 3.6) and thus explain the m/z 78 mass difference. In summary, the compound is proposed to be a 37- or 39- demethyl variant of AZA-1 with an additional hydroxyl group at C2 and an additional methyl group at C3 of the carboxylic side chain (Fig. 3.7). However, the location of these substitutions as well as the site of demethylation cannot unambiguously be assigned by MS alone, but needs confirmation by nuclear resonance spectroscopy (NMR). Very little is known about the biosynthesis of AZAs by marine plankton. However, in analogy to other polyketides like spirolides (Kalaitzis et al. 2010) it is assumed that an amino acid, which delivers the amine nitrogen, is prolonged by polyketide synthases via the addition of acetic acid units to form a linear carbon 73
94 Fig. 3.5 Enlargements of the [M+H] + ion clusters of the product ion spectrum of the compound. m/z values in lined boxes belong to the water loss series, m/z values in dashed boxes belong to the CO 2 loss series and m/z values in dotted boxes belong to the C 2 H 6 O 3 loss series. Fig. 3.6 Proposed fragmentation scheme for the elimination of C 2 H 6 O 3 from the compound 74
95 Fig. 3.7 Structure of AZA-1 (left) and proposed structure for the compound (right); R 1 = H and R 2 = CH 3 or R 1 = CH 3 and R 2 = H 75
96 chain, which is subsequently cyclized by the formation of ether bridges (MacKinnon et al. 2006). Interestingly, AZA-1 and AZA-2, which are to date the only two AZAs known to be produced by phytoplankton, differ only in a methyl group at C8 in the upper part of the molecule. The same applies to the new compound, whose lower parts with the cyclic imine function and E-I ring system are highly conserved and modifications only occur in the upper part (carboxylic side chain and A-C ring system) of the molecule between C2 and C14. The only exception is the missing methyl group at C37 or C39 of the compound in comparison to the known AZAs. Even though mass spectrometry alone in most cases is not sufficient for complete structural elucidation of new compounds, thorough analysis of CID spectra, especially in combination with high resolution mass measurements and comparison to spectra of related compounds with known structures, delivers useful structural information, which allows for the prediction of structural elements of unknown compounds with low uncertainty or variability of structural variants. The state-of-the-art method for full structural elucidation is NMR spectroscopy. However, unlike mass spectrometry, which is orders of magnitude more sensitive and can operate with raw extracts, NMR requires fully purified material in the µg to mg range. This is a big challenge for the examination of planktonic secondary metabolites in general, but especially for metabolites of small dinoflagellates like Azadinium spp. which contain AZAs in the lower fg cell -1 range. The isolation of sufficient material for NMR analyses requires the production, extraction and purification of several hundreds of liters of algal cultures. This effort will be subject of future work for the full characterization of the compound. Another open question remains the toxicity of the new AZA. It is reasonable to assume that the 76
97 new AZA provokes comparable cellular responses and human illness as the known AZAs due to their high structural similarity, but this has to be tested empirically. As NMR measurements and toxicity tests require pure compound in high amount, the strategy to address these questions will be to collect and purify enough material for NMR measurements. After NMR the same material will be used for toxicity assays. 77
98 Chapter 4: Predation Feeding by heterotrophic protists and copepods on the photosynthetic dinoflagellate Azadinium cf. poporum from western Korean waters 4.1 Abstract We explored the interactions between the photosynthetic dinoflagellate Azadinium cf. poporum isolated from Korean waters and potential predators, including engulfment feeders, a pallium feeder, peduncle feeders, and filter feeders. We measured the growth and/or ingestion rates of Oxyrrhis marina, Strobilidium sp., and Acartia spp. on A. cf. poporum as a function of prey concentrations. We also calculated grazing coefficients by using field data on abundance of Strobilidium sp.-sized naked ciliates co-occurring with A. cf. poporum and laboratory data on ingestion rates obtained in this study. Most of the tested organisms were able to feed on A. cf. poporum, but only O. marina, Strobilidium sp., and Acartia spp. showed sustained growth and/or ingestion on A. cf. poporum. Thus, some heterotrophic dinoflagellates using engulfment and filter feeders, such as ciliates and copepods, are likely to be optimal predators, while peduncle-feeding heterotrophic dinoflagellates are unlikely to efficiently feed due to the handling of the theca. The predators had low ratios of maximum growth rate to maximum ingestion rate on A. cf. poporum, as well as low gross growth efficiencies. Therefore, A. cf. poporum appears to be a low-quality prey for the predators tested. Grazing coefficients ranged between and d 1, suggesting that Strobilidium sp.-sized naked ciliates may sometimes have a high impact on A. cf. poporum populations, leading to the removal of up to 36 % of the population in 1 d. However, the low quality of the prey and predator 78
99 selectivity in a more complex microbial community may reduce this impact. 4.2 Keywords Azadinium, Azaspiracids, Toxins, Seasonal dynamics, Grazing, Predation, Ingestion, Growth 4.3 Introduction The azaspiracids (AZAs) are the most recently discovered group of lipophilic marine biotoxins of microalgal origin associated with cases of shellfish poisoning in humans (Twiner et al. 2008). The production of AZAs was previously associated with a small photosynthetic dinoflagellate (Krock et al. 2009), designated as Azadinium spinosum Elbrächter et Tillmann and assigned to a new genus (Tillmann et al. 2009). The genus Azadinium is now composed of 4 well defined species, namely A. spinosum Elbrächter et Tillmann (Tillmann et al. 2009), A. obesum Tillmann et Elbrächter (Tillmann et al. 2010), A. poporum Tillmann et Elbrächter (Tillmann et al. 2011), and A. caudatum (Halldal) Nézan et Chomérat (Nézan et al. 2012). Undefined species were also described as A. cf. poporum (Potvin et al. 2012) and A. cf. spinosum (Akselman & Negri 2012). Until recently, A. spinosum was the only known planktonic source of AZAs. However, new AZAs have since been discovered in A. poporum, A. cf. poporum, and the closely related species Amphidoma languida Tillmann, Salas et Elbrächter (Krock et al. 2012, Tillmann et al. 2012b). A. obesum and A. caudatum are the only members of the genus Azadinium established in culture for which no AZA has been detected. While the AZAs produced by A. spinosum have been shown empirically to be toxic (Ito et al. 2002, Román et al. 2002, Colman et al. 2005, Twiner et al. 2005, 79
100 Alfonso et al. 2006, Kulagina et al. 2006, Vale et al. 2007), research is pending for the new AZAs. The population dynamics of the species of the genus Azadinium are not well known. These species apparently seem to either remain at low density, such as A. caudatum, which was not observed to exceed 1.3 cells L 1 (Nézan et al. 2012), or are able to bloom (e.g. A. cf. spinosum) and can reach up to cells ml 1 (Akselman & Negri 2012). Grazing pressure sometimes plays an important role in population dynamics (Watras et al. 1985). Heterotrophic dinoflagellates (HTDs), ciliates, and copepods are integral parts of marine planktonic food webs (Jeong et al. 2010a). HTDs and ciliates can be found everywhere and can sometimes dominate in abundance and/or biomass, while copepods can similarly dominate the mesozooplankton (Brownlee & Jacobs 1987, Lessard 1991, Jeong 1999, Turner et al. 2005). These 3 groups sometimes have considerable grazing impact on populations of diverse prey (Painting et al. 1993, Strom et al. 1993, Sherr & Sherr 2007). In particular, grazing by heterotrophic protists is believed to contribute to the decline of blooms (Kim & Jeong 2004). In order to investigate grazing pressure by predators, growth and ingestion need to be studied. No study extensively exploring predation on species of the genus Azadinium is currently available. In order to determine which predators are more likely to grow and feed actively on Azadinium spp., we explored feeding of HTDs (Polykrikos kofoidii, Gyrodinium dominans, G. moestrupii, Oxyrrhis marina, Oblea rotunda, Stoeckeria algicida, Pfiesteria piscicida, and Gyrodiniellum shiwhaense), a ciliate (Strobilidium sp.) and the copepods Acartia spp. on Azadinium cf. poporum. We 80
101 found that O. marina, Strobilidium sp., and Acartia spp. fed well on A. cf. poporum. Therefore, we measured their growth and/or ingestion rates on A. cf. poporum as a function of prey concentration. Furthermore, we calculated grazing coefficients by using field data on abundance of Strobilidium sp.-sized naked ciliates co-occurring with A. cf. poporum and laboratory data on ingestion rate obtained in this study. Our results provide a basis for understanding interactions between Azadinium spp. and common heterotrophic protists and copepods. 4.4 Materials and methods Preparation of experimental organisms For the isolation and culture of Azadinium cf. poporum (GenBank accession number = FR877580), surface sediment samples from Shiwha bay, a highly eutrophic saline bay in Korea (37 18' N, ' E), were incubated in F/2 medium-si (Guillard & Ryther 1962) in a growth chamber at 20 C under an illumination of 20 μe m 2 s 1 of cool white fluorescent light on a 14:10 h light: dark cycle. The monoclonal culture was established as described in detail by Potvin et al. (2012). For the isolation and culture of potential protistan predators, plankton samples collected with water samplers were taken from the Korean coastal waters off Shiwha, Masan, Saemankeum, Karorim, and Jinhae between 2007 and 2011 (Table 4.1). A clonal culture of each predator was established as in Kim & Jeong (2004), Jeong et al. (2003a b, 2005c, 2006, 2011a), Kang et al. (2011), and Yoon et al. (2012). Oblea rotunda was brought into culture as Gyrodinium spp. in Kim & Jeong (2004; Table 4.1). The cultures were maintained on a wheel rotating at 0.9 rpm in a growth chamber at 20 C under an illumination of 20 μe m 2 s 1 of cool 81
102 82 Table 4.1 Isolation and maintenance conditions of the experimental organisms. Sampling location in Korea and time, field water temperature (T, C), and salinity (S) from which species were isolated, and prey species and concentrations (cells ml 1 ) for maintenance. All organisms are heterotrophic dinoflagellates, except Strobilidium sp., a ciliate Organism Location Year T S Prey species Concentration (month) Gyrodiniellum Shiwha bay 2009 (09) Amphidinium carterea shiwhaense Gyrodinium dominans Masan bay 2007 (04) Amphidinium carterea 8000 Gyrodinium moestrupii Saemankeum bay 2009 (10) Alexandrium minutum Oblea rotunda Shiwha bay 2010 (08) Prorocentrum minimum Oxyrrhis marina Karorim 2010 (05) Amphidinium carterea 8000 Pfiesteria piscicida Jinhae 2010 (02) Amphidinium carterea Polykrikos kofoidii Shiwha bay 2010 (03) Scrippsiella trochoidea 8000 Stoeckeria algicida Masan bay 2007 (08) Heterosigma akashiwo Strobilidium sp. Shiwha bay 2011 (08) Heterocapsa rotundata
103 white fluorescent light on a 14:10 h light: dark cycle. Fresh prey cells were provided every 1 to 3 d. The copepods Acartia spp. were collected from Kunsan port with a 303 μm mesh net in May 2011 when water temperature and salinity were 16.8 C and 18.9, respectively. The copepods were acclimated in a room at 20 C, with Prorocentrum minimum provided as prey. Species of the genus Acartia, which co-occur in coastal waters off western Korea, can be very similar and impossible to distinguish from each other when they are alive (e.g. Soh & Suh 2000). Therefore, we had to use a mixture of adult Acartia spp. The mean equivalent spherical diameter (ESD) of live Azadinium cf. poporum was measured (ESD = 10.0 μm) by an electronic particle counter and size analyzer (model Z2, Beckman Coulter). The shape of a sphere was used to estimate the volume of A. cf. poporum based on the ESD. Oxyrrhis marina and Strobilidium sp. were measured in order to estimate their volume in the different predator-prey combinations at the end of the incubation. Measurements were made with specimens fixed in 5 % acid Lugol s solution using a transmitted light inverted microscope (Zeiss Axiovert 200M, Carl Zeiss) at a magnification of 400x with a Zeiss AxioCam MRc5 digital camera (Carl Zeiss). The shape of O. marina was estimated as 2 cones joined at their bases. The shape of Strobilidium sp. was estimated as a sphere, cylinder, or cone depending of the shape of the specimen. Carbon content was estimated from the cell volume according to Menden-Deuer & Lessard (2000) Feeding 83
104 Expt 1 was designed to test whether Polykrikos kofoidii, Gyrodinium dominans, G. moestrupii, Oxyrrhis marina, Oblea rotunda, Stoeckeria algicida, Pfiesteria piscicida, Gyrodiniellum shiwhaense, Strobilidium sp., and Acartia spp. were able to feed on Azadinium cf. poporum (Table 4.2). Azadinium cf. poporum ( cells ml 1 final concentration) was added to 80 ml polycarbonate (PC) bottles, followed by the addition of each of the other HTDs (100 to 3000 cells ml 1 final concentration), the ciliates (20 cells ml 1 final concentration), or the copepods (0.025 ind. ml 1 final concentration). Duplicates were established for each predator put into contact with A. cf. poporum. One control bottle (without prey) was set up for each experiment. The bottles were placed on a plankton wheel rotating at 0.9 rpm in a growth chamber at 20 C under an illumination of 20 μe m 2 s 1 of cool white fluorescent light on a 14:10 h light: dark cycle. Aliquots (5 ml) were removed from each bottle after 1, 2, 6, and 24 h of incubation and then transferred into 6-well plate chambers or onto microscopic slides. Approximately 200 cells of each predator were observed using a transmitted light inverted microscope (Zeiss Axiovert 200M, Carl Zeiss) at a magnification of 100x to 630x to determine whether the predators were able to feed on Azadinium cf. poporum. Cells of predators containing ingested A. cf. poporum cells were photographed using a Zeiss AxioCam MRc5 digital camera at a magnification of 630x. To confirm the absence of prey ingestion, higher prey concentrations were provided. 84
105 85 Table 4.2 Experimental design to assess predation by various planktonic predator species on the prey species Azadinium cf. poporum. The numbers in prey and predator columns are the actual initial concentrations (cells or ind. ml 1 ) of prey and predator. In each experiment, the lowest A. cf. poporum concentration was tested against the lowest predator concentration, the next lowest against the next lowest, etc. Values within parentheses in the prey and predator columns are the corresponding prey and predator concentrations in the predator-only control bottles. Feeding occurrence of each predator on A. cf. poporum in Expt 1 is represented by Y (feeding observed) or N (no feeding observed) Expt Prey concentration Species Predator concentration Feeding Gyrodiniellum shiwhaense 1000 Y Gyrodinium dominans 500 Y Gyrodinium moestrupii 500 Y Oblea rotunda 500 N Oxyrrhis marina 3000 Y Pfiesteria piscicida 3000 Y Polykrikos kofoidii 100 N Stoeckeria algicida 1000 N Strobilidium sp. 20 Y Acartia spp Y 2 44, 282, 1223, 2991, 9600, (0) Oxyrrhis marina 5, 12, 24, 36, 53, 106 (7, 261) 3 62, 558, 2415, 5536, , , Strobilidium sp. 6, 6, 6, 15, 13, 13, 29 (7, 28) (0) 4 52, 151, 492, 1895, 6553, , (0) Acartia spp. 0.02, 0.02, 0.02, 0.02, 0.02, 0.02, 0.02 (0.02)
106 4.4.3 Growth, ingestion, and gross growth efficiency Expts 2 and 3 were designed to measure the growth and ingestion rates of Oxyrrhis marina and Strobilidium sp. as a function of the prey concentration when fed on Azadinium cf. poporum (Table 4.2). Only this HTD and this ciliate were shown to feed and to have sustained growth on A. cf. poporum among the protists tested. Two weeks before the experiments were conducted, dense cultures of Oxyrrhis marina and Strobilidium sp. growing on algal prey listed in Table 4.1 were transferred into 500 ml PC bottles containing Azadinium cf. poporum (ca cells ml 1 final concentration). These predator cultures were transferred to 500 ml PC bottles of fresh prey (ca cells ml 1 final concentration) every 1 to 3 d. The bottles were filled to capacity with freshly filtered seawater, capped, and placed on plankton wheels rotating at 0.9 rpm and incubated under the conditions described above. To monitor the conditions and interactions between the predator and prey species, the cultures were periodically removed from the rotating wheels, examined through the surface of the capped bottles by using a stereomicroscope (Olympus, SZX-12), and then returned to the rotating wheels. Once the target prey cells in ambient water were no longer detectable, predators were routinely inspected until the prey cells were no longer observed in the cytoplasm. This was carried out to minimize possible residual growth resulting from the ingestion of prey during batch culture. Once the predators were starved, the cultures were then used to conduct the experiments. For each experiment, the initial concentrations of protists were established using an autopipette to deliver predetermined volumes of known cell 86
107 concentrations to the bottles. Triplicate 42 ml (for the HTD) or 80 ml (for the ciliate) experimental bottles (mixtures of predator and prey) and triplicate control bottles (prey only) were set up for each predator-prey combination. Triplicate control bottles containing only predators were also established at 2 predator concentrations. F/2 medium-si (5 ml for the HTD, 10 ml for the ciliate) was added to all PC bottles. To obtain similar water conditions, the water of the predator culture was filtered through a 0.7 μm GF/F filter and then added to the prey control bottles in the same amount as the volume of the predator culture added to the experiment bottles for each predator-prey combination. Culture of Azadinium cf. poporum was filtered and added to the predator control bottles in the same way as for the prey control bottles. All bottles were then filled to capacity with filtered seawater and capped. To determine the actual protist concentrations at the beginning of the experiment, a 5 or 6 ml aliquot was taken from each bottle for the HTD and ciliate, respectively. The bottles were refilled to capacity with freshly filtered seawater, capped, and placed on rotating wheels under the conditions described above. Dilution of the cultures associated with refilling was considered when calculating growth and ingestion rates. Another aliquot of the same volume as before was taken from each bottle after 48 or 24 h for the HTD and ciliate, respectively. The aliquots were fixed with 5 % acid Lugol s solution (final concentration). The abundances of predator and prey were determined by counting all or >300 cells in 3 Sedgwick-Rafter chambers (SRCs, 1 ml). The conditions of the predator and its prey were assessed using a stereomicroscope as described above before subsampling. Expt 4 was designed to measure only the ingestion and clearance rates of Acartia spp. on Azadinium cf. poporum as a function of the prey concentration (Table 4.2). Adult female Acartia spp. were used. 87
108 The initial concentration of Acartia spp. was determined by the individual transfer of the copepods using a Pasteur pipette with a stereomicroscope (Olympus, SZX-12). Triplicate 500 ml experimental bottles (mixtures of predator and prey) and triplicate control bottles (prey only) were set up for each predator-prey combination. Triplicate control bottles containing only predators were also established at 1 predator concentration. F/2 medium-si (50 ml) was added to all PC bottles. To obtain similar water conditions, the same procedures described above were followed. Furthermore, the actual protist concentrations at the beginning and end of the experiment were determined as before by taking a 10 ml aliquot. The final concentration of Acartia spp. was determined by direct counting with a stereomicroscope (Olympus, SZX-12). The specific growth rate of predators, µ (d 1 ), was calculated as: µ = [Ln (P t /P 0 )]/t (1) where P 0 and P t are the concentrations of predators at 0 and 48 h for the HTD, and at 0 and 24 h for the ciliate, and t is the time elapsed during the experiment. Growth rates were fit to the Michaelis-Menten model (Michaelis & Menten 1913). The equation for growth rate data is: µ = µ max (X X')/[K GR +(X X')] (2) 88
109 where µ max is the maximum growth rate (d 1 ); X is the prey concentration (cells ml 1 or ng C ml 1 ), X' is the threshold prey concentration (the prey concentration where µ = 0), K GR is the prey concentration sustaining half of µ max. Data were iteratively fitted to this regression type using DeltaGraph (Delta Point) and the Levenberg-Marquardt algorithm, which minimizes the sum of squares of differences between the dependent variables in the equation and the observed data. Ingestion and clearance rates were calculated using the equations of Frost (1972) and Heinbokel (1978). The incubation times for calculating ingestion and clearance rates were the same as those for estimating growth rates. The data on the ingestion rates were fit to the Michaelis-Menten model or a simple linear regression model depending of the functional response. The Michaelis-Menten equation for ingestion rate (IR) data is: IR = I max (X)/[K IR +(X)] (3) and the simple linear regression equation is: IR = C1(X) + C2 (4) where I max is the maximum ingestion rate (cells predator 1 d 1 or ng C predator 1 d 1 ); X is the prey concentration (cells ml 1 or ng C ml 1 ), K IR is the half saturation constant (the prey concentration sustaining half of I max ), and C1 and C2 are constants. 89
110 Gross growth efficiency (GGE), defined as predator biomass produced (+) or lost ( ) per prey biomass ingested, was calculated from estimates of carbon content per cell based on cell volume for each mean prey concentration Field data Water samples were obtained at least at monthly intervals in ice-free conditions from January 2009 to December 2011 in Shiwha bay, Korea, at different stations from the surface and 1 m above the bottom (Fig. 4.1). To quantify cells based on optical microscopy, samples were fixed with 5 % acid Lugol s solution (final concentration) and used to determine the abundance of Oxyrrhis marina and Strobilidium sp.-sized naked ciliates. Azadinium cf. poporum cannot be differentiated easily from species of its own genus and other species highly similar morphologically based on optical microscopy. Therefore, qpcr (quantitative polymerase chain reaction) was used to estimate its concentration in the field. Field samples were concentrated by the filtration of 100 ml of seawater with a 25 mm GF/C glass microfiber filter (Whatman ) and immediately frozen on dry ice. Filters were subsequently stored at -20 C until further processing. Fixed field samples were settled for 48 h. They were then concentrated by gently removing the surface water. To determine the concentration of Oxyrrhis marina and Strobilidium sp.-sized naked ciliates, an aliquot was removed from each concentrated field sample and examined with a compound microscope to determine their abundances by enumerating the cells in three 1 ml SRCs. The protists were enumerated at 40x to 200x magnification. 90
111 Fig. 4.1 Shiwha bay, Korea, and fixed stations where water samples were collected. Surface water samples used for protistan determination and qpcr were taken at every station, while bottom water samples were only taken at stations represented by enlarged circles. 91
112 After the filters stored at -20 C had defrosted, cells were resuspended by adding TE buffer (Tris HCl ph mm, EDTA 1 mm, Bioneer) and grinding the filters in 2 ml tubes (GenePole). The suspension was subsequently boiled at 100 C for 5 min and cooled at room temperature for 20 min. We added 850 μl of 25:24:1 phenol: chloroform: isoamyl alcohol (Bioneer) and mixed by vortexing. The samples were subsequently centrifuged (Hanil Science, model MICRO 17TR) at x g (30 min at 20 C). The supernatant was transferred to a DNA binding column (Bioneer) and subsequently centrifuged at 2250 g (1 min at 20 C). We then added 700 μl of 99.5 % ethanol (Merck) at -20 C and 30 μl 3M sodium acetate (ph 7.0, Bioneer) to the binding column. The mixture was subsequently incubated at 20 C for 1 h. The mixture was then centrifuged at 2250 g (1 min at 4 C). The pellet was then washed twice by the addition of 70 % ethanol (Merck) followed by centrifugation at 2250 g (1 min at 4 C). The pellet contained in the binding column was subsequently dried at 50 C for 1 h. TE buffer (200 μl) was added to the binding column. The binding column was left to stand for more than 10 min in order to resuspend the DNA. Finally, the binding column was centrifuged at 1440 g (5 min) followed by g (5 min). The crude extracts and 1:10 dilutions were stored at -20 C until further use in qpcr assays. A preliminary survey was done with the undiluted and diluted extracts for each sample collected. Each positive assay of this survey was measured in triplicate. The design of the primers and the probe was based on the ITS rdna region sequences of all species of the genus Azadinium available from GenBank. Sequences were aligned using the program Clustal X2 (Larkin et al. 2007). Manual searches of the alignment were conducted to determine unique sequences and to develop an A. cf. poporum specific qpcr assay. The primers and probe sequences as well as their general properties were determined with Primer 3 (Rozen & 92
113 Skaletsky 2000). Their secondary structures were analyzed with OligoCalc (Kibbe 2007). Subsequently, the primers and probe were synthesized by Biosearch Technologies (Novato, CA). The probe was dual-labeled with the fluorescent dye FAM and the BHQ-1 quencher at the 5' and 3' ends, respectively. The sequences of the primers and probe were checked against published sequences in GenBank by BLAST homology search. BLAST searches showed that the sequences of the selected primers and probe matched only with the sequences of A. cf. poporum. The specificity was further assessed with the DNA from 22 dinoflagellate cultures (Table 4.3) extracted as in Potvin et al. (2012). Agarose gel analysis of the PCR products showed only amplicons of the expected size (94 bp) for A. cf. poporum and no product for other species. qpcr experiments showed that the primers-probe set was specific to the target for which it was designed. To achieve optimal performance, series of primers and probe concentrations as well as annealing-extension times and temperatures were tested by qpcr assays. The tested primers and probe concentrations ranged from 200 to 1000 and 100 to 500 nm, respectively. The tested annealing-extension times and temperatures ranged from 45 to 85 s and 56 to 64 C, respectively. The conditions that provided the lowest cycle threshold (CT) value and the highest fluorescence were selected. PCR assays were performed on a Rotor-Gene 6000 (Corbett Research). The following reagents were added in the reaction mixture: 5 μl of 2x SensiMix II Probe (GenePole), forward (5'-GGG AAC CTT CGC ATC AAT CAA C-3') and reverse (5'-CAC GAA GCA GCC TTG GGT TT-3') primers each at a final concentration of 0.2 μm, probe (5'-TGA GTG TCT TTG ATA CCA TCT GTT GCA-3') at a final concentration of 0.15 μm, l μl of template DNA, and nucleasefree water (GenePole) to a final volume of 10 μl. The thermal cycling 93
114 94 Table 4.3 Isolation conditions of the dinoflagellates used in the qpcr specificity test. Sampling location and time, field water temperature (T, C), and salinity (S) are shown. na: not available Dinoflagellate Location Year (month) T S Azadinium cf. poporum Shiwha bay, Korea 2010 (06) 24.1 a 26.7 a Bysmatrum caponii Karorim, Korea 2010 (05) Cryptoperidiniopsis brodyi Pamlico River, USA 1992 (07) na na Dinophysis acuminata Masan bay, Korea 2005 (12) na na Gymnodinium aureolum Kunsan, Korea 2008 (03) Gymnodinium simplex Shiwha bay, Korea 2009 (09) Gyrodiniellum shiwhaense Shiwha bay, Korea 2009 (09) Gyrodinium moestrupii Saemangum bay, Korea 2009 (10) Heterocapsa rotundata Kunsan, Korea 2002 (05) Heterocapsa triquetra Masan bay, Korea 2008 (06) Karenia brevis Gulf of Mexico, USA 1999 (09) na na Karlodinium veneficum Shiwha bay, Korea 2011 (08) Oxyrrhis marina Karorim, Korea 2010 (05) Paragymnodinium shiwhaense Shiwha bay, Korea 2006 (05) Pfiesteria piscicida Jinhae, Korea 2010 (02) Prorocentrum donghaiense Jeju, Korea 2010 (06) na na
115 95 Table 4.3 (continued) Dinoflagellate Location Year (month) T S Prorocentrum micans Shiwha bay, Korea 2009 (10) Prorocentrum minimum Shiwha bay, Korea 2009 (01) Scrippsiella precaria Shiwha bay, Korea 2009 (06) Scrippsiella sweeneyae Masan bay, Korea 2009 (08) Stoeckeria algicida Masan bay, Korea 2007 (08) Woloszynskia cincta Shiwha bay, Korea 2009 (06) a Isolated from sediment
116 conditions consisted of 10 min at 95 C followed by 50 cycles of 10 s at 95 C and 65 s at 60 C. Fluorescence data were collected at the end of each cycle, and determination of the cycle threshold line was carried out automatically by the instrument. PCR products that were positive were further analyzed by gel electrophoresis to confirm the amplicon size. Three samples that gave positive qpcr results were reamplified without the probe. The PCR products were purified using the AccuPrep PCR purification kit (Bioneer) according to the manufacturer s instructions. The purified DNA was sent to the Genome Research Facility (School of Biological Science, Seoul National University, Korea) and sequenced with an ABI PRISM 3700 DNA Analyzer (Applied Biosystems). All sequences obtained corresponded to Azadinium cf. poporum. A standard curve using cell numbers was constructed from Azadinium cf. poporum culture. Cell numbers ( cells) were estimated by counting 3 SRCs, and genomic DNA was extracted the same way as for the field samples. Ten-fold serial dilutions of the DNA extract were used to construct the standard curve. A strong linear relationship between the CT values and the log of the cell numbers was established, with a correlation coefficient (r 2 ) of The cell number of A. cf. poporum in field samples was determined from CT values and comparison with the standard curve Grazing impact We calculated grazing coefficients by using field data on the abundance of Strobilidium sp.-sized naked ciliates (25 to 60 μm in length) co-occurring with Azadinium cf. poporum and laboratory data on ingestion rate. We assumed that the 96
117 ingestion rates of Strobilidium sp.-sized naked ciliates on A. cf. poporum were the same as those obtained in this study. The grazing coefficients (g, d 1 ) were calculated as: g = CR GC 24 (5) where CR is the clearance rate (ml predator 1 h 1 ) of a predator on Azadinium cf. poporum at a given prey concentration, and GC is the grazer concentration (cells ml 1 ). CRs were calculated as: CR = IR/X (6) where IR is the ingestion rate (cells eaten predator 1 h 1 ) of the predator on the prey and X is the prey concentration (cells ml 1 ). CRs were corrected using Q 10 = 2.8 (Hansen et al. 1997) because in situ water temperatures and the temperature used in the laboratory for the experiments (20 C) were sometimes different Swimming speed A culture of Azadinium cf. poporum (ca cells ml 1 ) growing at 20 C under an illumination of 20 μe m 2 s 1 of cool white fluorescent light on a 14:10 h light: dark cycle in F/2 medium-si was added to a 50 ml cell culture flask and allowed to acclimate for 30 min. The video camera focused on 1 field seen as 1 circle in a cell culture flask under a stereomicroscope (Olympus, SZX-12) at 20 C, and swimming of A. cf. poporum cells was then recorded at a magnification of 40x using a video analyzing system (Samsung, SV-C660) and a CCD camera (Hitachi, 97
118 KP-D20BU). The swimming speed was calculated based on the linear displacement of cells in 1 s. The average swimming speed was calculated based on the measures of 30 cells during single-frame playback. The swimming of individual cells was interrupted by short and high-speed jumps in various directions typical of the genus Azadinium (Tillmann et al. 2009). These jumps were excluded from the measurements. 4.5 Results Among the predators tested, Gyrodinium dominans, G. moestrupii, Oxyrrhis marina, Pfiesteria piscicida, Gyrodiniellum shiwhaense, Strobilidium sp., and Acartia spp. were able to feed on Azadinium cf. poporum (Fig. 4.2), while Polykrikos kofoidii, Oblea rotunda, and Stoeckeria algicida were not. Only the HTD O. marina and the ciliate Strobilidium sp. showed sustained growth on A. cf. poporum Growth rate The growth rate of Oxyrrhis marina on Azadinium cf. poporum rapidly increased up to ca cells ml 1 (669 ng C ml 1 ), but became saturated at the higher prey concentrations (Fig. 4.3 A). When the data were fitted to Eq. (2), the maximum growth rate (µ max ) of O. marina on A. cf. poporum was d 1 and the threshold prey concentration for the growth of the predator was 4 cells ml 1 (0.509 ng C ml 1 ). The prey concentration sustaining half of µ max was 619 cells ml 1 (79.4 ng C ml 1 ). 98
 Gyrodinium moestrupii with 2 ingested A. cf. poporum cells, (D) Pfiesteria piscicida with an ingested A. cf. poporum cell, (E) Gyrodiniellum shiwhaense with an ingested A. cf. poporum cell, (F) Strobilidium sp.")
119 Fig. 4.2 Feeding by (A E) heterotrophic dinoflagellates and (F) a ciliate on Azadinium cf. poporum. (A) Oxyrrhis marina with several ingested A. cf. poporum cells, (B) Gyrodinium dominans with an ingested A. cf. poporum cell, (C) Gyrodinium moestrupii with 2 ingested A. cf. poporum cells, (D) Pfiesteria piscicida with an ingested A. cf. poporum cell, (E) Gyrodiniellum shiwhaense with an ingested A. cf. poporum cell, (F) Strobilidium sp. with several ingested A. cf. poporum cells. All photographs were taken by means of an inverted microscope using Zeiss AxioCam MRc5 digital camera at a magnification of 630x. Scale bars = 10 μm 99
120 Fig. 4.3 Oxyrrhis marina and Strobilidium sp. Specific growth rate (μ, d 1 ) of (A) the heterotrophic dinoflagellate and (B) a ciliate feeding on the dinoflagellate Azadinium cf. poporum as a function of mean prey concentration (X). Symbols represent treatment means ± 1 SE. A Michaelis-Menten equation (Eq. 2) was used to produce curves for (A) and (B) for all treatments in the experiments. (A) μ = 0.497(X 0.509)/[ (X 0.509)], r 2 = 0.776; (B) μ = 0.636(X 185)/[268 + (X 185)], r 2 =
121 The growth rate of Strobilidium sp. on Azadinium cf. poporum rapidly increased up to ca cells ml 1 (590 ng C ml 1 ), but became saturated at the higher prey concentrations (Fig. 4.3 B). When the data were fitted to Eq. (2), the µ max of Strobilidium sp. on A. cf. poporum was d 1 and the threshold prey concentration for the growth of the predator was 1.4 x 10 3 cells ml 1 (185 ng C ml 1 ). The prey concentration sustaining half of µ max was 2.1 x 10 3 cells ml 1 (268 ng C ml 1 ) Ingestion rate The ingestion rate of Oxyrrhis marina on Azadinium cf. poporum increased rapidly with mean prey concentration up to ca cells ml 1 (669 ng C ml 1 ), but became saturated at higher concentrations (Fig. 4.4 A). When the data were fitted to Eq. (3), the maximum ingestion rate (I max ) of O. marina on A. cf. poporum was 39 cells predator 1 d 1 (4.99 ng C predator 1 d 1 ). The prey concentration sustaining half of I max was cells ml 1 (287 ng C ml 1 ). The maximum clearance rate of O. marina on A. cf. poporum was 8.85 μl predator 1 d 1. The ingestion rate of Strobilidium sp. on Azadinium cf. poporum increased rapidly with mean prey concentration up to ca cells ml 1 (590 ng C ml 1 ). The ingestion rate continued to increase until the maximum prey concentration was reached at cells ml 1 ( ng C ml 1 ), but at a slower rate (Fig. 4.4 B). When the data were fitted to Eq. (3), the I max of Strobilidium sp. on A. cf. poporum was cells predator 1 d 1 (179 ng C predator -1 d 1 ). The prey concentration sustaining half of I max was cells ml 1 (608 ng C ml 1 ). The maximum clearance rate of Strobilidium sp. on A. cf. poporum was 346 μl predator 1 d
122 Fig. 4.4 Oxyrrhis marina, Strobilidium sp., and Acartia spp. Ingestion rate (IR) of (A) the heterotrophic dinoflagellate, (B) a ciliate, and (C) copepods feeding on the dinoflagellate Azadinium cf. poporum as a function of mean prey concentration (X). Symbols represent treatment means ± 1 SE. A Michaelis-Menten equation (Eq. 3) was used to produce the curves for (A) and (B), while a simple linear regression equation (Eq. 4) was used to produce the curve for (C) for all treatments in the experiments. (A) IR = 4.99 X/(287 + X), r 2 = 0.581; (B) IR = 179 X/(608 + X), r 2 = 0.777; (C) IR = 2.63 X , r 2 =
123 The ingestion rate of Acartia spp. on Azadinium cf. poporum increased linearly up to ca. 5.5 x 10 4 cells ml 1 (7.0 x 10 3 ng C ml 1 ), the maximum prey concentration used (Fig. 4.4 C). When the data were fitted to Eq. (4), the I max of Acartia spp. at the maximum prey concentration tested was 1.4 x 10 5 cells predator 1 d 1 (1.9 x 10 4 ng C predator -1 d -1 ). The maximum clearance rate of Acartia spp. on A. cf. poporum was 8.4 ml predator -1 d Gross growth efficiency The mean GGEs by predator-prey combination of Oxyrrhis marina on Azadinium cf. poporum generally increased with the mean prey concentrations. The GGEs were 6 to 11 % at the prey concentrations for which ingestion rate was saturated (Fig. 4.5 A). The mean GGEs by predator-prey combination of Strobilidium sp. on A. cf. poporum generally increased from the first mean prey concentration to 2.4 x 10 4 cells ml 1 (3.01 x 10 3 ng C ml -1 ), the mean prey concentration preceding the last. However, Strobilidium sp. underwent a decrease of GGE at the last mean prey concentration (5.8 x 10 4 cells ml -1, 7.5 x 10 3 ng C ml -1 ), likely caused by incomplete digestion, a phenomenon referred as superfluous feeding (Straile 1997). The GGEs were 2 to 6 % at prey concentrations cells ml -1 (590 ng C ml -1 ; Fig. 4.5 B) Dynamics of Azadinium cf. poporum The 36 mo field survey conducted in Shiwha bay showed that Azadinium cf. poporum cell concentrations were generally low (Fig. 4.6). The DNA of 103
124 Fig. 4.5 Oxyrrhis marina and Strobilidium sp. Mean gross growth efficiencies (GGEs) of (A) the heterotrophic dinoflagellate and (B) a ciliate on Azadinium cf. poporum as a function of mean prey concentration. The GGEs at the first mean prey concentration are not illustrated since they were highly negative. Fig. 4.6 Azadinium cf. poporum. Dynamics of abundances quantified by qpcr in Shiwha bay, Korea, from 2009 to The highest values obtained at each sampling date are reported. The presence of ice prevented sampling in some months. J: January, F: February, M: March, A: April, M: May, J: June, J: July, A: August, S: September, O: October, N: November, D: December 104
125 A. cf. poporum was detected each year of the survey. A. cf. poporum reached its highest concentration in September 2009 at 5.2 cells ml Grazing impact The grazing impact of Oxyrrhis marina was not possible to assess with the data provided by this study, since Azadinium cf. poporum and O. marina were not found to co-occur. However, Strobilidium sp.-sized naked ciliates (25 to 60 μm in length) were observed to co-occur with A. cf. poporum in Shiwha bay, Korea, between January 2009 and December Grazing coefficients were variable in a narrow range of concentrations for A. cf. poporum (0.2 to 3.2 cells ml -1 ) and Strobilidium sp.-sized naked ciliates (0.1 to 1.0 cells ml -1 ). Assuming that the ingestion rates of all Strobilidium sp.-sized naked ciliates on A. cf. poporum were the same as that of Strobilidium sp. obtained in this study, the grazing coefficients ranged between and d -1 (n = 7; Fig. 4.7) Swimming speed The average (±SE, n = 30) and maximum swimming speeds of Azadinium cf. poporum, excluding the short and high-speed jumps in various directions, at the given conditions were 416 (± 13) and 550 μm s 1, respectively. 4.6 Discussion Feeding This study is the first extensive report of feeding by HTDs, ciliates, and copepods on a species of the genus Azadinium. The engulfment feeders used in this 105
126 Fig. 4.7 Strobilidium sp.-sized naked ciliates (25 to 60 μm in length). Calculated grazing coefficients of the ciliates (n = 7) in relation to the concentration of cooccurring Azadinium cf. poporum (see Eqs. 5 & 6 for calculation). Clearance rates were corrected with a Q10 = 2.8 (Hansen et al. 1997) because in situ water temperatures and the experimental temperature used in the laboratory (20 C) were sometimes different. Inset shows the scale of the circles that represent grazing coefficients (g, d 1 ). 106
127 study are raptorial feeders (Fenchel 1987, Sleigh 1989). These predators usually prefer prey approaching their size (Hansen et al. 1994). While the biggest engulfment feeder, Polykrikos kofoidii, did not feed on Azadinium cf. poporum, Gyrodinium spp. were of intermediate size and occasionally fed on A. cf. poporum. Oxyrrhis marina was the smallest engulfment feeder used in this study and revealed to be the most efficient on A. cf. poporum. Therefore, size is likely to be an important factor affecting the feeding of predators using engulfment on Azadinium spp. A particular case is G. fusus, which was previously suggested to be an important grazer on A. cf. spinosum (Akselman & Negri 2012). Akselman & Negri (2012) claimed that G. fusus is able to develop a hyaline cytoplasmic extension or feeding veil from its hypocone that reaches up to twice its length. This particularity was not observed with Gyrodinium spp. in our study and might explain the feeding efficiency of G. fusus on small prey such as A. cf. spinosum despite the difference in size. While size appears to be a relevant factor in feeding on A. cf. poporum for engulfment feeders, speed is unlikely to be a critical factor. For example, P. kofoidii is known to feed on prey of similar speed (e.g. Gymnodinium catenatum mean speed: 450 μm s 1, maximum speed: 615 μm s 1 ; Yoo et al. 2010, this study). Peduncle feeders can be highly specialized, such as Stoeckeria algicida which is only known to feed on Heterosigma akashiwo among algal prey (Jeong et al. 2005d, 2011b, this study). However, these predators are usually generalists and are able to feed on a wide range of dinoflagellates, but are restricted in size regarding thecal dinoflagellates. Peduncle feeders do not seem to have peduncles that are strong enough to efficiently penetrate the theca of dinoflagellates. Therefore, the theca might explain the absence of growth by both Pfiesteria 107
128 piscicida and Gyrodiniellum shiwhaense despite the occurrence of feeding. Peduncle feeders are therefore unlikely to be effective predators on Azadinium spp. The pallium feeder Oblea rotunda was not able to feed on Azadinium cf. poporum. O. rotunda responds to chemosensory, but not to mechanosensory stimulation (Strom & Buskey 1993). Therefore, the lack of chemosensory stimulation from A. cf. poporum might explain the lack of feeding by O. rotunda. P. crassipes, for which AZA-1, AZA-2, and AZA-3 have been detected (James et al. 2003b), is likely to feed on Azadinium spp. or closely related species. Therefore, it is worthwhile to study feeding by pallium feeders on Azadinium spp. further in order to assess the potential of such predators. The filter feeders Strobilidium sp. and Acartia spp. were both able to feed on Azadinium cf. poporum. However, not all filter feeders are likely to feed on Azadinium spp. The ciliate Laboea strobila as well as 3 unidentified oligotrich ciliate species were previously observed to co-occur with A. cf. spinosum. Among them, only 1 oligotrich ciliate was suggested to feed (Akselman & Negri 2012). The facility of filter feeders to capture prey of smaller size (Hansen et al. 1994) might partly explain their success. However, more factors are apparently implicated in their capacity to feed on Azadinium spp. Based on the results of the present study, the dynamics of HTDs that engulf their prey and are not disproportionately larger than Azadinium spp., as well as ciliates which use filtration, are more likely to be affected by the occurrence of Azadinium spp. than HTDs that feed using their peduncle Growth and ingestion rates 108
129 The µ max of the predators of Azadinium cf. poporum were the lowest among known photosynthetic or mixotrophic prey enabling growth (Fig. 4.8 A, 4.9 A; Goldman et al. 1989, Montagnes 1996, Jeong et al. 2001, 2003b, Tillmann & Reckermann 2002, Chen et al. 2010, Yoo et al. 2010), while the I max values were the highest (Fig. 4.8 B, 4.9 B, 4.10; Houde & Roman 1987, Goldman et al. 1989, Jeong et al. 2001, 2003b, Besiktepe & Dam 2002, Tillmann & Reckermann 2002, Broglio et al. 2003, Cohen et al. 2007, Chen et al. 2010, Yoo et al. 2010). The low ratios of maximum growth rate to maximum ingestion rate, or RMGI, and GGEs obtained by predators in this study suggest that A. cf. poporum is a low-quality prey. The energy necessary to capture, handle, and digest this prey is higher than for other prey species, or the conversion of ingested A. cf. poporum carbon to predator body carbon is low. This can lead the predators to compensate for the low quality of A. cf. poporum by feeding more and explains the high ingestion rates obtained in the laboratory experiments. A. cf. poporum is the only known photosynthetic or mixotrophic thecate prey species for Oxyrrhis marina and Strobilidium sp. for which we have quantitative data on growth and ingestion rates. The theca of A. cf. poporum might be partly responsible for its reduced quality as prey. It is also possible that the azaspiracid produced by A. cf. poporum (Krock et al. 2012) lowers its quality as prey Dynamics of Azadinium cf. poporum The survey of Azadinium cf. poporum by qpcr revealed that the species is always in low concentration in Shiwha bay. In this respect, it appears that A. cf. poporum acts similarly to A. caudatum (Nézan et al. 2012). The reasons explaining 109
130 Fig. 4.8 Oxyrrhis marina. (A) Maximum growth (μ max, d 1 ) and (B) ingestion rates (I max, ng C predator 1 d 1 ) of the heterotrophic dinoflagellate feeding on photosynthetic or mixotrophic algal prey as a function of prey size (equivalent spherical diameter, ESD, μm), and (C) μ max as a function of I max. ESDs were estimated based on prey volume or carbon content converted to prey volume according to Menden-Deuer & Lessard (2000) if not provided. Ingestion rates from Goldman et al. (1989) were converted from cell to carbon according to Menden- Deuer & Lessard (2000). Control laboratory experiments were made at 20 C. Ac: Amphidinium carterae, Ap: Azadinium cf. poporum, Dt: Dunaliella tertiolecta, Eg: Eutreptiella gymnastica, Fj: Fibrocapsa japonica, Ga: Gymnodinium aureolum, Ha: Heterosigma akashiwo, Ig: Isochrysis galbana, Pt: Phaeodactylum tricornutum. 110
131 Fig. 4.9 Strobilidium spp. (A) Maximum growth (μ max, d 1 ) and (B) ingestion rates (I max, ng C predator 1 d 1 ) of the ciliates feeding on photosynthetic or mixotrophic algal prey as a function of prey size (equivalent spherical diameter, ESD, μm) and (C) μ max as a function of I max. Rates were corrected with a Q10 = 2.8 (Hansen et al. 1997) if control laboratory experiments were made at a temperature different than 20 C. ESDs were estimated based on carbon content converted to prey volume according to Menden-Deuer & Lessard (2000) if not provided. Ap: Azadinium cf. poporum, Cs: Chroomonas salina, Ig: Isochrysis galbana, Ns: Nannochloropsis sp. 111
132 Fig Acartia spp. Maximum ingestion rate (I max, μg C predator 1 d 1 ) of the copepods on photosynthetic or mixotrophic algal prey as a function of prey size (equivalent spherical diameter, ESD, μm). Rates were corrected with a Q10 = 2.8 (Hansen et al. 1997) if control laboratory experiments were unambiguously made at a temperature different than 20 C. ESDs were estimated based on carbon content converted to prey volume according to Menden-Deuer & Lessard (2000) if not provided. *Maximum value obtained. Ac: Amphidinium carterae*, Ap: Azadinium cf. poporum*, Gs: Gymnodinium sanguineum*, Kb: Karenia brevis*, Pm1* and Pm2: Prorocentrum minimum. 112
133 these observations are unknown. Predation on A. cf. poporum as well as the physiology of the species can result in such dynamics Grazing impact The grazing coefficients obtained by using field data on abundance of Strobilidium sp.-sized naked ciliates (25 to 60 μm in length) co-occurring with Azadinium cf. poporum as well as laboratory data on ingestion rates suggest that up to 36 % of the A. cf. poporum population could be removed by Strobilidium sp.-sized naked ciliates in 1 d. However, it is unclear whether such an impact is reflected in the field with a more complex microbial food web. The high ingestion rates obtained in laboratory experiments, as mentioned above, might be influenced by compensatory feeding. Furthermore, oligotrich ciliates are known to select food based on size (Kivi & Setälä 1995). However, ciliates have also shown selectivity at the species level (Stoecker et al. 1981, Verity 1988). Therefore, it is questionable to what extent the grazing impacts obtained in this study reflect what is actually happening in the field Ecological implications Many predators are able to feed on Azadinium cf. poporum. However, only 2 predators used in this study responded with acute growth on A. cf. poporum. Furthermore, A. cf. poporum appears to be a low-quality prey for the planktonic predators tested here based on the RMGI and GGEs obtained. If this can be generalized at the genus level, it suggests that only a few predators are likely to feed efficiently on Azadinium spp. The abundances of A. cf. poporum in the field revealed to be below or slightly above the threshold prey concentration of the 113
134 predators. Therefore, A. cf. poporum is unlikely to affect the dynamics of these predators in the field. This is reflected by the absence or low co-occurrence of the protistan predators with A. cf. poporum over the 3 yr of monitoring. Factors other than predation are likely to be implicated in the determination of the abundance of A. cf. poporum in the field. Further research is required to determine these factors. 114
135 Chapter 5: Physiology Effect of environmental factors on Azadinium cf. poporum from western Korean waters 5.1 Abstract In order to determine the causes explaining the low dynamics of Azadinium poporum in Shiwha bay, an eutrophic area, we assessed the tendency of some parameters through time such as the temperature, the salinity, the ph, the dissolved oxygen, the Secchi depth, the concentration of nutrients, and the concentration of chlorophyll a. We also determined the effects of temperature, salinity, and light on the growth of A. poporum in laboratory as well as relationships between environmental parameters and A. poporum in the field. The species revealed to grow on a wide range of temperature and salinity and was therefore generally well adapted to the high variability observed in Shiwha bay. A. poporum was also adapted to low light condition. The growth obtained in laboratory studies when compared to other photosynthetic or mixotrophic dinoflagellates was not particularly low. A. poporum revealed to be more represented in the field when the concentrations of nitrite and nitrate, silicate, and chlorophyll a were low and the transparency was high. These parameters correspond to a reduced trophic state. This suggests that A. poporum use these reduced trophic states as windows of opportunity to thrive and survive in a eutrophic environment. 5.2 Keywords 115
136 Azadinium poporum, Shiwha bay, growth, tolerance, temperature, salinity, light, ph, dissolved oxygen, nutrients, chlorophyll a 5.3 Introduction Investigations of the factors that account for the population dynamics and the spatial distribution of phytoplankton in aquatic systems often focus on growth responses. Growth and related metabolic activities are typically dependent on various environmental factors. Among these factors, temperature, salinity, light, and nutrients might affect dinoflagellate growth (Flynn et al. 1996, Parkhill & Cembella 1999, Hwang & Lu 2000, Maclean et al. 2003, Hu et al. 2006, Gedaria et al. 2007, Lartigue et al. 2009, Xu et al. 2010). The temperature will influence the enzymatic activity of microalgae. The enzymes have an optimal functional temperature under which the speed reaction are slower and over which the enzymes degrade more quickly (Grzebyk & Séchet 2003). Therefore, the temperature is a factor having a significant effect on growth until the reach of an optimum (Nielsen 1996, Matsubara et al. 2007, Xu et al. 2010, Laabir et al. 2011). Unfavorable salinities to microalgae will affect enzymatic activity by modifying the energetic consumption allocated to osmotic regulation (Grzebyk & Séchet 2003). Therefore, the salinity will have an effect on the cellular metabolism and growth. The euryhaline estuarine species and the marine coastal species have a large tolerance to salinity variation (Taylor & Pollingher 1987, Grzebyk et al. 2003, Nagasoe et al. 2006, Matsubara et al. 2007, Laabir et al. 2011). However, some marine species are stenohaline and can be sensible to 116
137 salinity variation (Kim et al. 2004a). The photosynthetic dinoflagellate species can adapt quickly to variations of light intensities. For example, they can, at low light intensity, increase their size and/or number of photosynthetic units (Smayda 1997). This factor is the one that affect the most the nutrition of microalgae. An insufficient light reduced or stop the growth (Grzebyk & Séchet 2003, Paz et al. 2006). Nutritional factors are of high relevance in the determination of the dynamics of growth. Dinoflagellates respond differently to various nutrients as well as their concentrations. The diversity of responses is partly responsible of the species dynamics in the field. The population dynamics of the species of the genus Azadinium is not well known. These species apparently seem to either keep a low density such as A. caudatum which was not observed exceeding 1.3 cells L -1 (Nézan et al. 2012), while others are able to bloom such as A. cf. spinosum and reached up to cells ml -1 (Akselman & Negri 2012). The survey of A. poporum by qpcr (quantitative polymerase chain reaction) revealed that the species is always in low concentration in Shiwha bay (Potvin et al. 2013). The reasons resulting in such dynamics are unknown. In order to determine the factors implicated in the low abundance of A. poporum, we explored the trends of various factors in the field, the effect of environmental factors such as temperature, salinity, and light on the growth, as well as the distribution of the species in relation to various abiotic and biotic factors. The results of the present study provide a basis to understand the effects 117
138 of environmental factors on the dynamics of Azadinium spp. in a highly eutrophic area. 5.4 Materials and methods Study area Shiwha bay was created artificially by the reclamation of an intertidal flat on the west coast of Korea from December 1986 to January This saline bay was expected to transform into a freshwater body and to be used for irrigation purposes. However, the drainage structure of the bay did not allow the entrapment of the Yellow Sea water and the full replacement by freshwater from its hinterland. Eutrophication progressed due to untreated sewage and wastewater flowing in from Shiwha adjacent area (Kim et al. 2004b). The severe deterioration of the water quality in the middle of the 90s prompted a more pronounced monitoring of the bay in order to assess the environmental impacts (Park et al. 2003, Yoo et al. 2009) Field data Water samples were obtained at least at monthly intervals in ice-free conditions from January 2009 to December 2011 in Shiwha bay, Korea, at different stations (Potvin et al. 2013). Temperature and salinity were measured using a YSI ph-meter (model 63-10FT) with a detection limit of 0.1 and 0.1, respectively. ph and DO were measured using a Handylab ph 11 (Schott Instruments, Mainz, Germany) and a Oxi 197i (WTW GmbH, Weilheim, Germany), respectively. The Secchi depth was measured using a Secchi disk. Water samples for analyzing nutrient concentrations were gently filtered through 118
139 GF/F filters and stored frozen at -20 C until the concentrations of ammonium (NH + 4 ), nitrate plus nitrite (NO NO - 2 ), phosphate (PO 3-4 ), and silicate (SiO 2-3 ) were measured using a nutrient auto-analyzer system (Quattro; Seal Analytical Gmbh, Norderstedt, Germany). The chlorophyll a was measured as in APHA (1995). The correlation coefficients between various physical, chemical, and biological properties were calculated using Pearson's correlation (Conover 1980, Zar 1999) Maintenance of the experimental organism A. poporum was isolated from surface sediment samples from Shiwha bay, an highly eutrophic bay from Korea (37 18' N, ' E) as in Potvin et al. (2012) and cultivated in F/2 medium-si (Guillard & Ryther 1962) in a growth chamber at 20 C under an illumination of 20 µe m -2 s -1 of cool white fluorescent light on a 14:10 h light-dark cycle Effect of temperature, salinity, and light on growth In order to determine the effect of temperature on growth, A. poporum was cultured at different temperatures (11, 12, 13, 14, 15, 20, 23, 25, 27, 30 C), while the irradiance was kept at 20 µe m 2 s 1 of cool white fluorescent light on a 14:10 h light: dark cycle and the salinity kept at 31±1. To determine the effect of salinity on growth, A. poporum was cultured at different salinities (10, 15, 20, 25, 30, 35, 40, 45, 50), while the irradiance was kept at 20 µe m 2 s 1 of cool white fluorescent light on a 14:10 h light: dark cycle and the temperature kept at 20±1 C. 119
140 To assess the effect of light on growth, A. poporum was cultured at different irradiances (0, 5, 10, 20, 50, 100, 200, 300 µe m 2 s 1 ) of cool white fluorescent light on a 14:10 h light: dark cycle, while the temperature was kept at 20±1 C and the salinity at 31±1. Bottles were wrapped with aluminum foil for darkness and with layers of neutral density filter (fiberglass mesh) to set the proper light intensity. A stock culture was adapted in F/2 medium-si for at least 2 generations. Thereafter, the stock culture was diluted every second day with new F/2 medium- Si of the respective temperature and salinity keeping the cells in exponential growth phase. The last generation, obtained within a week, was used as inoculum for the experiments. The following formula, modified from Lenderman and Tett (Lenderman & Tett 1981) was used to describe the relationship between growth rate and irradiance: µ = µ max (I-I 0 ) / (K s -I 0 ) + (I-I 0 ) where µ max is the maximum growth rate (d -1 ), I is the irradiance (µe m -2 s -1 ), I 0 is the compensation irradiance (µe m -2 s -1 ), and K s is the irradiance sustaining half the maximum growth rate. Data were iteratively fitted to the model using DeltaGraph (Delta Point). All experiments were carried out in polycarbonate bottles (500 ml) in standing condition. Each experiment was initiated by the inoculation of about 120
141 1000 to 2500 cells ml -1 (final concentration) and allowed to run for 6 to 8 d. Subsamples (37.5 ml) were taken for the enumeration of phytoplankton cells every second day. After subsampling, the bottles were refilled to capacity with F/2 medium-si of the respective salinity and temperature. The condition of A. poporum was assessed using a stereomicroscope (Olympus, SZX-12, Japan) before and after each subsampling. Experiments were carried out in triplicate, and data from each replicate were the mean of at least 3 growth rates (4 sampling dates). For enumeration of cells, subsamples were fixed in Lugol s solution (5 % final concentration). The abundances were determined by counting all or >300 cells in 3 1-mL Sedgwick-Rafter chambers (SRCs). The specific growth rate, µ (d -1 ), was calculated as: µ = [Ln (C t /C 0 )] / t where C 0 and C t = the concentrations of A. poporum in exponential growth at the previous and last subsampling date, respectively; t = time elapse during the subsampling interval. The dilution produced after subsampling was considered in the measurements of growth rates. Irradiance was measured initially during the setting of the experiments using a LI-COR LI-1400 radiation sensor equipped with a LI-COR Quantum flat probe (model Q 39265). The temperature was monitored daily. The salinity was measured at the beginning and every second day during subsampling. The temperature was measured with a standard thermometer and the salinity was measured using a YSI ph-meter (model 63-10FT). 121
142 5.4.5 Occurrence Data on the occurrence of A. poporum were obtained from Shiwha bay, Korea (from 2009 to 2011) by qpcr as in Potvin et al. (2013). 5.5 Results Field Through the three years survey of Shiwha bay, some parameters such as the temperature, the salinity, the phosphate, and to some extent the nitrite and nitrate, the silicate, and the chlorophyll a showed similarity in there seasonal variability (Fig. 5.1). An increased in the input of nitrite and nitrate as well as silicate in the bay was observed through the years (Fig. 5.1). These increases of input were also associated with an increase of chlorophyll a (Fig. 5.1). No clear tendency was observed for the ph, the dissolved oxygen, the Secchi depth, and the ammonium concentration (Fig. 5.1). Many parameters were significantly correlated to each other in Shiwha bay (Table 5.1). The chlorophyll a which is a proxy for phytoplankton biomass showed a strong correlation with the salinity (r=0.606), the nitrite and nitrate concentration (r=0.650), as well as the silicate concentration (r=0.448). The phytoplankton biomass appears to decrease with the increase of salinity, while it appears to increase with the increase of the nutrients mentioned above. 122

.")

143 Fig. 5.1 Variation of physical and chemical parameters in Shiwha bay, Korea, from 2009 to 2011 (left) and integrated values through the year (right). The presence of ice prevented sampling in some months. DO: dissolved oxygen, SD: Secchi depth, NH + 4 : ammonium, NO - 2 +NO - 3 : nitrite and nitrate, PO 3-4 : phosphate, SiO 2-3 : silicate, Chl-a: chlorophyll a 123

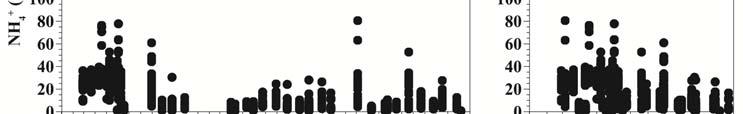
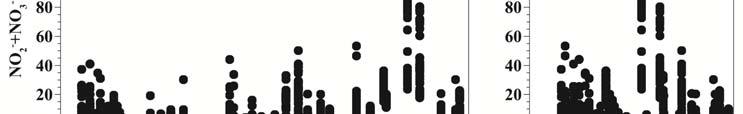
144 Fig. 5.1 (continued) 124


145 Fig. 5.1 (continued) 125
146 Table 5.1 Pearson correlation coefficient matrix (absolute value) between physical and chemical properties of Shiwha bay, Korea, from January 2009 to December 2011 T: temperature, S: salinity, DO: dissolved oxygen, SD: Secchi depth, NH + 4 : ammonium, NO - 2 +NO - 3 : nitrite and nitrate, PO 3-4 : phosphate, SiO 2-3 : silicate, Chl-a: chlorophyll a Component T S ph DO SD NH 4 NO NO PO 4 SiO 3 T ** ** 0.269** ** 0.239** 0.339** 0.240** S ** 0.163** 0.307** 0.150** 0.689** 0.152** 0.537** 0.606** ph ** 0.085* ** ** DO ** 0.178** ** 0.146** 0.128** SD ** 0.222** 0.155** 0.119** 0.225** NH 4 + NO 2 - +NO 3-3- PO 4 2- SiO 3 Chl-a - Significance level: *p<0.05, **p<0.01 Chl-a * 0.091** ** ** 0.634** 0.650** ** **
147 5.5.2 Effect of temperature, salinity, and light on growth A. poporum was able to grow from 11 C to 30 C (Fig. 5.2), but died at 10 C and 31 C. The growth increased linearly from 11 C until it reached its optimum at 25 C and decreased thereafter. The maximum growth obtained was d -1. A. poporum was able to grow from a salinity of 10 to 50 (Fig. 5.2), but died at 9 and 51. The growth increased in general logarithmically from a salinity of 10 until it reached its optimum at 35 (Fig. 5.2) and decreased thereafter, but at a quicker rate than the increase. The maximum growth obtained was d -1. A. poporum did not grow in darkness. The growth rate of A. poporum rapidly increased between 5 and 50 µe m -2 s -1, but became saturated at higher intensities (Fig. 5.3). When the data were fitted to the modified formula from Lenderman and Tett, the maximum growth rate of A. poporum was 0.53 d -1, the K s (the irradiance sustaining half the maximum growth rate) was 4.0 µe m 2 s 1, and the compensation irradiance (when net growth = 0) was 0.38 µe m 2 s Occurrence A. poporum occurred in various conditions in regards of the temperature, salinity, ph, dissolved oxygen, Secchi deph, ammonium concentration, nitrite and nitrate concentration, phosphate concentration, silicate concentration, and chlorophyll a concentration (Fig. 5.4). The abundance based on qpcr was strongly correlated with nitrite and nitrate concentration (r=0.530) as well as phosphate concentration (r=0.541), while it was only moderately correlated with the Secchi 127
148 Fig. 5.2 Azadinium cf. poporum. Specific growth rates (d -1 ) obtained when the species was adapted to various temperatures and salinities. Symbols represent treatment means ± 1 SE (n=3). No growth was observed at the extreme values of temperature and salinity. The conditions providing no growth were determined twice with the same strain. 128
149 Fig. 5.3 Specific growth rates (GR) of Azadinium poporum at 8 different light intensities. Symbols represent treatment means ± 1 SE (n=3). The curve was fitted to the modified formula of Lenderman and Tett using all treatments in the experiment. GR (d -1 ) = (0.53*(x-0.38)) / (( ) + (x-0.38)), r 2 =
, and the West coast of Korea (from 2007-2012). The linear regression present in some graphs are significant (p<0.05).")
150 Fig. 5.4 Physical and chemical parameters in relation with the abundance of Azadinium poporum based on qpcr and the ratio of biomass of A. poporum to Chl-a. Data were obtained from Shiwha bay, Korea (from 2009 to 2011), and the West coast of Korea (from ). The linear regression present in some graphs are significant (p<0.05). DO: dissolved oxygen, SD: Secchi depth, NH + 4 : ammonium, NO - 2 +NO - 3 : nitrite and nitrate, PO 3-4 : phosphate, SiO 2-3 : silicate, Chl-a: chlorophyll a. 130
151 Fig. 5.4 (continued) 131
152 Fig. 5.4 (continued) 132

153 Fig. 5.4 (continued) 133
Azaspiracids producing dinoflagellates
 Azaspiracids producing dinoflagellates Kazuya Takahashi and Mitsunori Iwataki Univ Tokyo, Japan Azadinium spp. Found in 2009 as a producer of lipophilic polyether toxin Azaspiracids (AZAs), responsible
State-of-the-Art Liquid Chromatography- Tandem Mass Spectrometry Detection Methods for Shellfish Toxins (ASP, DSP, PSP)
") State-of-the-Art Liquid Chromatography- Tandem Mass Spectrometry Detection Methods for Shellfish Toxins (ASP, DSP, PSP) utline 1. Introduction 2. Toxins 3. Mass spectrometry - functional principle - ionization
State-of-the-Art Liquid Chromatography- Tandem Mass Spectrometry Detection Methods for Shellfish Toxins (ASP, DSP, PSP) utline 1. Introduction 2. Toxins 3. Mass spectrometry - functional principle - ionization
FLOW: Amigos de Bolsa Chica Citizen Science Program. Plankton Collection and Identification Report
 FLOW: Amigos de Bolsa Chica Citizen Science Program Plankton Collection and Identification Report Date: 05/03/13 Time: 10:30 AM Collectors: Judy H., Dennis P., Nicole G., Joana T. Tide: ebb (going out)
Ireland: Current Conditions
 ATLANTIC OCEAN IRISH SEA HAB Bulletin [status of harmful and toxic algae] Ireland: Current Conditions Shellfish biotoxin report (last week) National Monitoring Programme Designated Sampling Sites NORTH
Ireland: Current Conditions
 ATLANTIC OCEAN IRISH SEA HAB Bulletin [status of harmful and toxic algae] Ireland: Current Conditions Shellfish biotoxin report (last week) Week 42:4 th 10 th October,2015 Week runs from Sunday to Saturday
Ireland: Current Conditions
 To subscribe to receive the Irish HAB Bulletin by email: http://www.marine.ie/home/site-area/about-us/marine-institute-subscriptions?language=en Under Marine Institute Subscriptions tick the HAB bulletin
Ireland: Current Conditions
 To subscribe to receive the Irish HAB Bulletin by email: http://www.marine.ie/home/site-area/about-us/marine-institute-subscriptions?language=en Under Marine Institute Subscriptions tick the HAB bulletin
Ireland: Current Conditions
 To subscribe to receive the Irish HAB Bulletin by email: http://www.marine.ie/home/site-area/about-us/marine-institute-subscriptions?language=en Under Marine Institute Subscriptions tick the HAB bulletin
저작권법에따른이용자의권리는위의내용에의하여영향을받지않습니다.
 저작자표시 - 비영리 - 변경금지 2.0 대한민국 이용자는아래의조건을따르는경우에한하여자유롭게 이저작물을복제, 배포, 전송, 전시, 공연및방송할수있습니다. 다음과같은조건을따라야합니다 : 저작자표시. 귀하는원저작자를표시하여야합니다. 비영리. 귀하는이저작물을영리목적으로이용할수없습니다. 변경금지. 귀하는이저작물을개작, 변형또는가공할수없습니다. 귀하는, 이저작물의재이용이나배포의경우,
Ireland: Current Conditions
 To subscribe to receive the Irish HAB Bulletin by email: http://www.marine.ie/home/site-area/about-us/marine-institute-subscriptions?language=en Under Marine Institute Subscriptions tick the HAB bulletin
AZA The producing organisms Biology and trophic transfer
 AZA The producing organisms Biology and trophic transfer UrbanTillmann, Rafael Salas, Thierry Jauffrais, Philipp Hess, Joe Silke 1. Introduction 2. Morphology/Taxonomy/Phylogeny 2.1 General morphology
Microbial Grazers Lab
 Microbial Grazers Lab Objective: Measure the rate at which bacteria are consumed by predators. Overview Size based food webs Microbial loop concepts acterial predators Methods to assess microbial grazing
Microbial Grazers Lab
 Microbial Grazers Lab Objective: Measure the rate at which bacteria are consumed by predators. Overview Size based food webs Microbial loop concepts Bacterial predators Methods to assess microbial grazing
FLOW: Amigos de Bolsa Chica Citizen Science Program. Plankton Collection and Identification Report
 FLOW: Amigos de Bolsa Chica Citizen Science Program Plankton Collection and Identification Report Date: 04/26/13 Time: 2:35 PM Collectors: Judy H., Chuck D., Belen C., Joana T. (analysis also performed
Effects of environmental variables on midsummer dinoflagellate community in the Neva Estuary. Mikhail Golubkov, Vera Nikulina, Sergey Golubkov
 Effects of environmental variables on midsummer dinoflagellate community in the Neva Estuary Mikhail Golubkov, Vera Nikulina, Sergey Golubkov Introduction Dinoflagellates are single-celled eukaryotes that
Shellfish biotoxin report (last week)
") Pilot HAB Bulletin [status of harmful and toxic algae] Ireland: Historic Trends, Current Conditions and Predictions Ireland HISTORIC TRENDS 2003-2012 Shellfish Toxicity: does not include winter carry over
Pilot HAB Bulletin [status of harmful and toxic algae] Ireland: Historic Trends, Current Conditions and Predictions Ireland HISTORIC TRENDS 2003-2012 Shellfish Toxicity: does not include winter carry over
Announcements. Third problem site due November 30 Review calculations
 Announcements Geology Primary Fields of Oceanography Chemistry Third problem site due November 30 Review calculations Next Thursday quiz on Kirchman reading (microbes) Moving from physical to biological
Ireland: Predictions. NMP Current closures ASP AZP DSP PSP
 HAB Bulletin [status of harmful and toxic algae] Ireland: Predictions ASP event: Low AZP event: High DSP event: High PSP event: High (site specific, moderate in general) Week 30: July 17 th - July 22 nd
DSP: This is currently a low risk period for early DSP events. All sites are currently below regulatory limits.
 HAB Bulletin [status of harmful and toxic algae] Ireland: Predictions ASP event: Low AZP event: Low to moderate DSP event: Low PSP event: Very low Why do we think this? Week 7: Feb 5 th Jan 11 th 2017
Prokaryotes Vs. Eukaryotes
 The Microbial World Prokaryotes Vs. Eukaryotes Mircrobes of the Ocean Primary Producers Are the organisms that produce bio-mass from inorganic compounds (autotrophs). -Photosynthetic autotrophs Phytoplankton
FLOW: Amigos de Bolsa Chica Citizen Science Program. Plankton Collection and Identification Report
 FLOW: Amigos de Bolsa Chica Citizen Science Program Plankton Collection and Identification Report Date: 05/10/13 Time: 2:48 PM Collectors: Dennis P., Belen C., Carolyn D., Sandy M., Shawleen G., Brian
Species composition and long-term dynamics of potentially toxic dinoflagellate species in benthic assemblages of Peter the Great Bay, Sea of Japan
 Species composition and long-term dynamics of potentially toxic dinoflagellate species in benthic assemblages of Peter the Great Bay, Sea of Japan Marina Selina & Tatiana Morozova tatiana_morozova@mail.ru
Ireland: Predictions. NMP Current closures ASP AZP DSP PSP
 HAB Bulletin [status of harmful and toxic algae] Ireland: Predictions ASP event: High - steady continuous increase AZP event: High/mod - due to constant fluctuation DSP event: Low/mod low but slow increase
David W. Seaborn 1, A. Michelle Seaborn 2, William M. Dunstan 2, and Harold G. Marshall 1
 Virginia Journal of Science Volume 5, Number 4 Winter 1999 Growth and Feeding Studies on the Algal Feeding Stage of a Pfiesteria-like Dinoflagellate David W. Seaborn 1, A. Michelle Seaborn 2, William M.
The Microbial World. Chapter 5
 The Microbial World Chapter 5 Viruses Non-cellular infectious agents that have two basic characteristics: Not capable of reproduction without a host cell Structure: Nucleic acid core- can be DNA or RNA
First bloom record of toxic dinoflagellate Prorocentrum lima and climate change interactions in the Dardanelles (Turkish Straits Sistem)
") First bloom record of toxic dinoflagellate Prorocentrum lima and climate change interactions in the Dardanelles (Turkish Straits Sistem) Muhammet Turkoglu (PhD) Çanakkale Onsekiz Mart University, Marine
First bloom record of toxic dinoflagellate Prorocentrum lima and climate change interactions in the Dardanelles (Turkish Straits Sistem) Muhammet Turkoglu (PhD) Çanakkale Onsekiz Mart University, Marine
West Coast HABs affect:
 West Coast HABs affect: Fish (both wild and penned Marine Birds Marine Mammals Humans & Invertebrates Five West Coast Harmful Algal Bloom Species ϑ Dinoflagellate, Alexandrium spp. ϑ Pennate diatom, Pseudo-nitzschia
저작권법에따른이용자의권리는위의내용에의하여영향을받지않습니다.
 저작자표시 - 비영리 - 변경금지 2.0 대한민국 이용자는아래의조건을따르는경우에한하여자유롭게 이저작물을복제, 배포, 전송, 전시, 공연및방송할수있습니다. 다음과같은조건을따라야합니다 : 저작자표시. 귀하는원저작자를표시하여야합니다. 비영리. 귀하는이저작물을영리목적으로이용할수없습니다. 변경금지. 귀하는이저작물을개작, 변형또는가공할수없습니다. 귀하는, 이저작물의재이용이나배포의경우,
Marine Primary Producers. Primary production
 Marine Primary Producers OCN 201 Biology Lecture 4 http://micro.magnet.fsu.edu/moviegallery/ Photo: Fuhrman Lab; University of Southern California Primary production Incorporation of new organic matter
VEGETATION PROCESSES IN THE PELAGIC: A MODEL FOR ECOSYSTEM THEORY
 Colin S. Reynolds VEGETATION PROCESSES IN THE PELAGIC: A MODEL FOR ECOSYSTEM THEORY Introduction (Otto Kinne) Colin S. Reynolds: A Laudatio (William D. Williams) Publisher: Ecology Institute Nordbunte
Harmful Algal Blooms (HABs) 5 Applications
 5 Applications") Harmful Algal Blooms (HABs) 5 Applications Richard P. Stumpf NOAA, National Ocean Service HAB occurrences worldwide Image from whoi.edu/redtide HAB applications: short term Management: Monitoring and Response
Harmful Algal Blooms (HABs) 5 Applications Richard P. Stumpf NOAA, National Ocean Service HAB occurrences worldwide Image from whoi.edu/redtide HAB applications: short term Management: Monitoring and Response
Shifting N:P ratios do not affect the competitive traits of dinoflagellates under present and future climate scenarios
 Shifting N:P ratios do not affect the competitive traits of dinoflagellates under present and future climate scenarios Maarten De Rijcke, Gabriel Orellana, Julie Vanden Bussche, Lynn Vanhaecke, Karel A.C.
Viruses. Viruses. Chapter 5. Prokaryotes. Prokaryotes. Prokaryotes
 Viruses Chapter 5 The Microbial World Non-cellular infectious agents that have two basic characteristics: Not capable of reproduction without a host cell Structure: Nucleic acid core- can be DNA or RNA
Ireland: Predictions. NMP Current closures ASP AZP DSP PSP
 HAB Bulletin [status of harmful and toxic algae] Ireland: Predictions ASP event: Moderate High - increasing steadily. AZP event: Highest - Ongoing DSP event: High ongoing PSP event: Low decreasing ( -
Testing for Grazer Adaptation to Toxic Algae
 Testing for Grazer Adaptation to Toxic Algae by Michael B. Finiguerra, Hans G. Dam, and David E. Avery Part I Introduction and Background Phytoplankton, microscopic single-celled algae, are natural components
Management of recreational waters in relationship with harmful microalgae blooms (HAB) in the Mediterranean Sea
 in the Mediterranean Sea") EVK3-2001- 00046 WORKSHOP Management of recreational waters in relationship with harmful microalgae blooms (HAB) in the Mediterranean Sea 25 26th October 2004 Hotel Don Antonio, Peguera- Calvià, Mallorca
EVK3-2001- 00046 WORKSHOP Management of recreational waters in relationship with harmful microalgae blooms (HAB) in the Mediterranean Sea 25 26th October 2004 Hotel Don Antonio, Peguera- Calvià, Mallorca
DSP: This is currently a low risk period for early DSP events. All sites are currently below regulatory limits.
 HAB Bulletin [status of harmful and toxic algae] Ireland: Predictions Week 9: Feb 18 th Feb 25 th 2017 Week runs from Sunday to Saturday Week 35: 21 st - 27 h Aug, 2016 ASP event: Low AZP event: Moderate
Phytoplankton. Zooplankton. Nutrients
 Phytoplankton Zooplankton Nutrients Patterns of Productivity There is a large Spring Bloom in the North Atlantic (temperate latitudes remember the Gulf Stream!) What is a bloom? Analogy to terrestrial
Morphological and molecular characterization of three new Azadinium. species (Amphidomataceae, Dinophyceae) from the Irminger Sea
 from the Irminger Sea") Morphological and molecular characterization of three new Azadinium species (Amphidomataceae, Dinophyceae) from the Irminger Sea Urban Tillmann *, Marc Gottschling, Elisabeth Nézan, Bernd Krock, Gwenaël
Morphological and molecular characterization of three new Azadinium species (Amphidomataceae, Dinophyceae) from the Irminger Sea Urban Tillmann *, Marc Gottschling, Elisabeth Nézan, Bernd Krock, Gwenaël
저작권법에따른이용자의권리는위의내용에의하여영향을받지않습니다.
 저작자표시 - 비영리 - 변경금지 2.0 대한민국 이용자는아래의조건을따르는경우에한하여자유롭게 이저작물을복제, 배포, 전송, 전시, 공연및방송할수있습니다. 다음과같은조건을따라야합니다 : 저작자표시. 귀하는원저작자를표시하여야합니다. 비영리. 귀하는이저작물을영리목적으로이용할수없습니다. 변경금지. 귀하는이저작물을개작, 변형또는가공할수없습니다. 귀하는, 이저작물의재이용이나배포의경우,
The Ecology of Protists
 The Ecology of Protists Harmful Algal Blooms Stefanie Moorthi ICBM -Terramare, Planktology The Ecology of Protists Introduction distribution and nutritional modes => protists as primary producers => protists
Ireland: Predictions. NMP Current closures ASP AZP DSP PSP DSP event: Low. AZP event: Moderate. PSP event: Very low. Why do we think this?
 HAB Bulletin [status of harmful and toxic algae] Ireland: Predictions Week 12: Mar 12 th Mar 18 th 2017 Week runs from Sunday to Saturday Week 35: 21 st - 27 h Aug, 2016 ASP event: Low AZP event: Moderate
Marine Ecology I: Phytoplankton and Primary production
 Marine Ecology I: Phytoplankton and Primary production Osvaldo Ulloa University of Concepcion, Chile oulloa@profc.udec.cl From SOLAS Science Plan Phytoplankton, biogeochemistry and climate I Uptake (through
Marine Primary Producers
 Marine Primary Producers OCN 201 Biology Lecture 4 http://video.conncoll.edu/f/pasiv/lucid/cyanophora-900.html http://micro.magnet.fsu.edu/moviegallery/ http://www.cellsalive.com/howbig.htm Photo: Fuhrman
Toxic Algae and Cyanobacteria in Recreational Waters. Rang Cho Miriam Moritz
 Toxic Algae and Cyanobacteria in Recreational Waters Rang Cho Miriam Moritz Algae Large, diverse group of eukaryotic organisms Contain chlorophyll and/or other pigments green, brown or red colour Perform
Ecology 3/15/2017. Today. Autotrophs. Writing Assignment: What does it mean. Last readings on Chlamydomonas populations
 Chlorophyll measured in this assay is an indicator of algae levels University College Campus Bayou Average Spring 2008 Fall 2008 0.07 0.12 0.10 0.04 Spring 2009 0.06 0.05 0.04 0.02 2009 0.05 0.07 0.12
Seasonal cycle of phytoplankton community composition off Newport, Oregon, in 2009
 Seasonal cycle of phytoplankton community composition off Newport, Oregon, in 29 Xiuning Du 1, William Peterson 2 1 College of Environmental science and Engineering, Ocean University of China, Qingdao,
Recent Harmful Algal blooms (HABs) Events in Indonesia
 Events in Indonesia") Recent Harmful Algal blooms (HABs) Events in Indonesia By Hikmah Thoha Research Center for Oceanography, Indonesian Institute of Science Indonesia What We Know, and What We Do Not Know on HABs Outline
Recent Harmful Algal blooms (HABs) Events in Indonesia By Hikmah Thoha Research Center for Oceanography, Indonesian Institute of Science Indonesia What We Know, and What We Do Not Know on HABs Outline
Prokaryotes and Kingdom Protista
 Prokaryotes and Kingdom Protista Domain Eubacteria Domain Archae The Prokaryotes Cell type: Prokaryotes Found in: Domain Bacteria Domain Archae Cell type: Prokaryotes Two Domains: Bacteria and Archae Do
Period: Date: Marine Science Midyear Exam Study Guide & Review This packet will be collected on the day of the exam for 2 HOMEWORK GRADES.
 Marine Science Midyear Exam Study Guide & Review This packet will be collected on the day of the exam for 2 HOMEWORK GRADES. Topics: Intro: the water planet; scientific method Properties of Water Tides,
Communities Structure and Dynamics
 Communities Structure and Dynamics (Outline) 1. Community & niche. 2. Inter-specific interactions with examples. 3. The trophic structure of a community 4. Food chain: primary, secondary, tertiary, and
Feeding by phototrophic red-tide dinoflagellates: five species newly revealed and six species previously known to be mixotrophic
 AQUATIC MICROBIAL ECOLOGY Vol. 4: 133 15, 25 Published September 6 Aquat Microb Ecol Feeding by phototrophic red-tide dinoflagellates: five species newly revealed and six species previously known to be
PRINCIPLE OF OCEANOGRAPHY PBBT101 UNIT-1 INTRODUCTION OF OCEANIC ENVIRONMENT. PART-A (2 Marks)
") PRINCIPLE OF OCEANOGRAPHY PBBT101 UNIT-1 INTRODUCTION OF OCEANIC ENVIRONMENT 1. Define marine ecosystem. 2. What is geography? 3. Give two Oceanic zones 4. What is sea? 5. Define oceanography? 6. Enlist
PRINCIPLE OF OCEANOGRAPHY PBBT101 UNIT-1 INTRODUCTION OF OCEANIC ENVIRONMENT 1. Define marine ecosystem. 2. What is geography? 3. Give two Oceanic zones 4. What is sea? 5. Define oceanography? 6. Enlist
2001 State of the Ocean: Chemical and Biological Oceanographic Conditions in the Newfoundland Region
 Stock Status Report G2-2 (2) 1 State of the Ocean: Chemical and Biological Oceanographic Conditions in the Background The Altantic Zone Monitoring Program (AZMP) was implemented in 1998 with the aim of
Communities Structure and Dynamics
 Communities Structure and Dynamics (Outline) 1. Community & niche. 2. Inter-specific interactions with examples. 3. The trophic structure of a community 4. Food chain: primary, secondary, tertiary, and
Ch20_Ecology, community & ecosystems
 Community Ecology Populations of different species living in the same place NICHE The sum of all the different use of abiotic resources in the habitat by s given species what the organism does what is
Long-term changes in microalgae communities on the Russian East coast with emphasis on toxic and bloom forming species
 Long-term changes in microalgae communities on the Russian East coast with emphasis on toxic and bloom forming species Tatiana Yu. Orlova, Polina A. Kameneva, Tatiana V. Morozova A.V. Zhirmunsky Institute
(review) Organization of life
 Organization of life") Marine life: the plankton Production & Energy Transfer Part of Chapter 12, Chapter 13 (review) Organization of life Prokaryotes (usually no nucleus simple life forms) Domain Archaea: : most are extremophiles
Marine life: the plankton Production & Energy Transfer Part of Chapter 12, Chapter 13 (review) Organization of life Prokaryotes (usually no nucleus simple life forms) Domain Archaea: : most are extremophiles
The Microbial World. Microorganisms of the Sea
 The Microbial World Microorganisms of the Sea Microorganisms Smallest, simplest marine organisms. Very important in evolutionary history of life on Earth. Important primary producers. Include prokaryotes
Figure 14 p.385 5/11/2016. Plankton Production and Food Webs. Plankton Production and Food Webs
 Plankton Production and Food Webs (Chapter 12) What is Plankton? Phytoplankton and Zooplankton Food Web: All the feeding relationships of a community including production, consumption, decomposition and
Life cycle strategies and occurrences of red tides of Heterosigma akashiwo and Chattonella spp. in temperate coastal sea
 Life cycle strategies and occurrences of red tides of Heterosigma akashiwo and Chattonella spp. in temperate coastal sea Ichiro Imai (Kyoto University), Shigeru Itakura, Mineo Yamaguchi Global distribution
Growth, Feeding and Ecological Roles of the Mixotrophic and Heterotrophic Dinoflagellates in Marine Planktonic Food Webs
 Ocean Sci. J. (2010) 45(2):65-91 DOI 10.1007/s12601-010-0007-2 Available online at www.springerlink.com Review Growth, Feeding and Ecological Roles of the Mixotrophic and Heterotrophic Dinoflagellates
Plankton Ch. 14. Algae. Plants
 Plankton Ch. 14 Algae Plants Plankton = Wanderer (Greek) Suspended in water column Float or weakly swim with currents Can t move against currents Producers & Consumers PHYTOPLANKTON (PLANT PLANKTON) Autotrophs
1 An Introduction to Harmful Algae
 1 An Introduction to Harmful Algae E. Granéli and J.T. Turner Harmful algae have been the subjects of scientific and societal interest for centuries. Because blooms of toxic dinoflagellates were known
Chapter 10. Marine Ecology
 Chapter 10 Marine Ecology Copyright 2016 McGraw-Hill Education. All rights reserved. No reproduction or distribution without the prior written consent of McGraw-Hill Education. Marine Ecology Ecology is
Toxic mucus traps: A novel mechanism that mediates prey uptake in the mixotrophic dinoflagellate Alexandrium pseudogonyaulax
 Harmful Algae 17 (2012) 40 53 Contents lists available at SciVerse ScienceDirect Harmful Algae jo u rn al h om epag e: ww w.els evier.c o m/lo cat e/hal Toxic mucus traps: A novel mechanism that mediates
BIOLOGICAL OCEANOGRAPHY
 BIOLOGICAL OCEANOGRAPHY AN INTRODUCTION 0 ^ J ty - y\ 2 S CAROL M. LALLI and TIMOTHY R. PARSONS University of British Columbia, Vancouver, Canada PERGAMON PRESS OXFORD NEW YORK SEOUL TOKYO ABOUT THIS VOLUME
EXAMINING ALLELOPATHIC COMPETITON OF A RED TIDE ALGA WITHIN TWO DIFFERENT MARINE COMMUNITIES
 EXAMINING ALLELOPATHIC COMPETITON OF A RED TIDE ALGA WITHIN TWO DIFFERENT MARINE COMMUNITIES A Thesis Presented to The Academic Faculty by Elizabeth McMillan In Partial Fulfillment of the Requirements
Plankton. Relationship between nutrients and Primary productivity in PS. Puget Sound s primary producers and primary consumers
 Plankton Puget Sound s primary producers and primary consumers SeaWiFS image July 9th, 2003 Relationship between nutrients and Primary productivity in PS Do nutrients limit PP in summer? Winter? NO 3 vs.
Harmful Algal Blooms (HABS) OCEA 101
 OCEA 101") Harmful Algal Blooms (HABS) OCEA 101 HARMFUL ALGAL BLOOMS The definition of a HAB is not clear-cut, since it is a societal term, not a scientific term, that describes a diverse array of blooms (both microscopic
Harmful Algal Blooms (HABS) OCEA 101 HARMFUL ALGAL BLOOMS The definition of a HAB is not clear-cut, since it is a societal term, not a scientific term, that describes a diverse array of blooms (both microscopic
Communities Structure and Dynamics
 Communities Structure and Dynamics (Outline) 1. Community & niche. 2. Inter-specific interactions with examples. 3. The trophic structure of a community 4. Food chain: primary, secondary, tertiary, and
1/24/2011. Why do we care about biomass? Direct aggregation and pulsed export is also important
 Food web structure is a key determinant on carbon fluxes: 1) Cell size and geometry influence sinking rate 2) Zooplankton repackage material and vertically migrate 3) Small cells support longer food webs
Aquatic Chemistry (10 hrs)
") Aquatic Chemistry (10 hrs) Water -The quality and quantity of water available to human have been vital factors in determining their well-being. -More then 70% of the earth is covered by water. Living cells
Aquatic Chemistry (10 hrs) Water -The quality and quantity of water available to human have been vital factors in determining their well-being. -More then 70% of the earth is covered by water. Living cells
Life on Earth
 Life on Earth By feeding, i.e. source of energy a) Autotrophs, self-feeding, e.g. plants (phyto-) b) Heterotrophs, eat others, e.g. animals (zoo-) By feeding, i.e. source of energy a) Autotrophs b)
Look For the Following Key Ideas
 Look For the Following Key Ideas * Energy flows through living systems, but matter is recycled. * Primary producers, called autotrophs, synthesize glucose by the process of photosynthesis or chemosynthesis.
Size scaling deviation in phytoplankton photosynthesis and the energy flow through a
 ICES CM2004/Q:04 Size scaling deviation in phytoplankton photosynthesis and the energy flow through a coastal ecosystem. Pedro Cermeño, Emilio Marañón, Jaime Rodríguez, Emilio Fernández, Francisco Jiménez
Management of recreational waters in relationship with harmful microalgae blooms (HAB) in the Mediterranean Sea
 in the Mediterranean Sea") EVK3-2001- 00046 WORKSHOP Management of recreational waters in relationship with harmful microalgae blooms (HAB) in the Mediterranean Sea 25 26th October 2004 Hotel Don Antonio, Peguera- Calvià, Mallorca
EVK3-2001- 00046 WORKSHOP Management of recreational waters in relationship with harmful microalgae blooms (HAB) in the Mediterranean Sea 25 26th October 2004 Hotel Don Antonio, Peguera- Calvià, Mallorca
Fluorometry Project Chlorophyll Temperature Time Series
 Fluorometry Project Ocean Institute + Scripps Institution of Oceanography Chlorophyll Temperature Time Series The California Current Long Term Ecological Research (CCE LTER) Phytoplankton Phytoplankton
Honors Biology Unit 5 Chapter 34 THE BIOSPHERE: AN INTRODUCTION TO EARTH S DIVERSE ENVIRONMENTS
 Honors Biology Unit 5 Chapter 34 THE BIOSPHERE: AN INTRODUCTION TO EARTH S DIVERSE ENVIRONMENTS 1. aquatic biomes photic zone aphotic zone 2. 9 terrestrial (land) biomes tropical rain forest savannah (tropical
CBA Practice Exam - Ecology
 CBA Practice Exam - Ecology For the following two questions, use the diagram below: 1. (TEKS 11B) The organisms in the illustration are all part of a pond community. What would likely happen to the fish
Investigating the contribution of allochthonous subsidies to kelp forests in central California
 Investigating the contribution of allochthonous subsidies to kelp forests in central California melissa m foley UCSC Institute of Marine Science and Center for Ocean Solutions system connectivity rivers
Three Domains of Life
 Three Domains of Life The Microbial World All three biological domains include microbial organisms (or microorganisms ) Although microorganisms include some of the smallest organisms, they play critical
1. The basic structural and physiological unit of all living organisms is the A) aggregate. B) organelle. C) organism. D) membrane. E) cell.
 aggregate. B) organelle. C) organism. D) membrane. E) cell.") Name: Date: Test File Questions 1. The basic structural and physiological unit of all living organisms is the A) aggregate. B) organelle. C) organism. D) membrane. E) cell. 2. A cell A) can be composed
Name: Date: Test File Questions 1. The basic structural and physiological unit of all living organisms is the A) aggregate. B) organelle. C) organism. D) membrane. E) cell. 2. A cell A) can be composed
Diarrhetic shellfish poisoning in socio-economic perspective in Prymorsky region, Russia
 Diarrhetic shellfish poisoning in socio-economic perspective in Prymorsky region, Russia Polina A. Kameneva and Tatiana Yu. Orlova A.V Zhirmunsky Institute of Marine Biology, Far Eastern Branch, Russian
Chapter 14: Primary Producers
 Chapter 14: Primary Producers Ernst Haeckel diatoms Diatom drawings by Ernst Haeckel Diatom art under a microscope slide 1 Images from Puget Sound: M. Guannel/H. van Tol 2 Images from Puget Sound: M. Guannel/H.
Production of Paralytic Shellfish Toxin (PST) by Alexandrium tamarense in response to Copepod grazing
 by Alexandrium tamarense in response to Copepod grazing") Production of Paralytic Shellfish Toxin (PST) by Alexandrium tamarense in response to Copepod grazing mage must be placed here, if Viviana used. Bravo Carvajal Erik Selander Size 55x55 mm. Align right
Production of Paralytic Shellfish Toxin (PST) by Alexandrium tamarense in response to Copepod grazing mage must be placed here, if Viviana used. Bravo Carvajal Erik Selander Size 55x55 mm. Align right
Spring time abundance and community structure of dinoflagellates in Barkley Sound, BC
 Leung, Ashley 1 Spring time abundance and community structure of dinoflagellates in Barkley Sound, BC Ashley Leung University of Washington School of Oceanography Box 357940 1503 NE Boat St, Seattle, Washington
Lecture 9+10: Buoyancy-driven flow, estuarine circulation, river plume, Tidal mixing, internal waves, coastal fronts and biological significance
 Lecture 9+10: Buoyancy-driven flow, estuarine circulation, river plume, Tidal mixing, internal waves, coastal fronts and biological significance Thermohaline circulation: the movement of water that takes
Primary Producers. Key Ideas
 Primary Producers Kelp forests are one of the ocean s most productive habitats. 1 Key Ideas Energy flows through living systems, but matter is recycled. Primary producers (autotrophs) synthesize glucose
The Origins of Eukaryotic Diversity
 http://animal.discovery.com/tvshows/monsters-insideme/videos/the-brain-eatingamoeba.htm The Origins of Eukaryotic Diversity Introduction to the protists Kingdom Protista split into as many as 20 kingdoms
Important: Write answers on your Scantron sheet, not on this page. Read carefully and do your best.
 Biology 13- Exam 1 Multiple choice. Important: Write answers on your Scantron sheet, not on this page. Read carefully and do your best. 1. The area of the ocean floor directly above the continental shelf
저작권법에따른이용자의권리는위의내용에의하여영향을받지않습니다.
 저작자표시 - 비영리 - 변경금지 2.0 대한민국 이용자는아래의조건을따르는경우에한하여자유롭게 이저작물을복제, 배포, 전송, 전시, 공연및방송할수있습니다. 다음과같은조건을따라야합니다 : 저작자표시. 귀하는원저작자를표시하여야합니다. 비영리. 귀하는이저작물을영리목적으로이용할수없습니다. 변경금지. 귀하는이저작물을개작, 변형또는가공할수없습니다. 귀하는, 이저작물의재이용이나배포의경우,
ADVANCED PLACEMENT BIOLOGY
 ADVANCED PLACEMENT BIOLOGY Description Advanced Placement Biology is designed to be the equivalent of a two-semester college introductory course for Biology majors. The course meets seven periods per week
Eukarya. Eukarya includes all organisms with eukaryotic cells Examples: plants animals fungi algae single-celled animal-like protozoa
 Eukarya Eukarya includes all organisms with eukaryotic cells Examples: plants animals fungi algae single-celled animal-like protozoa Protists Eukaryotic; but comprises its own Kingdom Protista Algae -
Marine Resources Development Foundation/MarineLab Grades: 9, 10, 11, 12 States: AP Biology Course Description Subjects: Science
 Marine Resources Development Foundation/MarineLab Grades: 9, 10, 11, 12 States: AP Biology Course Description Subjects: Science Highlighted components are included in Tallahassee Museum s 2016 program
Distribution of dinoflagellate cysts in surface sediments from the South Yellow Sea at Autumn
 Distribution of dinoflagellate cysts in surface sediments from the South Yellow Sea at Autumn Ruixiang Li, Jun Pan, and Yan Li First Institute of Oceanography, SOA, Qingdao, China Oct 24, 2009 Outline
In Vivo Monitoring of Blue-Green Algae Using Hydrolab Multi- Parameter Sondes
 In Vivo Monitoring of Blue-Green Algae Using Hydrolab Multi- Parameter Sondes Patrick A. Sanders Hach Hydromet Hydrolab and OTT Products E-Mail: psanders@hach.com What are Blue Green Algae Widely thought
Feeding by the heterotrophic dinoflagellates Gyrodinium dominans and G. spirale on the red-tide dinoflagellate Prorocentrum minimum
 MARINE ECOLOGY PROGRESS SERIES Vol. 280: 85 94, 2004 Published October 14 Mar Ecol Prog Ser Feeding by the heterotrophic dinoflagellates Gyrodinium dominans and G. spirale on the red-tide dinoflagellate
Lesson: Primary Production
 Lesson: Primary Production By Keith Meldahl Corresponding to Chapter 14: Primary Producers Microscopic phytoplankton -- tiny single-celled plants that float at the ocean s surface, are the ultimate food
Microbial Grazers Lab
 Microbial Grazers Lab Objective: Measure the rate at which bacteria are consued by predators. Overview Size based food webs Microbial loop concepts acterial predators Methods to assess icrobial grazing