MOLECULAR INSIGHTS TO CRUSTACEAN PHYLOGENY
|
|
|
- Anastasia Bell
- 5 years ago
- Views:
Transcription
 an der Mathematisch-Naturwissenschaftlichen Fakultät der Rheinischen Friedrich-Wilhelms-Universität Bonn vorgelegt von BJOERN")
1 MOLECULAR INSIGHTS TO CRUSTACEAN PHYLOGENY DISSERTATION zur Erlangung des Doktorgrades (Dr. rer. nat.) an der Mathematisch-Naturwissenschaftlichen Fakultät der Rheinischen Friedrich-Wilhelms-Universität Bonn vorgelegt von BJOERN MARCUS VON REUMONT Bonn Oktober 2009
2 Angefertigt mit der Genehmigung der Mathematisch-Naturwissenschaftlichen Fakultät der Rheinischen Friedrich-Wilhelms-Universität Bonn. Diese Dissertation wurden am Zoologischen Forschungsmuseum Alexander Koenig in Bonn durchgeführt. Tag der mündlichen Prüfung Erscheinungsjahr 2010 Betreuer Prof. Dr. Johann-Wolfgang Waegele Prof. Dr. Bernhard Y. Misof
![[ ] Make up your mind, plan before and follow that plan. [ ] An unforgivenable sin is quitting. Never give up and keep on going. The only struggle should be to solve the problem or survive.](/docs-images/88/115870114/images/3-0.jpg "[ ] Focus on the task and on the moment.")
3 [ ] Make up your mind, plan before and follow that plan. [ ] An unforgivenable sin is quitting. Never give up and keep on going. The only struggle should be to solve the problem or survive. [ ] Focus on the task and on the moment. [ ] Excerpts of a cave diving manual This basic philosophy for cave diving is not only useful in cave diving but also generally in live and was indeed helping not only once conducting this thesis. And while diving Dedicated to my family and all good friends a permanent, safe mainline
4 Contents Molecular insights to crustacean phylogeny CONTENTS SUMMARY / ZUSAMMENFASSUNG 1. INTRODUCTION CRUSTACEANS AND THEIR CONTROVERSIAL PHYLOGENY A SHORT OVERVIEW CONTRADICTING PHYLOGENY HYPOTHESES OF MAJOR CRUSTACEAN GROUPS EARLY CONCEPTS OF ARTHROPODS AND MAJOR CLADES IN A MODERN BACKGROUND QUINTESSENCE OF RECENT ARTHROPOD STUDIES METHODOLOGICAL BACKGORUND THE FUNDAMENT OF ALL MOLECULAR ANALYSES TAXON CHOICE & 14 ALIGNMENT RECONSTRCUTION SINGLE GENE DATA INCORPORATING BACKGROUND KNOWLEDGE TO rrna ANALYSES PHYLOGENOMIC DATA A GENERAL OVERVIEW AIMS OF THE THESIS SHORT INTRODUCTION AND OVERVIEW OF ANALYSES [A-C] MATERIAL AND METHODS SPECIES CHOICE, COLLECTION AND FIELDWORK LABORATORY METHODS DATA ANALYSES METHODS PRIOR TO PHYLOGENETIC TREE RECONSTRUCTION SEQUENCE PROCESSING AND QUALITY CONTROL MULTIPLE SEQUENCE ALIGNMENT ALIGNMENT OPTIMIZATION BASED ON SECONDARY STRUCTURE INFORMATION EVALUATING STRUCTURE AND SIGNAL BY NETWORK RECONSTRUCTION ALIGNMENT EVALUATION AND PROCESSING ANALYSES [A] CAN 16S, 18S AND COI IMPROVE CRUSTACEAN PHYLOGENY WITHIN 35 ARTHROPODS? COMPARING USUAL STANDARD VS. SECONDARY STRUCTURE BASED APPROACHES OBJECTIVES TAXON SAMPLING ANALYSIS DESIGN PHYLOGENETIC TREE RECONSTRUCTION ANALYSIS [B]: IS IMPLEMENTATION OF SECONDARY STRUCTURE BASED ALIGNMENT 40 OPTIMIZATION AND TIME-HETEROGENEITY A SOLUTION TO SOLVE PHYLOGENY WITHIN ARTHROPODS? OBJECTIVES TAXON SAMPLING ANALYSIS DESIGN PHYLOGENETIC TREE RECONSTRUCTION ANALYSES [C]: ENLIGTHS PHYLOGENOMIC DATA CRUSTACEAN PHYLOGENY WITHIN ARTHROPODS 46 OR STICK OLD PROBLEMS TO THE ANALYSES OF THIS NEW LARGE SCALE DATA? OBJECTIVES TAXON SAMPLING ANALYSIS DESIGN PHYLOGENETIC TREE RECONSTRUCTION 53
5 Molecular insights to crustacean phylogeny Contents 2.7 ANALYSIS OF HEMOCYANIN STRUCTURE IN REMIPEDIA OBJECTIVES ANALYSIS DESIGN PHYLOGENETIC TREE RECONSTRUCTION RESULTS ANALYSES [A] CAN 16S, 18S AND COI IMPROVE CRUSTACEAN PHYLOGENY WITHIN 57 ARTHROPODS? COMPARING USUAL STANDARD VS. SECONDARY STRUCTURE BASED APPROACHES DATA SIGNAL AND SPLIT SUPPORTING PATTERNS BASE COMPOSITIONS PHYLOGENETIC RECONSTRUCTION PROBLEMATICS OF THE DATA ANALYSIS [B]: IS IMPLEMENTATION OF SECONDARY STRUCTURE BASED ALIGNMENT 66 OPTIMIZATION AND TIME-HETEROGENEITY A SOLUTION TO SOLVE PHYLOGENY WITHIN ARTHROPODS? FINAL DATASET AND SPLIT SUPPORTING PATTERNS COMPOSITIONAL HETEROGENEITY OF BASE FREQUENCY PHYLOGENETIC MODEL TESTING & RECONSTRUCTIONS RESULTING TOPOLOGIES ANALYSES [C]: ENLIGTHS PHYLOGENOMIC DATA CRUSTACEAN PHYLOGENY WITHIN ARTHROPODS 75 OR STICK OLD PROBLEMS TO THE ANALYSES OF THIS NEW LARGE SCALE DATA? RESULTING TOPOLOGY OF THE UNREDUCED DATASET RESULTING TOPOLOGIES OF THE REDUCED, OPTIMAL DATA SUBSET DIFFERENCES IN ML AND BAYESIAN TOPOLOGIES OGF THE REDUCED DATA SUBSET PROBLEMATICS IN RESULTING TOPOLOGIES OF THE BAYESIAN CHAINS ANALYSIS OF HEMOCYANIN STRUCTURE IN REMIPEDIA PHYLOGENETIC RECONSTRUCTION AND RESULTING TREE DISCUSSION SEPARATE METHODOLOGICAL DISCUSSION OF ANALYSIS [A-C] ANALYSES [A] ANALYSES [B] ANALYSES [C] PANCRUSTACEAN PHYLOGENY DISCUSSION ARTHROPOD PHYLOGENY DISCUSSION GENERAL MEHTODOLODICAL DISCUSSION CONCLUSIONS AND FURTHER ASPECTS REFERENCES ABREVIATIONS INDEX OF FIGURES AND TABLES ACKNOWLEDGEMENT SUPPLEMENT I 10. CURRICULUM VITAE ERKLÄRUNG

6 Above picture: Derocheilocaris typicus, a specimen of the Mystacocarida Cover picture: Some of the rather small but beautiful crustaceans (from above left: Branchiura, Mystacocarida, Copepoda, Ostracoda, Cladocera, Branchiopoda and Remipedia.
7 Molecular insights to crustacean phylogeny Abstract / Zusammenfassung ABSTRACT A key role in arthropod phylogeny plays a group of organisms that was already in the focus of taxonomic research of Charles Darwin in the mid of the 19 th century, namely the Crustacea. This extremely divers group comprises small species like the Mystacocarida (Derocheilocaris typicus) with only 0.3 mm body size or such big representatives like the Japanese giant crab (Macrocheira kaempferi) with a span width of almost 4 m. Generally accepted are six major crustacean taxa, the Malacostraca (Latreille, 1802), Branchiopoda (Latreille, 1817), Remipedia (Yager, 1981), Cephalocarida (Sanders, 1955), Maxillopoda (Dahl, 1956) and Ostracoda (Latreille 1802). The validity of the taxon Maxillopoda is to date still disputed. The monophyly of some crustacean groups like the Malacostraca and Branchiopoda is generally accepted, but for several other groups unclear. This thesis aims to resolve internal relationships of the major crustacean groups inferring phylogenies with molecular data. The crustaceans are in addition of eminent interest to enlight the question how land was successfully conquered by arthropod taxa. New molecular and neuroanatomical data support the scenario that the Hexapoda might have evolved from Crustacea. The thesis further seeks to address the possible close relationship of Crustacea and Hexapoda. That issue is closely linked to the partly still debated position of crustaceans within arthropods and the supposable sister-group of the Crustacea. Most molecular studies of crustaceans relied on single gene or multigene analyses in which for most cases partly sequenced rrna genes were used. However, intensive data quality and alignment assessments prior to phylogenetic reconstructions are not conducted in most studies. Additionally, a complex modeling and the implementation of compositional base heterogeneity along lineages are missing. One methodological aim in this thesis was to implement new tools to infer data quality, to improve alignment quality and to test the impact of complex modeling of the data. Two of the three phylogenetic analyses in this thesis are also based on rrna genes. In analysis (A) 16S rrna, 18S rrna and COI sequences were analyzed. RY coding of the COI fragment, an alignment procedure that considers the secondary structure of RNA molecules and the exclusion of alignment positions of ambiguous positional homology was performed to improve data quality. Anyhow, by extensive network reconstructions it was shown that the signal quality in the chosen and commonly used markers is not suitable to infer crustacean phylogeny, despite the extensive data processing and optimization. This result draws a new light on previous studies relying on these markers. In analyses (B) completely sequenced 18S and 28S rrna genes were used to reconstruct the phylogeny. Base compositional heterogeneity was taken into account based on the finding of analysis (A), additionally to secondary structure alignment optimization and alignment assessment. The complex modeling to compare time-heterogeneous versus timehomogenous processes in combination with mixed models for an implementation of secondary structures was only possible applying the Bayesian software package PHASE. The results clearly demonstrated that complex modeling counts and that ignoring time-
8 Abstract / Zusammenfassung Molecular insights to crustacean phylogeny heterogeneous processes can mislead phylogenetic reconstructions. Some results enlight the phylogeny of Crustaceans, for the first time the Cephalocarida (Hutchinsoniella macracantha) were placed in a clade with the Branchiopoda, which morphologically is plausible. Unfortunately, the internal relationships of most crustacean groups were still poorly supported. Compared to the time-homogeneous tree the time-heterogeneous tree gives lower support values for some nodes. It can be suggested, that the incorporation of base compositional heterogeneity in phylogenetic analysis improves the reliability of the topology. The Pancrustacea are supported maximally in both approaches, but internal relations are not reliably reconstructed. One result of this analysis is that the phylogenetic signal in rrna data might be eroded for crustaceans. Recent publications presented analyses based on phylogenomic data, to reconstruct mainly metazoan phylogeny. Analyzing such a large number of sequences is possible with the supertree or supermatrix method. The supermatrix method seems to outperform the supertree approach. One main advantage is the possibility to apply modeling for each partition (each gene) separately. Within this thesis crustaceans were collected to conduct EST sequencing projects and to include the resulting sequences combined with public sequence data into a phylogenomic analysis (C). In this analysis the supermatrix approach was applied. New and innovative reduction heuristics were performed to condense the dataset. The strategy of the reduction heuristics relies on the potential relative information content of each gene of each taxon to use a more objective criterion to select taxa and genes. Again, the alignment evaluation and processing was a major aspect for the analysis design. The results showed that the matrix implementation of the reduced dataset ends in a more reliable topology in which most node values are highly supported. In analysis (C) the Branchiopoda were positioned as sister-group to Hexapoda, a differing result to analysis (A), but that is in line with other phylogenomic studies. Unfortunately, important crustacean taxa are still missing to conduct an extensive phylogenomic analysis. Some EST sequencing projects of the collected crustaceans for this thesis were delayed for technical reasons, e.g. the ESTs for Sarsinebalia urgorrii (non-derived malacostracan) and Speleonectes tulumensis (Remipedia) are still in progress. A preliminary result obtained with sequences isolated from remipede tissue is suggesting that remipedes and hexapods are closely related based on homologous hemocyanin subunits. The conclusion of the analyses conducted in the framework of this thesis is that alignment evaluation and processing improves the resulting inference of the phylogeny. Assessing the quality of the signal or potential conflicts in the dataset is extremely important, also for further decisions on the selection of substitution models and final phylogenetic reconstructions. Complex models can improve the phylogeny reconstruction additionally. This was explicitly demonstrated in analysis B. The supermatrix approach relying on a more objective criterion to select genes and taxa compared to cut-off values is very promising for future studies. However, for the Crustacea it was also demonstrated that this group is problematic regarding the phylogenetic signal of the analyzed single gene data. The hope is, that phylogenomic data with similar complex models as applied in analysis B, in combination
9 Molecular insights to crustacean phylogeny Abstract / Zusammenfassung with a denser taxon sampling can improve our knowledge about crustacean phylogeny in future studies. This thesis presents essential new methodological but also phylogenetic findings for this challenging task. ZUSAMMENFASSUNG Eine Schlüsselrolle in der Evolution der Arthropoda spielen die Krebse (Crustacea), einige Krebsgruppen waren bereits Studienobjekt seitens Charles Darwins in der Mitte des 19. Jahrhunderts. Die Crustacea sind eine extrem diverse Gruppe und umfassen so kleine Arten wie die Mystacocarida (Derocheilocaris typicus) von nur 0.3 mm Körpergröße und so große Arten wie die Japanische Riesenkrabbe mit fast 4 m Spannweite. Allgemein anerkannt sind sechs Großgruppen der Crustacea, die Malacostraca (Latreille, 1802), Branchiopoda (Latreille, 1817), Remipedia (Yager, 1981), Cephalocarida (Sanders, 1955), Maxillopoda (Dahl, 1956) und Ostracoda (Latreille 1802). Die Maxillopoda sind als valides Taxon recht umstritten. Die Monophylie einiger Gruppen der Crustacea, wie z.b. der Malacostraca und Branchiopoda ist allgemein akzeptiert, für die meisten Gruppen jedoch noch immer unklar. Diese Doktorarbeit soll unter anderem die größtenteils noch unklaren Verwandschaftsverhältnisse zwischen den Gruppen der Crustacea mit molekularen Methoden untersuchen. Die Crustacea sind zusätzlich von großem Interesse, um die Frage zu beantworten, wie die Arthropoda so erfolgreich das Land besiedeln konnten. Neuere Ergebnisse von molekularen und neuroanatomischen Studien unterstützen ein Szenario, in welchem die Hexapoda von den Crustacea abstammen. Die Frage, ob Hexapoda nah verwandt mit den Crustacea sind und eventuell aus diesen evolvierten, soll ebenfalls in der Arbeit untersucht werden. Eng verbunden mit dieser Frage ist die teilweise noch immer diskutierte Stellung der Crustacea innerhalb der Arthropoda. Die Analysen der meisten Studien zur Phylogenie der Crustacea basieren auf Einzelgenen, oder Multigenanalysen mit nur wenigen Genen. Ribosomale RNA Gene wurden besonders häufig hierfür verwendet. Allerdings erfolgte nur in den wenigsten Studien auch eine Analyse bezogen auf Qualität der Daten und im Besonderen des Alignments. Hinzu kommt, dass eine komplexe Modellierung der Daten und vor allem die Implementierung der Inhomogenität der Basenkompositionen in den meisten Analysen fehlt. Ein methodisches Ziel in dieser Arbeit war neue Methoden und Werkzeuge zu verwenden um Daten und Alignmentqualität zu evaluieren und zu verbessern, bei gleichzeitiger Verwendung von komplexen Modellierungen. In zwei von den drei hier vorgestellten Analysen, werden auch rrna Gene verwendet. In Analyse (A) wurden 16S rrna, 18S rrna und COI Sequenzen analysiert. RY Kodierung für das COI Fragment, ein mittels Sekundärstrukturen optimiertes Alignment und der Ausschluss von zufällig gleich alinierten Positionen im Alignment dienten der Verbesserung der Qualität der Daten. Allerdings wurde durch die Verwendung von Netzwerk Rekonstruktionen gezeigt, dass die verwendeten molekularen Marker nur eingeschränkt geeignet sind, um die
10 Abstract / Zusammenfassung Molecular insights to crustacean phylogeny Phylogenie der Crustacea zu beleuchten. Dieses Ergebnis lässt die bisherigen Studien, die zum großen Teil auf diesen Markern beruhen, in einem anderen Licht erscheinen. In Analyse (B) wurden deshalb vollständig sequenzierte Sequenzen von 18 und 28S rrna zur phylogenetischen Rekonstruktion verwendet. Inhomogene Basenkomposition wurde berücksichtigt und analog zu Analyse (A) erfolgte ein sekundärstruktur-optimiertes Alignment mit anschließender Evaluierung des Alignments, um zufällig ähnliche Positionen im Alignment zu exkludieren. Das Anwenden von komplexen Modellen zum Vergleich von zeithomo- und zeitheterogenen Prozessen war in Kombination mit der Implementierung von gemischten Modellen zur realistischen Darstellung von Sekundärstrukturen nur mit der Software PHASE möglich. Die Ergebnisse aus dieser Analyse machen deutlich, dass komplexes Modellieren extrem wichtig ist, und das stillschweigende Ignorieren von zeit-heterogene Prozessen die Baumrekonstruktion beeinflussen kann. Einige der Ergebnisse werfen neues Licht auf die Evolution der Crustacea, zum ersten Mal wurde Hutchinsoniella macracantha (Cephalocarida) zu den Branchiopoda gestellt, was morphologisch recht plausibel ist. Leider wurden die internen Knoten für die Krebse in beiden Ansätzen schlecht aufgelöst. Die Pancrustacea wurden aber in beiden Ansätzen maximal unterstützt. Es ist zu vermuten, dass im zeitheterogenen Ansatz eine realistischere, partiell nicht gut gestützte Topologie rekonstruiert wurde. Allerdings ist auch ein klares Ergebnis dieser Analyse, dass die rrna Daten nur gering zur Aufklärung der Crustacea Phylogenie beitragen können, ihr Signal ist für diese Gruppe offensichtlich stark erodiert. Neuere Studien (überwiegend zur Metazoa Evolution) basieren auf phylogenomischen Daten. Das Analysieren solch großer Datensätze ist mittels der Supertree oder Supermatrix Methode möglich. Momentan ist die Supermatrix Methode performanter, vor allem ist ein Vorteil, dass die Partitionen (Gene) getrennt durch verschiedene Modelle beschrieben werden können. Im Rahmen dieser Doktorarbeit wurden Crustacea gesammelt um EST Sequenzierungsprojekte durchzuführen und eine phylogenomische Analyse zu starten In Analyse (C) wurden die Sequenzdaten auch von publizierten EST und Genomprojekten mittels des Supermatrix Ansatzes untersucht. Hierfür wurde eine neue Strategie angewandt, die über den relativen Informationsgehalts der Gene, Gene und Taxa aussucht. Uninformative Gene werden exkludiert, Taxa die nur solche Gene aufweisen, ebenfalls. Ein weiterer wichtiger Punkt war wieder die Qualität der Daten und des Alignments, analog zu Analysen (A) und (B). Das Ergebnis zeigt, dass die Reduktion des Datensatzes mit der neuen Methode eine plausiblere und besser gestützte Topologie zur Folge hat. In dieser Analyse sind die Branchiopoda die Schwestergruppe zu den Hexapoda, was Analyse (B) widerspricht. Allerdings ist dieses Ergebnis kongruent zu anderen phylogenomischen Daten. Leider fehlen zu einer klaren Aussage zur Phylogenie der Crustacea noch einige Crustacea Arten in den phylogenomischen Analysen. Einige geplante EST Sequenzierungsprojekte, von im Rahmen dieser Arbeit gesammelten Arten, haben sich aus technischen Gründen verzögert. Dies sind z.b. Sarsinebalia urgorrii (Malacostraca) und Speleonectes tulumensis (Remipedia). Ein vorläufiges Ergebnis aus den EST Daten der
11 Molecular insights to crustacean phylogeny Abstract / Zusammenfassung Remipedia war der Fund von Hämocyanin Untereinheiten, die auf eine nahe Verwandtschaft von Remipedia und Hexapoda schließen lassen. Die Analysen, die im Rahmen dieser Arbeit durchgeführt wurden, zeigen deutlich, dass Alignment, Evaluierung und Optimierung die resultierenden Baumrekonstruktionen verbessern. Ein Überprüfen der Datenqualität und der Qualität des Signals für den jeweiligen Datensatz ist von enormer Wichtigkeit. Einen ähnlich großen Einfluss können komplexe Modelle haben, wenn Prozesse wie inhomogene Basenkomposition auftreten. Der Supermatrix Ansatz ist vielversprechend für weitere Studien. Gene und Arten nach einem objektiven Kriterium (relativer Informationsgehalt) auszuwählen, worauf die so kondensierten Datensets in eine finale Analyse einfließen, resultiert in robusteren Phylogenien, anstatt mit Schwellenwerten zu arbeiten. Es wurde jedoch auch gezeigt, dass die Crustacea eine recht problematische Gruppe sind. Eventuell durch ihr Alter scheint das phylogenetische Signal in den durchgeführten Einzelgenanalysen stark erodiert zu sein. Die phylogenomischen Daten sind zurzeit nicht ganz aussagekräftig, da noch immer viele Taxa der Crustacea fehlen. Zu hoffe ist, dass komplexes Modellieren in Kombination mit einer guten Artenauswahl in weiteren phylogenomischen Analysen unsere Einsichten in die Evolution der Crustacea verbessert. Mit dieser Arbeit wurde unter anderem für diese weiteren Analysen eine wichtige methodische aber auch phylogenetische Basis geschaffen.
12
13 1. INTRODUCTION Evolutionary biology, in contrast with physics and chemistry, is a historical science, the evolutionist attempts to explain events and processes that have already taken place. Laws and experiments are inappropriate techniques for the explication of such events and processes. Instead one constructs a historical narrative, consisting of a tentative reconstruction of the particular scenario that led to the events one is trying to explain ERNST MAYR. In the Darwin-year 2009 evolution draws a special attention to the public audience. The evolutionary processes resulted in the diversity of species we find today on our planet. One of the most diverse invertebrate groups are the Arthropoda. A persistent challenge in phylogenetic systematics concerns the evolution and genealogical relationships of the Arthropoda. The evolution of this group is debated since the 19 th century a debate that started yet in the times of CHARLES DARWIN. Today it is still unclear how land and air were successfully conquered by arthropods. Their evolutionary success was accompanied by astounding transitions of body plan organisations, evolving more than three times as many species compared to other multicellular organisms. Currently hypotheses are conflicting to explain the successful evolution of the arthropods. Crustaceans may play a key role in the scenario how arthropods colonized land. Possibly freshwater crustaceans (Branchiopoda) constituted a link to early hexapods starting to crawl on land (GLENNER ET AL. 2006) or the enigmatic crustacean group Remipedia evolved from ancestors shared with the Tracheata (FANENBRUCK 2003). The phylogenetic relationships of the five major traditional euarthropod groups, the Hexapoda, Myriapoda, Crustacea, Chelicerata, and the extinct Trilobitomorpha, are debated since the 19th century (e.g. LANKESTER 1904; LATREILLE 1817; POCOCK 1893A; POCOCK 1893B). Although arthropod phylogeny has long been debated based on morphological and developmental evidence (BÄCKER ET AL. 2008; BITSCH & BITSCH 2004; HARZSCH 2006; UNGERER & SCHOLTZ 2008) there is since several years additionally a strong focus on results from molecular data, derived from mitochondrial, nuclear and phylogenomic datasets (BOORE ET AL. 1995; HASSANIN 2006; MALLATT ET AL. 2004; MALLATT & GIRIBET 2006; DUNN ET AL. 2008; ROEDING ET AL. 2007). Crustaceans are of eminent interest for the study of arthropod phylogeny since molecular analyses often reveal this clade paraphyletic in respect to hexapods (e.g. REGIER & SHULTZ 2001; BABBITT & PATEL 2005; MALLATT & GIRIBET 2006). The position of crustaceans within arthropods is controversially discussed in classical morphological concepts positioning them as sister-group to Tracheata (SNODGRASS 1935), Chelicerata (CISNE 1974) or Hexapoda 1
14 1. Introduction Molecular insights to crustacean phylogeny (PAULUS 1979; ZRZAV & TYS 1997; ZRZAV & TYS 1998A). Morphologically crustaceans are extremely divers and internal relationships are still unclear (e.g. MARTIN & DAVIS 2001). At the morphological front a standoff situation is created by conflicting hypotheses. One reason for this might be that crustaceans are a very old group, at least 500 million years old (e.g. WALOSSEK 1993, SIVETER ET AL. 2001, see contrary BUDD ET AL. 2001). New insights from developmental or neurobiological studies create an even more chaotic picture of crustacean phylogeny and their position within arthropods instead of enlighting this field. The hope that molecular studies could enhance the understanding of crustacean evolution in complementing and directing the contradicting morphological disputes was often disappointed. Instead, molecular studies contribute in many cases to contradicting scenarios of crustacean and arthropod evolution compared to other molecular but also morphological studies. Yet SPEARS AND ABELE (1998) mentioned the problems to select and interpret useful phylogenetic characters to infer crustacean phylogeny. They conclude that rapid radiation in younger crustacean lineages (see WÄGELE ET AL. 2003) but also the older arthropod nodes are problematic to reconstruct by molecular analysis. One has to keep in mind that due to the age of this group molecular analyses of crustaceans might operate at their limit because this long time span led to signal erosion in the sequences by several, multiple substitutions (WÄGELE & MAYER 2007; WÄGELE ET AL. 2009). A careful choice of molecular markers and molecular methods in combination with a rigorous quality assessment of the data and tree reconstruction methods is for this reason crucial. Especially the new field of phyolgenomics burgeoned the hope that stochastic errors of previous multi-gene analyses disappear and can enlight molecular phylogeny of crustaceans and arthropod. 1.1 Crustaceans and their controversial phylogeny a short overview The revelation of the internal phylogenetic relationships is not equal across the major extant arthropod taxa. A conspicuous relative lack of both attention and progress in understanding the phylogeny of the Crustacea exists compared to work on the higher-level phylogeny of hexapods, chelicerates and myriapods. Phylogenetic hypotheses about the evolution of body plan diversity of crustaceans are still chiefly based on morphological evidence (e.g., DAHL 1963; SCHRAM 1986; WILSON 1992; SCHRAM & HOF 1998; WILLS 1998; SCHRAM & KOENEMANN, 2004B), with little detailed consensus. Higher-level crustacean molecular phylogenetics started relatively late effectively in the late 1980s and 1990s by ABELE and SPEARS. There is cumulating morphological and molecular evidence that Crustacea s. str. may represent a paraphyletic assemblage of arthropods (MALLATT ET AL. 2004; MALLATT & GIRIBET 2006; REGIER ET AL 2005; RICHTER 2002; HARZSCH 2006). The concept of a hexapodcrustacean clade, Pancrustacea or Tetraconata, has been proposed independently in a number of studies (e.g. REGIER & SHULTZ 1997; SPEARS & ABELE 1998; ZRZAV AND TYS 1997; 2
15 Molecular insights to crustacean phylogeny 1. Introduction GARCHIA-MACHADO ET AL. 1999; LAVROV ET AL. 2004; SCHRAM & KOENEMANN 2004B; COOK ET AL. 2005; REGIER ET AL. 2008) regardless if a para- or polyphyletic crustacean clade is inferred. With respect to extant taxa this means that hexapods are positioned within Crustacea, although it remains unclear to which extant the crustacean taxon Hexapoda would be closely related. Six crustacean classes (figure 1.1) are recognized by MARTIN AND DAVIS (2001): Malacostraca, Branchiopoda, Remipedia, Cephalocarida, Maxillopoda and Ostracoda. To date the most comprehensive higher-level phylogenetic analyses within Crustacea focus only on few groups, mainly Malacostraca (JENNER ET AL. 2009; MELAND & WILLASSEN 2007; SPEARS ET AL. 1992; 2005), Branchiopoda (BRABAND ET AL. 2002; DEWAARD ET AL. 2006; RICHTER ET AL. 2007; STENDERUP ET AL. 2006) and Thecostraca (PÉREZ-LOSADA ET AL. 2008; PÉREZ- LOSADA ET AL. 2004, see section Maxillopoda). These and larger-scale studies support the monophyly of Branchiopoda, Malacostraca and Thecostraca. Remipedia and Cephalocarida are both considered monophyletic (MARTIN AND DAVIS 2001; KOENEMANN ET AL. 2007), but their phylogenetic positions remain unknown. In most studies (GIRIBET ET AL. 2001; REGIER ET AL. 2005) the clade of both taxa is reconstructed which might be influenced by the predominant long branches these taxa show in molecular analyses. Remipedes were described as most primitive crustaceans (SCHRAM 1983; 1986). However, results of neuroanatomical studies place remipedes as sister-group to Hexapoda (FANENBRUCK ET AL. 2004; FANENBRUCK & HARZSCH 2005) or Tracheata (FANENBRUCK 2003). The proposed clade Tracheata + Remipedia was named Archilabiata-hypothesis by FANENBRUCK (2003). Maxillopoda are presented in MARTIN AND DAVIS (2001) as a continuously terribly controversial assemblage. A similar taxon was earlier named Copepodoidea (BEKLEMISHEV 1952) with almost the same taxa included as in MARTIN & DAVIS (2001). A monophyletic Maxillopoda in the composition first proposed by DAHL (1956) seems increasingly doubtful (overview in: MARTIN & DAVIS 2001), although maxillopodan monophyly is suggested on the basis of some morphological evidence (WALOSSEK & MÜLLER 1998B; WILLS 1998; AX 1999). Excluding the Ostracoda, their positioning in Maxillopoda is doubted by molecular (ABELE 1992; SPEARS & ABELE 1998) and morphological data (WILSON 1992), this assemblage is constituted by the eight taxa: Copepoda, Mystacocarida, Branchiura, Thecostraca, Facetotecta, Ascothoracica, Cirripedia and Pentastomida. There are morphological studies that disagree (SCHRAM & KOENEMANN 2004B) and molecular evidence that contradicts maxillopodan monophyly (SPEARS & ABELE 1998; REGIER ET AL. 2005; 2008). Already BOXSHALL (1983) claimed that Maxillopoda is not a valid taxon which is underpinned by these recent analyses. However, although various studies include samples of maxillopod taxa, to date no broadly sampled molecular maxillopodan phylogeny is available. 3
, a leptostracan as representative of the early Malacostraca.")
16 1. Introduction Molecular insights to crustacean phylogeny Figure 1.1: Representatives of six major crustacean classes. A: Sarsinebalia urgorrii (MOREIRA, GESTOSO & TRONCOSO, 2003), a leptostracan as representative of the early Malacostraca. B: The branchiopods Triops cancriformis (BOSC, 1801) and Daphnia magna (STRAUS, 1820). C: Hutchinsoniella macracantha (SANDERSON, 1955), a cephalocarid. D: Speleonectes tulumensis (YAGER, 1987), Remipedia (picture kindly provided by KOENEMANN). E: Derocheilocaris typica (PENNAK & ZINN, 1943), Mystacocarida as representative of the copepodan lineage of the Maxillopoda. F: Semibalanus balanoides (LINNAEUS, 1758) and Pollicipes pollicipes (GMELIN, 1789) representing the thecostracan lineage of the Maxillopoda. G: Specimens of Heterocypris incongruens (RAMDOHR 1808), a freshwater ostracod. 4
17 Molecular insights to crustacean phylogeny 1. Introduction Cirripedia were affirmed in extensive, recent studies (HØEG ET AL. 2009; PÉREZ-LOSADA ET AL. 2008) as monophyletic, within the clade Thecostraca (Cirripedia (Acrothoracica (Ascothoracica + Facetotecta))). Thecostraca were subject of previous studies (PÉREZ-LOSADA ET AL. 2008; PÉREZ-LOSADA ET AL. 2004) that support the monophyly of this clade by the same type of head-shield organ, the lattice organ (GRYGIER 1987; JENSEN ET AL. 1994; HOEG & KOLBASOV 2002). Pentastomida are by now generally included into Maxillopoda, supported by molecular studies based on 18S and 28S rrna (ABELE ET AL. 1989; MALLATT & GIRIBET 2006) and mitochondrial data (COOK ET AL. 2005; LAVROV ET AL. 2004). Also morphological (WINGSTRAND 1972) and combined morphological and molecular data (MØLLER ET AL. 2008) affirm these findings and position Pentastomida as sister-group to the Branchiura. However, there are morphological studies that contradict these hypotheses based on fossils of the Upper Cambrian Orsten which place the Pentastomida outside the Euarthropoda (DE OLIVIERA ALMEIDA ET AL. 2008; WALOSZEK ET AL. 2005; WALOSZEK ET AL. 2006). Ostracoda are traditionally considered monophyletic (MARTIN & DAVIS 2001), consistent with a recent morphological phylogenetic analysis (HORNE ET AL. 2005). Molecular evidence instead unites podocopid ostracodes more closely with branchiurans (and possibly pentastomids) than with myodocopids (SPEARS & ABELE 1998; REGIER ET AL. 2005; 2008). Finally, it has to be stated again, that a consensus of the positions or even a generally accepted phylogeny of the crustacean groups is not yet in sight (see figure 1.2). There exist so many different hypotheses, that an obscure jungle of trees demands some thin out of this chaos. In this background the tested, main hypotheses discussed in this thesis are pictured in the next section. 5
. Ostracoda are contrary excluded from Maxillopoda in some studies (ABELE ET AL.")
18 1. Introduction Molecular insights to crustacean phylogeny Figure 1.2: Conflicting hypotheses of crustacean phylogeny. The Van-Venn diagram shows the unclear internal relationships of the Crustacea. The Pentastomida are included to Maxillopoda in recent studies (SPEARS & ABELE 1998, MØLLER ET AL. 2008). Ostracoda are contrary excluded from Maxillopoda in some studies (ABELE ET AL. 1992; SPEARS & ABELE 1998). 1.2 Contradicting phylogeny hypotheses of major crustacean groups Entomostraca: All non-malacostracan taxa except the Remipedia are often combined in the taxon Entomostraca. Most of these groups are represented by species of very small body size (e.g. Mystacocarida [~0.2 mm]; Copepoda [~0.7-2 mm]) and therefore harder to collect, sort and to study. WALOSZEK (WALOSSEK & MÜLLER 1998A+B; WALOSSEK 1999) proposes a set of morphological characters that are described as autapomorphies of Entomostraca. Malacostraca are placed as sister group to the Entomostraca. Malacostraca are usually regarded to be a monophyletic taxon (SPEARS & ABELE 1998; GIRIBET & RIBERA 2000; JENNER ET AL. 2009; MELAND & WILLASSEN 2007; SPEARS ET AL. 1992; 2005). Several authors suggest that Malacostraca evolved later within Crustacea as a more derived crustacean group (FANENBRUCK 2003; FANENBRUCK ET AL. 2004; RICHTER & SCHOLTZ 2001). The malacostracan phylogeny is controversial for few internal groupings (RICHTER & SCHOLTZ 2001; JENNER ET AL. 2009). 6
 proposed this clade including Cephalocarida, Branchiopoda and Malacostraca based on the existence on an epipodite (see also HESSLER 1982; 1992).")
19 Molecular insights to crustacean phylogeny 1. Introduction Thoracopoda: HESSLER & NEWMAN (1975) proposed this clade including Cephalocarida, Branchiopoda and Malacostraca based on the existence on an epipodite (see also HESSLER 1982; 1992). This concept is clearly in conflict with the Entomostraca concept. EDGECOMBE ET AL. (2000) confirmed monophyletic Thoracopoda, using a dataset with morphological characters and two gene sequences. Later, ZHANG ET AL. (2007) questioned the existence of an epipodite as character for Thoracopoda. This study describes the existence of epipodites for Cambrian fossils (Yicaris dianensis). The authors conclude a groundpattern of Eucrustacea including epipodites contradicting the Thoracopoda concept. Figure 1.3: Cladograms representing the most commonly suggested, competing relationships of Crustacea. A: Entomostraca-concept as postulated by WALOSSEK (1999). Remipedes are not within 7
20 1. Introduction Molecular insights to crustacean phylogeny crustaceans according to Waloszek. He describes a copepodan and thecostracan lineage of the Maxillopoda. Pentastomida are considered as Arthropoda sensu latu and not Crustacea. B: Thoracopoda-concept after HESSLER (1992) based on the character of an existing epipodite. C: Archilabiata-concept presented by FANENBRUCK (2003), see 1.1. At the moment molecular and neuroanatomical evidence favors a polyphyletic clade of Malacostraca, Remipedia, Atelocerata instead of Archilabiata. Unclear positions of taxa in phylogeny hypothesis A-C are represented by dotted lines. 1.3 Early concepts of arthropod phylogeny and major arthropod clades in a modern background Several of the familiar higher-level groupings, such as Atelocerata (= Tracheata), Uniramia, and Mandibulata have their origin as far back as the 19 th century. Since then a lot of hypotheses of rejection and evaluation of these taxa marked this area of phylogeny. In the following section main hypotheses around these taxa are described in more detail. Pancrustacea (=Tetraconata): In contrast to the Tracheata, the hypothesis of a clade, consisting of Crustacea and Hexapoda was championed by PAULUS (1979) and confirmed by molecular data (FRIEDRICH & TAUTZ 1995). ZRZAV & TYS (1997) named this clade Pancrustacea, a term used in several molecular studies (FRIEDRICH & TAUTZ 2001; GIRIBET ET AL. 2001; HWANG ET AL. 2001; REGIER & SHULTZ 2001; SHULTZ & REGIER 2000). DOHLE (2001) advocated the Tetraconata concept based on the structure of the ommatidia and postulated monophyletic Crustacea and Hexapoda as sister groups. Today both terms are mostly used synonymously. Neuroanatomical studies delivered possible synapomorphies for the Pancrustacea in adult nervous systems (HARZSCH 2006; HARZSCH ET AL. 2005; HARZSCH ET AL. 2006) and in developmental pathways of neuroblasts (UNGERER & SCHOLTZ 2008). FANENBRUCK ET AL. (2004) also favored a derivation of Hexapoda from within Crustacea based on neuroanatomical data. In recent molecular studies, Branchiopoda (REGIER ET AL. 2005) or Copepoda (MALLATT & GIRIBET 2006) emerged as sister group of Hexapoda. Also non - monophyletic Hexapoda interspersed within Crustacea (CARAPELLI ET AL. 2007; CARAPELLI ET AL. 2005; NARDI ET AL. 2003) have been proposed. Tracheata (=Atelocerata, Antennata): In 1866 HAECKEL erected the taxon Tracheata, to which he assigned all arthropods with tracheal breathing, the Arachnida, Myriapoda, and Hexapoda. The Tracheata were redefined by POCOCK (1893A+B), who subsequently excluded the arachnids. POCOCK furthermore considered the Myriapoda an unnatural assemblage of beings, composed of (diplopods + pauropods) and (chilopods + hexapods) as the two most closely related groups, and symphylans in an unassigned position ( a question for future discussion ). However, based on a detailed comparison of metameric structures, HEYMONS (1901) continued to support myriapods and hexapods as sister groups, and proposed to 8
21 Molecular insights to crustacean phylogeny 1. Introduction unite them under the new name Atelocerata. Today, both concepts, Tracheata and Atelocerata, are usually used as synonyms. Interestingly, in the phylogenetic analysis of combined molecular and morphological evidence of WHEELER ET AL. (2004), a monophyletic Atelocerata is supported whether or not selected fossils are included in the analysis. Mandibulata: Another concept of a major arthropod clade goes back to SNODGRASS (1935), who erected the Mandibulata (Crustacea, Myriapoda, Hexapoda) as a taxon encompassing Crustacea + Atelocerata (figure 1.4, A), groups that both share, in particular, the possession of distinctly shaped mandibles and two pairs of maxillae. The monophyly of Mandibulata is generally supported by several morphological (VACCARI ET AL. 2004; WHEELER ET AL. 2004; GIRIBET ET AL. 2005), neuroanatomical and molecular studies (BOORE ET AL. 1995; GIRIBET ET AL. 2001; KUSCHE ET AL. 2003). However, a clade Mandibulata is often not supported in molecular analyses (figure 1.4, B) or contradicted by the Myriochelata concept (figure 1.4, C). Myriochelata (=Paradoxopoda): The Mandibulata hypothesis has recently come under fire from molecular phylogenetic analyses that instead unite Myriapoda and Chelicerata as a clade Paradoxopoda (HASSANIN 2006; HASSANIN ET AL. 2005; MALLATT ET AL. 2004; ROTA- STABELLI & TELFORD 2008) or Myriochelata, which is a synonymous term (PISANI 2004; ROTA- STABELLI & TELFORD 2008), see figure 1.4 (C). It has been discussed that support for Paradoxopoda based on mitochondrial evidence is an artifact of out-group choice (ROTA- STABELLI AND TELFORD 2008). Analyses based on nuclear sequence data (BOURLAT ET AL. 2008; DUNN ET AL. 2008; REGIER ET AL. 2008) support either Mandibulata or Paradoxopoda. Schizoramia: The Schizoramia hypothesis ( TCC = Trilobita Chelicerata Crustacea concept) that groups the chelicerates and crustaceans based on morphological characters (CISNE 1974) contradicts the Mandibulata concept, see figure 1.4 (D). Paleontologists had favored this concept. Uniramia: Some early hypotheses about the evolutionary relationships of arthropods included other segmented animals, such as Onychophora, as basal arthropods, from which modern, extant forms were believed to have been derived (e.g., SNODGRAS 1935; 1938). MANTON (1973) went a step further and proposed the taxon Uniramia to embrace hexapods, myriapods, and onychophorans, three groups characterized by segmented trunks, singlebranch limbs, one pair of (first) antennae, and reduced post-oral mouthparts (figure 1.4, D). According to this concept, Crustacea was considered the closest relative of the Uniramia and the arthropods and euarthropods are considered to be polyphyletic. The Uniramia hypothesis is now generally considered obsolete (see WÄGELE 1993). However, neuroanatomical data (STRAUSFELD ET AL. 2006A+B) phylogenomic (MARLÉTAZ ET AL. 2008) and single gene analyses (BALLARD ET AL. 1992) place Onychophora as sister group to Chelicerata within Euarthropoda. Relevance of morphology and fossils: Molecular evidence has become a crucial source of data but comparative morphology retains an important role in systematizing both extant and fossil arthropods. The study of WHEELER ET AL. (2004) is emblematic for the importance of morphology, especially in showing the power of fossils to influence relationships among extant taxa. This study showed that the inclusion of just a small number of fossil taxa can 9

22 1. Introduction Molecular insights to crustacean phylogeny significantly change the relationships of the major arthropod taxa (alternatively supporting Atelocerata or Pancrustacea) based on morphological or combined molecular and morphological evidence. Our current understanding of the phylogenetic position and evolution of extinct lineages is of course highly dependent on the assignment and interpretation of morphological data (COBBETT ET AL. 2007; VACCARI ET AL. 2004). Finally, excellent morphological work on fossils allowed unique insights into the composition of stemlineages that support the extant crown groups of arthropods (e.g., WALOßEK 1993; WALOßEK & MÜLLER 1998A+B; MAAS & WALOSZEK 2001; EDGECOMBE 2004). Anyhow, analyses of some questioned fossils (like representatives of the lobopodians) cannot enlight unambiguously either, e.g the position of Onychophora and Tardigrada, which is still unclear; see EDGECOMBE (2009) and BUDD & TELFORD (2009). Figure 1.4: Conflicting hypothesis on the phylogeny within Arthropoda. Modified and complemented after RICHTER & WIRKNER (2004), FANENBRUCK (2003) and MÜLLER (2007). 10
23 Molecular insights to crustacean phylogeny 1. Introduction 1.4 Quintessence of recent arthropod studies A large number of molecular phylogenetic analyses of major arthropod relationships (some also including morphological data) has been published, but despite some emerging consensus many unresolved issues remain (e.g., GIRIBET ET AL. 2004; GIRIBET ET AL. 1996; GIRIBET ET AL. 2001; GIRIBET ET AL. 2005; HWANG ET AL. 2001; GLENNER ET AL. 2006; REGIER ET AL. 2008; ZRZAV ET AL. 1998A; FORTEY & THOMAS 1998; WHEELER 1998). As pointed out by REGIER ET AL. (2008), deep arthropod phylogeny shares many of the problems that plague deep metazoan phylogenetics. Original phylogenetic signal has saturated significantly over the hundreds of millions of years of independent evolution separating the major taxa, and as data density grows systematic errors become apparent. Thus results are very sensitive to choice of method and data treatment (see 1.5 methodological background). Recent studies (REGIER ET AL. 2008; ROTA-STABELLI & TELFORD 2008) provide clear illustrations of the difficulties involved. Studies also show some striking conflicts between mitochondrial (CARAPELLI ET AL. 2007; HASSANAIN 2006) and nuclear data (MALLATT ET AL. 2004, MALLATT & GIRIBET 2006; REGIER ET AL. 2005; 2008), for example with respect to the monophyly of Hexapoda and Crustacea. Morphological studies have the obvious problem that authors interpret many characters or character transformations differently, thus conflicting evolutionary scenarios are created. An example might be the different morphological concepts for crustaceans (see 1.3, Tetraconata vs. Entomostraca vs. Schizoramia). Apart from these internal conflicts they provide in many cases a backbone or test case for molecular studies to detect artifacts of molecular phylogenies. An example might be the result in HASSANIN (2006) that Vargula, (an Ostracoda) groups as sister-group to Myriapoda + Chelicerata + remaining Hexapoda and Crustacea in HASSANIN (2006). Based on morphological data the author doubts this reconstructed topology. The previously sketched problems can be enhanced by combined or total evidence studies. Molecular phylogenetic analyses in most cases still need improvement regarding data quality analyses and phylogenetic modeling. Often the molecular results do not represent the best results that are achievable with existing models. Combining this half-baked analyzed molecular data with morphological datasets can only enforce conflicts. It has additionally to be kept in mind in this context that mathematical models for the transformation of morphological character states do not exist like for molecular data. Consequently, the same recommendations made for future studies of metazoan phylogenetics can be made for higher-level arthropod phylogenetics (JENNER & LITTLEWOOD 2008), acknowledging that much still needs to be done. A provisional consensus in this highly dynamic field (see figure 1.5) can nevertheless be drawn from the most recent comprehensive studies (GIRIBET ET AL. 2004, 2005; WHEELER ET 11

24 1. Introduction Molecular insights to crustacean phylogeny AL. 2004; BOURLAT ET AL. 2008; REGIER ET AL. 2005, 2008; TIMMERMANS ET AL. 2008; BUDD & TELFORD 2009). Figure 1.5: Summarized recent hypotheses of arthropod evolution. Contradicting hypotheses are represented by dotted lines, fossil taxa in grey. The Mandibulata concept is in concurrence to Myriochelata combining Chelicerata and Myriapoda to a clade. Note that if Pancrustacea is supposed, Mandibulata still exists with (Myriapoda (Hexapoda + Crustacea)). The stem lineage of Euarthropoda is supported by fossils but partly still discussed. Position of Phosphatocopina following MAAS AND WALOSZEK (2005). The Trilobita are generally placed as sistergroup to Chelicerata, but interpretation of new fossil evidence of ontogeny (larval states) suggests a closer relationship to Crustacea (HAUG 2009, PhD thesis). Arthropoda is monophyletic and comprises at least four extant clades: Pycnogonida, Chelicerata, Pancrustacea (hexapods and crustaceans), and Myriapoda. The monophyly of Pycnogonida and Chelicerata is mainly accepted, whereas the monophyly of Pancrustacea is increasingly well supported on the basis of molecular evidence. In contrast, the monophyly of Hexapoda (NARDI ET AL. 2003; COOK ET AL. 2005) and Myriapoda (STRAUSFELD ET AL. 2006A) is less certain. Especially phylogenetic analyses based on mitochondrial sequences have questioned hexapod monophyly, suggesting that collembolans do not group with the remaining hexapods (NARDI ET AL. 2003; CARAPELLI ET AL. 2007). Nevertheless both hexapod and myriapod monophyly are generally supported in the most comprehensive analyses (REGIER ET AL. 2005; 2008), respectively evidence for a monophyletic Hexapoda is growing (DELSUC ET AL. 2003; TIMMERMANNS ET AL. 2008). Crustacea may be para- or even polyphyletic (SCHRAM & KOENEMANN 2004A+B; REGIER ET AL. 2008). The position of Tardigrada and Onychophora to Euarthropoda in COLGAN ET AL. (2008) is sensitive to method of analysis, and remains also ambiguous in other molecular phylogenetic analyses (MALLATT & GIRIBET 2006; DUNN ET AL. 2008; PODSIADLOWSKI ET AL for 12
25 Molecular insights to crustacean phylogeny 1. Introduction onychophorans; PAPS ET AL for tardigrades). The position of Onychophora as a sister group to Chelicerata in ROEDING ET AL. (2007) and MARLÉTAZ ET AL. (2008) may very well be influenced by the absence of Myriapoda in these analyses, and needs further testing. Recent publications using morphological, neuroanatomical and EST data (EDGECOMBE 2009; ZANTKE ET AL. 2008;) favor the Tardigrada as sister-group to Onychophora + Euarthropoda. In contrast other recent studies also support a position of tardigrades within nematodes (DUNN ET AL. 2008; HEJNOL ET AL. 2009). The fossil report regarding tardigrades and onychophorans gives no clear answer to solve their position. Lobopodia for example are discussed controversial in this respect. RAMSKÖLD & JUNYUAN (1998) conclude a closer relationship to Onychophorans and rank Tardigrada as first group of the Arthropoda sensu latu; which is in line with EDGECOMBE (2009). 1.5 Methodological background Phylogenetic relationships of animals were classically considered based on morphological data. As stated in 1.2 and 1.3 (see figure 1.2) morphological analyses still leave questions open regarding the phylogeny of many internal relationships of arthropod and crustacean groups. Furthermore, conflicts are created by morphological results that contradict against each other. With the beginning era of molecular phylogenetics and the first phylogenies based on single molecular markers like 18S rrna (AGUINALDO ET AL. 1997; SPEARS & ABELE 1998), the hope arose that these conflicts and open questions are reliably resolved by the molecular data (BRINKMANN & PHILIPPE 2008). However, the results of most single gene analyses partly strongly contradict each other. Subsequently, datasets of different genes were concatenated (KLUGE 1989) with the hope to reconstruct more reliable and robustly resolved trees compared to analyses based on single genes (e.g. SHULTZ & REGIER 2000). Anyhow, this technique increased the resolution only slightly in most cases as stated in BRINKMANN & PHILIPPE (2008). One promise attended by the new era of phylogenomics borne by the revolutionary progress in DNA sequencing methods (see section 2.2 for technical overview) was to boost the number of genes (or even genomes) implemented into analyses and to improve the robustness and reliability of reconstructed trees (BRINKMANN & PHILIPPE 2008). Several studies confirm that a stochastical or sampling error should vanish if the number of genes that are added to the analyses is as large as in phylogenomic data (ROKAS ET AL. 2003; MADSEN ET AL. 2001) and the taxon sampling is improved. However, the systematic error increases with more data, bringing the methodological aspect to the front. In parallel to phylogenomic data accumulation we find a continuous progress in the development of phylogenetic models, the theory of DNA sequence evolution and application of models and software for maximum likelihood and Bayesian approaches. In particular, for often used single gene markers like rrna genes sophisticated models were developed to incorporate existent background knowledge, e.g. on the secondary structure of these genes 13
26 1. Introduction Molecular insights to crustacean phylogeny (see section 1.5.2). In general, more and more of these findings prevail that both, sophisticated models and new methodological approaches are essential to draw a more realistic picture of metazoan phylogeny (PHILIPPE ET AL. 2005). Triggered by the phylogenomic data some rather old insights to phylogenetic reconstructions were revived. FELSENSTEIN (1988) noted already: [ ] molecular evolutionists who use methods for inferring phylogenies do not engage in much discussion of the properties of the methods they use since they focus on the difficult task of collecting the data [ ]. This quotation matches exactly the results of the recent phylogenomic studies (PHILIPPE ET AL. 2005; BAURAIN ET AL. 2006) which demonstrate that adding more and more data or taxa is not the way to solve the fundamental phylogenetic problems because the systematic errors will stay (PHILIPPE & TELFORD 2006) The fundament for all molecular phylogenetic analyses taxon choice and alignment reconstruction A general remark to taxon choice placing the fundament: The sampled taxa are the first stone in the fundament to infer a reliable phylogeny. One of the major problems in many molecular analyses is an unbalanced taxon sampling. On the one hand highly derived species are included and on the other hand the taxon set might be incomplete regarding all subgroups. This is in line with an argumentation promoted by AGUINALDO ET AL. (1997), BRINKMANN ET AL. (2005) and PHILIPPE ET AL. (2005), that a widespread taxon sampling can avoid Long Branch Artifacts (LBA). LBA is the phenomenon that was relative early described for Parsimony methods by FELSENSTEIN (1978). If two taxa have significantly longer branches compared to the other taxa it is very likely that the long branches will cluster together, in spite of no close phylogenetic relationships. The effect is increasing with sequence lengths and leads to inconsistency of the reconstruction method. WÄGELE AND MAYER (2007) coin this effect a class III LBA. It is basically caused by chance similarities or convergent positions in the sequences that outnumber apomorphic positions. Exclusion of long branch taxa is one possibility to avoid this effect. Another chance seems to be the inclusion of taxa that show no terminal long branches and to add these taxa for clades that partly show long branches. The effort of the species collection for this thesis can be seen in the subsection collection work (chapter 2). The main reason was the intention to reduce from the outset a bias caused by long branches (as described above). The crucial step of sequence alignment: The second stone in the fundament of phylogenetic reconstructions is the alignment. Multiple sequence alignments (MSA) are an essential prerequisite for alignment-based phylogenetic analyses, because they establish fundamental homology assessments of primary sequence characters (alignment positions of nucleotides or amino acids). Yet the multiple sequence alignment problem is NP-hard, which means, to find a solution is impossible with more than a few sequences (WALLACE ET AL. 2006). This is one reason why so many approaches have been developed (over 50 MSA programs) to approximate this problem. For recent reviews see NOTREDAME (2002) and 14
27 Molecular insights to crustacean phylogeny 1. Introduction WALLACE ET AL. (2006). Commonly used methods are progressive and consistency based alignment procedures. In progressive alignments pairs of sequences are aligned first. A guide tree determines the order to align sequences or pairs of alignments; the most similar sequences are aligned first (WALLACE ET AL. 2005). A problem with this method is that alignment errors introduced in an early step cannot be corrected. Consistency based methods try to compensate this problem generating an alignment that is consistent with a set of pairwise alignments which is like a library of alignment information that guides the progressive alignment procedure (NOTREDAME ET AL. 2000; NOTREDAME 2002; WALLACE ET AL. 2006). In particular, if sequences are highly divergent, the introduction of gaps for example becomes more and more complicated and can currently not be fully governed by formal algorithms. The major problem is that finding the most accurate alignment parameters in progressive and consistency based alignment approaches is difficult due to the incomplete knowledge of the evolutionary history of sequences and/or heterogeneous processes along sequences (NUIN 2006). As a result problematic sequence alignments will contain sections of ambiguous positions with doubtful positional homology. Alignment masking and processing: Recent studies underline that alignment errors can influence the correctness of tree reconstructions (DRESS ET AL. 2008; LÖYTYNOJA & GOLDMAN 2005; OGDEN & ROSENBERG 2006). To deal with this problem at the step of sequence alignment, different approaches and alignment software tools have been developed to assess the alignment quality. Despite major advances, alignment quality is still mostly dependent on arbitrary user-given parameters, e.g. gap costs (NOTREDAME 2002; MORRISON 2006). It has been shown that a selection of unambiguously aligned sections, or the exclusion of ambiguous positions (alignment masking: HARTMANN & VISION 2008), improves phylogenetic reconstructions in many cases (WÄGELE & MAYER 2007; DRESS ET AL. 2008; WONG ET AL. 2008; MISOF & MISOF 2009). However, an objective criterion of selecting unambiguous alignment sections or profiling multiple sequence alignments was still not available for a long time. Different automated heuristic profiling approaches to assess the quality of protein and nucleotide alignments have been developed to fill this gap. The recently developed software ALISCORE was used here for this task (chapter 2.3) Single gene data - incorporating background knowledge to rrna analyses Biologically realistic modeling for rrna genes: rrna genes possess loop regions and stem regions. Loop regions show the same evolutionary pattern like standard DNA sequences, each nucleotide evolves independently. In stem regions nucleotides are paired forming secondary structures and thus the change of one nucleotide is covaring with the paired site due to the selection pressure to conserve the molecule s tertiary structure. It has been demonstrated that ignoring this correlated variance may mislead tree reconstructions they can be biased by an overemphasis of changes in paired sites (JOW ET AL. 2002; GALTIER 2004; MISOF ET AL. 2007). Evolutionary constraints on rrna molecules are well known, for 15
28 1. Introduction Molecular insights to crustacean phylogeny example constraints resulting from secondary structure interactions as described above. The accuracy of rrna comparative structure models (WOESE & FOX 1975; WUYTS ET AL. 2000; GUTELL ET AL. 2002) has been confirmed by crystallographic analyses (BAN ET AL. 2000; NOLLER ET AL 2005). Based on that background knowledge, rrna sequences are an ideal test case to study the effect of biologically realistic substitution models on tree reconstructions. Recent studies of genome scale data revealed, that carefully chosen biologically realistic substitution models are of particular importance (LARTILLOT & PHILIPPE 2008; RODRIGUEZ- EZPELETA ET AL. 2007; PHILIPPE ET AL. 2000). However, the extent to which biological processes can/should be modeled in detail is still unclear. The analyses of rrna sequences can still deliver new insights into this direction, because different aspects of the substitution processes can nicely be separated. In order to model covariation in stem regions of rrna sequences, we estimated secondary structure interactions by applying a new approach implemented in RNAsalsa (STOCSITS ET AL. 2009) to avoid inadequate modeling of rrna substitution processes in deep phylogenetic inference (e.g. MISOF ET AL. 2007; BROWN & LEMMON 2007). Essentially, this approach combines prior knowledge of conserved site interactions modeled in a canonical eukaryote secondary structure consensus model with the estimation of alternative and / or additional site interactions supported by the specific data. Non-stationary substitution processes: Inhomogeneous base composition across taxa is a frequently observed phenomenon indicating non-stationary substitution processes (GALTIER & GOUY 1995; TARRIO ET AL. 2001; GOWRI-SHANKAR & RATTRAY 2007). Non-stationary processes if present clearly violate assumptions of stationary processes that are regularly assumed in phylogenetic analyses (BLANQUART & LARTILLOT 2006; GOWRI-SHANKAR & RATTRAY 2006; 2007). Thus, non-stationary processes were modeled combined with the application of mixed substitution models in a Bayesian approach using the PHASE2.0 software package (GOWRI-SHANKAR & JOW 2006) to provide a better fit to our data than standard substitution models (TELFORD ET AL. 2005; GOWRI-SHANKAR & RATTAY 2007) Phylogenomic data a general overview Phylogenomics is a newly coined term (EISEN 1998; O BRIEN & STANYON 1999) that comprises several research fields in molecular biology and evolution (PHILIPPE ET AL. 2005A; BOUCK & VISION 2007) and can be summarized as an approach that is applied at a genomescale level (combining genes in a large scale) to phylogenetic inference (JEFFROY ET AL. 2006). Recent and ongoing progress in DNA sequencing methods (MELDRUM 2000; HUDSON 2008; SCHUSTER 2008) deviating from the classical Sanger method of sequencing by didesoxy chain termination (SANGER ET AL. 1977; SHENDURE ET AL. 2004) provide automated and faster capability to large-scale sequencing. Complete genome sequencing will be a standard technique also to infer molecular phylogeny (for a short technical overview see chapter 2.2.2) in a fast and cheap way. Expressed Sequence Tags (ESTs) represent to date the largest part of phylogenomic data containing an increasingly large part of the transcriptome for many species (JONGENEEL 16
29 Molecular insights to crustacean phylogeny 1. Introduction 2000; RUDD 2003). The concept to produce single read sequences via cdna from reverse transcribed cellular mrna (the transcriptome ) was developed in the 1980s (PUTNEY ET AL. 1983) to detect previously unknown protein coding genes. In the course of the Human Genome Project (HGP) the sequencing of expressed genes came to the foreground as an effective sequencing method - omitting the uninteresting, non coding DNA parts (BRENNER 1990). The term EST was first published by Mark Adams (ADAMS ET AL. 1991) describing this new method and its potential for automated large-scale sequencing. The phylogenomic approach: The idea of the phylogenomic approach is to overcome conflicting results of single gene based analyses by a genome-scale approach (JEFFROY ET AL. 2006; PHILIPPE & TELFORD 2006). The impact of stochastic or sampling error is reduced by the phylogenomic approaches (PHILIPPE & TELFORD 2006; BRINKMANN & PHILIPPE 2008) if datasets contain more than 100 genes. Consequently, the statistical support and node values for reconstructed trees are greatly increased leading generally to a better resolution (DELSUC ET AL. 2005). However, with the dawn of the new phylogenomic era some important points and problematic issues are to address, some of them are rather old to phylogenetic analyses. Systematic errors have a crucial influence, when using phylogenomic data (BRINKMANN & PHILIPPE 2008; PHILIPPE & TELFORD 2006). Systematic errors occur always in cases in which reconstruction methods will infer a wrong tree evoked by the data sensitivity of the reconstruction method. An increasing amount of data will also increase this inconsistency of the method. The best example of methodological inconsistency using maximum parsimony is the long branch attraction artifact (FELSENSTEIN 1978). If taxa evolve rather heterogeneous compared to each other maximum parsimony groups long branch taxa together independently from their evolutionary relation. Other probabilistic methods (maximum likelihood and Bayesian inference) are relatively robust against this phenomenon. Detection of systematic errors and the effect they may have on the resulting topology is one of the big challenges working with phylogenomic data (PHILIPPE ET AL. 2005; BRINKMANN & PHILIPPE 2008). Several strategies exist to evaluate systematic errors (reviewed in e.g. PHILIPPE ET AL. 2005; PHILIPPE & TELFORD 2006; BRINKMANN & PHILIPPE 2008) of which two important points are briefly addressed. A broad taxon sampling (see section above) to break down long branches and to identify different evolutionary rates between related taxa. Excluding the fast evolving ones could also be a solution (BRINKMANN & PHILIPPE 2008). Models of protein evolution are the second important point to address systematic errors. They characterize the evolutionary substitution process in protein coding sequences, describing the probabilities of change from one amino acid to another (Thorne, 2000; Thorne and Goldman, 2003, Abascal 2005). Similar to nucleotide substitution models, protein models can be used for reconstructing phylogenetic trees with distance, maximum likelihood and Bayesian methods. One type of protein models relies on a matrix for single amino acid replacement (20x20), which estimates substitution rates from any amino acid to another empirically based on biological, chemical and physical properties of amino acids (QUANG ET AL. 2008). Properties of amino acids are for example positive or negative charge. Only proteins with e.g. similar charge are likely to be substituted. DAYHOFF ET AL. (1978) 17
30 1. Introduction Molecular insights to crustacean phylogeny introduced the first commonly used matrix, a 20-state time reversible homogeneous Markov model. Contrary to nucleotide models the extremely large number of parameters are not estimated in the phylogenetic reconstruction but calculated from data prior to analysis (ABASCAL 2005). Several of such matrices are used, like Dayhoff matrix (DAYHOFF ET AL. 1978), the JTT matrix (JONES ET AL. 1992), the mtrev matrix (ADACHI & HASEGAWA, 1996) or the WAG matrix (Whelan and Goldman, 2001). In contrast, the commonly used CAT model (LARTILLOT & PHILIPPE 2008) estimates for each site its substitution history from a number of classes. Each class is characterized by its own set of equilibrium frequencies. The model is implemented in a Markov Chain Monte Carlo Process to perform the complex estimation. Missing data is often observed for phylogenomic and EST data, respectively. Its importance or influence on resulting topologies is not yet to evaluate. Some studies demonstrate that missing data influence an unstable placement of taxa with incomplete or missing protein sequences (WIENS 1998). Contrary, several studies show that taxa with missing data have a minimal effect if the total number of positions is large (WIENS 2003; WIENS 2005; PHILIPPE ET AL. 2004; WIENS & MOEN 2008) or can even improve the results by breaking up long branches (WIENS 2006). Thus, at the moment is seems that the total number of existent positions and the signal quality in this positions is important and the absent or missing data has less impact on tree reconstructions. Orthology prediction: The distinction between orthologous and paralogous genes was first made by FITCH (1970) and is an essential fundament for analyzing both, single gene and phylogenomic data. Orthologs are genes that descend from a shared ancestral gene that was existent in the last shared ancestor. Their lineages are split by speciation events. They are more likely to keep their original functionality (KOONIN 2005). Paralogs are genes that descend from a shared ancestor gene. Their lineages were created by gene duplication (FITCH 2000) and always reflect the evolution of genes instead of species trees. But paralogs can also appear if the gene duplication event occurred after speciation. These inparalogs can form gene groups that are ortholog to genes in different species, and thus infer a species tree. The paralogs evoked by gene duplication before a speciation event are also called outparalogs and are never orthologs and infer exclusively gene trees (see O BRIEN, ET AL. 2005). The differentiation between species and gene trees is eminently important for phylogenetic inference, which should be based on species trees (TATENO ET AL. 1982; RANNALA & YANG 2008). Data supermatrix: After identification of the orthologous sequences among taxa the resulting data is the starting point for following analyses and has to be prepared for phylogenetic tree reconstruction. Working with EST data one should consider that many orthologous genes are missing or the identification may not have been successful, thus missing data is in most cases existing and affects the reconstruction. Generally, two possible methods were proposed to handle this data amount with partly missing data: the supertree and the supermatrix approach (SANDERSON 1998; DE QUEIROZ & GATESY 2006). A supertree represents the single, joint phylogeny estimation that results from separately analyzed, subdivided datasets (SANDERSON 1998; BININDA-EMONDS 2004). The alternative supermatrix 18
31 Molecular insights to crustacean phylogeny 1. Introduction instead combines all characters to one matrix. All characters are considered simultaneously the basic idea was already described by KLUGE (1989). 1.6 Aims of the thesis Many internal relationships of crustaceans are still unclear. Two specific questions of this thesis concern: [1] how the major lineages of crustaceans are related, and [2] what is the position of the clade Crustacea within arthropods. To address those questions single gene sequences [analysis A-B, see 1.7] but also phylogenomic data [analysis C, see 1.7] is analyzed with new methods to enlight molecular crustacean phylogeny. Following crustacean phylogeny concepts should be tested in particular: 1) Entomostraca hypothesis 2) Thoracopoda hypothesis 3) Maxillopoda hypothesis Within crustaceans in particular the positions of the single crustacean clades Malacostraca, Remipedia, Mystacocarida, Cephalocarida and Pentastomida should be tested. Arthropod phylogeny hypotheses that were tested are: 1) Pancrustacea [Hexapoda + Crustacea] versus Atelocerata [Tracheata (=Antennata) + Crustacea (=Diantennata)] 2) Archilabiata hypothesis 3) Mandibulata versus Myriochelata 4) Arthropoda= Tardigrada + Onychophora + Euarthropoda That the relationships of some arthropod taxa are highly interwoven with crustaceans is to recognize for arthropod phylogeny hypothesis 1) and 2) which test of course also internal relationships of crustaceans, e.g. if they might be paraphyletic in respect to Hexapoda or Tracheata. Following methodologically questions should be addressed in this thesis: 1) Can an (automated) alignment evaluation and masking process improve the phylogenetic reconstruction? 2) Does the implementation of secondary structure based mixed models result in more reliable and improved phylogenetic trees based on rrna data? 3) What is the impact of inhomogeneous base frequencies to phylogenetic reconstructions and can incorporation of time- heterogeneity improve the phylogenetic reconstruction compared to the standard time- homogeneous approaches? 19
32 1. Introduction Molecular insights to crustacean phylogeny 4) Enlightens phylogenomic data based on a supermatrix approach the crustacean and arthropod phylogeny? Resulting trees finally always upend in a bifurcation and separated clades, wether or not the separation is based on distinct signal. Handling only trees makes one sneaky falling into the trap to believe that there is a distinct signal. A general aim was to demonstrate that information content in the data can be evaluated by network reconstruction to gain a first impression of eventually conflicting signal. To assess the result of alignment processing this network reconstruction might be beneficial before and after alignment processing. 1.7 Short introduction and overview of analyses [A-C] Analysis [A]: deals with the inner relationships of Crustacea. The potential phylogenetic signal is analyzed in a combined dataset of three commonly used loci (18S rrna, 16S rrna, COI) with the software MrBayes 3.0. This analysis goes beyond previous efforts by 1) an increased sampling of taxa within Crustacea, 2) the use of newly developed software to improve the quality of multiple sequence alignments (MAFFT and MUSCLE). The aim of analyses [A] and [B] was to improve the analyses by fitting biologically realistic mixed DNA/RNA substitution models to the rrna data. Both analyses include for the first time representatives of Mystacocarida, Pentastomida, Branchiura, Remipedia, Cephalocarida and Leptostraca. Analysis [B]: evolution of crustacean and higher arthropod taxa is addressed using a more extensive taxon sampling (compared to analysis [A]) of 148 arthropod taxa representing all major euarthropod clades. Thus onychophorans and tardigrades were chosen as out-group taxa. To focus on the relationships of high-ranking arthropod taxa the number of representatives of each taxon was trimmed to a concerted quantity of species representing the four major euarthropod groups. For a detailed comparison with analysis A/C 27 crustacean taxa (mostly two species per group) were finally included. This is a tribute to the inclusion of completely sequenced 18S and 28S rrna genes, which do not yet exist for too many taxa. The more sophisticated phylogenetic reconstruction compared to analysis [A] implemented a time-heterogeneous substitution process to compare the results with the standard time- homogeneous approach. Analysis [C]: The dataset of analysis [C] is the to date largest phylogenomic dataset for arthropods. The crustacean taxon sampling including species sequenced in this thesis comprises several species of the Maxillopoda and potential crustacean sister group taxa (e.g. Branchiopoda, Copepoda) to a hexapod clade, to test the putative para- or polyphyly of Crustacea. The main strength is the implemented reduction heuristics (see 2.6), which is to that extent absolutely novel in phylogenomic data. 20
33 2. MATERIAL AND METHODS The fairest thing we can experience is the mysterious. It is the fundamental emotion, which stands at the cradle of true art and true science. He who know it not and can no longer wonder, no longer feel amazement, is as good as dead, a snuffed-out can. ALBERT EINSTEIN 2.1 Species choice, collection and fieldwork What is a scientist after all? It is a curious man looking through a keyhole, the keyhole of nature, trying to know what s going on. JACQUES YVES COUSTEAU The taxon sampling was designed to cover all major crustacean groups, following MARTIN & DAVIS (2001), including representatives of early malacostracan lineages with at least one representative species for each group. Generally, it was tried to collect species (table S1) that do not differ too widely from the hypothetical morphological ground pattern of the represented group, whenever possible (LARTILLOT & PHILIPPE 2008; PHILIPPE ET AL. 2005). For all analyses presented in this thesis at least two less derived representatives of each major grouping were included (if possible) in the dataset. In published sequences of crustaceans, we find an overhead of malacostracan groups (e.g. Decapoda) while lower crustaceans are represented with only small sequence numbers. To conduct multi-gene analyses with housekeeping genes and EST data for all crustaceans, the focus for fieldwork and collection laid respectively in achieving sequencing of missing lower crustaceans sequences complementary to public databases. Species collection consequently focused on those lower crustacean groups, which are underrepresented in public databases. For EST and 454 sequences the picture of existing public database entries is even worse. Sequencing projects of most lower crustacean groups are not yet conducted (STILLMAN ET AL. 2008, see supplementary table S14). Especially within lower crustaceans we find groups that are extremely hard to collect, which is one reason for the lack of sequences for these taxa. In the field, crustaceans were collected with several methods. Vessel-based were dredges, Van Veen grab sampler and Multicorer used as sampling equipment (HIGGINS & THIEL 1988). By scuba diving I collected more specific, single target species operating bait-traps and hand-corer. Filtering and decanting samples from different zones from the seafloor up to the littoral was an important method either. Sampled specimens were always preserved in % Ethanol for DNA sequencing and morphological determination. Specimens for EST or 454 sequencing projects were preserved in RNA later (Qiagen) or liquid nitrogen and additionally some voucher specimens in Ethanol. Samples were stored at -20 C, tissue for EST 21

34 2. Material and Methods Molecular insights to crustacean phylogeny sequencing at 80 C. For collection localities and details see supplementary table S2. The collection effort to finish successfully this thesis is demonstrated by highlighting some of the collecting methods (figure 2.1) and the more detailed description of the collection of two important key taxa, the Pentastomida and Remipedia. Figure 2.1: Some impressions of the field and species collection work. A shows the FS Heincke (Alfred Wegener Institut, Bremerhaven), a German research vessel before joining an offshore trip of several days on the North Sea. B: the Multicorer is lifted on deck. C D: the Van Veen grab sampler coming up (C) and its opening to sort the samples (D). 22

35 Molecular insights to crustacean phylogeny 2. Material and Methods E: Preparing the equipment for a dredging trip on the Ria de Ferrol in Galicia, Spain. G: One of the hand-dredges that were used. F: Digging a hole for filtering interstitial water to collect the tiny Mystacocarida. H: Last checks before descending with double tanks into the depth of the Mediterranean Sea (Sardinia) to lay baited traps for Ostracoda and Leptostraca and to take samples of Cephalocarida (the latter issue was unfortunately not successful at all. To find parasitic tongue worms (Pentastomida) over 120 reptile host specimens were screened. Squamates are typical end-hosts of the genus Raillietiella (BOSCH 1987) and finally five pentastomids of this genus were identified (determined by H. BOSCH) in two Hemidactylus frenatus (house gecko) hosts. The specimens parasitized the trachea system of Hemidactylus; the lobes of the lung are the typical location (figure 2.2) of pentastomid larvae IV (the last stage) and adults in the reptile organism. For further details see BOSCH (1986; 1987). Figure 2.2: Pentastomid parasitizing Hemidactylus host. The left picture shows Raillietiella parasitizing in the right lung lobe of Hemidactylus frenatus (smaller white frame). The black scale bars on the left edge are in millimeters. On the right a specimen is pictured under the microscope in total and with details of the typical hooks (smaller white frame). 23
.")
36 2. Material and Methods Molecular insights to crustacean phylogeny Remipedia are relatively late discovered (YAGER 1981), enigmatic crustaceans of subterranean anchialine environments. A center of distribution of species and high specimen abundance for species like Speleonectes tulumensis is the region of the Caribbean Sea and the Gulf of Mexico (KOENEMANN ET AL. 2003). Yet by characterizing their habitats it becomes clear that the collection of remipedes is an adventure. They live restricted to anchialine (HOLTHUIS 1973) cave systems that feature an underground connection with salt water to the sea, while the entrance and surface part of the water column is composed of freshwater (ILIFFE 1992A+B; ILIFFE & SARBU 1990). Fresh and saltwater form generally two layers of water separated by a cline-area, the halocline, in which both layers mix (figure 2.3). The vertical spreading and dimension of this interface layer is conditioned to the topology in the cave and varies also dependent on characteristics of existing currents. The remipedes are observed at the present only below the halocline (KOENEMANN ET AL. 2007) making the collection dangerous and only possible by cave diving. After being cave diving trained, it was possible to collect specimens of this mysterious group in the years 2007 and 2008 together with T. ILIFFE in Mexican cave systems (figure 2.4) on the Yucatan Peninsula. Figure 2.3: Longitudinal section of an anchialine cave system. The thicker, dashed red line represents the halocline in the cave, the interface layer between salt and freshwater. Remipedia occur only below the halocline. The difference between cave diving to normal scuba diving is the overhead environment. In case of an emergency resurfacing vertically is not possible. In addition to the more extensive equipment and training one main difference is also the complex use of guide lines that are permanently or temporarily laid in the cave. Always, a primary line is connected from the open water into the cave and connected to the main cave line. This is crucial for surviving in case of silt outs, incidents evoked by disturbed sediment that create a sudden, zero sight situation. 24
 is pictured, on the right the author is diving within the cave system with standard double tanks.")
37 Molecular insights to crustacean phylogeny 2. Material and Methods Figure 2.4: Cenote Crustacea on the Eastern Yucatan, Mexico. At the left the entrance of the anchialine cave system (called Cenote in Mexican) is pictured, on the right the author is diving within the cave system with standard double tanks. The diving equipment matched the NACD (National Association for Cave Diving) and IANTD (International Association for Nitrox and Technical Diving) standards for cave diving. 25
38 2. Material and Methods Molecular insights to crustacean phylogeny 2.2 Laboratory methods I am among those who think that science has great beauty. A scientist in his laboratory is not only a technician: he is also a child placed before natural phenomena which impress him like a fairy tale. MARIE CURIE The molecular laboratory methods used in the framework of this thesis and their results were the base for several separate analyses. Three complex analyses are included, two using standard gene sequencing [A+B], the third [C] is based on EST sequencing. In this section are described [1] the combined molecular methods conducted in the molecular laboratory to achieve the sequence amplification and [2] in general the different sequencing methods used to conduct DNA- and EST analyses. DNA extraction from complete specimens or tissue samples (e.g. from Squilla mantis, Stomatopoda) followed a standard protocol. The column DNA extraction kits DNeasy Blood & Tissue Kit (QUIAGEN) and NucleoSpin Tissue Kit (MACHERY-NAGEL) were used following the manuals. Only single specimens were macerated, samples were not pooled. Manufacturer protocols were slightly modified incubating the samples over night and adding 8 l RNAse [10 mg/ml] after lysis. For small (Derocheilocaris typica, Mystacocarida) or very rare (Lightiella incisa, Cephalocarida) crustacean specimens the extracted DNA was amplified with the Illustra GenomiPhi V2 Amplification Kit (GE HEALTHCARE). PCR was conducted for all nuclear and mitochondrial gene fragments using published and modified primers (supplementary table S3) that were ordered from METABION. The amplification and sequencing of complete 18S and 28S rrna genes was a main focus, requiring highly complex primer combinations and PCR settings (see supplementary table S5, supplementary figure S1). The amplification of the complete 28S rrna gene was performed using nine overlapping fragments (supplementary figure S1) starting approximately in the middle of the rrna 5.8S and ending in the final part of the D12 of 28S rrna. The 18S rrna was completely amplified in one PCR product and sequenced using four primer combinations (supplementary figure S1). Of the mitochondrial genes 16S rrna and COI only standard fragments were amplified using different primer combinations (supplementary table S3). PCR products were purified with the NucleoSpin ExtractionII (MACHERY-NAGEL) and QIAquick PCR purification kit (QUIAGEN). In case of multiple bands fragments with the expected size were cut from 1.5% agarose gel and purified according to the manufacturer protocol. Cycle Sequencing reactions and electrophoreses were performed on different thermocyclers from ABI (GenAmp 2300, 2320 & 9600) and BIOMETRA (T-gradient) and on BECKMAN COULTER 8000 & 8800 capillary array sequencers. Some problematic PCR products were sent to MACROGEN (Inc.) in Korea. Please refer to the supplement for more detailed information on chemicals (supplementary table S4), PCR profiles (supplementary table S5) and primer combinations (supplementary 26
39 Molecular insights to crustacean phylogeny 2. Material and Methods figure S1). The in molecular sense (sequence amplification and sequencing performance) extremely heterogeneous crustaceans made an intensive testing for each gene essential to establish the settings for laboratory work. For an overview of sequenced genes for all taxa see supplementary table S6. Single gene sequencing: Over three decades have passed since DNA sequencing based on electrophoretic methods has been established (SHENDURE ET AL. 2004). Since that an enormous development of sequencing technologies regarding automation (MELDRUM 2000), parallelization and cost reducing refinements occurred, mostly based on the principle of the Sanger sequencing method (SANGER ET AL. 1977). Capillary sequencers that sequence microplates of at least 96 wells in few hours are now standard for the majority of laboratories. Especially for standard DNA sequencing a new trend is that samples are shipped to sequencing companies, like MACROGEN or AGOWA, instead of doing home-sequencing. While finishing the laboratory work for this thesis few last samples were also sent to MACROGEN (KOREA). Anyhow, most samples were sequenced on capillary sequencers (BECKMAN COULTER 8000 & 8800) in the laboratory of the ZFMK, Bonn. EST sequencing: EST sequencing was one of the first high-throughput or large-scale technologies (ADAMS ET AL. 1991; BOGUSKI 1995; GERHOLD & CASKEY 1996) established in the framework of the HGP (Human Genome Project). EST is an abbreviation for Expressed Sequence Tags, referring to the mrna fragments in the cell that are tagged by poly-a tails. Fishing those tagged fragments, only coded and expressed parts (Exons) of the DNA are sequenced (figure 2.5). This transcriptome sequencing via ESTs became today a standard method in molecular phylogeny (BOUCK & VISION 2007; HUGHES ET AL. 2006; SANDERSON & MCMAHON 2007) and molecular ecology (BOUCK & VISION 2007), see also methodological background in 1.5. Three crustaceans were sequenced in EST projects to find new marker genes and to conduct phylogenomic analyses to address questions of crustacean phylogeny and their position within arthropods. The EST project for the Remipedia (Speleonectes tulumensis) was not successfully finished; the only by-product is presented in 2.7. It is to state here, that the specimens for EST sequencing were only preserved and isolated in the field and/or laboratory in Bonn. The remaining laboratory procedure including rrna amplification and final sequencing (figure 2.4) was conducted at the Max Planck Institute for Molecular Genetics (MPI Berlin). The described procedure [1-7] relies on the dideoxy, stopnucleotide Sanger method. The final EST sequences are processed and analyzed in data pipelines to remove vector sequences etc. and are finally assembled to EST contigs (fig. 2.8). The EST contigs are then the base for phylogenetic analyses (fig. 2.9). EST next generation sequencing: The tremendous pace for the faster, more efficient and cheaper high-throughput sequencing method can be recognized by the fact that EST sequencing based on cdna clones is by now old fashioned. New high throughput sequencing technologies based on alternative sequencing methods were developed recently (HUDSON 2008). They encompass the limitations of the Sanger based methods used in the older EST technology, namely comparatively low throughput, long runtimes and high costs (RONAGHI 27
 and Ostracoda we used consequently during the last period of this thesis one of the next generation, non-sanger-based methods (HUDSON 2008; SCHUSTER 2008),")
40 2. Material and Methods Molecular insights to crustacean phylogeny 2001). For Remipedia, Sarsinebalia (Leptostraca) and Ostracoda we used consequently during the last period of this thesis one of the next generation, non-sanger-based methods (HUDSON 2008; SCHUSTER 2008), the pyrosequencing technology (RONAGHI ET AL 1996; RONAGHI ET AL. 1998) from ROCHE, as implemented in the FLX 454 machine. The aim to include these species in the phylogenomic data failed unfortunately, the 454 sequencing was delayed for several, technically reasons. Figure 2.5: EST cloning and sequencing procedure, modified after BOUCK & VISION (2007). Non-coding DNA regions (exons) of a DNA strand [1] are spliced and transcribed 28
41 Molecular insights to crustacean phylogeny 2. Material and Methods from DNA to finally mrna [2]. The mrna is characterized by a poly-a tail and a 5 -end cap structure with a modified guanine nucleotide (yellow circle). After isolating total RNA the poly-a tail is targeted to perform a Reverse Transcriptase PCR and to synthesize a complementary cdna strand from the mrna template [3]. Then follows digestion of the mrna adding RNase H and afterwards DNA polymerase 1 synthesizes a second strand [4], resulting in a double stranded cdna. This double stranded cdna is inserted into cloning vectors [5]. The vector subsequently is inserted into competent cells and [6] a cdna library is the final result. EST sequences can be generated of this library sequencing in 5 or 3 end direction. [7]. 29

42 2. Material and Methods Molecular insights to crustacean phylogeny 2.3 Data analyses methods prior to phylogenetic tree reconstruction Whoever, in the pursuit of science, seeks after immediate practical utility, may generally rest assured that he will seek in vain. HERMANN VON HELMHOLTZ After finishing the molecular work including sequencing follow the procedures of sequence processing, data quality assessment and multiple sequence alignment reconstruction and evaluation. The resulting alignments are the basis for the phylogenetic tree reconstruction. A methodological emphasis in this thesis was the use of new software and the design of process flows (or pipelines ) to assess data quality and to improve the crucial step of alignment reconstruction (figure 2.6). Figure 2.6: Phylogenetic analyses process prior to tree reconstruction. Sequence data (orange) is processed and quality controlled [1]. Electropherograms of raw sequences are quality checked and subsequently controlled own and published nucleotide sequences are blasted to identify eventual contamination. It is problematic that normally electropherograms selected from public databases are not available for published 30
43 Molecular insights to crustacean phylogeny 2. Material and Methods sequences. Therefore sequence errors cannot be discovered in these data. Processed sequence data is prealigned [2] applying multiple sequence alignment programs. In case of rrna genes a secondary structure-based alignment optimization follows. To gain a first impression of the information in the data, its structure is evaluated by phylogenetic network reconstruction. It follows the final alignment evaluation & processing [4]. For each gene ALISCORE (MISOF & MISOF 2009) is performed to identify randomly similar aligned positions and ALICUT excludes those positions found by ALISCORE (=masking process). Single, masked alignments are concatenated by a PERL-script to the final alignment. For most analyses it is useful to compare data structure before and after the alignment process in a network reconstruction [5]. After this the last step is the phylogenetic tree reconstruction [6]. Data analyses were conducted in close cooperation with several co-workers of the molecular laboratory at the ZFMK in Bonn (namely P. KÜCK, R. STOCSITS and H. LETSCH) and at the University of Hamburg (B. MISOF), who programmed the software. For this reason these newly developed software tools could be used and further improved by direct collaboration and discussing the results of the analyses (table 2.1). Table 2.1: Main analyses included. Used marker genes and main focus is shown. Analyses Marker genes Main focus in analysis [A] 16S, 18S, COI Standard vs. secondary structure guided alignments [B] 18S, 28S Time-homo vs. heterogeneous processes, secondary structure [C] EST sequences Orthologous gene selection, relative information content of genes Because this thesis was conducted in the framework priority program deep metazoan phylogeny of the DFG (Deutsche Forschungsgemeinschaft) a close cooperation existed with collaborators of the other three arthropod groups involved in this program. This was in general the case with K. MEUSEMANN. The applied methods and programs to reconstruct trees for this thesis will be explained in the specific analyses sections. It is to mention that the EST analysis procedure followed in general the same principles as shown in figure 2.6 but differed slightly according to the differences between phylogenomic and single gene data. A detailed flowchart for the EST analysis is given in chapter 2.6. For that phylogenomic analysis some bioinformatics and computational issues had to be outsourced to the bioinformatics group (V. HÄSELER, Vienna, Austria) of the priority program, but see also the flowchart in chapter
44 2. Material and Methods Molecular insights to crustacean phylogeny Sequence processing and quality control All resulting sequence electropherograms were analyzed and assembled using the software programs SeqMan (DNASTAR, Lasergene), CEQ 8000 (BECKMAN COULTER) or Bioedit 7.0 (HALL 1999). Unfortunately most published sequences are not linked to their trace files and consequently the quality of electropherograms cannot be determined. All final sequences and composed fragments were blasted in NCBI using BLASTN, MEGABLAST and BLAST2SEQUENCES to exclude contaminations. This is the terminal but eminent important (and very often ignored) step to finish the laboratory work. Ambiguous own or published sequences were always excluded from analyses Multiple sequence alignment Sequence pre-alignments were performed for each gene separately with the commonly applied alignment programs MUSCLE (EDGAR 2004A; 2004B) and MAFFT (KATOH ET AL. 2002). For a comparison of MUSCLE and MAFFT alignments see (2.4). Tests of MAFFT have indicated that its LINSI-algorithm is more reliable for rrna genes. These often inhabit expansion segments and ambiguous regions with variable length polymorphisms, which require a different estimation and judging for introducing gaps (KATOH & TOH 2008). Generally several different MSA programs were tested in parallel for this study. In addition to the above cited software for example the new version of CLUSTALX (LARKIN ET AL. 2007; THOMPSON ET AL. 1997; THOMSON ET AL. 1994) and T-COFFEE (NOTREDAME ET AL. 2000) were applied, but MUSCLE and MAFFT outperformed these and other programs regarding time and efficiency. Finally, the standard settings were used for all alignment programs Alignment optimization based on secondary structure information The first step in alignment algorithms relies on identification of similar sequence regions which are subsequently arranged to sets of strings with maximized character identity in alignment positions, underlying homology hypotheses, see section 1.4. The software RNAsalsa (STOCSITS ET AL. 2009) is a new approach to align structural rrna sequences based on existing knowledge about structure patterns, using constraint directed thermodynamic folding algorithms and comparative evidence methods. This makes alignment reconstruction more objective. For each molecule in addition to sequence similarity a second trait, the structure is considered. RNAsalsa automatically and simultaneously generates both individual secondary structure predictions within a set of homologous RNA genes and a consensus structure for the dataset. Successively sequence and structure information is taken into account as part of the alignment's scoring function. Thus, functional properties of the investigated molecule are incorporated to corroborate homology hypotheses for individual sequence positions. The program employs a progressive multiple alignment method, which includes dynamic programming and affine gap penalties. Inferred site covariation patterns are used then to guide the application of mixed nucleotide / doublet substitution models in subsequent phylogenetic analyses. RNAsalsa needs a 32
45 Molecular insights to crustacean phylogeny 2. Material and Methods prealignment as input. For a description of the exact algorithm and parameters of RNAsalsa, see STOCSITS ET AL. (2009), manual and software download see the homepage at: http: //rnasalsa.zfmk.de. Secondary structure constraints for analyses [A] are based on the 16S (L20934) and 18S (78065) sequences of Anopheles gambiae and albimanus. For analysis [B] the 28SS+5.8S (U53879) and 18S (V01335) of Saccharomyces cerevisae were used. Corresponding secondary structures for the sequences were extracted from the European Ribosomal Database (DE RIJK ET AL. 2000; VAN DE PEER ET AL. 2000; WUYTS ET AL. 2000; WUYTS ET AL. 2004; WUYTS ET AL. 2002). Structure strings were converted into dot-bracket-format using Perl-scripts. Folding interactions between 28S and 5.8S (GILLESPIE 2005; GILLESPIE ET AL. 2006; MICHOT ET AL. 1983) required the inclusion of the 5.8S gene in the constraint to avoid artificial stems. Alignment sections presumably involved in the formation of pseudoknots were locked from folding to avoid artifacts. Pseudoknots in Saccharomyces cerevisae are known (WUYTS ET AL. 2000) for the 18S (stem 1 and stem 20, V4-region: stem E23\9, E23\10, E23\11 and E23\13) while they are lacking in the 28S secondary structure. Prealignments and constraints served as input, RNAsalsa ran with default settings Evaluating structure and signal by network reconstruction Phylogenetic networks (HUSON & BRYANT 2006) were reconstructed to evaluate the general structure, potential conflicts and signal-like patterns in the alignments. Without constraining the results of a phylogenetic analysis in form of a bifurcated tree, these phylogenetic networks can be used to visualize the presence of conflicting signals in the data (HUSON ET AL. 2005). Conflicts are indicated by non-parallel edges that represent conflicting splits between taxa, and show the relative support for splits in the data by the length of parallel edges supporting a certain split (as an indicator for the weight of the split, analogous to branch lengths in a tree). For a detailed description of phylogenetic networks see (HUSON & BRYANT 2006; WÄGELE & MAYER 2007). With the software Splitstree 4.10 (HUSON 1998; HUSON & BRYANT 2006) was the neighbor-joining algorithm applied for network reconstruction in analyses [A and B] and additionally the LogDet transformation in analyses [B] to analyze the alignment of the complete 18S & 28S rrna genes. LogDet is a distance transformation that corrects for biases in base composition (PENNY ET AL. 1994; STEEL ET AL. 2000) Alignment evaluation and processing Alignments were assessed with the software ALISCORE (MISOF & MISOF 2009) to identify ambiguous or randomly similar aligned sections. ALISCORE uses for this purpose a parametric approach, relying on defined models of sequence evolution. This results in a more objective and reliable procedure to infer topologies but not necessarily better performance regarding resulting topologies. In contrast, GBLOCKS (CASTRESANA 2000) the currently most frequently used software does not make explicit use of models of sequence evolution, which makes its usage in a specific way subjective. 33
46 2. Material and Methods Molecular insights to crustacean phylogeny ALISCORE generates profiles of randomness using a sliding window approach. Sequence positions within this window are assumed to have random-like nucleotide patterns when the observed score does not exceed 95% of scores of random sequences of similar window size and character composition generated by a Monte Carlo resampling process. ALISCORE generates a listfile of all putative randomly similar sections. No distinction is made between random similarity caused by mutational saturation and alignment ambiguity. The default settings were used, the window size was (w=6), gaps were treated as ambiguities (- N option) and the maximum number of possible random pairwise comparisons (- r option) was analyzed. The alignment masking process was conducted with the program ALICUT (KÜCK, This perl-script masks the alignment by excluding the positions identified in an ALISCORE analysis to be randomly similar. The consensus secondary structure of rrna genes given in RNAsalsa was included into the alignment in analyses [A and B]. Consequently, both the aligned sequences and the consensus sequence are masked. In this way, the user can consider secondary structure information for phylogenetic analysis, for example, by implementing mixed models for RNA molecules. By default, ALICUT excludes also stem positions if identified as randomly similar aligned and converts the corresponding stem nucleotide into a dot ignoring covariation. However, it is plausible that evolution of stem positions is constrained by secondary structure and covariation patterns. Therefore, the -s function in ALICUT was used to keep all stem positions in the alignment. 34
47 Molecular insights to crustacean phylogeny 2. Material and Methods 2.4 Analyses [A]: Can 16S, 18S and COI marker genes improve inference of crustacean phylogeny? Comparing usual standard vs. secondary structure based approaches Science never solves a problem without creating ten more GEORGE BERNHARD SHAW Objectives To evaluate alignment methods was one central objective for this analysis, in particular for ribosomal RNA genes. Previously published and new sequences were included for three marker gene loci: 18S rrna, 16S rrna, and cytochrome c oxidase I (COI). However, the intention to include as many representatives of all major arthropod and respectively crustacean groups as possible entailed a trade-off regarding the choice of genetic markers. The genes of the preferred choice were not available for all of the selected taxa. Therefore, incomplete gene sequences and even missing markers were tolerated for some taxa, see supplementary table S Taxon sampling The selected published and new sequences (supplementary table S7) represent species of all major extant groups of crustaceans, insects, myriapods, and chelicerates to (1) evaluate sister group relationships within the Arthropoda, and (2) appraise which groups constitute possible higher monophyla such as the Pancrustacea. 38 new crustacean sequences were contributed: 11 for the 16S rrna, 16 for the 18S rrna and 11 for the COI, respectively. The three sequences of Pleomotra apletocheles were kindly provided by the group KOENEMANN (TiHo Hannover). The taxon sample includes 88 terminal taxa representing all major extant groups of the Crustacea (57 taxa), Hexapoda (13 taxa), Myriapoda (5 taxa), Chelicerata (11 taxa), and two out-group phyla, the Onychophora and Tardigrada. In view of recent suggestions based on neuroanatomical (HOMBERG 2008) and phylogenomic evidence (DUNN ET AL. 2008; ROEDING ET AL. 2007) that onychophorans may either be a sistergroup to euarthropods or positioned within euarthropods, only tardigrades were designated as out-group. This allows to test the phylogenetic position of the onychophorans Analysis design In order to maximize data density per taxon, composite (chimerical) higher-level terminal units were constructed in several cases by combining gene sequences of closely related taxa. It is argued that this strategy should not distort phylogenetic analyses, provided the composite taxa are monophyletic with respect to other, closely related terminal units (SPRINGER ET AL. 2004). Given the relatively distant relationships between the included 35
48 2. Material and Methods Molecular insights to crustacean phylogeny terminals this assumption appears justified. In the phylogenetic trees, chimerical taxa are named after the next available or an unambiguous higher rank, for example, Hypochilus thorelli + H. pococki = Hypochilus. The only exceptions are the two out-group taxa that were named Onychophora and Tardigrada for convenience. Additionally it was verified that the COI data did not contain any nuclear copies of mitochondrial-derived genes (numts; see BUHAY 2009). For two terminal taxa, there were multiple 18S sequences available that differed conspicuously. Since it was not possible to unambiguously identify the correct sequence, both 18S sequences were included for these two taxa, the mystacocarid Derocheilocaris typica (one own and one published sequence from NCBI) and the symphylan Scutigerella causeyae (both sequences published in NCBI); both species are represented as doubled terminal taxa. The influence of multiple sequence alignment methods on phylogenetic analysis was one focus of this study. Consequently, a series of analyses was conducted to determine the effects of different combinations of these variables on the dataset (see table 2.2 for an overview). These included: (1) Alternative methods of multiple sequence alignment using either MUSCLE or MAFFT, (2) Alignment methods based on secondary structure information, (3) Identification and removal of ambiguously aligned regions (alignment masking), (4) RY-coding for the mitochondrial marker COI and the loop regions of 16S rrna to encompass saturation effects and compositional biases. An alternative, manual alignment processing was carried out in addition to the alignment processing described in 2.3 (using ALISCORE and RNAsalsa). Two manually aligned datasets (16S and 18S rrna sequences) and the following description of this process (which was only slightly modified by the author) were kindly provided by the collaborating working group of S. KOENEMANN (TiHO Hannover). This allows a comparison of results of hand vs. automized alignment processing (optimization): Both terminal regions were clipped by hand from the pre-aligned dataset since these regions appeared to contain erroneous or doubtful sequence fragments for a number of taxa. Subsequently, the pre-alignments of 18S and 16S were realigned manually based on secondary structure information. For methodical suggestions see KJER ET AL. (2007) and KJER (1995). Reconstructions of the secondary structure that were available on the Comparative RNA Web site (CRW) (CANNONE ET AL. 2002) and the European ribosomal RNA database (WUYTS ET AL. 2004) for some of the taxa included in this analysis were used. After a general identification of homologous structures, it was possible to reallocate entire sections of the sequence as well as smaller motifs within these sections. For example, large sections of 18S sequences were found in the alignments that were likely misaligned for five taxa (Derocheilocaris, Tanaidacea, Lightiella, Allopaurus and Scutigerella). These large misaligned sections contained several hundred bps, and were entirely moved a distance of 700 up to 1,500 positions within the 18S alignment. In their new positions, the sections could be unambiguously allocated and realigned according to highly conserved 36
49 Molecular insights to crustacean phylogeny 2. Material and Methods structures. In addition, numerous smaller sections were realigned based on recognizable, unique motifs, so that an estimated 40% of the positions in the standard alignment were resolved and rearranged. The structural optimization also revealed that the two 18S sequences of Scutigerella, which differed markedly in the pre-alignment, were highly compatible after rearrangements. Therefore, the shorter one of the two sequences (AF007106) was excluded from further analysis. Similar misaligned sections were found within the 16S partition. After structural optimization, two datasets were prepared for phylogenetic analysis. The manually adapted hand alignment is composed of 4902 characters (18S = 3569, 16S = 673, and COI = 658 characters) without alignment masking. For the dataset masked and adapted by hand single uninformative sites were deleted (sites containing nucleotides for only one taxon) and highly variable sections that could not be resolved according to secondary structure information. The smaller dataset has an 18S partition with 2184 characters, the partition of the 16S has 444 positions Phylogenetic tree reconstruction Compositional heterogeneity of the dataset was tested using the program PAUP 4.0b10 (SWOFFORD 2002), and additionally the RY-coding was chosen to accommodate inhomogeneous base compositions. RY-coding was applied in pretests (supplementary table S8) for the COI sequences and for the 16S rrna loop regions to counteract the effects of saturation and inhomogeneous base composition. RY-coding was originally used to assign third codon positions of proteincoding mitochondrial genes to one of two categories, purines (R) or pyrimidines (Y) (PHILLIPS & PENNY 2003). In this analysis all alignment positions of chosen regions were RY-coded, generating an improved model likelihood (LnL). RY-coding was used for Runs 1-3 (table 2.2). In a series of extensive pretests (supplementary table S8) of the partitioned data matrix, Bayes Factor Test A and B were carried out to identify the best model and settings for the final runs following the criteria of KASS & RAFTERY (1995). For detailed descriptions of the Bayes Factor Test (BFT) see NYLANDER ET AL. (2004) and KASS & RAFTERY (1993; 1995). Generally, the convergence of each parameter was checked for each run both by hand and using the software Tracer 1.4 (DRUMMOND & RAMBAUT 2007). The Bayes Factor Test A showed significant convergence problems with the settings nst=6. Therefore, the second-best model (nst=2) was chosen for the three partitions of final runs 3 and 6-9 (table 2.2). Also the unlinking of partitions improved the model likelihood in the pretests (BFT A+B); however, parameter convergence of preliminary test runs with unlinked partitions was more problematic than for runs without unlinked. The unlinking is a more realistic scenario (delivering also a better model likelihood in the pretests), because it implies that all partitions can show different rates along the genes. For the final runs (table 2.2) the dataset with unlinked partitions was additionally tested (against the more conservative model setting without unlinking). The consideration was that longer iterations (doubled from 20 to 40 million) could enable a convergence stability for the nst=2 model. 37
50 2. Material and Methods Molecular insights to crustacean phylogeny To compare alignment methods and their impact on the resulting topologies, differing settings were additionally performed for the final runs next to the best model (see run 2, table 2.2) identified in the pretests. A second BFT and parameter convergence was conducted to check again the resulting final runs (supplementary table S9). Table 2.2: Final runs for the dataset. Each run was performed with 2 x 4 chains on a Linux cluster running the parallel (MPI) MRBAYES version (HUELSENBECK & RONQUIST 2001). The cluster is a HP Blade system at the ZFMK (Bonn) with HP ProLiant DL380 G5 blades (Xeon dual quadcore E GHz, 2x 4MB L2-cache, 32 GB RAM, 8 HDD, 64bit system). The RAXML run was computed with RAXML 7.04 P-THREADS (STAMATAKIS 2006). Final runs Prealignment Processing Model setting Iteration Burnin run 1 MAFFT RNASALSA nst= mio 10 mio. mixed 2528 bp ALISCORE (-r) 5 partitions models ALICUT gamma RY-coded run 2 MAFFT RNASALSA nst= mio 10 mio. mixed 2528 bp ALISCORE (-r) 5 partitions models ALICUT gamma part. unlinked RY-coded run 3 MAFFT RNASALSA nst= mio 10 mio. 3 partitions 2528 bp ALISCORE (-r) gamma ALICUT unlinked RY-coded run 4 MUSCLE RNASALSA nst= mio 10 mio. mixed 2528 bp ALISCORE (-r) 5 partitions models ALICUT gamma RY-coded run 5 MUSCLE RNASALSA nst= mio 10 mio. mixed 2528 bp ALISCORE (-r) 5 partitions models ALICUT gamma part. unlinked RY-coded run 6 MUSCLE Manual aligment nst=2 40 mio 10 mio. 3 partitions 4902 bp (no masking) gamma run 7 MUSCLE Manual aligment nst=2 40 mio 10 mio. 3 partitions 3288 bp masked by hand gamma run 8 MUSCLE Manual aligment nst=2 40 mio 10 mio. 3 partitions 2449 bp ALISCORE (-r) gamma ALICUT unlinked run 9 MUSCLE Manual aligment nst= mio 10 mio. 3 partitions 2449 bp ALISCORE (-r) 3 partitions part. unlinked ALICUT gamma unlinked RY-coded run 10 MAFFT RNASALSA unpartitioned (-f, a, GTR+CAT) RAXML 2528 bp ALISCORE (-r) bootstrap- 38
51 Molecular insights to crustacean phylogeny 2. Material and Methods ALICUT replicates For Runs 1-2 and 4-5, a mixed-model setting was used with five partitions as follows: 1 = 18S loop regions, 2 = 18S stems regions, 3 = 16S loop regions, 3 = 16S stem regions, 5 = COI (see Table 2.3). Table 2.3: Number of alignment positions for the partitioned datasets based on alignments using the programs MAFFT and MUSCLE. Gene (region) 18S loop 18S stem 16S loop 16S stem COI Total Run 1-2 (MAFFT) l th 2547 Run 4-5 (MUSCLE) For partitions 1, 3 and 5, the 4by4 (Standard DNA) model was chosen, for partitions 2 and 4, we applied the doublet model (nst=2) to account for secondary structures and covariation of paired stem positions. For the 18S loop (partition 1), nst=2 was chosen, while the loop region of 16S and the COI sequences were RY-coded to compensate for saturation effects. In this case, the setting nst=1 was chosen to consider that transitions and transversions are equally likely. Run 3 was conducted with 3 partitions only to compare the influence of mixed models on the analyses. The unmasked manual alignment (run 6) was optimized manually (run 7), processed with ALISCORE and ALICUT (run 8) and additionally RY coded for COI and 16S loop regions (run 9) to see the influence of an objective procedure on this data. The Bayesian analyses were performed on a parallel version (MPI) of MRBAYES 3.0 (HUELSENBECK & RONQUIST 2001; RONQUIST & HUELSENBECK 2003) with 40 million generations for each final run with standard settings and 4 chains for each of the two parallel runs in MRBAYES. A likelihood analysis was computed using RAXML P-THREADS (OTT ET AL. 2007; STAMATAKIS 2006). Run 10 was performed with the unpartitioned MAFFT dataset. 39
52 2. Material and Methods Molecular insights to crustacean phylogeny 2.5 Analyses [B]: Is implementation of secondary structure based on alignment optimization and time-heterogeneity a solution to improve inference of crustacean phylogeny? Science is wonderfully equipped to answer the question How? - But it gets terribly confused when you ask the question -Why? - ERWIN CHARGAFF Objectives In this analysis the methods of analysis [A were massively expanded. Automated alignment processing and optimization using RNASALSA were applied by default. The central objective for this analysis was to perform a time-heterogeneous analysis and to compare its results with a simple time-homogeneous analysis. This main focus on timeheterogeneity should compensate inhomogeneous base frequencies found for the dataset [B] and yet for the dataset in analysis [A]. The assumption was that completely sequenced SSU & LSU rrna genes are useful to resolve the deeper splits of crustacean phylogeny and the position of crustaceans within arthropods. Some results are discussed and published in BMC Evolutionary Biology, see the attached manuscript I in the supplement Taxon sampling In total 148 concatenated 18S and 28S rrna sequences were included in the analysis (supplementary table S10). 27 new sequences for crustaceans were gained: 13 for the 18S and 14 for the 28S rrna gene, respectively. Sequences of Pterygota and basal Hexapoda were kindly provided from collaborating working groups of B. MISOF, G. PASS and H. HADRYS, a close cooperation for this analysis existed in general with K. MEUSEMANN. Only sequences which span at least 1500 bp for the 18S gene and 3000 bp for the 28S gene were finally included. For 29 taxa concatenated, composite sequences of 18S and 28S rrna sequences were reconstructed. These are marked with an asterisk (see supplementary table S11). GenBank species were chosen as closely related as possible. Composite 18S sequences were constructed manually of Speleonectes tulumensis (EU370431, present study and L81936) and 28S sequences of Raillietiella sp. (EU370448, present study and AY744894). Concerning the 18S of Speleonectes tulumensis we combined positions of L81936 and positions of sequence EU Regarding the 28S of Raillietiella we combined positions of AY with positions of sequence EU Position numbers refer to aligned positions. The out-group included the concatenated 18S and 28S rrna sequences of Milnesium sp. (Tardigrada). 40
, KJER (1995) AND MISOF ET AL. (2006) to improve sequence alignment.")
53 Molecular insights to crustacean phylogeny 2. Material and Methods Analysis design Secondary structures of rrna genes were considered as advocated by BUCKLEY ET AL. (2000), HICKSON ET AL. (2000), KJER (1995) AND MISOF ET AL. (2006) to improve sequence alignment. Structural features are the targets of natural selection, thus the primary sequence may vary, while the functional domains are structurally retained. Alignments and their preparation for analyses were executed with the multiple sequences for each gene separately. Sequences were prealigned using MUSCLE v3.6 (EDGAR 2004A). Sequences of 24 taxa of Pterygota were additionally added applying a profile-profile alignment (EDGAR 2004B). The 28S sequences of Hutchinsoniella macracantha (Cephalocarida), Speleonectes tulumensis (Remipedia), Raillietiella sp. (Pentastomida), Eosentomon sp. (Protura) and Lepisma saccharina (Zygentoma) were incomplete. Apart from L. saccharina, prealignments of these taxa had to be corrected manually. The BLAST 2 SEQUENCES'' tool was used to identify the correct position of sequence fragments in the multiple sequence alignment (MSA) for these incomplete sequences. Figure 2.7: Design of analysis [B]. Input files of analyses are green, output files grey colored. The process flow shows the structure of the files for the phylogenetic software. The analysis design was conducted in close cooperation with K. MEUSEMANN. 41
54 2. Material and Methods Molecular insights to crustacean phylogeny Phylogenetic tree reconstruction Mixed DNA/RNA substitution models were chosen, in which sequence partitions corresponding to loop regions were governed by DNA models and partitions corresponding to stem regions by RNA models that consider co-variation. Among-site- rate variation (YANG 1996) was implemented in both types of substitution models. Base frequency tests indicated that base composition was inhomogeneous among taxa (see results), suggesting nonstationary processes of sequence evolution. To take such processes into account the analyses were performed in PHASE-2.0 (GOWRI-SHANKAR & RATTRAY 2006) to accommodate this compositional heterogeneity to minimize bias in tree reconstruction. Base compositional heterogeneity is implemented in PHASE-2.0 according to the ideas developed by FOSTER (2004). The number of candidate models was limited to the HKY85+Gamma (A), TN93+Gamma (B) and REV+Gamma (C) models for loop regions and the corresponding RNA16K+Gamma, RNA16J+Gamma and RNA16I+Gamma models for stem regions. Site heterogeneity was modeled by a discrete gamma distribution (YANG 1994) with six categories. The extent of invariant characters was not estimated since it was shown to correlate strongly with the estimation of the shape parameter of the gamma distribution (WADELL ET AL. 1997; SULLIVAN & SWOFFORD 2001; KELCHNER & THOMAS 2007; YANG 1996). The data was partitioned into four units representing loop and stem regions of 18S rrna and loop and stem regions of 28S rrna. DNA and RNA substitution model parameters were independently estimated for each partition. Substitution models were selected based on results of time-homogeneous setups. Three different combinations of substitution models were tested, REV +Gamma & RNA16I +Gamma, TN93 +Gamma & RNA16J +Gamma and HKY85 +Gamma & RNA16K +Gamma. Dirichlet distribution was used for priors, proposal distribution and Dirichlet priors and proposals for a set of exchangeability parameters (supplementary table S12) described in GOWRI-SHANKAR & RATTRAY (2007). Appropriate visiting of the parameter space according to the posterior density function (ZWICKL & HOLDER 2004) was checked by plotting values of each parameter and monitoring their convergence. This was calculated for all combinations after 500,000 generations (sampling period: 150 generations). Models in which values of several parameters did not converge were discarded. For models that displayed convergence of nearly all parameter values, re-runs of the MCMC processes were performed with 3,000,000 generations and a sampling period of 150 generations. Prior to comparison of the harmonic means of lnl values, 299,999 generations were discarded as burn-in. After a second check for convergence the model with the best fitness was selected applying a Bayes Factor Test (BFT) to the positive values of the harmonic means calculated from lnl values (KASS & RAFTERY 1995; NYLANDER ET AL. 2004). The favored model (2ln B 10 >10) was used for final phylogenetic reconstructions. To compare time-homogeneous vs. time-heterogeneous models in Bayesian analyses, 14 independent chains of 7,000,000 generations and two chains of 10 million generations were run for both setups on a Linux cluster with HP ProLiant DL380 G5 blades 42

55 Molecular insights to crustacean phylogeny 2. Material and Methods (ZFMK Bonn). For each chain the first two million generations were discarded as burn-in (sampling period of 1000). The setup for the time-homogeneous approach was identical to the pre-run except for number of generations, sampling period and burn-in. The setting for the time-heterogeneous approach differed (figure 2.8). It followed the method of FOSTER (2004) and GOWRI-SHANKAR & RATTRAY (2007) in the non-homogeneous setup whereby only a limited number of composition vectors can be shared by different branches in the tree. Exchangeability parameters (average substitution rate ratio values, rate ratios and alpha shape parameter) were fixed as input values. Values for these parameters were computed from results of the preliminary time-homogeneous pre-run (3,000,000 generations). A consensus tree was inferred in the PHASE software with the option (like a sub-program) Mcmcsummarize using the output of the pre-run (see figure 2.8). This consensus tree topology and the model file of this run served as input for a ML estimation of parameters in the PHASE software option Optimizer (see figure 2.8). Figure 2.8: Detailed flow of the procedure of analyses [B] using the software package PHASE-2.0. Options (or software sub-program) used in PHASE-2.0 are italicized above the arrows and are followed by input files. Black arrows represent general flows of the analysis procedure, green arrows show that results or parameter values after single steps were inserted or accessed in a further process. Red block-arrows mark the final run of the timeheterogeneous and time-homogeneous approach with 16 chains each (2 x 118,000,000 generations). First row: I.) 3 control files (control.mcmc) were prepared for Mcmcphase using three 43
56 2. Material and Methods Molecular insights to crustacean phylogeny different mixed models. This pre-run'' was used for a first model selection (500,000 generations for each setting). Model (C) was excluded from the candidate models (colored in red, see pre-run I ) based on non-convergence of parameter values. II.) Step one (I.) was repeated with 3,000,000 generations using similar control files (different number of generations and random seeds) of the two remaining model settings. Calculated ln likelihoods values of both chains were compared in a BFT resulting in the exclusion of mixed model (A). Parameter values of the remaining model (B) were implemented in the time-heterogeneous setting. III.) We started the final analysis (final run) using sixteen chains for both the time-homogeneous and the time-heterogeneous approach. In the final time-homogeneous approach, the control files were similar to step II.) except for a different number of generations and random seeds. Second row: Additional steps were necessary prior to the computation of the final timeheterogeneous chains. Mcmcsummarize was applied for the selected mixed model (B) to calculate a consensus tree. Optimizer was executed to conduct a ML estimation for each parameter value (given in the opt.mod file) based on the inferred consensus tree and optimized parameter-values (mcmc-best.mod), a data file delivered by Mcmcphase. Estimated values were implemented in an initial.mod file. The initial.mod file and its parameter values was accessed by the control files of the final time-heterogeneous chains (only topology and base frequencies estimated). Third row: Trees were reconstructed separately for the time-homogeneous and timeheterogeneous setting. All chains of each approach were tested in a BFT against the chain with the best lnl. We only included chains with a 2ln B 10 -value >10. From these chains a metachain was constructed for each setting using Perl and applied Mcmcsummarize to infer the consensus topology. To estimate branch lengths properly Mcmcphase was conducted, resulting branch lengths were implemented in the consensus trees. Estimated values of exchangeability parameters from the resulting Optimizer output file and estimated start values for base frequencies were fed into Mcmcphase for the timeheterogeneous analysis. Values of exchangeability parameters remained fixed during the analysis. The number of allowed base frequency categories (models) along the tree was also fixed. The number of base frequency groups was set to three submodels, reflecting base frequency heterogeneity. Harmonic means of ln Likelihood values of these 16 independent chains were again compared with a BFT to identify possible local optima in which a single chain might have been trapped. Only sample data of chains with a 2ln B 10 -value <10 (KASS & RAFTERY 1995) was merged using a Perl-script to construct a metachain ' (BEIKO ET AL. 2006). Finally ten time-heterogeneous chains and three time-homogeneous chains were included. The assembled meta-chains included 56 million generations for the non-stationary approach (table 2.4) and 18 million generations for the time-homogeneous approach (table 2.4), burnins were discarded. 44
57 Molecular insights to crustacean phylogeny 2. Material and Methods Table 2.4: Chains included to infer the time-heterogeneous and homogeneous consensus trees. Chains included for time-heterogeneous models generations (burnin excluded) harmonic mean ln-likelihood 2ln (B10) 1 5 million million million million million million million million million million Chains included for time homogeneous models generations (burnin excluded) harmonic mean ln-likelihood 2ln (B10) 1 8 million million million Consensus trees and posterior probability values were inferred using Mcmcsummarize. Branch lengths of the time-homogeneous and time-heterogeneous consensus tree were estimated using three Mcmcphase chains (4 million generations, sampling period 500, topology changes turned off, starting tree = consensus tree, burn-in: 1 million generations) from different initial states with a GOWRI-SHANKAR modified PHASE version. To infer mean branch lengths data was combined with the described branch lengths and Mcmcsummarize. These mean branch lengths were used to redraw the consensus tree (figure 2.8). 45
58 2. Material and Methods Molecular insights to crustacean phylogeny 2.6 Analyses [C]: Do phylogenomic data enlight crustacean phylogeny within arthropods - or do old problems stick to the analysis of this new large-scale data? Facts do not speak for themselves, they are read in the light of theory STEPHEN JAY GOULD Objectives Extensive sequence data from genome sequencing and expressed sequence tags (ESTs) projects were recently used to infer deep metazoan phylogeny (DUNN ET AL. 2008; PHILIPPE ET AL. 2009; ROEDING ET AL. 2007). These studies report robust results concerning crustacean and arthropod relationships, but are however deficient in taxon sampling of arthropod groups, e.g. large groups like crustaceans are covered by only few taxa and important groups of chelicerates, myriapods or primary wingless hexapods are completely missing. Until recently, arthropod data with broad taxon sampling were predominantly restricted to single gene analyses, e.g. rrna genes (MALLAT & GIRIBET 2006; MALLAT ET AL. 2004). The largest phylogenomic dataset of crustaceans and arthropods including 233 taxa was compiled for this analysis in order to alleviate the restrictions of current phylogenomic data. Previous phylogenomic analyses have shown that massive accumulation of data is not sufficient to guarantee reliable tree reconstruction, but instead selection of orthologous loci, consideration of data quality and missing data and model fitting must be part of the analysis pipeline (DUNN ET AL. 2008; PHILIPPE ET AL. 2009; ROEDING ET AL. 2007). Therefore, new tools were used for orthologous gene prediction (HaMStR, EBERSBERGER ET AL. 2009, see figure 2.9), alignment masking (MISOF & MISOF 2009) and new heuristics for selection of genes and taxa were applied Taxon sampling Three new crustacean EST taxa of three different underrepresented major crustacean groups (table 2.5) were added to other published sequences (supplementary table S13). Table 2.5: EST sequencing projects for crustacean taxa. Number of sequences gained during the processing from raw ESTs to final orthologous gene sequences (see analysis design). Crustacean group Species Raw ESTs ESTs processed EST contigs Branchiopoda Triops cancriformis Cirripedia Pollicipes pollicipes Copepoda Tigriopus californicus Orthologous Sequences 46
59 Molecular insights to crustacean phylogeny 2. Material and Methods Until recently data of only one copepod representative was published with only few genes. Therefore Tigriopus californicus was additionally sequenced. Branchiopoda are to date only represented by extremely derived species of the anostracan group in phylogenomic data, namely several Artemia species. Genome projects of Daphnia magna/pulex exist additionally. That was the reason to choose Triops cancriformis, a representative of the Notostraca. Pollicipes pollicipes is to date the only cirripede for which EST data exists. For an overview of published crustacean EST data (27 projects in total) see supplementary table S14. Especially for phylogenomic data the over-representation of malacostracan crustaceans is conspicuous. Some to date unpublished sequences which were generously provided by the arthropod working groups of T. BURMESTER (Myriapods & Chelicerates), B. MISOF (basal Hexapods), and H. HADRYS (Hexapods) could be included in this analysis. The analysis was conducted in cooperation with K. MEUSEMANN. 233 taxa were implemented for final analysis (214 taxa of Euarthropoda plus representatives of 3 onychophorans, 2 tardigrades and out-group taxa) with a total of 775 putative orthologous gene loci (supplementary table S15) Analysis design The general idea of this approach is to reduce effects of under sampling of taxa and genes and filter instable taxa before tree reconstruction. A strategy is chosen in which a subset of the concatenated super matrix is selected to condense it to a maximally informative set of taxa and genes. Informativeness of genes and taxa was assessed by integrating established methods (see figures ). This preprocessing of the total data helped to considerably reduce the effort spent in tree reconstructions. It also opens a route to assess whether it is worthwhile to include new taxa or genes in a pre-existing supermatrix based on their contribution to the total informativeness of the supermatrix without using tree reconstructions. Sequence processing and orthology assignment (figure 2.9). New EST data were preprocessed with the software tool LUCY (CHOU & HOLMES 2001) for DNA sequence quality trimming and vector removal. EST data available for arthropods (myriapods, chelicerates, pancrustaceans, onychophorans) plus tardigrades and selected species of nematodes, annelids and molluscs were extracted from dbest (NCBI), the Gene Index Project or the NCBI Trace Archive. EST sequences of 244 taxa (222 euarthropods) were screened for contamination, trace files and low-quality ends of sequences quality checked. To obtain contigs, the ESTs were clustered using the TGICL, a software system for fast clustering of large EST datasets (PERTEA ET AL. 2003) and the contigs were translated into amino acid level for orthology prediciton by the HaMStR approach (EBERSBERGER ET AL. 2009). Therefore, a reference gene set was used with 13 mainly arthropod species plus three vertebrates (figure 2.9 and supplementary table S13). The pipeline for this procedure was developed in the bioinformatics group of A. V. HAESELER (CIBIV, Vienna) within the deep metazoan phylogeny 47

60 2. Material and Methods Molecular insights to crustacean phylogeny program, the settings for the reference gene set was suggested by the present author in cooperation with others. Figure 2.9: Processing of EST data and orthology assignment. EST raw data (orange) of own and public EST projects were mined and processed in four major steps (yellow): preprocessing, processing, orthology prediction and annotation. [1] In preprocessing, EST sequences were screened for vectors and poly(a) tails using LUCY (CHOU & HOLMES 2001). Then all sequences including published ESTs were screened for contamination by comparison against UNIVEC ( UniVec.html) with CROSSMATCH ( crossmatch.html) and SEQCLEAN ( SEQCLEAN screened for poly(a) tails as well. Sequences < 100 nucleotides were discarded. Afterwards repetitive elements in the remaining ESTs were soft masked with REPEATMASKER (SMIT 1996) using REPBASE (JURKA ET AL. 2005). [2] ESTs were clustered using the TGICL package (PERTEA ET AL. 2003). ESTs generated in own projects were quality clipped with LUCY and clustered a second time to obtain and keep longer sequences for the EST contigs. The contigs were translated into amino acid level and [3] integrated in the orthology prediction (HaMStR). A set of reference proteomes (INPARANOID, was compiled with D. pulex, T. castaneum, B. mori, A. aegypti, A. melifera, D. melanogaster, C. elegans, C. briggsae, Capitella sp., L. gigantea, H. sapiens, T. nigroviridis and X. tropicalis as primer taxa. Multiple alignments of core orthologs for primer taxa were used to train Hidden Markov Models (HMMs) to search in each protein set of the 244 taxa for hits. A reciprocal BLASTP decides about the surviving of a hit. For the re-blast step always the proteome of the presumably evolutionary closest primer taxon for each considered species was chosen. Finally a set of 775 putative orthologous gene loci is constituted. [4] In a side step EST 48
. The contig is annotated according to the protein sequence with the highest GeneWise score.")
61 Molecular insights to crustacean phylogeny 2. Material and Methods contigs were annotated using a BLASTX search against NCBI s non-redundant protein database. The protein sequences of the 25 best hits for each contig were aligned with GENEWISE (BIRNEY ET AL. 2004). The contig is annotated according to the protein sequence with the highest GeneWise score. Single EST reads were submitted to EMBL. Alignments and alignment masking. All 775 putative orthologous gene loci were aligned (figure 2.10) with MAFFT L-INSI (KATOH & TOH 2008). The complete dataset comprised 222 euarthropods, 3 onychophorans, 2 water bears, 3 vertebrates, 8 nematodes, 3 annelids and 3 molluscs as out-group. All vertebrates and eight Drosophila species were excluded from further processing to avoid overrepresentation of this genus. Figure 2.10: Alignment masking, selecting an optimal data-subset and phylogenetic analyses. Based on the 775 putative orthologous genes (orange) the workflow consists of three major steps (yellow): alignment process, matrix reduction and phylogenetic reconstruction. [1] The alignment process starts aligning multiple sequence alignments for each single gene separately using MAFFT (KATOH & TOH 2008). ALISCORE 49
 excises all positions scored negatively by ALISCORE. The genes are concatenated to a masked super alignment (green).")
62 2. Material and Methods Molecular insights to crustacean phylogeny (MISOF & MISOF 2009) identifies randomly similar sections in each alignment. ALICUT ( excises all positions scored negatively by ALISCORE. The genes are concatenated to a masked super alignment (green). [2] The step of reduction heuristics starts with the calculation of the relative information content of each gene in our masked superalignment. The generated matrix (taxa vs. genes) is provided with a value for relative information content of each gene. A subset (green) is selected by excluding genes and taxa showing low relative information content [3] Phylogenetic trees were reconstructed using RAXML and PHYLOBAYES. The two resulting ML trees (green) are derived from the data subset and the original dataset. PHYUTILITY was used to identify instable taxa. 25 chains were set (PHYLOBAYES) after testing for topological incongruencies (see Phylogenetic tree reconstructions ) resulting in a triple consensus tree (3 chains). Being aware that excluding randomly similar aligned sections can make phylogenetic analyses more reliable prior to tree reconstruction (CASTRESANA 2000) every single gene alignment was masked with ALISCORE (MISOF & MISOF 2009) on amino acid levels with default window size and maximal number of pairwise comparisons. For each gene, only sequences comprising more than one half of the average sequence information (sequence lengths) were included in the ALISCORE analyses. Sections scored as randomly similar were discarded with ALICUT and all alignments were concatenated to a super alignment comprising 233 taxa and 350,356 amino acid positions. Selecting a data subset using new matrix reduction heuristics. With the software MARE (MAtrix REduction) (MISOF ET AL., in prep.) potential relative phylogenetic information content of each single partition (gene) within a super alignment was calculated based on weighted geometry quartet mapping (NIESELT-STRUWE & HAESELER 2001) which was extended to amino acid data (figure 2.10 and 2.11). Figure 2.11: Potential relative information content of genes visualized by 2D simplex bipartite graphs. Potential information content (rel. info) of a single partition (gene) is defined as the relative tree-likeness of the data using geometry mapping (NIESELT- STRUWE & HAESELER 2001), extended to amino acids incorporating the BLOSUM62 50

63 Molecular insights to crustacean phylogeny 2. Material and Methods substitution matrix. Relative tree-likeness corresponds to the relative frequency of simplex points each representing a quartet of taxa within the outer areas of at least partially resolved trees compared to the total number of simplex points. Genes containing less than four sequences and taxa containing less than 1/3 of the single gene sequence are considered as absent. Each gene received a value of informativeness between 0.0 and 1.0, reflecting the relative number of resolved quartet trees. A data availability matrix was then transformed into a matrix of potential information content of each taxon and gene by multiplying availability (0 or 1) with scores of informativeness. Relative information content of each gene was calculated as the average value over all taxa including missing data. The total average information content of a super matrix was calculated as the sum over all genes (figure 2.12). Figure 2.12: Original data matrix with potential relative information content of each gene and taxon. The matrix comprises 233 taxa (rows) and 775 genes (columns). Potential relative information content ranges from (10 units). Potential relative information content is color coded (see color scale) from dark blue (> ) to white (relative information content of or missing data). Genes with a relative information content < 0.04 were considered as absent. Overall relative information content of the matrix: 0.1, overall saturation: 17.6%. To select an optimal subset of taxa and genes with high total average information content a simple hill climbing procedure was used. Reduction starts with dropping either a taxon (row) or a gene (column) with the lowest average information content, generating a new matrix. Consequently taxa or genes with lowest average information content will be discarded from the matrix, and a data subset with increased relative information content (figure 2.13) is obtained. The copepod Tigriopus and the chilopod Scutigera were defined as constrained taxa, thus they were not dropped from the sub-matrix. These taxa were thought to be important to shorten long branches and therefore retained. In order to reach an optimum of matrix 51
.")
64 2. Material and Methods Molecular insights to crustacean phylogeny reduction, an optimality function was defined, which takes into account that size reduction and low average information content are penalized. The connectivity between taxa was monitored. Details of the new reduction algorithm will be published elsewhere (MISOF ET AL., in prep.). Finally, the original super-alignment was rewritten based on the optimal subset of the data Although this final matrix of the data subset is partly a result of this analysis it will be presented in this section for a better understanding of the entire reduction procedure. Figure 2.13: Optimal data subset. The matrix comprises 117 taxa (rows) and 129 genes (columns). Potential relative information content ranges from (10 units). The color code is specified in Supplementary Fig. 4. Tigriopus (Copepoda, Crustacea) and Scutigera (Diplopoda, Myriapoda) are defined as constraints (first and second row), thus remain in the matrix although they show few gene hits. Overall relative information content of the matrix: 0.43, overall saturation: 62.3%. 52
65 Molecular insights to crustacean phylogeny 2. Material and Methods Phylogenetic tree reconstruction ML analyses were performed using RAXML PTHREADS (OTT ET AL. 2007; STAMATAKIS 2006). The optimal data subset comprised 129 genes, 117 taxa (101 arthropods including onychophorans, two tardigrades, nematodes, annelids and three molluscs) and 37,476 aa positions. ML tree search and rapid bootstrapping were applied within one step (-f a, 1,000 bootstrap replicates). To examine possible biases, ten single ML tree searches and separate bootstrapping (100 replicates) for the original concatenated supermatrix (350,356 aa positions) were conducted. Due to restricted computational power, calculation of branch lengths was not possible. The ML tree with the best likelihood value was chosen to plot bootstrap values (results, figure 3.13). All ML searches were calculated with the PROTMIX substitution model and the WAG matrix (WHELAN & GOLDMAN 2001). The WAG matrix is commonly used for protein coding genes, which is based on empirical data for globular proteins. It allows the prediction of convergences and reversions among amino acids with biochemical structure. A major disadvantage is that highly saturated positions will be underestimated with the WAG matrix implementing substitution processes only in a small level reaching equilibrium rather early (LARTILLOT ET AL. 2007A). This means after reaching this equilibrium very fast for highly saturated positions the WAG model equals a sitehomogeneous model. Bayesian analyses for the data subset were inferred using PHYLOBAYES version 2.3c (LARTILLOT ET AL. 2007B) running the CAT mixture model (LARTILLOT & PHILIPPE 2004). In contrast to the WAG matrix a mixture model as the CAT model (LARTILLOT & PHILIPPE 2004) reflects more realistic a multiple substitution process by sorting the positions into groups with several profiles of amino acid frequencies. 25 MCMC chains ran for 20,000 cycles each, sampling every cycle. All parameter values were checked for convergence to define the burn-in (5,000 cycles). To infer a majority rule consensus (mrc) tree the discrepancy observed across all bipartitions (maxdiff) was checked of all chains by pairwise comparison and comparing triple chain-combinations with the bpcomp tool. Harmonic means of the likelihood values of each chain (burn-in excluded) were calculated. To infer the Bayesian mrc tree three chains were included showing the lowest maxdiff value (0.186) while featuring the best likelihood values (harmonic means) of all triple-chain combinations (table 2.6). 53
66 2. Material and Methods Molecular insights to crustacean phylogeny Table 2.6: Likelihood values and chain combinations of the 25 PHYLOBAYES runs. Chain IDidentifier for each PHYLOBAYES-chain from the 25 runs; log LH (harmean) harmonic mean of all log likelihood values, 15,000 cycles per chain while the burnin was excluded; chain combination chain combinations consisting of three chains each per combinations (triple) for which the maxdiff values (PHYLOBAYES) were below 0.3; maxdiff discrepancy value observed across all for the given triplechain. Chain ID Log likelihood (harmean, burnin excluded) Chain combination maxdiff c c04 - c18 - c c c23 - c01 - c c c21 - c23 - c c c21 - c23 - c c c01 - c23 - c c c21 - c08 - c c c22 - c05 - c c c22 - c05 - c c c22 - c14 - c c c05 - c14 - c c all 25 chains 1 For identification of instable taxa leaf stability indices (THORLEY & WILKINSON 1999) were calculated from the collected bootstrap trees of the ML analysis using PHYUTILITY (SMITH & DUNN 2008). Instable taxa are identified by taxa triplets in PHYUTILITY by calculating a stability index of taxa combination for these triplets. A threshold of < 95% was defined as instable. All analyses ran several months on Linux Clusters of the ZFMK and of the SuGI (Sustainable Grid Intrastructure) project, VIKTOR ACHTER, University of Cologne. Consensus network and statistics of Bayesian topologies. Due to differences between single topologies of the 25 PHYLOBAYES (LARTILLOT & PHILIPPE 2004) chains a consensus network (HOLLAND & MOULTON 2003) was computed with SplitsTree 4.8 (HUSON & BRYANT 2006). To visualize conflicts a threshold of 0.01 was chosen and averaged edge weights incorporated. 54
67 Molecular insights to crustacean phylogeny 2. Material and Methods 2.7 Analysis of hemocyanin structure in Remipedia It is a good morning exercise for a research scientist to discard a pet hypothesis every day before breakfast. It keeps him young KONRAD LORENZ Objectives Oxygen transport in the hemolymph of various arthropod taxa is facilitated by copperproteins referred to as hemocyanins (BURMESTER 2002; MARKL & DECKER 1992; VAN HOLDE & MILLER 1995). Hemocyanins of Arthropoda are large hexameric or oligohexameric proteins composed of similar or identical subunits in the size range of 75 kda. Each subunit can bind to an O 2 molecule by the virtue of two copper ions that are coordinated by six histidine residues. Hemocyanins have been thoroughly studied in Chelicerata and Crustacea, occur in Myriapoda (KUSCHE & BURMESTER 2001), and have recently been identified in Onychophora (KUSCHE ET AL. 2002) and Hexapoda (HAGNER-HOLLER ET AL. 2004; PICK ET AL. 2008; PICK ET AL. 2009). Within Crustacea, hemocyanins have been thought to be confined to Malacostraca (MANGUM 1985; MARKL & DECKER 1992). Hemocyanin sequences have been shown to be informative for the inference of phylogenies within Arthropoda (BURMESTER 2001; KUSCHE & BURMESTER 2001). Thus, lineagespecific presence and phylogenetic analyses could be useful in assessing the phylogenetic position of Remipedia. Screening the preliminary EST data of Speleonectes tulumensis hemocyanin, three subunits were found and analyzed Analysis design This analysis was conducted in close cooperation with B. ERTAS and T.BURMESTER of the University Hamburg, it was published in the Journal Molecular Biology and Evolution, see attached manuscript II in the supplement. Screening the preliminary Speleonectes tulumensis EST database for hemocyanin three subunits of this respiratory protein were found. From fresh tissue sequences were specifically amplified and sequenced. The laboratory work (cloning of identified sequences and western blotting for protein amplification) was accomplished by B. ERTAS in the lab of T. BURMESTER. The present author collected material and co-worked on the manuscript Phylogenetic tree reconstruction Bayesian phylogenetic analysis was performed with 8,000,000 generations using MrBayes (HUELSENBECK & RONQUIST 2001), assuming the WAG model with a gamma distribution of substitution rates. The program Tracer 1.4 ( tracer/) was used to examine log-likelihood plots and MCMC summaries for all parameters. Posterior probabilities were estimated on the final 60,000 trees (burnin = 20,000). 55
68 2. Material and Methods Molecular insights to crustacean phylogeny A maximum likelihood analyses was performed in RAXML (WAG model) and the resulting tree was tested by bootstrapping with 1000 replicates. TREE-PUZZLE 5.2 (SCHMIDT ET AL. 2002) was used to test alternative tree topologies. The phylogenetic analysis was performed at the University of Hamburg using Linux cluster systems, for more details of the laboratory work, molecular analysis and tree reconstruction see attached manuscript II in the supplement. 56
69 3. RESULTS There are many hypotheses in science, which are wrong. That s perfectly all right; they re the aperture to finding out what s right. Science is a self-correcting process. To be accepted, new ideas must survive the most rigorous standards of evidence and scrutiny. CARL SAGAN 3.1 Analyses [A]: Can 16S, 18S and COI marker genes improve inference of crustacean phylogeny? Comparing usual standard vs. secondary structure based approaches Data signal and split supporting patterns Neighbor-joining networks visualize the presence and nature of potentially conflicting signals in the data (figures ). The networks clearly show that conflicting signals prevail, indicated by the preponderance of non-parallel edges that represent conflicting splits of groups of taxa. This lack of a strong tree-like signal is additionally reflected by the presence of many unresolved areas, and low clade support values in the phylogenetic trees. Certain crustacean clades are apparent in the networks, such as Cirripedia, Copepoda, and Branchiopoda. Accordingly, we recovered these clades in all our phylogenetic analyses. Each of the networks evidences that the data is obviously biased with long branch problems. A conspicuous grouping of long branch taxa is observed in all reconstructed networks. New alignment processing methods: The networks show that data processing and optimization of alignments (figure 3.1, A and B) as described in chapter 2 can to an extent grade improve the structure of the data by removing conflict. The RY coding (figure 3.1, B) improved the dataset by eliminating more conflicts. This is illustrated by the pycnogonids. Both networks are based on the same MAFFT alignment, but only in the RY coded network the three included pycnogonids, an expected clade, group together. Manually aligned dataset: The dataset aligned (figure 3.2, A) and optimized by hand (figure 3.2, B) at the working group of S. KOENEMANN do not differ significantly from each other. Optimization and masking by hand did not greatly improve the general data structure. Contrary, one can see that there is obviously a problem in this procedure: optimizing data by hand drives one eventually in the problematic situation that homology assumptions and random sequence similarity are not clearly to distinguish. The best example for this problem is the clade Mystacocarida. The two mystacocarids cluster together in the manually optimized alignments, which is more than doubtful and suspicious regarding the fact that the published mystacocarid 18S sequence is a contamination (see 3.3 problematic data). A final result of the network reconstructions is that the dataset based on the marker genes 18S, 16S and COI shows a problematic data structure prior to tree reconstruction. 57
 and additionally RYcoded (B) dataset.")

70 3. Results Molecular insights to crustacean phylogeny Figure 3.1: Networks of the processed, MAFFT-aligned (A) and additionally RYcoded (B) dataset. Sequences identified as contaminated are marked with an orange circle. For color code, see graphics. Crustaceans are marked red and some groups are highlighted with species pictures (only some taxa are exemplarily colored). 58

 and additionally manually")
71 Molecular insights to crustacean phylogeny 3. Results Figure 3.2: Networks of the manually aligned (A) and additionally manually optimized (B) dataset. 59
72 3. Results Molecular insights to crustacean phylogeny Base compositions Heterogeneous base composition was checked for the MAFFT-aligned, data matrix of Run 1-4 (table 2.2). Compositional base homogeneity was rejected for the total dataset (including all taxa) and also for the set of all crustaceans (P-value of P= ). In contrast, base composition homogeneity could not be rejected for more restricted branchiopod and maxillopodan groups. RY coding was implemented to handle this inhomogeneous base composition. Table 3.1: Base frequency test for the dataset, MAFFT-aligned without RY coding. P-values above 0.05 represent base homogeneity. A (-) indicates the taxa, which were excluded from the dataset (or group) before the base frequency test was applied. Name of corresponding most inclusive dataset in bold. Groups Taxa P -value All taxa 88 P = (-) Myriapoda 83 P = (-) Myriapoda, Arachnida 81 P = (-) Myriapoda, Chelicerata 72 P = (-) Myriapoda, Chelicerata, Tardigrada 71 P = (-) Myriapoda, Chelicerata, Tardigrada, Onychophora 70 P = (-) Myriapoda, Chelicerata, Tardigrada, Onychophora, Pterygota 63 P = Crustacea 57 P = (-) Cephalocarida 55 P = (-) Remipedia 56 P = (-) Remipedia, Cletocamptus 55 P = (-) Remipedia, Cephalocarida, Pentastomida, Mystacocarida 52 P = (-) Remipedia, Cephalocarida, Pentastomida, 53 P = (-) Remipedia, Cephalocarida 54 P = (-) Remipedia, Cephalocarida, Pentastomida, Mystacocarida, 51 P = Cletocamptus (-) Remipedia, Cephalocarida, Pentastomida, Cletocamptus 52 P = (-) Remipedia, Cephalocarida, Cletocamptus 53 P = (-) Remipedia, Cephalocarida, Cletocamptus, Thetissplecaris 52 P = (-) Remipedia, Cephalocarida, Cletocamptus, Thetissplecaris, 51 P = Tanaidacea, (-) Remipedia, Cephalocarida, Cletocamptus, Thetissplecaris, 50 P = Tanaidacea,, Thetysbaena (-) Remipedia, Cephalocarida, Cletocamptus, Thetissplecaris, 49 P = Tanaidacea, Thetysbaena, Speleogripphus Branchiopoda 9 P = Branchiopoda + Mystacocardia 10 P = Branchiopoda + Mystacocardia + Copepoda 16 P = Branchiopoda + Mystacocardia + Copepoda, (-) Clethocamptus 15 P = Branchiopoda + Ostracoda (-) Heterocypris + Copepoda 17 P = (-) Clethocamptus Branchiopoda + Ostracoda (-) Heterocypris + Copepoda 24 P = (-) Clethocamptus + Cirripedia 60
73 Molecular insights to crustacean phylogeny 3. Results Copepoda 6 P = Copepoda (-) Clethocamptus 5 P = Ostracoda 4 P = Ostracoda (-) Heterocypris 3 P = Cirripedia 6 P = Phylogenetic reconstruction Hypothesis testing in a second BFT of the final runs favored again the MAFFT aligned, unlinked partitioned dataset (run 2) against the linked MAFFT dataset (2ln B 10 = , harmonic mean lnl 0 = ; lnl 1 = ) and the two MUSCLE aligned datasets (see supplementary table S9). The MUSCLE aligned datasets (final run 4 and 5) showed a better model likelihood compared to final run2 but the resulting topology was less resolved and obviously biased by the MUSCLE alignment (see resulting topologies of supplementary figures S1-S9). Some general results are striking. First, as seen in the network reconstructions, the question of marker choice can be answered, which is not optimal to address crustacean phylogeny within arthropods. Only major results of the topologies will be given here in respect to that. Second, the topologies reconstructed from the manually aligned dataset are more resolved compared to the processed data. This is especially the case for deeper splits, e.g. Chelicerata or Myriapoda. Third, it can be stated that for the processed data MAFFT produces obviously more reliable topologies compared to the MUSCLE results. In the MUSCLE aligned dataset suspicious clustering of long branch taxa is found in the resulting topologies (final run 4 and 5, supplementary figures S4 and S5) uniting unrelated taxa with the longest branches: the symphylan Scutigerella, the malacostracan Spelaeogriphus, the remipedes, and the cephalocarids. The last point concerns the reliability of the topologies. In the better-resolved trees of the manually aligned data suspicious clustering is found of e.g. the two Mystacocarida, of which one is a contamination (see 3.1.4). Resulting topologies in general (figure and supplementary figures S2-S9) show certain higher-level crustacean clades, including Branchiopoda, Copepoda, Thecostraca, Cladoceromorpha and non crustacean clades as Insecta (=true insects, following NCBI taxonomy), Protura + Diplura, Arachnida and Pycnogonida (figure 3.3). A monophyletic Crustacea that excludes hexapods was not recovered in any of the trees. However, as shown in the results summary of figure 3.3, the analyses differ substantially in their ability to recover other higher-level groupings, such as Pancrustacea, Hexapoda, Chelicerata, Myriapoda and Malacostraca. Moreover, none of the trees supports or resolves hypothesized high-level clades such as Myriochelata or alternatively Mandibulata. However, the focus was primarily to investigate crustacean phylogeny and to test the ability of standard gene fragments (to date still commonly used) to reconstruct crustacean phylogeny within arthropods. 61

74 3. Results Molecular insights to crustacean phylogeny Figure 3.3: Navajo rugs showing the distribution of clades for all analyses. Dark-green squares indicate monophyly, while lighter green squares indicate monophyly with exeptions clarified by the aterisked* letters. White squares represent non monophyly for clades. Run 2 and 7 (resulting in favored topologies) are highlighted with a light green border. a*= excluding Amblyomma; b*= Heterosacchus+ Pollicipes + Semibalanus; c*= excluding Atoyida d*= excluding Speleogriphus, clustering with Remipedia + Cephalocarida Comparison of the two trees: In this section only the two favored trees of the manually aligned (figure 3.4) and automatically processed data (figure 3.5) will be presented. The resulting topologies of all other final runs are given in the supplement (supplementary figures S2-S9). Only in the topologies of the manually aligned dataset (figure 3.4 and supplementary figures S6-S8) a monophyletic Arthropoda that excludes Onychophora is reconstructed. The trees show further well-supported monophyletic Myriapoda, Chelicerata, and Pancrustacea. They suggest two basic pancrustacean clades. The first clade includes the malacostracans, remipedes, cephalocarids and hexapods, while the other one contains the branchiopods and maxillopodans (copepods, thecostracans, mystacocarids, branchiurans, pentastomids and ostracodes, excluding the myodocopan ostracode Polycope (but see Problematics of the data below). In these trees, Maxillopoda is paraphyletic with respect to Branchiopoda. The trees agree consistent with dividing the maxillopodans across three clades, (1) Copepoda, (2) Cirripedia, and (3) Mystacocarida + Branchiura + Pentastomida + Ostracoda (except Polycope). Thecostraca is only a clade in figure 3.4. The other major clade includes hexapods, remipedes, cephalocarids, and malacostracans. However, although Insecta is monophyletic in these trees, Hexapoda is not (see Problematics of the data). Though the deeper splits are not resolved in the tree for the automatically processed dataset, most crustacean groupings (see figure 3.3) are found. The tree differs from figure 3.4 in that the clade Thecostraca is not monophyletic, only regarding the taxa (Heterosaccus+(Pollicipes+Semibalanus)). This clade forms the sistergroup to the 62
.")
75 Molecular insights to crustacean phylogeny 3. Results Cephalocarida + Remipedia clade. A clade Maxillopoda is not supported and neither a monophyletic clade Malacostraca. The contaminated Derocheilocaris sequence is grouping with Myriapods. Figure 3.4: Resulting topology of the by hand aligned and optimized dataset (run 7). Bayesian Majority rule consensus tree with 40,000,000 Generations. Taxa groups are color coded: red= Malacostraca and non-malacostraca, dark blue= Insecta, blue= basal Hexapods, green= Chelicerata, brown= Myriapoda. Out-group (tardigrades) and onychophorans are colored in black. Orange indicates contaminated sequences. 63
.")
76 3. Results Molecular insights to crustacean phylogeny Figure 3.5: Resulting topology of the processed MAFFT-based dataset (run 2). 64
77 Molecular insights to crustacean phylogeny 3. Results Problematics of the data The placement of three taxa differs significantly between analyses. These taxa include the myodocopan ostracod Polycope, the cumacean Diastylis, and the mystacocarid Derocheilocaris (sequence no. 2). The ostracod Polycope is nested within a clade composed of (Remipedia + Cephalocarida) and (Diplura + Protura, figure 3.4). A BLAST search with the 18S sequence of Polycope indicates a high similarity with collembolans (springtails) and other non-ostracod, crustacean sequences, indicating possible contamination. YAMAGUCHI AND ENDO (2003), who included the 18S sequence of Polycope in a molecular analysis of Ostracoda, noted that the unusual length of their alignment was probably owing to numerous inferred insertion and/or deletion events, especially in the sequences of Polycope japonica. They supposed that the position of Polycope in their tree was the result of long-branch attraction. Similarly, all the highest BLAST hits for the 18S sequence of the Diastylis sequence are echinoderms, which would explain its basal position (figure 3.5) far apart from other Malacostraca. In the manually aligned dataset its position within the Malacostraca is problematic suggesting effects of subjective alignment arrangements. The highest BLAST hits for the mystacocarid Derocheilocaris (sequence no. 2) 18S sequence are mites, and this is consistent with the finding of the mite Acarus being the sister taxon of Derocheilocaris in the 18S phylogeny of WHEELER ET AL. (2004). Intriguingly, however, this old mystacocarid sequence with high support is the sister taxon to the newly sequenced mystacocarid in the results of the manually aligned dataset (figure 3.4), and this clade groups within one of the maxillopodan clades. A few years ago a BLAST result for this sequence was relating to fungi, blasting this sequence to date gives closer hits to mites (see also more detailed in supplementary figure S10). As for Diastylis, its position close to Derocheilocaris (sequence no. 1) in the tree derived from the manually aligned dataset is suspicious. The phylogenetic positions of some taxa in the trees may have been affected by longbranch attraction, including, possibly among others, the remipedes, the peracaridan Spelaeogriphus, the cephalocarids and the myriapod Scutigerella. 65

78 3. Results Molecular insights to crustacean phylogeny 3.2 Analyses [B]: Is secondary structure based alignment optimization and implementation of time-heterogeneity a solution to improve inference of crustacean phylogeny? Final dataset and split supporting patterns Alignment filtering and concatenation of data: After the exclusion of randomly similar sections identified with ALISCORE, 1630 positions (originally 3503) of the 18S rrna and 2472 (originally 8184) positions of the 28S rrna remained. Filtered alignments were concatenated and comprised 4102 positions. The neighbor-net graph, which results from a split decomposition based on uncorrected p-distances (figure 3.6) and LogDet correction plus invariant sites model (see figure 3.7) pictures a dense network, which hardly resembles a tree-like topology. This indicates the presence of some problems typical in studies of deep phylogeny: a) Some taxa like Diptera (which do not cluster with ectognathous insects), Diplura, Protura and Collembola each appear in a different part of the network, with Diplura and Protura separated from other hexapods. Lepisma saccharina is clearly separated from the second zygentoman Ctenolepisma that is nested within Ectognatha. Symphyla, Pauropoda, as well as Remipedia and Cephalocarida have very long branches. Figure 3.6: Neighbor-net graph of the concatenated 18S & 28S rrna. Based on 66

79 Molecular insights to crustacean phylogeny 3. Results uncorrected p-distances constructed in SPLITSTREE 4 after alignment filtering. Quotation marks indicate that monophyly is not supported in the given network graph. For the color code of groupings see graph. The taxa may be misplaced in tree topologies due to signal erosion or occurrence of homoplasies, and their placement in trees must be discussed critically (WÄGELE & MAYER 2007). The usage of the LogDet distance adjusts the length of some branches but does not decrease the amount of conflicts in deep divergence splits. The inner part of the network shows little treeness, which indicates a high degree of conflicting signal. Figure 3.7: Neighbor-net graph based on LogDet correction reconstructed in Splitstree 4. Quotation marks indicate that monophyly is not supported in the given 67
80 3. Results Molecular insights to crustacean phylogeny network. For color code see graphic. A remarkable observation seen in both phylogenetic networks is that some taxa have long stem-lineages, which means that the species share distinct nucleotide patterns not present in other taxa. Such well separated groups are Copepoda, Branchiopoda, Cirripedia, Symphyla, Collembola, Diplura, Protura and Diptera, while e.g. Myriapoda partim, Chelicerata and the Ectognatha (bristletails, silverfish/firebrats and pterygote insects) excluding Diptera share weaker patterns. This result is in line with the resulting patterns of the previous analysis [A]. It can be stated here that the strategy to change to completely sequenced 18S and 28S rrna sequences results in a more suitable signal in the dataset compared to the previous one of analysis [A] Compositional heterogeneity of base frequency For the base compositional heterogeneity test parsimony uninformative positions were explicitly excluded with PAUP 4.0b10 (SWOFFORD 2002). Randomly similar alignment blocks identified with ALISCORE were excluded for both, the base compositional heterogeneity test and phylogenetic reconstructions. 901 characters of the 18S rrna and 1152 characters of the 28S rrna were separately checked for inhomogeneous base frequencies. Results led to a rejection of the null hypothesis H 0, which assumes homogeneous base composition among taxa (18S: chi 2 = , df=441, P=0.00; 28S: chi 2 = , df=441, P=0.00). Thus, base frequencies significantly differed across taxa in both 18S and 28S datasets. A data partition into stems and loops revealed 477 unpaired positions and 424 paired positions in the 18S alignment, and 515 unpaired and 637 paired positions in the 28S alignment. Separate analyses of all four partitions confirmed heterogeneity of base frequencies across taxa in all sets (P=0.00 in all four partitions). The homogeneity test was repeated for partitions as used in tree reconstruction. If base pairs were disrupted by the identification of the corresponding partner as randomly similar by ALISCORE, the remaining (formerly paired) positions were treated as unpaired. Hence, 1848 characters of the concatenated alignment (18S: 706; 28S: 1142) were treated as paired in all analyses. Again, the test revealed heterogeneity in unpaired characters of both the 18S and 28S alignments (P=0.00 for both genes; 18S: 506 characters; 28S: 567 characters). Examination at paired positions also rejected the null hypothesis H 0 (18S, 395 characters included: P<0.0003, 28S, 585 characters included: P=0.00). Since non-stationary processes were strongly indicated in all tests, we chose to apply time-heterogeneous models to account for lineage-specific substitution patterns. To fix the number of free base frequency sub-models in time-heterogeneous analyses, the minimal exclusive set of sequence groups was identified. Based on chi 2 -tests the dataset could be divided into three groups for both rrna genes. In both genes Diptera are characterized by a high A/T content and Diplura by a low A/T content. Exclusion of only one of the groups was not sufficient to retain a homogeneous dataset (18S: excluding Diptera: chi 2 =972.91, df=423, P=0.00, excluding Diplura: chi 2 =532.13, df=423, P<0.0003; 28S: excluding Diptera: chi 2 =986.72, 68
81 Molecular insights to crustacean phylogeny 3. Results df=423, P=0.00, excluding Diplura: chi 2 =813.8, df=423, P=0.00). Simultaneous exclusion of both groups led to acceptance of H 0 for 18S sequences (chi 2 =342.22, df=405, P=0.99). For the 28S set, after exclusion of both groups, H 0 was still rejected (chi 2 =524.98, df=405, P<0.0001). After sorting taxa according to base frequencies in ascending order, additional exclusion of Peripatus sp. and Sinentomon erythranum resulted in a homogeneous base composition for the 28S gene (H 0 : chi 2 =434.99, df=399, P=0.1), likewise indicating that three sub-models are sufficient to cover the taxon set. The homogeneity-test was repeated for stem and loop regions of each gene separately. The exclusion of Diplura was sufficient to obtain homogeneity in the loop regions for both genes (18S: 474 characters, P=0.9757; 28S: 541 characters, P=0.0684). For stem regions in the 18S set it likewise was sufficient to exclude either Diptera (378 characters, P=0.6635) or Diplura (385 characters, P=0.99). These partitions would make two sub-models sufficient to cover the dataset. However, in the stem regions of the 28S homogeneity was obtained only after the exclusion of both Diptera and Diplura (547 characters, P=0.99). Since PHASE-2.0 does not allow to vary the number of chosen sub-models among partitions, three sub-models were applied and fitted to each data partition Phylogenetic model testing & reconstructions Three combinations of mixed DNA/RNA models (REV +Gamma & RNA16I +Gamma, TN93 +Gamma & RNA16J +Gamma and HKY85 +Gamma & RNA16K +Gamma) were compared to select the best model set. Overall model ln likelihoods converged for all tested mixed models after a burn-in of 250,499 generations in an initial pre-run of 500,000 generations. However, most parameters did not converge for the combined REV +Gamma & RNA16I +Gamma models, consequently, this set up was excluded from further analyses. For each of the remaining two sets a chain was initiated for 3 million generations, with a burn-in set to 299,999 generations. The applied Bayes Factor Test (KASS & RAFTERY 1995; NYLANDER ET AL. 2004), favored the TN93 +Gamma & RNA16J +Gamma model combination (2ln B 10 =425.39, harmonic mean ln L 0 (TN93 +Gamma & RNA16J +Gamma)= ; harmonic mean ln L 1 (HKY85 +Gamma & RNA16K +Gamma) = For each approach (table 2.4) all chains that passed a threshold value in a BFT were assembled to a metachain. Harmonic means of the ln likelihoods of included time-heterogeneous chains were compared against all ln likelihoods of included time-homogeneous chains (burn-in discarded) in a final BFT: the timeheterogeneous model was strongly favored (2ln B 10 = ). Each resulting extended majority rule consensus tree was rooted with Milnesium. Node support values for clades were deduced from 56,000 sampled trees for the time-heterogeneous set (figure 3.8) and from 18,000 sampled trees for the time-homogeneous set (figure 3.9). Detailed support values are shown in table 3.2). 69
82 3. Results Molecular insights to crustacean phylogeny Table 3.2: Bayesian support values for selected clades. Values for the timehomogeneous and the time-heterogeneous tree are given. pp= posterior probability value. Clade pp: timeheterogeneous pp: timehomogeneous Symphyla (Pauropoda,Onychophora) Pauropoda Onychophora Chelicerata Pycnogonida Euchelicerata (without Pycnogonida) Myriapoda partim (excl. Symphyla & Pauropoda): (Diplopoda,Chilopoda) Diplopoda Chilopoda Myriochelata partim: ((Diplopoda,Chilopoda)(Euchelicerata,Pycnogonida)) (Myriochelata partim,pancrustacea) Pancrustacea ((Derocheilocaris,Ostracoda)(Speleonectes(Argulus,Cirripedia)) (Derocheilocaris,Ostracoda) ((Derocheilocaris,Raillietiella)(Speleonectes(Argulus,Cirripedia)) (Derocheilocaris,Raillietiella) (Speleonectes(Argulus,Cirripedia)) (Argulus,Cirripedia) (Ostracoda,Malacostraca) ((Ostracoda,Malacostraca)(((Derocheilocaris,Raillietiella) (Speleonectes(Argulus,Cirripedia)))) (Malacostraca(Raillietiella((Hutchinsoniella,Branchiopoda) (Copepoda,Hexapoda)))) Malacostraca (Raillietiella((Hutchinsoniella,Branchiopoda)(Copepoda,Hexapoda))) ((Hutchinsoniella,Branchiopoda)(Copepoda,Hexapoda)) (Hutchinsoniella,Branchiopoda) Branchiopoda (Copepoda,Hexapoda) ((Copepoda((Lepisma,Hutchinsoniella)(remaining hexapod taxa))) ((Lepisma,Hutchinsoniella)(remaining hexapod taxa)) Hexapoda Entognatha: ((Protura,Diplura)(Collembola)) Nonoculata: (Protura,Diplura) ((Lepisma,Hutchinsoniella)(Protura,Diplura)) (Lepisma,Hutchinsoniella) Protura Diplura Collembola Ectognatha: (Archaeognatha(Zygentoma,Pterygota) (Archaeognatha(Ctenolepisma,Pterygota)) Archaeognatha Zygentoma
83 Molecular insights to crustacean phylogeny 3. Results Dicondylia: (Zygentoma,Pterygota) (Ctenolepisma,Pterygota) Pterygota Resulting topologies In the following section, the focus lays on major arthropod clades and further on crustaceans and their position within arthropods. First similarities [1] and then differences [2] between the time-heterogeneous tree (figure 3.8) and time-homogeneous tree (figure 3.9) are pointed out. Hexapod clades are given in the trees (for a complete overview) but are only shortly mentioned in the text, except basal hexapods that are important for crustacean phylogeny as an eventual sister-group to crustaceans. In some cases the results of this far more sophisticated analysis are compared with the previous analysis [A]. Representatives of Symphyla and Pauropoda, already identified in the neighbor-net graph as taxa with conspicuously long branches (figure 3.6 and 3.7), assumed unorthodox positions in both trees which are clearly incongruent with morphological evidence and results obtained from other genes. Symphyla formed the sister group of all remaining arthropod clades, and Pauropoda clustered with Onychophora. Consequently, myriapods always appeared polyphyletic in both analyses. These results are considered as highly unlikely, since they contradict all independent evidence from morphology, development, and partly from other genes. 71

84 3. Results Molecular insights to crustacean phylogeny Figure 3.8: Time-heterogeneous consensus tree of the 18S and 28S dataset optimized considering secondary structure information. Consensus tree from sampled trees of the time heterogeneous substitution process inferred with PHASE 2.0. Support values below 0.70 are not shown (nodes without dot) nodes with a maximum posterior probability (pp) of 1.0 are represented by dots only. Quotation marks indicate that monophyly is not supported in the given tree. Crustaceans are colored red, hexapods blue, chelicerates green and myriapods brown. Out-groups are black. 72
 + Lepisma (Zygentoma); its node value is pp 0.")
85 Molecular insights to crustacean phylogeny 3. Results Fig 3.9: Time-homogeneous consensus tree of the 18S and 28S dataset optimized considering secondary structure information. Same setting and colorcoding as given in figure 3.9. The grey dot indicates the clade containing all hexapod taxa including Hutchinsoniella (Crustacea) + Lepisma (Zygentoma); its node value is pp Congruent results [1]: Monophyletic Chelicerata are supported in the timeheterogeneous tree (pp 0.91) and with maximal support in the time-homogeneous tree with Pycnogonida (sea spiders) as sister group to remaining chelicerates. Pycnogonida received maximal support in both analyses. Euchelicerata received highest support in the timehomogeneous approach while this clade in the time-heterogeneous approach received a 73
86 3. Results Molecular insights to crustacean phylogeny support of only pp Limulus polyphemus (horseshoe crab) clustered within arachnids, but some internal relationships within Euchelicerata received only low support. Chilopoda always formed the sister group of a monophyletic Diplopoda in both analyses with high support. Within the latter the most ancient split lied between Penicillata and Helminthomorpha. This myriapod assemblage Myriapoda partim formed the sister group of Chelicerata, thus giving support to the Myriochelata hypothesis, respectively Myriochelata partim, when the long-branch clades Symphyla and Pauropoda are disregarded. Pancrustacea showed always maximal support. The monophyly of Malacostraca and of Branchiopoda received highest support in both approaches while their position varied. Branchiopoda was the sister group of a clade consisting of Copepoda + Hexapoda in the homogeneous tree (figure 3.9), however the cephalocarid Hutchinsoniella nested within hexapods. Among hexapods, monophyly was unambiguously supported for Protura, Diplura, Collembola, Archaeognatha and Odonata (other Hexapoda are not discussed here). Diplura clustered with Protura, and gave support to a monophyletic Nonoculata. Differing results [2]: While the time-heterogeneous and time-homogeneous trees corresponded in overall topologies, they differ in a number of remarkable details. 1) The cephalocarid Hutchinsoniella clustered among crustaceans as sister group to the Branchiopoda only in the heterogeneous approach. This clade formed the sister group to (Copepoda +Hexapoda), although with low support. 2) The time-homogeneous runs revealed highly supported (Malacostraca + Ostracoda) as the sister group to a clade ((Mystacocarida + Pentastomida) + (Branchiura + Cirripedia)). In contrast, in the time-heterogeneous analysis more terminal positioned Malacostraca are the sister group of a clade (Pentastomida ((Cephalocarida + Branchiopoda) + (Copepoda + Hexapoda))). The altered position of Pentastomida was only weakly supported in this tree. 3) In the homogeneous tree Hutchinsoniella emerged as sister taxon to Lepisma with low support (pp 0.72), and this cluster was positioned within the remaining hexapods (figure 3.9). Well-supported Hexapoda were monophyletic only in the time-heterogeneous approach, (pp 0.96,), with Copepoda as sister group, the latter with low support (pp 0.69). 4) In the time-homogeneous tree, Copepoda emerged as sister group, again with a low support value (pp 0.70) of Lepisma + Hutchinsoniella + Hexapoda '). 5) Hexapoda (pp 0.96), Entognatha (pp 0.98) and Ectognatha (pp 1.0) were monophyletic only in the time-heterogeneous tree. 6) The time-heterogeneous tree showed the expected paraphyly of primarily wing-less insects with Archaeognatha as sister group to Zygentoma + Pterygota. 74
 based on the total unreduced supermatrix (see figure 2.")
87 Molecular insights to crustacean phylogeny 3. Results 3.3 Analyses [C]: Do phylogenomic data enlight crustacean phylogeny within arthropods - or do old problems stick to the analysis of this new large-scale data? Resulting topology of the unreduced dataset Maximum likelihood tree reconstructions (STAMATAKIS 2006) based on the total unreduced supermatrix (see figure 2.11) showed some clades, e.g. Euarthropoda + Onychophora, Euchelicerata and Malacostraca with high support. However, several groups received only moderate support, like pancrustaceans (89% bootstrap support) or weak support, e.g. chelicerates or endopterygote insects, and many groups appeared para- or polyphyletic (Myriapoda, Hexapoda, see figure 3.10). The crustacean group Peracarida is not recovered as a monophyletic clade. Figure 3.10: Cladogram of the 233-taxon RAXML analysis of the unreduced original dataset. Crustaceans are accentuated. ML tree search and bootstrapping (PROTMIX substitution model and WAG matrix) was conducted separately (see methods). Support values are derived from 100 bootstrap replicates. Support values (majority rule consensus tree) < 70: not shown, Support values = 100: represented by a dot only. Quotation marks indicate nonmonophyly. Color code: molluscs, annelids and nematodes: lighter grey; tardigrades, 75

88 3. Results Molecular insights to crustacean phylogeny onychophorans: black; myriapods: brown; chelicerates: green; crustaceans: red; basal hexapods: light blue; pterygote insects: dark blue. In contrast, the selected optimal subset of taxa and genes (see 3.3.2) yielded improved resolution of and strong support for nearly all groups Resulting topologies of the reduced, optimal data subset The selected optimal subset included 117 taxa with 101 euarthropods (chelicerates, myriapods, crustaceans and hexapods), two onychophorans, two tardigrades and outgroups. The dataset comprised 129 genes of which 32 were ribosomal proteins (supplementary table S15). The concatenated masked alignment span more than 37 Mb amino acid positions (figure 2.12). Selecting a subset of the data (see figures ) raised the overall relative information content fourfold to 0.43 from originally The overall matrix saturation (data availability) increased threefold to 62.3% from originally 17.6%. Taxa in our optimal dataset presented on average 84 genes (minimum 35, maximum 129) that were present on average in 76 taxa (minimum 46, maximum 109 taxa per gene). The relative information content of single genes varied from with an average of 0.7 (supplementary table S15). Figure 3.11: Phylogram of the 117-taxon Bayesian analysis. Bayesian majority rule 76
 are estimated under the CAT mixture model (LARTILLOT & PHILIPPE 2004).")
89 Molecular insights to crustacean phylogeny 3. Results consensus tree (optimal data subset, 3 chains out of 25 chains, 20,000 cycles each, burn-in: 5,000 cycles). Posterior probabilities (pp) are estimated under the CAT mixture model (LARTILLOT & PHILIPPE 2004). The majority rule consensus tree is based on the triple set (three chains) showing lowest maxdiff value (0.186) while each of these chains had the best harmonic mean of the likelihood values (burn-in excluded) of all possible triple -chain combinations. pp-values < 0.7: not shown, pp-values = 1.0: represented by a dot only. Quotation marks indicate non-monophyly. Figure 3.12: Phylogram of 117-taxon ML analysis. ML tree (majority rule consensus) of the optimal data subset (PROTMIX substitution model and WAG matrix). Support values are derived from 1,000 bootstrap replicates. Support values < 70: not shown, support values = 100: represented by a dot only. Quotation marks indicate non-monophyly. stars (*) after taxon names indicate EST taxa contributed by the authors. Instable taxa (leaf stability index < 0.95) are marked by a star in front of the taxon name. 77
90 3. Results Molecular insights to crustacean phylogeny Euarthropoda: In general, maximum likelihood (WAG model including rate heterogeneity, STAMATAKIS 2006, figure 3.11) and Bayesian (CAT mixture model, LARTILLOT & PHILIPPE 2004, figure 3.12) analyses of the data subset showed strong support for Onychophora + Euarthropoda. Monophyletic myriapods, sea spiders and euchelicerates were recovered in ML and Bayesian trees while the resolution among these three groups differed between both approaches. Correspondingly, sea spiders (Anoplodactylus, Endeis) and millipeds (Archispirostreptus, Scutigera) showed relative low leaf stability indices (0.91; 0.91; 0.86; 0.86). Pancrustacea were maximally supported in both approaches with paraphyletic crustaceans in relation to monophyletic hexapods. Most extant arthropod orders, for example Ixodida (ticks) and Astigmata (mites) belonging to chelicerates, Decapoda, Copepoda (crustaceans) were strongly supported (Figure 3.11 and 3.12) Differences in ML and Bayesian topologies of the reduced data subset Some deep splits within arthropods, in previous studies thought to be resolved (DUNN ET AL. 2008) show remarkable sensitivity to available data and reconstruction methods. Pycnogonida: While the position of sea spiders was not resolved in the ML tree (fig. 3.12), the Bayesian tree (fig. 3.11) showed monophyletic chelicerates with high support (posterior probability, pp 0.99), including sea spiders. Limulus polyphemus (Xiphosura) is not separated from the Arachnida and groups in a clade with Acanthoscurria (Aranea). Myriapoda emerged in the Bayesian tree (fig. 3.11) as the sister group to chelicerates with weak support. The relationships of myriapods, sea spiders, euchelicerates and pancrustaceans were not resolved in the ML tree reconstruction (figure 3.12) reconstructing a polytomic clade of these taxa. Within Crustacea, cirripedes clustered with low support either with copepods (ML) or malacostracans (Bayesian). Branchiopoda were placed as sister group to Hexapoda with maximal support in the Bayesian approach and with moderate support (BS 92%) in ML analyses. Entognatha (Protura, Diplura and Collembola) were recovered in ML and Bayesian approaches, albeit weakly supported. Within Entognatha, a strongly supported sistergroup relationship of Protura and Diplura was recovered Problematics in resulting topologies of the Bayesian chains Topological incongruencies among the 25 Bayesian chains (topology of fig. 3.11) were visualized in a consensus network (HOLLAND & MOULTON 2003), see figure Incongruent clustering of taxa within trees, e.g. placement of Archaeognatha, might result from different local optima of different chains. Incongruencies were caused by variable positions of few taxa. 78
91 Molecular insights to crustacean phylogeny 3. Results [1] The barnacle Pollicipes (Cirripedia, Crustacea) emerged just in one chain as sister group to copepods with weak support (pp 0.51). However, also the alternative clade (Pollicipes + Malacostraca) (see fig. 3.13) showed a wide range from (posterior probability) in different chains. [2] The bristle tail Lepismachilis (Archaeognatha) was inferred as sister-goup to Blattaria + Isoptera in several trees, showing moderate or low support (posterior probability ), additionally in these trees Pediculus (Phthiraptera) emerged as sister-group to this clade with maximal support. However, likelihoods (harmonic mean) of related chains were lower compared to chains used for the consensus tree and rejected after a BFT (NYLANDER ET AL. 2004). [3] Mandibulata (Myriapoda + Pancrustacea) were found in trees of two chains maximally supported while Mandibulata + Chelicerata received negligible support (pp 0.52, pp 0.55) in chains of highest likelihoods. 79
 was calculated with SPLITSTREE 4.8 (HUSON & BRYANT 2006) in cooperation with K. MEUSEMANN.")
92 3. Results Molecular insights to crustacean phylogeny Figure 3.13: Consensus network of all PHYLOBAYES trees. The consensus network of all 25 PHYLOBAYES chains (optimal data subset) was calculated with SPLITSTREE 4.8 (HUSON & BRYANT 2006) in cooperation with K. MEUSEMANN. It visualizes incongruencies between 25 chains (threshold = 0.01, averaged edge weights). The color code is specified in the figure. 80
93 Molecular insights to crustacean phylogeny 3. Results 3.4 Analysis of hemocyanin structure in Remipedia One problem was the failure of the planned EST project for Remipedia and consequently the absence of this challenging and still enigmatic group in the phylogenomic analyses presented in analysis [C]. Despite the extensive effort, and the availability of freshly collected tissue (see paragraph 2.1) and successfully isolated total RNA, the expression pattern of screened test clone sequences was so bad regarding numbers of genes that complete sequencing of 4000 sequences had to be stopped. A 454 pyrosequencing started in November 2008 with fresh material and is unfortunately still in progress - no sequences are available yet. At least one result of the EST project can be presented based on a screening of the few EST test sequences and the specifically cloned hemocyanin subunits from Remipedia. This was conducted in the lab and working group of T. BURMESTER, see also paragraph 2.7. In summary, Remipedia do have functional hemocyanin sequences that occur in three subunits and are expressed in the adult organism. These are more similar to the insect hemocyanin types than to the hemocyanin types of other malacostracan crustaceans Phylogenetic reconstruction and resulting tree Phylogenetic analyses employing maximum likelihood and Bayesian methods resulted in essentially identical trees (figure 3.14). S. tulumensis hemocyanins and hexapod proteins form a monophyletic clade not including other crustacean (malacostracan) sequences (ML bootstrap support: 48%; Bayesian posterior probability: 0.96). The other crustacean hemocyanins and pseudohemocyanins were monophyletic (100%; 1.0), but in none of the trees the hemocyanins of the Remipedia joined this clade. The relative position of the myriapod hemocyanins remains uncertain, receiving poor support. These proteins were either associated with chelicerate hemocyanins (thereby supporting the "Paradoxopoda" hypothesis; MALLAT ET AL. 2004) or are in sister group position to the crustacean plus hexapod proteins (supporting the traditional "Mandibulata"). In none of the trees the myriapod hemocyanins joined hexapod hemocyanins and hexamerins. Hence, there is substantial molecular phylogenetic and structural evidence that the remipede hemocyanin subunits are orthologs of hexapod subunits. Thus, the lineage leading to the remipede and hexapod hemocyanins split into two distinct subunit types before these taxa diverged. This suggests a close relationship of hexapods with remipedes. 81
 and Bayesian posterior probabilities (below). Branches representing crustaceans are colored in red.")
94 3. Results Molecular insights to crustacean phylogeny Figure 3.14: Simplified Bayesian phylogenetic tree of arthropod hemocyanins and hexamerins. The numbers at the nodes show maximum likelihood parametric bootstrap support (above) and Bayesian posterior probabilities (below). Branches representing crustaceans are colored in red. The complete trees are shown in the manuscript in the supplement. 82
95 4. DISCUSSION A central lesson of science is that to understand complex issues or even simple ones, we must try to free our minds of dogma and to guarantee the freedom to publish, to contradict, and to experiment. Arguments from authority are unacceptable CARL SAGAN. Methods and datasets are discussed first to facilitate the following phylogeny discussion. Then the inferred crustacean and arthropod phylogenies are discussed in the background of existing studies. A general methodological discussion and final conclusion are completing this chapter. 4.1 Separate methodological discussion of analysis [A-C] Analyses [A]: Can 16S, 18S and COI marker genes improve inference of crustacean phylogeny? Comparing usual standard vs. secondary structure based approaches This study is also a test case if data with smaller fragments of ribosomal RNA (16S and 18S rrna genes) are suitable for phylogenetic reconstruction of deeper nodes like crustaceans and less ambitioned for arthropod relationships. Although certain relationships are robust in the trees, notably the monophyly of generally accepted clades such as Branchiopoda, Hexapoda, and Euchelicerata, many higher-level relationships remain unresolved. Results of the best-resolved trees (figures 3.4 and 3.5) suggest basic phylogenetic splits within Pancrustacea into Malacostraca, non-malacostraca and Hexapoda but monophyly of these groups and the relationships within them generally lack statistically significant support (posterior probabilities < 0.95). In view of the methodological variations encompassed by this analysis, this clearly suggests the need for more and/or different data. These could consist of complete ribosomal sequences, a denser taxon sampling, incorporation of new loci, and the exploration of alternative out-groups that are separated from the in-group taxa by a shorter branch. Manual versus automized alignment processing (optimization) The results clearly reveal the crucial importance of alignments (KUMAR & FILIPSKI 2007) and the impact of different alignment strategies. MAFFT seems to perform better than MUSCLE regarding resulting topologies, which is in line with KATOH & TOH (2008) who find that the EINSI algorithm of MAFFT is more accurate and precise in aligning large expansion segments 83
96 4. Discussion Molecular insights to crustacean phylogeny and gap sections that occur normally in rrna genes. Nevertheless misaligned sections are still apparent. But these misaligned sections can be identified much better by eye and realigned based on secondary structure information with the manual approach. A commonly held opinion is that manual alignments are subjective and (thus) not repeatable, implying that automated, computerized alignments are more objective. However, the automatically processed alignments of ribosomal genes contain obvious errors, such as gaps (ranging from one to several hundred nucleotides) that are correctly aligned for most taxa, but which are obviously misaligned for some other individual taxa. The resulting misalignment of conserved regions can easily be corrected manually. Therefore it can be agreed with KJER AT AL. (2007), who argue that ignoring apparently falsely aligned, non-homologous positions is in fact also a subjective decision that is likely to affect the resulting phylogenies. Some authors disagree about the relative merit of different strategies, notably manual versus automated sequence alignment (e.g. KJER 2004 vs. OGDEN ET AL. 2005). Although a thorough discussion of the theoretical pros and cons of the different approaches that were adopted is beyond the scope of this study, arguments can be made to prefer one or the other sets of results. The automated alignment processing contains obvious shortcomings regarding the resolution of deeper nodes like Myriapoda, Chelicerata and Malacostraca. Contrary, the results based on manual alignment are better resolved in deeper nodes (Chelicerata, Myriapoda, Malacostraca, see figures 3.5 and 3.6 and supplementary figures S2-S9) than the other analyses, but only latter analyses show expected clades such as a monophyletic Arthropoda and Pancrustacea. However, these analyses also show a clade of the two mystacocarids, one of which likely is contaminated with a mite sequence. Therefore, because this may be a spurious clade that is not produced in the results based on automated alignment processing and masking, one may prefer these less resolved but more reliable results. These are more objective and artifacts by randomly similar aligned sequence positions are minimized. Importance of the secondary structure constraint and complete sequences It might be discussed if the selected constraint played a veritable role for the results. For the automated analyses in this study constraints of Anopheles are used and alignments are not optimized by hand at all. The hand alignment is adapted with a specially adapted consensus secondary structure estimated from different sequences. An explanation for the better resolution in the topologies resulting from the manually adapted alignment is that by this procedure in total more positions and more stem positions are finally included into analysis compared to the automated alignment processing. In this analysis it becomes clear that the sequence alignment and masking programs can have difficulties with shorter sequence fragments, so that manual improvements become tempting. In such a situation of alternative, but non-perfect methods, one can perform various analyses to compare the results with an open mind. Using a manually adapted secondary structure constraint in combination with automated alignment processing like advocated might be the best objective compromise. Due to computational and time limitations it has been unfortunately impossible to perform a comparison of the results using the hand-adapted secondary 84
97 Molecular insights to crustacean phylogeny 4. Discussion structure constraint for an automatically processed alignment and subsequently analyses. This direct comparison of manually versus automated alignment processing based on a manually optimized constraint is still to test for a final conclusion. Additionally, it has to be stated that completely sequenced ribosomal RNA genes should be included into analyses to obtain more informative positions. Please note that comparison between different runs is complicated due to their requirement of different evolutionary models, so that variation in the results cannot unambiguously be ascribed to a single analysis variable. A caveat of the current study is that time limitations have prevented the author from doing additional analyses that may have improved the results. For example a comparative analysis based on time-homogeneous and time-heterogeneous models (see analyses B) including a more complex mixed model setting (e.g. as possible in the software package PHASE) would have been interesting. Yet, proceeding the analysis it becomes clear that the dataset by itself is insufficient to resolve this challenging phylogenetic problem. The signal in the data is too ambiguous (see figures 3.1 and 3.2) and probably eroded. Also a RY coding and several tests to come by this lack of resolution are not successful. Future highlevel phylogenetic studies will have to explore additional markers, principally nuclear proteincoding genes, which show great promise (REGIER ET AL. 2005; 2008). In analysis B this exploration is made for completely sequenced 18S and 28S rrna genes Analyses [B]: Is secondary structure based alignment optimization and implementation of time-heterogeneity a solution to solve crustacean phylogeny within arthropods? It is one goal of this analysis to encompass limitations of analysis [A] and of many previously published studies. Apart of some exceptions most studies on phylogenetic relationships, at least partly, rely on nuclear rrna data. Often, however, only one of the 18S and 28S genes is used, sometimes even just fragments of a gene (DELL AMPIO ET AL. 2009; KJER 2004; MISOF ET AL. 2007; D HEASE 2002; GIRIBET ET AL. 2004; LUAN ET AL. 2005; EDGECOMBE & GIRIBET 2002; KJER ET AL. 2006; YAMAGUCHI & ENDO 2003), while only few studies use nearly complete 18S and 28S rrna sequences (MALLATT & GIRIBET 2006; MALLATT ET AL. 2004; GAI ET AL. 2006). Despite this wide usage, the reliability of reconstructions based on rrna markers is still debated (for contradicting views see MISOF ET AL. 2007; GILLESPIE ET AL and JORDAL ET AL. 2008). A major cause of concern is the pronounced site heterogeneity of evolutionary rates, the non-stationarity of base composition among taxa and rate variation in time. The comparison of the timehomogeneous approach to the time-heterogeneous one is not only intended to show improvements in the application of more realistic models, but also to indicate which incongruencies may be causally explained by non-stationary processes during the evolution of these genes. All three phenomena quickly lead to the erosion of 85
98 4. Discussion Molecular insights to crustacean phylogeny phylogenetic signal (SIMON ET AL. 2006), which is also a problem in analysis [A]. Analysis [A] indicates that especially crustaceans are at least biased in phylogenetic reconstructions by inhomogeneous base compositions. On the one hand, our understanding of the molecular structure of other markers and about taxon-dependent processes of molecular evolution remains poor. On the other hand, our vast background knowledge regarding the structure and variability of rrna molecules offers a unique opportunity to study the effects of selection and application of substitution models in greater detail. Automated alignment processing and time heterogeneous models Phylogenetic signal in sequence data can get noisy due to (i) multiple substitution processes (saturation) and (ii) erroneous homology hypotheses caused by ambiguous sequence alignment. Both effects correspond in that they result in random similarity of alignment regions. Such noisy sections potentially bias tree reconstruction methods in several ways which have been appreciated for years but only recently been applied, that allow to account for these problems (WÄGELE & MAYER 2007; RODRÍGUEZ-EZPELATA ET AL. 2007; SUSKO ET AL. 2005; PHILIPPE ET AL. 2005). Exclusion of these ambiguously aligned or saturated regions can help to reduce noise, see e.g. MISOF & MISOF (2009). If this topic is addressed at all, the majority of studies include a manual alignment check for untrustworthy regions (MALLATT & GIRIBET 2006; FRIEDRICH & TAUTZ 1995; CARAPELLI ET AL. 2007; KJER 2004; MISOF ET AL. 2007; CARAPELLI ET AL. 2005; LUAN ET AL. 2005; KJER ET AL. 2006; YAMAGUCHI & ENDO 2003; GAI ET AL. 2006). Only some recent publications addressing arthropod relationships use automated tools (e.g. DUNN ET AL. 2008; ROEDING ET AL. 2007; PODSIADLOWSKI ET AL. 2007). To identify alignment sections of random similarity prior to tree reconstructions the alignment processing tested in analysis [A] was used. To improve the signal-to-noise ratio the character choice is restricted to alignment sections, which contain nucleotide patterns of more reliable positional homology. Arthropod phylogenies have been inferred in the past with reconstruction methods like Maximum Parsimony, Maximum Likelihood and Bayesian approaches. Expanding massively the methods of analysis [A], knowledge about the evolution of rrna is implemented in two ways: (i) the use of mixed DNA/RNA models is meant to account for known instances of character dependence due to compensatory mutations in stem regions, (ii) the application of time-heterogeneous models accounts for non-stationary processes that occurr in arthropod lineages. The consensus secondary structure of the dataset, generated with RNAsalsa can be understood as a model parameter that defines site interactions and thus character dependence due to compensatory mutations (MISOF ET AL. 2007; HANCOCK ET AL. 1988; STEPHAN 1996). Neglect of character dependence surely results in unrealistic support values. In single low supported nodes, where the signal-to-noise ratio is at the edge of resolution, such neglect theoretically can even turn the balance between two competing hypotheses. Additionally a consensus secondary 86
99 Molecular insights to crustacean phylogeny 4. Discussion structure is necessary to apply a mixed model approach, since it determines whether the evolution of a given site is modeled by the DNA-model, or as part of a base pair by the RNA-model. The mixed model approach is optimized for DNA-corresponding 16 state RNA models (GOWRI-SHANKAR & JOW 2006). It can certainly be argued that the choice of 16 state models is problematic because it is difficult to fit these models to real data due to their parameter richness and heavy computational costs. However, even the best choice of a consensus secondary structure can only capture the predominantly conserved structural features among the sequences. This implies that the applied RNA models must be able to cope with mismatches in base-pairing. Less complex RNA models like those of the 6 and 7 state families either ignore mismatches completely or pool these mismatches into a single character state that produces artificial synapomorphies. Additionally, according to SCHÖNINGER & V. HAESELER (1994), it is more likely that co-variation is a multiple step process, which allows for the intermediate existence of instable (non Watson-Crick) pairs. These intermediate states are only described in 16 state RNA models. Concerning rrna-genes of arthropods, shifts in base composition are mentioned for Diptera, Diplura, Protura and Symphyla (MALLATT & GIRIBET 2006; DELL AMPO ET AL. 2009; MISOF ET AL. 2007; LUAN ET AL. 2005; GAI ET AL. 2006; FRIEDRICH & TAUTZ 1997). Since base compositional heterogeneity within a dataset can mislead phylogenetic reconstruction (BLANQUART & LARTILLOT 2006; JERMIIN ET AL. 2004; FOSTER 2004) and (GOWRI-SHANKAR & RATTRAY 2007), some of these studies discuss observed but not incorporated non-stationary processes as possible explanations for misplacements of some taxa (MALLATT & GIRIBET 2006; MALLATT ET AL. 2004; DELL AMPIO ET AL. 2009; HASSANIN ET AL. 2005; LUAN ET AL. 2005; GAI ET AL. 2006). The selective exclusion of these taxa to test for misleading effects on the remaining topology, however, is not appropriate to test whether non-stationarity really is the the causal explanation for a placement incongruent with other analyses. LogDet methods have been applied to compensate for variations of base frequencies (MALLATT & GIRIBET 2006; MALLATT ET AL. 2004; LUAN ET AL. 2005), which leads to some independence of non-stationarity, but among site rate variation (ASRV) cannot be handled efficiently. After detecting compositional base frequency heterogeneity in the data, a non-stationary approach implemented in PHASE-2.0 is chosen. Because no previous study of arthropod phylogeny uses a time-heterogeneous approach including mixed DNA/RNA models, this approach is compared with a classical time-homogeneous setup. The results prove that the timeheterogeneous approach produces improved likelihood values with improved branch lengths estimates and more realistic, though not perfect (see taxa discussion), topology estimates. Since modeling of general time-heterogeneous processes is in its infancy and since its behavioural effect on real data is relatively unknown (BLANQUART & LARTILLOT 2006; GOWRI-SHANKAR & RATTRAY 2007), a set up is favored accounting for the three different submodels corresponding to three base frequency categories in the dataset. The application of the three submodels to individual branches in a tree by the MCMC 87
100 4. Discussion Molecular insights to crustacean phylogeny process is not further constrained. This scheme allows for a maximum of flexibility without losing the proper mix of parameters Analyses [C]: Do phylogenomic data enlight crustacean phylogeny within arthropods - or do old problems stick to the analysis of this new large-scale data? Comparing the unreduced with the condensed EST dataset one can see that the trees do not differ too widely. An essential difference is the improvement of most node support values in the trees of the reduced dataset, in general for all included taxa. Comparing the two trees of the condensed data subset against the unreduced tree for crustacean taxa this becomes obvious. In the PHYLOBAYES tree (fig. 3.11) only one posterior probability is 0.81 all other node values are supported maximally or with 0.99 posterior probability. The likelihood values of the RAXML topology (fig. 3.12) are similarly high. This result confirms the utility of matrix reduction heuristics. Discussing the effects of the heuristic on the topologies becomes a bit harder. The resulting topologies of the data subset are not resolved for the Chelicerata and Myriapoda compared to the unreduced dataset. Obviously the choice of genes with high relative information content resulted in a more reliable topology regarding the node values. The clade Myriochelata (excluding Julida, see figure 3.10) that is reconstructed in the unreduced dataset with a bootstrap value of 89 can be discussed as an artifact by noninformative signal in the data. The tree of the unreduced dataset suggests that a clade Myriochelata exists in the data constituted by a rather well supported node. Using the condensed dataset the Chelicerata, Myriapoda and Pycnogonida each are monophyletic clades, but form together a polytomy. This can be interpreted as the result of conflicting or missing information after the exclusion of noisy signal by the reduction heuristics. The tree is unresolved in this point but more reliable because it relies only on genes with potential relative information content. Importance of gene choice the supermatrix approach: The advantage of the supermatrix approach is that the dataset can be analyzed within a single tree search. The different substitution patterns among the partitioned genes (matrix partitions) can be estimated in an analysis applying mixed/partitioned substitution models. The reliability for the trees of the total dataset can be addressed with standard procedures like bootstrapping or posterior probabilities. One main disadvantage of supertree methods is for example that single partitions might not contain sufficient signal to resolve the relationships between the taxa (BININDA-EMONDS 2004; DE QUEIROZ & GATESY 2006). All recent phylogenomic studies choosing the supermatrix approach (ROKAS ET AL. 2005, PHILIPPE ET AL. 2005, BAURAIN ET AL. 2007) apply rather subjective parameters for the gene choice to reconstruct the final data matrix. The first study that established an 88
101 Molecular insights to crustacean phylogeny 4. Discussion applied matrix reduction method recently published by DUNN ET AL. (2008). These authors compare the reduced with their original data matrix by including genes that follow a predefined threshold. This threshold is the percentage of genes available for all taxa and was set to 50 percent. However, an objective parameter choice like relative information content of each gene is not applied, the data matrix is additionally reduced by excluding taxa based on the leaf stability index from the software PHYUTILITY. Missing data is often observed for phylogenomic and respectively EST data. Its importance or influence on a resulting topology is not yet to estimate. Some studies demonstrate that missing data influences an unstable placement of taxa with incomplete or missing protein sequences (WIENS 1998; HARTMANN & VISION 2008). Contrary, several studies show that taxa with missing data have a minimal effect if the total number of positions is large (WIENS 2003; WIENS 2005; PHILIPPE ET AL. 2004; WIENS & MOEN 2008) or can even improve the results by breaking long branches (WIENS 2006). Thus, at the moment the total number of existent positions seems to be important and absent or missing data has less impact on tree reconstructions. This is of course strongly dependent on the dataset and the included genes. The present study deals with this issue in the way that by relying on the relative information content for each gene the quality of the implemented genes is increased. Orthology prediction: The task to implement exclusively orthologous genes is a challenging computationally intensive task for phylogenomic data and several software programs and databases exist to identify and administrate clusters of true orthologs avoiding the trap to include closely related but non-orthologous proteins (see e.g. O BRIEN ET AL. 2005: INPARANOID database; KIM ET AL. 2008: COG database in NCBI; SCHREIBER ET AL. 2009: Orthoselect software; EBERSBERGER ET AL. 2009: HaMStR orthology prediction). Most software tools rely on the results of reciprocal BLAST hits among genomes to reconstruct orthologous protein cluster (KIM ET AL. 2008, EBERSBERGER ET AL. 2009). Different approaches exist to solve the difficulty to find an optimal solution in the BLAST procedure since proteins and genomes of phylogenetically distant species show normally low similarities in their protein sequences. The approaches to predict gene orthology differ in general between the different phylogenomic studies. For the phylogenomic analysis in this thesis the HaMStR approach by EBERSBERGER ET AL. (2009) is used (see chapter 2 for details on its basic protocol). To discuss this part properly a comparison of the dataset with different strategies of orthology predictions should have been performed, but this was impossible due to time limitations. Starting the analysis the HaMStR approach was the most sophisticated approach that existed at the time the analyses were started. Including the Hidden Markov Model trained search for inparalogous with a reciprocal BLAST this procedure was ahead of other simple reciprocal BLAST procedures. Anyhow, the comparison with recently (while finishing this thesis) presented software packages for orthology prediction (e.g. SCHREIBER ET AL. 2009) could be interesting. Gene overlap with other studies: The present gene selection overlaps with other phylogenomic studies focused on metazoans (BAURAIN ET AL. 2007, DUNN ET AL. 2008, PHILIPPE ET AL. 2009) or chordates (DELSUC ET AL. 2008). The most extensive overlap exists with 89
102 4. Discussion Molecular insights to crustacean phylogeny PHILIPPE ET AL. (2009) (complete dataset: 51 genes, optimal data subset: 46 genes), BAURAIN ET AL. (2007) (complete dataset: 50 genes, optimal dataset: 45 genes) and DELSUC ET AL. (2008) (complete dataset: 53 genes, optimal dataset: 44 genes). There is little difference in the overlapping gene numbers with latter studies comparing the unreduced and the condensed subset of present data. Less genes are shared with DUNN ET AL. (2008) (complete dataset: 37 genes, optimal dataset: 19 genes) with a remarkable difference between the selected subset and the original data (supplementary table S15). This implicates that DUNN ET AL. (2008) included many genes in their study that were identified in the present approach as less informative. The role of ribosomal genes: The reduced data subset of the present study includes only 32 ribosomal genes (supplementary table S15), which is a rather low number (for included ribosomal genes) compared to other phylogenomic studies. For example BAURAIN ET AL. (2007) use 68 ribosomal genes (from 133 genes in total), ROKAS ET AL. (2005) 11 ribosomal genes (49 genes in total). DUNN ET AL. (2008) include 40 ribosomal genes in their reduced data matrix (150 genes in total) but state for the first time, that ribosomal genes might lead to systematic errors if included. DUNN ET AL. exclude 30 ribosomal genes of the previous studies (ROKAS ET AL. 2005, PHILIPPE ET AL. 2005) because they were problematic in the orthology prediction. Still to survey is also the impact of the completely sequenced genome species. Because most of the genome or proteome species are rather derived (e.g. Daphnia, Artemia, Drosophila) it might be possible that they influence phylogenetic reconstructions. Computational limitations were in general a problem with the present dataset. The RAXML analysis of the unreduced dataset crashed several times. To encompass that and to examine possible biases ten single ML tree searches were conducted and separate bootstrapping searches (100 replicates) are applied for the original concatenated supermatrix (350,356 aa positions). Due to the restricted computational power, calculation of branch lengths was not possible. The ML tree with the best likelihood value was chosen to plot bootstrap values. The software PHYLOBAYES is suitable for large-scale datasets but while performing the analysis the author of the present study became a bit suspicious about the implemented algorithms in PHYLOBAYES. The software relies similar to MrBayes on MCMC sampling but works differently saving parameter values in a dynamic process. The authors of this software define the number of generations (PHYLOBAYES 2.3 manual) as the number of elementary topological updates tried during a cycle. This number is not constant across cycles, because PHYLOBAYES implements recursive waves of topological updates along the tree [...]. What that exactly means was not to clarify. 90
103 Molecular insights to crustacean phylogeny 4. Discussion 4.2 Discussion of the phylogeny of crustaceans and related arthropods Non monophyletic Crustacea are reconstructed in all analyses included in this thesis. Strong evidence for paraphyletic crustaceans regarding Hexapoda is found in all trees supporting the Pancrustacea concept. To the knowledge of the author no molecular study exists that reveals a monophyletic clade Crustacea. A better understanding of the phylogeny of Crustacea is hindered by a problematic morphological classification of crustaceans. Many characters of the taxon Crustacea are more diagnostic characters e.g. two pairs of antennae (Diantennata) or biramous limbs instead of crustacean synapomorphies. These characters could be interpreted as mandibulate characters (see BUDD 2002; SCHOLTZ & EDGECOMBE 2006; WALOSSEK & MÜLLER 1998A+B). Only few morphological characters constitute a monophyletic Crustacea: The existence of eyes in the nauplius larvae is one putative synapomorphy of crustaceans (LAUTERBACH 1983, but see also RICHTER 2002). Also nephridia exclusively found in the segment of second antennae and maxillae are given as synapomorphic character (LAUTERBACH 1983; 1986; AX 1999). WALOßEK & MÜLLER (1998A+B) interpret the existence of three pairs of limbs in the first larvae of crustaceans as a synapomorphy for this group while fossilized larvae of representatives from the mandibulate stem lineage show four limbs. Pancrustacea (Crustacea + Hexapoda), first erected by PAULUS (1979) ae confirmed in several molecular studies relying on nuclear, mitochondrial and combined data (FRIEDRICH & TAUTZ 1995; FRIEDRICH & TAUTZ 2001; GIRIBET ET AL. 2001; HWANG ET AL. 2001; REGIER & SHULTZ 2001; SHULTZ & REGIER 2000; CARAPELLI ET AL. 2007; CARAPELLI ET AL. 2005; NARDI ET AL. 2003). DOHLE (2001) advocates synonymously the Tetraconata concept, which is based on similarities of eye structure (presence of cone cells) and is later supported by further neuroanatomical data (HARZSCH 2006; HARZSCH ET AL. 2005; HARZSCH ET AL. 2006; UNGERER & SCHOLTZ 2008). The unreduced phylogenomic dataset of analysis [C] recovers this clade with a bootstrap value of only 89. In the reduced dataset both trees support this clade maximally. This is in line with most molecular studies supporting a clade Pancrustacea and corrobates these results with a large scale phylogenomic dataset focused on arthropods. The higher support values of this clade in the trees of the reduced dataset suggest that there is some noise in the unreduced dataset that was encompassed by the reduction heuristics. The sistergroup of Hexapoda is to date still discussed. Morphological evidence (including neuroanatomical data) place Branchiopoda (SCHRAM & KOENEMANN 2004A), Malacostraca (STRAUSFELD 2009; STRAUSFELD ET AL. 2009:) as SG to Hexapoda or reconstruct a polytomic clade Malacostraca + Remipedia + Hexapoda (FANENBRUCK ET AL. 2004; FANENBRUCK & HARZSCH 2005). Most molecular studies support paraphyly of crustaceans with respect 91
 or Copepoda (MALLATT ET AL. 2004; MALLATT & GIRIBET 2006) as SG to Hexapoda.")
104 4. Discussion Molecular insights to crustacean phylogeny to hexapods. Molecular studies mostly reveal either Branchiopoda (REGIER & SHULTZ 1997; SHULTZ & REGIER 2000; REGIER ET AL. 2005; BABBIT & PATEL 2005; TIMMERMANS ET AL. 2008) or Copepoda (MALLATT ET AL. 2004; MALLATT & GIRIBET 2006) as SG to Hexapoda. Recently, the clade Cephalocarida + Remipedia is reconstructed as SG to Hexpoda (REGIER ET AL. 2008). The grouping of Cephalocarida + Remipedia is yet critically discussed by SPEARS & ABELE (1998), see also later paragraph Cephalocarida. Analyses using mitochondrial genes add more confusion to the situation by reconstructing non-monophyletic Hexapoda (NARDI ET AL. 2003; CARAPELLI ET AL. 2007), which is in total contrast to morphological evidence constituting a monophyletic Hexapoda. The results of the present study are ambiguous. Possible SG of Hexapoda are Copepoda (based on the rrna data, analysis A), Branchiopoda (based on the phylogenomic data, analysis C) or Remipedia (supported by hemocyanin from the EST data). Copepoda + Hexapoda: Copepoda are placed in several morphological and combined analyses at the basis of Crustacea as SG to Ostracoda (SCHRAM & HOF 1998; WHEELER ET AL. 2004, excluding fossils) or Mystacocarida (AX 1999; BOXSHALL & HUYS 1989; WHEELER ET AL including fossils, WILLS 1998). Most authors accept an inclusion of Copepods into the Maxillopoda (BOXSHALL & HUYS 1989; WALOSSEK & MÜLLER 1998A+B; SCHRAM & KOENEMANN 2004; see also MARTIN & DAVIS 2001). In molecular analyses the mostly basal position of copepods in morphological studies is not supported. In these molecular studies Malacostraca + Cirripedia (REGIER ET AL. 2005; REGIER ET AL. 2008) based on nuclear data or Branchiura + Pentastomida (COOK ET AL. 2005; LAVROV ET AL. 2004) relying on mitochondrial data are presented. The SG relation of Copepoda to the Hexapoda (present analysis [B]) is in line with some molecular studies (MALLATT ET AL. 2004; MALLATT & GIRIBET 2006) but one might doubt this clade respectively considering above cited morphological studies and the discrepancy of the heterogeneous molecular results. MALLATT AND GIRIBET (2006) doubted the SG copepod relationship to Hexapoda. The findings in the present rrna data show that with the more sophisticated time-heterogeneity model a rather low support value is obtained in contrast to the time homogeneous tree. Thus, the low support value reflects that eventually some conflicting signal is present in this topology. The standard time-homogeneous approach is not able to handle this and a rather good support is obtained. In the trees reconstructed with the phylogenomic data the Branchiopoda are the SG to hexapods and copepods cluster with the cirripedes. Branchiopoda + Hexapoda: The Branchiopoda are recovered as monophyletic group in analysis [B], which is in line with recent publications (STENDERUP ET AL. 2006; RICHTER ET AL. 2007; OLESEN 2007). There exists still no consensus on their position within crustaceans. Some incongruent results based on morphological, molecular and combined evidence exist for a SG relation to Malacostraca (BITSCH & BITSCH 2004; HASSANIN 2006; LAVROV ET AL. 2004; GIRIBET ET AL. 2005), Maxillopoda 92
105 Molecular insights to crustacean phylogeny 4. Discussion (WALOSZEK 2003; WHEELER ET AL. 2004) or Hexapoda (SCHRAM & KOENEMANN 2004B; REGIER & SHULTZ 1997; SHULTZ & REGIER 2000; REGIER ET AL. 2005; BABBIT & PATEL 2005; TIMMERMANS ET AL. 2008). Branchiopoda are recovered with low support as SG to a Copepoda + Hexapoda clade relying on the rrna data in the present thesis. The analysis of the phylogenomic data supports the results of above cited studies revealing a SG of Branchiopoda + Hexapoda. Interestingly, recent studies using large-scale data (DUNN ET AL. 2008; PHILIPPE ET AL. 2009) find the same topology. It might be seductive to assume a common ancestry of freshwater crustaceans and hexapods as described in GLENNER ET AL. (2006). Morphologically this scenario is under fire by the partly very specific adaptations of branchiopods to their environment, seasonal freshwater ponds. Basically the conclusion of GLENNER ET AL. (2006) is founded on the lack of fossils of branchiopods and insects before the Devonian. This is contradicted by other paleontological data (WALOSZEK 2003) concluding that respectively Orsten type fossils show characters of modern eucrustacean groups as Malacostraca and Branchiopoda. Remipedia + Hexapoda: Remipedia are introduced as a group of special interest to the reader in the material and methods section. Since their rather late description in 1981 (YAGER) no consensus is established about their phylogenetic position within crustaceans. Morphological studies suggest very early plesiomorphic characters defining this group (AX 1999; BRUSCA & BRUSCA 1990, view not changed in BRUSCA & BRUSCA 2003; SCHRAM 1986) and/or place them as SG to all remaining crustaceans (AX 1999; SCHRAM 1986; EMERSON & SCHRAM 1991; SCHRAM & HOF 1998; WHEELER ET AL. 2004, combined evidence). These results are not supported by SCHRAM & KOENEMANN (2004A) who place the Remipedes near to the Malacostraca. This clade is also supported by KOENEMANN ET AL. (2009) based on first descriptions of remipede larvae. A rather derived position of Remipedia is also supported by recent neuroanatomical studies (FANENBRUCK ET AL. 2004; FAHNENBRUCK & HARZSCH 2005) that reveal a polytomic clade (Malacostraca + Remipedia + Hexapoda) and indicate a possible but not clearly favored clade Malacostraca + Remipedia. The molecular studies based on mitochondrial markers are quite controversial (even contradicting within the same studies). Published topologies show a SG relation to the Cirripedia (CARAPELLI ET AL. 2007; HASSANIN 2006; LAVROV ET AL. 2004; LIM & HWANG 2006), Ostracoda (COOK ET AL. 2005), Collembola (COOK ET AL. 2005; HASSANIN 2006) or Diplura (CARAPELLI ET AL. 2007). Studies relying on nuclear markers (SPEARS & ABELE 1998; REGIER ET AL. 2005; REGIER ET AL. 2008; SHULTZ & REGIER 2000) reveal mostly a clade Cephalocarida + Remipedia (see later paragraph, Cephalocarida ) if both taxa are included. Relying on combined evidence, GIRIBET ET AL. (2001) find the same result or a clade Remipedia + Cephalocarida+ Ostracoda + Cirripedia. The suspicious long branch grouping of Remipedia + Cephalocarida is also surveyed in analysis [A] of this study. Analysis [B] relying on the 18S and 28S rrna genes recovers the 93
106 4. Discussion Molecular insights to crustacean phylogeny Remipedia as SG to a Cirripedia + Ostracoda clade in both approaches. Interestingly, this result is confirmed in many studies using mt-marker genes (CARAPELLI ET AL. 2007; HASSANIN 2006; LAVROV ET AL. 2004; LIM & HWANG 2006). To the knowledge of the author no morphological study exists supporting a clade composed of Cirripedia + Remipedia. This result has to be doubted which is underpinned by the differences between the time-homo vs. time-heterogeneous run. The pp value for the time-homogeneous approach is 0.73 while the time-heterogeneous tree shows only Comparing these values it can be discussed that the heterogeneous approach is probably calculating a more realistic, lower value of this unlikely clade. The cause for this clustering is unclear and reasons can be only speculative. Especially the recent neuroanatomical studies (FANENBRUCK ET AL. 2004; FANENBRUCK & HARZSCH 2005) and the analysis of KOENEMANN ET AL. (2009) relying on characters of the remipede larvae are serious hints for the derived position of the Remipedia in a still unclear scenario of a polytomic clade Remipedia + Malacostraca + Tracheata. The inclusion of Remipedia into the phylogenomic analysis unfortunately failed, but one finding using the EST data is that the hemocyanin of the Remipedia is close related to hexapod hemocyanin (ERTAS ET AL. 2009). This result is supporting a derived position of Remipedia and is in line with an eventual scenario that the Remipedia might have shared ancestors with the Hexapoda (FANENBRUCK ET AL. 2004; FANENBRUCK & HARZSCH 2005) or Tracheata (FANENBRUCK 2003). Thus the Archilabiata hypothesis (FANENBRUCK 2003; BÄCKER ET AL. 2008) is indirectly supported. Anyhow this scenario needs to be enlightened by more molecular data of Remipedia. Hopefully soon, a phylogenomic study with Remipedia and additionally Ostracoda and Leptostraca can be started using the tissue collected within this study. Due to technical problems with the 454 sequencing technology an analysis including samples of these species was not yet possible. Additionally further morphological studies would be important to test the molecular studies. Based on collected material for this study, work started already in this direction. Some individuals of Speleonectes tulumensis were analyzed by the present author and colleagues via X-ray tomography at the German Synchroton (DESY) in Hamburg to contribute to this challenge with collaborating partners (BLANKE; HARZSCH; KOENEMANN). The Entomostraca concept is not supported in the present study. The term Entomostraca was used the first time by LATREILLE (1806) and describes a rather typological than phylogenetic assemblage of non-malacostracan crustaceans. The term Entomostraca today describes a concept namely used and defined by WALOSSEK & MÜLLER (1998A+B WALOSSEK 1999) based on morphological characters. The synapomorphies of this group (Cephalocarida (Maxillopoda + Branchiopoda)) are e.g. an abdomen with at least four limbless somites and the shape of the second maxilla, the maxillula (= fourth pair of head limbs). The maxillulae of Entomostraca develope a stem that is subdivided into four endites and the proximal one is called the proximal endite (e.g. WALOSSEK & MÜLLER 1998A+B). However, several studies criticize this concept and its constituting synapomorphies (FAHNENBRUCK 2003; SCHRAM & KOENEMANN 2001). 94
107 Molecular insights to crustacean phylogeny 4. Discussion None of the present analyses reveal the grouping of Malacostraca + Entomostraca, see figure 1.1. The Malacostraca never form a separated lineage in the present study within crustaceans constituting a SG to Entomostraca. The Entomostraca are not supported by other molecular or combined evidence studies but in some morphological analyses that partly include fossils (WALOSSEK 1999; WALOSZEK 2003; WHEELER ET AL. 2004). With the completely sequenced 18S and 28S rrna data the Cephalocarida group as SG to the Branchiopoda a finding that is actually in line with the Entomostraca concept and morphological data (WHEELER ET AL. 2004; WALOSZEK 2003; SCHRAM & HOF 1998) but a monophyletic clade Maxillopoda is not revealed at all. Another argument against the Entomostraca is that maxillopodan taxa (copepods=analysis [B]; branchiopods= analysis [C]) constitute a paraphyletic Crustacea in respect to Hexapoda, which will be discussed later in more detail. The Thoracopoda concept based on the synapomorphy of an epipodite ((Cephalocarida + Branchiopoda) + Malacostraca) is incompatible with the Entomostraca grouping. The presence of epipodites is discussed controversial, see for an overview RICHTER (2002). In short, homology of the epipodites for these taxa is doubtful (e.g. WÄGELE 1993), and WALOßEK (1993) mentions different insertions of the coxopodite of Cephalocarida and the protopodite of Branchiopoda and Malacostraca concluding a convergent development of epipodites. ZHANG ET AL. (2007) discuss this character to be plesiomorphic describing its presence in Cambrian eucrustacean fossils (e.g. in Yicaris dianensis). EDGECOMBE ET AL. (2000) confirms the Thoracopoda with a cladistic analysis of arthropods including in total 211 morphological characters for the dataset, but combining this with molecular data (H3 and U2 snrna) the Thoracopoda clade is no longer reconstructed and instead Cephalocarida cluster together with Branchiopoda or as SG to all crustaceans. The present thesis does not support the Thoracopoda concept either with molecular data. As stated above the clade Cephalocarida + Branchiopoda (inferred in the timeheterogeneous tree relying on the 18S and 28S rrna data) is partly also in line with the Thoracopoda concept and the result of EDGECOMBE ET AL. (2000). Anyhow, Thoracopoda are contradicted by the position of the Malacostraca in the present analyses that were neither positioned as SG to the Cephalocarida + Branchiopoda clade nor as the most derived crustacean group. The Maxillopoda concept is highly debated and several morphological (EDGECOMBE ET AL. 2000; BITSCH & BITSCH 2004; SCHRAM & KOENEMANN 2004A; FANENBRUCK 2003; GIRIBET ET AL. 2005) and molecular analyses based on nuclear and mitochondrial data (SPEARS & ABELE 1998; COOK ET AL. 2005; HASSANIN 2005; 2006; REGIER ET AL. 2005; 2008; MALLATT & GIRIBET 2006) contradict this clade. The present study supports this contradiction. Especially in analysis [B] the widespread taxon sampling includes at least one specimen as representative for each maxillopodan clade (following MARTIN & DAVIS 2001), but a Maxillopoda clade is not recovered despite the sophisticated setting. 95

108 4. Discussion Molecular insights to crustacean phylogeny The phylogenomic data in this study lacks unfortunately most important taxa like Pentastomida, Mystacocarida and Ostracoda, only Cirripedia and copepods are included as maxillopodan taxa. A well-founded discussion is hardly to achieve concerning these data. Malacostraca are generally accepted to be monophyletic (RICHTER & SCHOLTZ 2001; JENNER ET AL. 2009) in morphological and combined analysis including molecular data (WHEELER ET AL. 2004; GIRIBET ET AL. 2001; GIRIBET ET AL. 2005) although some early morphological studies (SCHRAM & HOF 1998; WILLS 1998) suppose a non monophyly of this group. Yet SPEARS & ABELE (1998) reconstruct a monophyletic clade Malacostraca in one of the first studies based exclusively on molecular markers. The position of the Malacostraca within crustaceans is still unclear, and nearly all, possible SG relationships to all remaining crustacean groups have been reconstructed in published literature. Malacostraca are suggested by some authors as the SG to Entomostraca based on morphological and fossil data (WALLOSSEK 1999; WALOSZEK 2003; WHEELER ET AL. 2004). Other studies support a SG relationship to Maxillopoda (WILLS 1998), Anostraca (BITSCH & BITSCH 2004), Phyllopoda (Ax 1999) or a clade of Copepoda + Ostracoda + Thecostraca (SCHRAM & KOENEMANN 2004A). Neuroanatomical data supports a rather terminal position of Malacostraca as SG to the Archilabiata (Tracheata + Remipedia, FANENBRUCK 2003) or in a polyphylum to Remipedia + Malacostraca + Hexapoda (FANENBRUCK ET AL. 2004; FANENBRUCK & HARZSCH 2005). The phylogenetic position of Malacostraca differs among molecular studies. Often, Malacostraca emerge as nested within the remaining crustacean groups (e.g. SHULTZ & REGIER 2000; EDGECOMBE ET AL. 2000). In studies that use complete mitochondrial genomes for phylogenetic reconstruction Malacostraca are placed close to insects (LIM & HWANG 2006; WILSON ET AL. 2000). Studies based on rrna or other nuclear genes (MALLATT & GIRIBET 2006; MALLATT ET AL. 2004; GLENNER ET AL. 2006) find Malacostraca positioned more basally within crustaceans and often as SG to Cirripedes (REGIER ET AL. 2005; REGIER ET AL. 2008; MALLATT & GIRIBET 2006). The grouping with Cirripedia lacks any morphological support. In line with the Thoracopoda hypothesis are studies using mitochondrial and combined evidence reconstruction a SG to Branchiopoda (LAVROV ET AL. 2004; HASSANIN 2006; GIRIBET ET AL. 2005). This is additionally confirmed by PAPST & SCHOLTZ (2009) who argue that foliaceaus limbs of Branchiopoda and Leptostraca are probably homologous. This study is more focused on the position of malacostracans among other crustaceans and aims not to solve internal relationships that are still partly unclear (JENNER ET AL. 2009). In analysis [A] malacostracans were reconstructed for the dataset aligned by hand (figure 3.5), but in the automatically processed data some problematic taxa were placed outside the paraphyletic malacostracans. A good example for problematic malacostracan taxa is Dyastilis. This taxon is very likely (as the published mystacocarid sequence) a contamination, misleading tree reconstruction. Some taxa are extremely biasing analysis due to their long branches. 96
 monophyletic Malacostraca branch off at a more basal split within crustaceans (WALOSSEK 1998; ZHANG ET AL.")
109 Molecular insights to crustacean phylogeny 4. Discussion Since in the time-homogeneous tree (analysis [B]) monophyletic Malacostraca branch off at a more basal split within crustaceans (WALOSSEK 1998; ZHANG ET AL. 2007), forming a sister group relationship to Ostracoda while they are branching off at a more terminal split in the time-heterogeneous tree. A final conclusion cannot be drawn about the placement of Malacostraca in analysis [B]. The reconstructed position for both methodologically approaches makes one very suspicious (see figures 3.9 and 3.10) because it is not supported by morphological data and different to previous molecular studies. The question which effect underlies this result is not to be answered here. Probably the phylogenetic signal in the rrna data is not strong or clear enough to single out the correct placement of the Malacostraca. This issue grows even more complex if the phylogenomic data (analysis [C]) is included. In that analysis the Malacostraca are again placed rather basally as SG to Cirripedia + Copepoda. A final conclusion of the malacostracan position cannot be made here, either. Too many major crustacean groups are not represented yet in phylogenomic data (supplementary table S14). It might be speculated that the inclusion of Leptostraca and additional crustacean species to phylogenomic data will result in a more robust analysis, which is in process yet. Cephalocarida represent one of the crustacean groups discovered relatively late (SANDERS 1955). Early morphological studies (LAUTERBACH 1979, 1980; MOURA & CRISTOFFERSEN 1996) discuss the Cephalocarida as primitive crustaceans because they possess a ventral food channel, primarily missing carapax and the similarity of the second maxilla with the thoracic limbs. These characters all-together suggest a rather basal position as also stated in SCHRAM & HOF (1998). Based on cephalo-skeleton structure (FAHNENBRUCK 2003) the Cephalocarida are recognized as more derived crustaceans and placed as SG to the Branchiopoda. This is congruent with fossil evidence (WALOßEK 1993). In a combined evidence study of WHEELER ET AL. (2004), Cephalocarida are positioned as SG to a Branchiopoda + Maxillopoda clade. In recent molecular studies the Cephalocarida constitute a problematic group. It has to be mentioned that in all those studies only Hutchinsoniella macracantha is sequenced and analyzed. Unfortunately this taxon shows rather long branches in all analyses. For example, relying on nuclear data (REGIER ET AL. 2005; REGIER ET AL. 2009; SPEARS & ABELE 1998) the clustering of the two long branch taxa Remipedia + Cephalocarida is most commonly observed which is also the case in the present study (for analysis [A]). Yet, already SPEARS & ABELE (1998) suggest that this result is created by a long branch artifact. Despite the inclusion of Lightiella incisa, a second cephalocarid in analysis [A], this long branch is not to brake down. Studies relying on mitochondrial markers (CARAPELLI ET AL. 2007; COOK ET AL. 2005; HASSANIN 2006; LAVROV ET AL. 2004; PODSIADLOWSKI & BARTHOLOMAEUS 2006; 2007) are also obviously affected by systematic errors like reverse strand bias, meaning more T and G content relative to A and C (HASSANIN 2006) and place the Cephalocarida to nearly all crustacean groups (Cirripedia, Copepoda, Malacostraca) and even Hexapoda. The gene order information also finds a rather ambiguous result (see LAVROV ET AL. 2004): namely SG to 97
110 4. Discussion Molecular insights to crustacean phylogeny Hexapoda based on trna translocation data. PODSIADLOWSKI & BARTHOLOMAEUS (2006) suggest a SG relation to Cirripedia based on gene rearrangements. These results based on mitochondrial data suggest that the recently analyzed mt-data is not suitable to assess at least the phylogenetic position of the Cephalocarida. In the present study, the crustacean Hutchinsoniella (Cephalocarida) clusters in the time-homogeneous approach (analysis [B]) with Lepisma (Zygentoma, Hexapoda) within Enthognatha as sister group to Nonoculata (Protura+Diplura, figure 3.10). This led to the polyphyly or paraphyly of several major groups (e.g. Hexapoda, Entognatha, Ectognatha). In the time-heterogeneous analysis, Cephalocarida clustered as sister group to Branchiopoda. This result, although marginally supported, is congruent, at least, with several studies relying on morphological data (SCHRAM & HOF 1998; WHEELER ET AL. 2004), fossil data (WHEELER ET AL. 2004; WALOSSEK & MÜLLER 1998A+B; WALOßEK 1993) and neuroanatomical data (FANENBRUCK 2003). This result also agrees with HESSLER, who states in an essay (1992) about the phylogenetic position of cephalocarids: [ ] If cephalocarids have any special affinity with other living groups, it is with the branchiopods and malacostracans. Most recent molecular studies have not included Cephalocarida (e.g. MALLATT & GIRIBET 2006; MALLATT ET AL. 2004). REGIER ET AL. (2005) reconstruct a sister group relationship of Remipedia and Cephalocarida (likewise represented by Hutchinsoniella macracantha), but his result also receives only moderate bootstrap support. The same clade is presented in GIRIBET ET AL. (2001) based on morphological and molecular data. This clade characterized by long branches of involved taxa is also found in analysis [A]. Taking a heterogeneous base frequency into account it was possible for the first time to recover the rather plausible position of the Cephalocarida as SG to Branchiopoda, but the support value of 0.59 pp is rather low. The reason for this might be conflicting signal or long branch effects but to investigate this in detail better tools are needed. The correction of the misplacement of Hutchinsoniella, by allowing for non-stationary processes in the models for sequence evolution, has a major effect on the heuristic value of the analyses. The inference of crustacean phylogeny, however was in general not improved, especially many nodes within Crustacea are rather low supported. Anyhow, not only the monophyletic status of Hexapoda, Entognatha and Ectognatha is supported after the correction, but likewise a causal explanation is given for the misplacement in the time-homogeneous approach, which cannot be accomplished by alternatively excluding a taxon. The time-heterogeneous analyses results in a sister group relationship of Diplura and Protura, which lends support to a monophyletic Nonoculata within a monophyletic Entognatha. This result is congruent with trees published by KJER (2004), LUAN ET AL. (2005), MALLATT AND GIRIBET (2006), and DELL AMPIO ET AL. (2009). 98

 while the internal relationships of thecostracan gr")
111 Molecular insights to crustacean phylogeny 4. Discussion Cirripedia constitute together with the Facetotecta and Ascothoracica a monophyletic Thecostraca (GRYGIER 1987). Synapomorphies are five pairs of lattice organs and prehensile antennulae of the cypris larvae (GLENNER & HEBSGARD 2006; HØEG & KOLBASOV 2002; HØEG ET AL. 2004; HØEG ET AL. 2009; PEREZ-LOSADA ET AL. 2008). Cirripedes as monophlylum are recovered by several morphological and molecular studies as monophyletic group (HØEG & KOLBASOV 2002; HØEG ET AL. 2009; PEREZ-LOSADA ET AL. 2008) while the internal relationships of thecostracan groups are partly still debated. The present study includs Cirripedia (e.g. Pollicipes pollicipes, Semibalanus balanoides) as representatives of Thecostraca, tissue from members of Ascothoracica or Facetotecta were not to obtain as material. The Thecostraca are reconstructed in most morphological studies within a clade Maxillopoda (WALOSSEK & MÜLLER 1998B: possible grouping with Branchiura, BOXSHALL & HUYS 1989; SCHRAM & HOF 1998) or as SG to a Branchiura + Pentastomida clade (GRYGIER 1983; 1987). The grouping with branchiurans has recently also been inferred in molecular studies (MØLLER ET AL. 2008) and is supported by both approaches in the present analysis [B] with maximal support. Though it should be kept in mind that the clade Maxillopoda is not confirmed in the present study. Other molecular studies relying on different markers (e.g. MALLATT & GIRIBET 2006; REGIER ET AL. 2005) reveal a clade Cirripedia + Malacostraca, with cirripedes as thecostracan representatives. Interestingly, the study of MALLATT & GIRIBET (2006) uses also rrna genes like the present study and their different result is also highly supported in the Bayesian reconstruction. A close relationship of cirripedes and remipedes is often observed when both groups are included into analyses (CARAPELLI ET AL. 2007; HASSANIN 2006; LAVROV ET AL. 2004; LIM & HWANG 2006). This is also the case for the present single gene analyses, see analyses [A] and [B]. In contrast, cirripedes cluster in the phylogenomic dataset with low support either with copepods (ML) or malacostracans (Bayesian). Looking more closely into each PHYLOBAYES chain one can see that the cirripede Pollicipes pollicipes is ambiguously positioned as sistergroup to Malacostraca and Copepoda. REGIER ET AL. (2005; 2008) and MALLATT & GIRIBET (2006) recover a clade Cirripedia + Malacostraca either, but from a morphological point of view this finding is not supported. It can be speculated if the relative information content for this taxon was biased by contradicting signal or specific peculiarity of cirripede sequences. Ostracoda represent a species rich crustacean group that has eminent stratigraphic relevance. Morphologically is contradicting evidence supporting monophyly (COHEN ET AL. 1998) or paraphyly (VANNIER & ABE 1995) of the two main ostracod lineages, the Myodocopa and Podocopa. Molecular studies reveal a non monophyly of the Ostracoda (SPEARS & ABELE 1998). In many morphological studies the Ostracoda are either the SG to Thecostraca or to a clade Ascothoracica + Cirripedia or positioned near cirripedian taxa (AX 1999; SCHRAM & KOENEMANN 2004; BOXSHALL & HUYS 1989; SCHRAM & HOF 1998). Molecular studies reveal a SG relation to all remaining Pancrustacea (REGIER ET AL. 2005; 99
 using combined evidence. The result is the clade (Ostracoda + Copepoda) or (Ostracoda + (Mystacocarida + Copepoda)).")
112 4. Discussion Molecular insights to crustacean phylogeny 2008), to Branchiura + Pentastomida (MØLLER ET AL 2008; MALLATT & GIRIBET 2006) or to Cirripedia (GIRIBET ET AL. 2005, combined evidence). Ambiguous results are found in WHEELER ET AL. (2004) using combined evidence. The result is the clade (Ostracoda + Copepoda) or (Ostracoda + (Mystacocarida + Copepoda)). In the present study only the single gene analyses included Ostracoda of which only analysis [A] included both lineages. Most trees in this analysis suggest a close relationship to Cephalocarida + Remipedia for the podocopan ostracods while the myodocopa fall out of the analysis mostly grouping not even together. In analysis [B] only podocopan species are included (Heterocypris incongruens and Pontocypris mytiloides) resulting in an ambiguous position. The time-homogeneous tree shows an Ostracoda + Malacostraca clade (pp 0.99) while the time-heterogeneous reveals a Mystacocarida + Ostracoda clade. This result would confirm WHEELER ET AL. (2004) and SCHRAM (1996) but the support value for the latter clade is rather low (0.62). Anyhow an Ostracoda + Malacostraca clade that is found for the stationary approach nearly maximally supported is rather unlikely and not to defend by morphological data. Thus this finding is discussed as an artifact of the stationary approach. The question, if one can rely on the reconstructed clade Ostracoda + Mystacocarida in the non-stationary approach is complex to address. On the one hand this is the first time that Mystacocarida, Cephalocarida, Remipedia and Ostracoda are included in one complex molecular analysis. On the other hand a low support value of 0.62 is not really giving a trustworthy topological solution. To solve the position of the Ostracoda more species should be included and more, different markers should be tested. For further phylogenomic analyses a study is planned including data of a pyrosequencing project (Roche, 454 Titanium) of at least one podocopan ostracod. The sequencing is in progress yet. Mystacocarida belong to the smallest crustaceans inhabiting the interstitial of marine sandy beaches and were first described by PENNAK & ZINN (1943). Since then hitherto most morphological studies conclude a SG relationship to the Copepoda (BOXSHALL & HUYS 1989; AX 1999; WILLS 1998) or Copepoda + Ostracoda (SCHRAM & HOF 1998). Only one published molecular study includes Mystacocarida, that of SPEARS & ABELE (1998). One has to note that the published 18S rrna sequence (L81937) in this study is probably a contamination as demonstrated and discussed in analysis [A]. Due to their small body size the amplification of the Mystacocarida genes is difficult because one has to work extremely precisely in the laboratory to avoid contaminations. Probably this is one reason why not many sequences for this group exist. The present study is the first including this taxon in a broader crustacean sampling for molecular analyses since SPEARS & ABELE (1998). In analyses [A] (figure 3.5), the Mystacocarida are placed in a polytomic clade composed of ((Branchiura + Pentastomida) + Ostracoda) Ostracoda, Mystacocarida. A similar topology but with even worse resolution is reconstructed for the processed MAFFT-based dataset, see figure 3.6. Interestingly, analysis 100
![Molecular insights to crustacean phylogeny 4. Discussion [B] reconstructs in the time-homogenous tree a clade of Mystacocarida + Pentastomida with a pp of 0.73.](/docs-images/88/115870114/images/113-0.jpg "In the time-heterogeneous tree a clade of Mystacocarida + Ostracoda is revealed. The support value of 0.62 is rather low, but this finding is in line with findings of WHEELER ET AL.")
113 Molecular insights to crustacean phylogeny 4. Discussion [B] reconstructs in the time-homogenous tree a clade of Mystacocarida + Pentastomida with a pp of In the time-heterogeneous tree a clade of Mystacocarida + Ostracoda is revealed. The support value of 0.62 is rather low, but this finding is in line with findings of WHEELER ET AL. (2004) relying on combined evidence, and SCHRAM & HOF (1998) using morphological characters. The position of the Mystacocarida in this thesis is hard to discuss based on the rather low support value of the time-heterogeneous tree and the inadequate markers in analysis [A]. But it can be argued that the finding in the time-heterogeneous tree is more reliable because it is in line with the morphological data despite the low support value. Anyhow a SG relationship to Copepoda as dominating in morphological studies is not reconstructed in both analyses [A] + [B]. Unfortunately, analysis [B] including a sophisticated modeling and broad taxon sampling is also not able to answer the position of the Mystacocarida within crustaceans unambiguously. Especially the low support value could be a hint for conflicting signal. For further studies in the framework of this thesis the collection of more than 1500 Mystacocarida was conducted to start a 454 project of this group and to elucidate their position within crustaceans in the light of phylogenomic data. Pentastomida are the parasitic crustacean group described more detailed in the material and method section. This group is morphologically hard to comprise due to their parasitic life style as described in the previous section (see also figure 2.2). Their morphological characters are partly difficult to interpret in a context of a possible affiliation of Pentastomida to the clade Crustacea. The first study indicating that pentastomids are crustaceans was from WINGSTRAND (1972) who compares the development and structure of pentastomids and branchiurans and finds a close similarity of the sperm structure for these two taxa. In contrast some morphologists exclude the Pentastomida from the crustaceans or even crown group arthropods and assign pentastomids to the stem arthropod lineage together with Cambrian fossils, which are suggested to represent members of the extant Pentastomida (MAAS & WALOSZEK 2001; WALOSZEK ET AL. 2006; DE OLIVIERA ALMEIDA ET AL. 2008). The first molecular study of Pentastomida by ABELE ET AL. (1989) reconstructs a SG relationship between Branchiura and Pentastomida therefore supporting WINGSTRAND (1972). This result is also recovered by several later studies using mitochondrial, nuclear or combined nuclear and mt-data (COOK ET AL. 2005; KILPERT & PODSIADLOWSKI 2006; LAVROV ET AL. 2004; LIM & HWANG 2006; MALLATT & GIRIBET 2006; MØLLER ET AL. 2008). A combined evidence study using morphological and molecular data by GIRIBET ET AL. (2005) supports the previous studies. The present study reveals the Pentastomida within the Pancrustacea and does not support an exclusion of this group from euarthropods. However, the position within the several present analyses is contradicting. In both trees of analysis [A] the clade Branchiura + Pentastomida is supported. In the time-homogeneous tree pentastomids group with the mystacocarids (pp 0.73), while in the time-heterogeneous tree the clade Pentastomida + Cephalocarida+ Branchiopoda is reconstructed, also low supported (pp 0.60). Again, an 101
 is in line with previous findings of above cited molecular studies relying on different markers but most of these studies did not implement")
114 4. Discussion Molecular insights to crustacean phylogeny interpretation and discussion is complicated. On the one hand the result (Banchiura + Pentastomida) is in line with previous findings of above cited molecular studies relying on different markers but most of these studies did not implement time-heterogeneity and sophisticated modeling. On the other hand in analysis [B] sophisticated models are used, but support values are rather low. It has to be noted that the 28S sequence of Raillietiella sp. could not be sequenced completely in this thesis, thus necessary information (positions) was eventually lacking for a correct positioning of the Pentastomida in analysis [B]. This would also explain the low support value. Anyhow, for a future phylogenomic study a pyrosequencing project (Roche, 454 Titanium) of this taxon is planned to include Pentastomida in a phylogenomic analysis. Hexapoda are not the topic of this thesis but have to be discussed briefly as they appear as a pancrustacean in-group. The monophyly of Hexapoda is supported by most morphological studies and is in general accepted by most scientists (e.g. BOUDREAUX 1979; HENNIG 1969; KRISTENSEN 1998; KUKALOVÁ- PECK 1998). The generally accepted synapomorphy of Hexapoda is the tagmosis of the body with a thorax constituted of three limb bearing segments and an abdomen constituted of originally 11 segments and a telson. A rather contradicting, paraphyletic scenario of hexapod origin is created by recent molecular studies that mostly rely on mitochondrial data. In most cases taxa of the Entognatha are reconstructed within Crustacea or other arthropod groups, e.g. Collembola: (COOK ET AL. 2005; HASSANIN 2006; LAVROV ET AL. 2004; NARDI ET AL. 2003) or Diplura: (CARAPELLI ET AL. 2007). However recent studies demonstrate that some of these findings are based on insufficient taxon sampling and that mitochondrial data alone is problematic to solve internal arthropod relationships (CAMERON ET AL. 2004; DELSUC ET AL. 2003; HASSANIN 2006). A good example is the reply of DELSUC ET AL. (2003) to NARDI ET AL. (2003). NARDI ET AL. (2003) state that hexapods are paraphyletic, revealing Collembola (Entognatha) as crustacean in-group. DELSUC ET AL. (2003) could nicely demonstrate that applied taxon sampling and methods were problematic and they reveal at least a monophyletic Hexapoda in their reanalyzes of the data including more taxa. Confirming this result, Collembola are placed within a monophyletic clade Hexapoda by TIMMERMAN ET AL. (2008) relying on nuclear ribosomal proteins revealing the discrepancy between mitochondrial and nuclear data once more. The present study supports Pancrustacea with paraphyletic Crustacea regarding to Hexapoda. In line with TIMMERMAN ET AL. (2008) and DELSUC ET AL. (2003) are monophyletic Hexapoda and furthermore monophyletic Entognatha and Ectognatha revealed in analyses [B] + [C]. The rrna data in analysis [B] shows clearly how strong biasing effects of mismodeling can be even with a broad taxon sampling. Ignoring time-heterogeneity affects dramatically the reconstruction for crustacean and hexapod taxa. The time-homogeneous tree demonstrates this by the grouping of Hutchinsoniella and Lepisma (Zygentoma). This unlikely clustering is 102
115 Molecular insights to crustacean phylogeny 4. Discussion an artifact that creates bias in several clades in the time-homogeneous tree and has a major impact on the reconstructed phylogeny. In the time-homogenous approach nonmonophyletic Hexapoda and Entognatha are recovered. However, comparing the results for Hexapoda and Crustacea it can be shown that most major hexapod clades are robustly revealed in the non-stationary approach contrary to most crustacean clades, despite this time-heterogeneous approach. That eventually indicates the limitation of rrna data for crustacean phylogeny while hexapods are in comparison reconstructed with relatively robust support values. In ML and Bayesian approaches of the phylogenomic data (analysis [C]), Entognatha (Protura, Diplura and Collembola) are recovered albeit weakly supported. Since the phylogenomic analysis [C] included all critical members of primarily wingless hexapods and showed that hexapods are monophyletic, the present study supports that hexapods are most likely monophyletic and not paraphyletic in respect to crustaceans as revealed in above cited studies. Relationships among hexapods and pterygote insects are still disputed but not topic of this thesis. 4.3 General arthropod phylogeny discussion The Tracheata are commonly presented and discussed as monophylum based on morphological data in many text books (AX 1999; BOUDREAUX 1979; DUNGER, in GRUNER 1993; PAULUS, in WESTHEIDE & RIEGER 1996). Interestingly the new edition of the RIEDER & WESTHEIDE presents the competing hypotheses Tracheata and Pancrustacea discussing both rather equally as potential evolutionary scenario (PAULUS 2007). In addition to recent molecular studies (FRIEDRICH & TAUTZ 1995; FRIEDRICH & TAUTZ 2001; GIRIBET, EDGECOMBE & WHEELER 2001; HWANG ET AL. 2001; REGIER & SHULTZ 2001; SHULTZ & REGIER 2000) some morphological data (PAULUS 1979; DOHLE 2001; RICHTER 2002) contradict the Tracheata combining the Crustacea and Hexapoda to the Pancrustacea (ZRZAV & TYS 1997; ZRZAV & TYS 1998A) or synonymously Tetraconata (DOHLE 2001). The results of this thesis contradict in all analyses for rrna and phylogenomic data the Tracheata hypothesis supporting instead a clade Pancrustacea (as discussed previously). Mandibulata (versus Myriochelata): Instead of the Mandibulata, recent molecular studies relying on mitochondrial, nuclear and phylogenomic data suppose a clade of Chelicerata + Myriapoda (HASSANIN 2006; HASSANIN ET AL. 2005; MALLATT ET AL. 2004; ROTA- STABELLI & TELFORD 2008; PISANI 2004; DUNN ET AL. 2008; ROEDING ET AL. 2007; ROTA-STABELLI AND TELFORD 2008). Analyses of rrna sequences up till now are held to favor Myriochelata over Mandibulata (FRIEDRICH & TAUTZ 1995; MALLATT & GIRIBET 2006; MALLATT ET AL. 2004). This clade Myriochelata (PISANI 2004) or Parodoxopoda (MALLATT ET 103
 find a support from nervous system pattern but this is conflicting with extensive anatomical data that affirm Mandibulata (HARZSCH ET AL. 2005; BÄCKER ET AL. 2008).")
116 4. Discussion Molecular insights to crustacean phylogeny AL. 2004) is generally not supported by morphological data (see e.g. BÄCKER ET AL. 2008). STOLLEWERK & CHIPMAN (2006) find a support from nervous system pattern but this is conflicting with extensive anatomical data that affirm Mandibulata (HARZSCH ET AL. 2005; BÄCKER ET AL. 2008). The results of this thesis support a modified clade Mandibulata with a grouping of Pancrustacea + Myriapoda (see figure 1.4, B). Myriapoda problematics: The present analysis [B] provides no final conclusion with respect to the conflict Mandibulata versus Myriochelata. The position of Pauropoda and Symphyla causes Myriapoda beeing polyphyletic. To evaluate the impact on the topology of the very likely incorrect positions of Symphyla and Pauropoda, the time-heterogeneous analysis was repeated using a reduced dataset excluding these taxa. The analysis was limited to ten chains with 7,000,000 generations each (2, 000, 000 burn-in). Differences occurring in the inferred consensus topology (not shown) of the final three chains (15, 000, 000 generations) show that some nodes are still sensitive to taxon sampling, since e.g. Pycnogonida cluster with (Chilopoda + Diplopoda) after exclusion of pauropod and symphylan sequences. Also the crustacean topology changes. The remaining long branch taxa Hutchinsoniella and Speleonectes cluster together in the reduced dataset, forming a clade with (Branchiura + Cirripedia). Despite the endeavor to break down long branches by a dense taxon sampling, some long-branch problems persist. The reason cannot be clearly addressed but, due to the symptoms, it can be assumed that saturation by multiple substitutions caused signal erosion in the rrna data (class II effect, WÄGELE & MAYER 2007). The exact reconstruction of the position of Myriapoda within the Euarthropoda and a final conclusion supporting Myriochelata or Mandibulata is not possible. But it seems that a clade Myriochelata might be based on a systematic error in molecular analyses. Recent studies demonstrated for example a high sensitivity with respect to gene choice, taxon sampling and out-group choice (BOURLAT ET AL. 2008; PHILIPPE ET AL 2009). Myriapoda emerged with weak support in the Bayesian trees in the phylogenomic data (analysis [C]) as sister group to chelicerates. In the ML tree reconstructions the relationships of myriapods, sea spiders, euchelicerates and pancrustaceans is not resolved. Applying the matrix reduction heuristics the previous robust support value obtained for this clade in the unreduced dataset vanishes and confirms above cited morphological studies. Thus the application of new markers and suitable phylogenetic strategies like those applied in the phylogenomic analysis (C) have to be applied and developed further. Chelicerata are in general accepted as a SG clade to Myriapoda + Crustacea + Hexapoda based on morphological, developmental and paleontological data (HARZSCH 2004; HARZSCH ET AL. 2005; RICHTER 2001; SCHOLTZ & EDGECOMBE 2006; WEYGOLD 1998). The Schizoramia concept (TCC) is to date obsolete and was mainly based on fossil data (CISNE 1974; see e.g. SCHOLTZ & EDGCOMBE 2005). This TCC hypothesis is rejected 104
117 Molecular insights to crustacean phylogeny 4. Discussion in all trees of the present thesis. Pycnogonida are placed by morphological and recent neuroanatomical studies mostly in two competing positions (see DUNLOP 2005; DUNLOP & ARANGO 2005), either as SG to Euchelicerata (BRENNEIS ET AL. 2008) or as basal euarthropods (MAXMEN ET AL. 2005, but see contrary SCHOLTZ & EDGECOMBE 2006). In molecular studies the Chelicerata are more ambiguous and mostly revealed in a Myriochelata clade (see previous section). The Pycnogonida (=Pantopoda) are in most studies the SG to Euarthropoda (GIRIBET ET AL. 2001; REGIER & SHULTZ 2001; SHULTZ & REGIER 2001), thus supporting the Cormogonida hypothesis (ZRZAV ET AL. 1998A). Yet, a frequent finding is also a SG relation to Euchelicerata (MALLATT ET AL. 2004; DUNN ET AL. 2008; WHEELER & HAYASHI 1998; REGIER ET AL. 2005) which is supported by developmental data (BRENNEIS ET AL. 2008). Only TELFORD ET AL. (2008) AND BOURLAT ET AL. (2008) published until today a Euarthropoda clade sensu SNODGRASS (1935) with the Pycnogonida as SG to Euchelicerata, relying on molecular data (see figure 1.4, B). The rrna data of analysis [B] supports in both approaches a monophyletic Chelicerata with Pycnogonida as SG to Euchelicerata, rejecting the Cormogonida hypothesis. Both approaches reveal a clade Myriapoda partim, the unusual position of symphylans and pauropods creates a polyphyletic Myriapoda which is obviously an artifact. While the position of sea spiders is not resolved in the ML tree (fig. 3.13) with the phylogenomic data (analysis [C]), the Bayesian tree (fig. 3.12) shows monophyletic chelicerates with high support (posterior probability, pp 0.99), including sea spiders. This result corroborates recent molecular analyses (DUNN ET AL. 2008) and neuroanatomical studies, which demonstrate the homology of deuterocerebral appendages of Pycnogonida and Euchelicerata (BRENNEIS ET AL. 2008). It further implies that chelicerae and pedipalpi as head appendages evolved only once and are a diagnostic character of chelicerates. The strongly supported clades Ixodida (ticks) and Astigmata (mites) belonging to Acari, Chelicerata, Decapoda, Copepoda (crustaceans) corroborate results of studies based on single nuclear genes (KJER 2004; LUAN 2005; MISOF ET AL. 2007). This is contrary to studies based on (as previously discussed) problematic mitochondrial protein coding genes (CARAPELLI ET AL. 2007; NARDI ET AL. 2003). Euarthropoda: Most authors confirm on morphological (BUDD 2001; HUGHES ET AL. 2008; WALOSZEK ET AL. 2007), molecular (TELFORD 2005; ROEDING ET AL. 2007; BLEIDORN ET AL. 2009) and developmental data (HARZSCH ET AL. 2005; HARZSCH 2006; LOESEL 2005; SCHOLTZ & EDGECOMBE 2005) the commonly accepted Euarthropoda including Chelicerata, Crustacea, Hexapoda and Myriapoda. For internal relationships see previous sections. The Euarthropoda are a group of the widely accepted Ecdysozoa (TELFORD 2005; TELFORD 2006; TELFORD ET AL. 2008; BOURLAT ET AL. 2008; PAPS ET AL. 2009; GIRIBET 2008) including Euarthropoda and the Cycloneuralia (Priapulida, Kinorhyncha, Loricifera, Nematoda and Nematomorpha). To reveal ecdysozoan relationships was not the focus of this thesis. The origin of the arthropod bauplan, concerning for example the evolution of segmentation, appendages and the central nervous system, can only be understood if the 105

118 4. Discussion Molecular insights to crustacean phylogeny phylogenetic positions of tardigrades (water bears) and onychophorans to the Euarthropoda can be resolved. Onychophora strongly resemble arthropod-like animals. They are characterized by lobopods with pads and claws, one set of antennae, reminiscents of primary segmentation and a ladder-like central nervous system. An extensive fossil record exists of Onychophora-like taxa, the Lobopodia. Morphologically the classification of these taxa within the Arthropoda is still discussed, but it seems that evidence for a close relation to other Lobopodia and Euarthropoda outbalances other interpretations (RAMSKÖLD & JUNYUAN 1998). But some authors conclude an ambiguous position of the Onychophora constituting polyphyletic, unresolved relationships of the taxa Onychophora, Lobopodia and Tardigrada as SG to Euarthropods (WALOSZEK ET AL. 2005; BUDD 2009; BUDD 2001). Molecular analyses place Onychophora either as sister group to Tardigrada + Euarthropoda (REGIER ET AL. 2005; SHULTZ & REGIER 2000) or sistergroup to Euarthropoda (BRUSCA & BRUSCA 2003; DUNN ET AL. 2008; GIRIBET 2008; MALLATT ET AL 2006; TELFORD ET AL. 2008) which is the most common finding. The rrna data based analyses ([A] + [B]) cannot enlight the position of Onychophora within arthropods. The Onychophora drop into the euarthropods within these analyses, except the tree based on the hand-optimized dataset (figure 3.5). Congruent to cited molecular and phylogenomic studies a strong support for a clade Onychophora + Euarthropoda, excluding tardigrades is received with the phylogenomic data (analysis [C]). It appears that onychophorans are the sistergroup of euarthropods. The extensive fossil record of onychophorans (EDGECOMBE 2009) can thus profitably be used to improve our time scale of arthropod evolution. Tardigrada are tiny animals of which no consensus exists at the moment regarding their phylogenetic position (RAMSKÖLD & JUNYUAN 1998; EDGECOMBE 2009). BRUSCA & BRUSCA (1990) place Tardigrada in the lineage leading to Euarthropoda above the Onychophora. Anyhow, some morphological characters of Tardigrada are reminiscent of both Arthropoda and Cycloneuralia (BRUSCA & BRUSCA 2003, GIRIBET 2003). Arthropod-like characters of tardigrades include the segmented body, limbs and ladder-like central nervous system (BRUSCA & BRUSCA 2003, GIRIBET 2003). On the other hand, structures of mouth, pharynx, cuticle and sensory organs of tardigrades resemble those of some Cycloneuralia (GIRIBET 2003). Traditionally, tardigrades are allied with arthropods (BRUSCA & BRSUCA 1990; BRUSCA & BRUSCA 2003), an arrangement that is recovered also by molecular phylogenetic studies based on ribosomal RNA (MALLATTT ET AL. 2004). Unfortunately some molecular studies are not able to resolve the position of tardigrades revealing a polytomic clade Tardigrada + Onychophora + Euarthropoda (REGIER ET AL. 2005; REGIER ET AL. 2008). A clade of Tardigrada + (Onychophora + Euarthropoda) (DUNN ET AL. 2008; ROEDING ET AL. 2007) would support the evolution of segmentation, segmented appendages and a ladder- 106
119 Molecular insights to crustacean phylogeny 4. Discussion like central nervous system within this group. A sistergroup relationship of tardigrades with Cycloneuralia (LARTILLOT ET AL. 2008, but without Onychophora!; BLEIDORN ET AL. 2009) would imply a loss of these characteristics within Cycloneuralia and a very ancient evolution of a segmented body plan as the most parsimonious explanation. The not fully understood position of Onychophora and Tardigrada and the possible grouping of Tardigrada as SG to euarthropods or Tactopoda (BUDD 2001) makes an outgroup choice of Tardigrada at least questionable to infer arthropod phylogeny. However, the rrna based analyses [A] + [B] are basically focused on the internal relationships of the Euarthropoda. Thus the selection of tardigrades can be justified as chosen out-group. For the phylogenomic analysis the out-group is changed to Mollusca and a massively broadened taxon sampling is applied. In the phylogenomic analysis tardigrades (Hypsibius and Richtersius) are recovered as sister group of nematodes (BS 100%, pp 1.0), corroborating results of recent phylogenomic studies (ROEDING ET AL. 2007; BLEIDORN ET AL. 2009). In contrast, DUNN ET AL. (2008) found tardigrades as SG of arthropods (including onychophorans) with the CAT model of amino acid evolution (LARTILLOT & PHILIPPE 2004), whereas applying the WAG model the result also suggests an association of tardigrades and nematodes. It might therefore be speculated whether some of the arthropod characteristics are actually plesiomorphic for arthropods and are shared character states of a much more inclusive group. However, this interpretation is still very preliminary since data of several important representatives of ecdysozoan taxa are missing. 4.4 General methodological discussion Based on the previous specific methodological and phylogenetic discussions some methodological issues and problems are summarized and discussed here. Taxon choice In recent publications taxon sampling and the choice of taxa, which are included into analysis are discussed as influential parameters. One reason is that some species have shown long branches in molecular analyses that bias the tree reconstruction (AGUINALDO ET AL. 1997; PHILIPPE ET AL. 2005B; BRINKMANN ET AL. 2005, BRINKMANN & PHILIPPE 2008; HEATH ET AL. 2008). The underlying effect of long branch attraction (FELSENSTEIN 1978) is already mentioned in previous paragraphs. This effect is more complex as commonly thought and different types of long branch effects are described in WÄGELE & MAYER (2007). The oftenused term and subsequently the practice of breaking long branches by adding more taxa (BERGSTEN 2005; BRINKMANN & PHILIPPE 2008; Zwickl & Hillis 2002; Hendy & Penny 1989) is a method to minimize long branch artifacts that are caused by multiple substitutions. This effect is named a class III artifact in WÄGELE & MAYER (2007). Addition of taxa to shorten internal long branches of a topology circumvents a second case of LBA, 107
120 4. Discussion Molecular insights to crustacean phylogeny namely the class I LBA (WÄGELE & MAYER 2007). In this case symplesiomorphic positions reconstruct paraphyletic groups. This effect causes a false interpretation of the (in fact) plesiomorphic positions as synapomorphies. Adding more taxa that are positioned in between the internal and terminal taxon or the out-group and the internal taxa (or both) can minimize this effect. In this study it was tried to sample at least two species for each crustacean group that are not too derived from the ground pattern of the group. The aim is to minimize class III effects by collecting taxa that show no long branches. Two taxa per group are collected to avoid or minimize class I effects. However, as seen in figures 3.8 and 3.9 especially the two species Speleonectes tulumensis (Remipedia) and Hutchinsoniella macracantha (Cephalocarida) show extremely long branches. It was not possible for those two groups to include further species in the analysis. It could be achieved unfortunately not until the end of the thesis to collect two further species for both groups. Despite extensive laboratory effort it was not possible to sequence these in time. In analysis [B] it is clearly demonstrated that for Hutchinsoniella obviously the compositional heterogeneity plays a more important role than long branch effects. The position of Hutchinsoniella in the time-heterogeneous tree is morphologically rather plausible. So it seems that this is one example for a long branch taxon that is not affected by long branch artifacts but instead extremely biased by other problematic effects, namely the compositional heterogeneity of base frequencies (see later paragraph). However, analysis [B] also reveales that rrna data is problematic for crustaceans regarding signal erosion in the sequences (see later paragraph). Some stem lineages show extremely short branches, e.g. for the Malacostraca. It is possible that in these cases class II LBA effects occur, but this is not to handle by taxon choice. Composite or hybrid taxa A commonly used approach to compile larger datasets (SHOSHANI & MCKENNA 1998; BAURAIN ET AL. 2006; PHILIPPE ET AL. 2006; DELSUC ET AL. 2008) is the creation of composite or chimerical taxa (SPRINGER ET AL. 2004; MALIA ET AL. 2003) to minimize missing data or taxa. For the single gene analyses [A] and [B] chimerical taxa are also constructed. MALIA ET AL. (2003) object that the construction of chimerical taxa is only acceptable if the combined taxa belong to a monophyletic group. This objection is expanded in this thesis and if possible only sequences of species of the same genus are combined. Of course the best solution would be to include only sequences from single species, but in some cases this is not to achieve and the use of chimerical taxa is to be favored over missing data. This is especially the case for smaller datasets comprising only few genes, as it is the case for analyses [A] and [B] of this study. For analysis [C] a different approach is chosen applying the software MARE. The choice and inclusion of genes and taxa depends here on the quality of the relative information content of each gene per taxon. 108
121 Molecular insights to crustacean phylogeny 4. Discussion Quality of the raw data (raw sequences) Contamination is always an omnipresent problem in molecular data. Even working very clean and focused in the molecular laboratory contaminations can easily occur. Thus, the first step should always be a BLAST analysis of the own sequences after receiving the sequenced nucleotide fragment to check for possible contamination. Especially using published sequences a BLAST analysis should ensure that the sequences are not contaminated. Though the problem of contamination is well known, only few studies (COLGAN ET AL. 2008; WÄGELE ET AL. 2009) reveal contamination of published sequences. A good example of a single gene phylogeny reconstruction biased by contamination is analysis [A] in which the sequences of Derocheilocaris (mystacocarid sequence no. 2) and Dyastilis are revealed as very likely contaminated. This example is described in chapter For the EST data the contamination problem is transferred to another dimension. The own EST projects included in the phylogenomic analysis pass an especially designed pipeline to detect vector sequences, poly-a tails and bacterial contamination, using a BLAST analysis (see figure 2.9). Contamination by other species is checked using the TGICL package. A check by eye or Blast2Blast procedures is not possible for EST libraries because of the large number of sequences. A problem remains using total RNA for EST data. If species of very small body size are used it is not possible to dissect tissue samples. This procedure would ensure that only tissue is used that is not contaminated by DNA/RNA of other organisms. The risk is high in the case of the digestive tract. For the samples of Polllicipes pollicipes and Triops cancriformis it was possible to prepare clean tissue. However for small specimens like the copepods whole specimens had to be fixed. Of the copepod Tigriopus californicus (average body size of 0.7 mm) about 7500 specimens were pooled. For that reason a special strain of cultured specimes was ordered to ensure that only one species is used for the cdna library reconstruction. Quality of the alignment (aligned sequences) Sequence alignment: The importance of sequence alignment and of a careful choice of alignment programs is clearly demonstrated with analysis [A]. The choice of the best, appropriate alignment software from a collection of over 50 MSA programs (NOTREDAME 2002; WALLACE ET AL. 2006) depends of course on the chosen molecular markers. It is generally believed that in most phylogenetic single gene studies a careful choice of genes makes the alignment problem less difficult (Wong et al. 2008), compared to genomic studies. In analysis [A] it is revealed that a difference in topology is the result using comparatively MAFFT or MUSCLE as alignment programs. But as demonstrated in the network reconstructions (prior to the phylogenetic reconstruction) for that analysis (figures ), the signal for the chosen (but commonly often used) 16S, 18S and COI markers is strongly eroded for deeper nodes. It can be reasoned here that if the resulting topologies of a dataset vary significantly using different alignment software, an accurate inspection of the signal within the dataset is demanded. If the signal is eroded, too many ambiguous trees can 109
122 4. Discussion Molecular insights to crustacean phylogeny be inferred despite the fact that they are extremely distant from the more realistic evolutionary tree. The author suggests to accomplish this procedure always as a standard routine by applying network reconstructions independently from the resulting topologies. Secondary structure guided sequence alignment: Most studies relying on rrna data use only fragments of the included rrna genes (DELL AMPIO ET AL. 2009; KJER 2004; MISOF ET AL. 2007; D HEASE 2002; GIRIBET ET AL. 2004; LUAN ET AL. 2005; EDGECOMB & GIRIBET 2002; KJER ET AL. 2006; YAMAGUCHI & ENDO 2003), while only few studies use nearly complete 18S and 28S rrna sequences (MALLATT & GIRIBET 2006; MALLATT ET AL. 2004; GAI ET AL. 2006). The results of analyses [A] reveal that much efforts need to be done for an optimal secondary structure constraint choice. Obviously this seems to be one crucial point for rrna studies that implement a secondary structure based alignment procedure relying on rrna fragments. If the constraint is not especially adapted it might be that too many positions have to be excluded while the aligning process is performed. Furthermore, for later phylogenetic analysis all stem positions have to be transformed in single, not paired positions if the corresponding, paired stem position is not present in the sequence fragment. That procedure is reducing the number of stem positions and might end in a chaotic condition of the mixed models, by non-convergence of many of the mixed model parameter values. In analysis [B] only completely sequenced 18S and 28S rrna genes are implemented to prevent biasing effects introduced by incomplete sequence fragments. Alignment processing and evaluation: Alignment errors that bias tree reconstructions attract attention in recent studies (DRESS ET AL. 2008; LÖYTYNOJA & GOLDMAN 2005; OGDEN & ROSENBERG 2006; WÄGELE & MAYER 2007; DRESS ET AL. 2008; WONG ET AL. 2008; MISOF & MISOF 2009; HARTMANN & VISION 2008). To avoid noise caused by ambiguous alignment positions an automated alignment evaluation is conducted with the software ALISCORE. The automated alignment processing and evaluation (see figure 2.6: single genes and figure 2.10: phylogenomic data) improves phylogenetic analyses by founding the phylogenetic reconstructions on data with a higher probability of positional homology. However, automated processes should always be used and handled with a suspicious mind. The software ALISCORE (MISOF & MISOF 2009) was revealed to improve the reliability of topologies by excluding ambiguous aligned positions in the alignments but it can be discussed why the resolution of the trees might decrease. This was especially the case for analysis [A]. For the author reliability of the resulting topologies based on identification of ambiguous alignment positions is always to prefer over an eventually better, but suspicious resolution. Manual alignment procedures (as described in 2.4.3), even following a constraint (like a secondary structure constraint) cannot guarantee an objective alignment based on positional homology. Indication for misalignment in the manually aligned dataset is the clustering of the mystacocarids. Anyhow, for analysis [A] the main problem was signal erosion of the chosen markers and not misalignment, which is demonstrated and discussed in previous sections. 110
123 Molecular insights to crustacean phylogeny 4. Discussion Quality of the signal in the aligned sequences networks versus trees: Several studies advise and promote the use of phylogenetic networks or split decomposition to infer alignment and data quality (BANDELT & DRESS 1992; HUSON & BRYANT 2006; WÄGELE & MAYER 2007). Also the estimation and visualization of conflicts in the alignment or between different genes (HUSON 1998; HOLLAND & MOULTON 2003; HOLLAND ET AL. 2004; WHITFIELD & KJER 2008; WÄGELE & MAYER 2007) is possible relying on these methods. These existing methods to estimate data or alignment quality are still insufficiently used in publications (WÄGELE ET AL. 2009). The extensive use and discussion of network reconstruction in the present analyses should have demonstrated that believing in bifurcation is a dangerous trap that can be avoided by using more objective software. Resolved trees are good, but reliable ones are better. To date network reconstruction is the only tool to make conflicts or eroded signal in the data visible. The software SAMS presented in WÄGELE & MAYER (2007) relying on split decomposition needs still some improvement. At the moment a graphical user interface is not available for this software, which makes the use very time consuming and not feasible for the included analyses. The task to build a graphical user interface is in progress (personal communication). Phylogenetic reconstruction aspects of modeling General aspects of complex modeling: All models and methods that are used in molecular phylogenetic analysis are approximations or simplifications of the processes of molecular evolution. Each phylogenetic estimation requires assumptions, which are made about the process that finally results in the observed dataset (KELCHNER & THOMAS 2007). These assumptions are the fundament for the applied model. The early substitution models used in phylogenetic analyses assume that the evolutionary process along lineages followes a constant rate and pictures a homogenous process (see review of: LIO & GOLDMAN 1998, but also: WHELAN ET AL. 2001B; FOSTER 2004; COX ET AL. 2008). It was soon discovered that this assumption is violating the real evolution of genes, which is very likely a heterogeneous process (LIO & GOLDMAN 1998; TARRIO ET AL. 2001; FOSTER 2004; GOWRI-SHANKAR & RATTRAY 2007; COX ET AL. 2008). In other words, the underlying assumption of most phylogenetic models that nucleotide or amino acid frequencies do not change over time along lineages and that rates are constant is not correct. There exists a compositional heterogeneity along the tree (FOSTER 2004; COX ET AL. 2008). A common opinion is that models only need to be good approximations of the reality (KELCHNER & THOMAS 2007) and that too complex models can also mislead the phylogenetic reconstruction. In some datasets compositional heterogeneity exists among lineages but the phylogenetic signal is strong and not in interference with compositional heterogeneity effects (FOSTER 2004). In these cases a simple model assuming compositional homogeneity can reconstruct a topology close to the true evolutionary tree and complex modeling is not necessary. 111
124 4. Discussion Molecular insights to crustacean phylogeny However, SULLIVAN & SWOFFORD (2001) discuss that the impact of parameters, which are violated in the model is important in subsequent tree reconstructions. A badly fitting model can sometimes more efficiently infer the correct tree. That is possible if the bias introduced by the model violations supports the reconstruction of the true tree rather than an incorrect one. The crux of the matter is that we normally do not know for empirical data if bias in the data increases or decreases the accuracy of the reconstruction, which is dependent on the model assumptions. For several published datasets misleading effects and biases evoked by compositional base heterogeneity are reported (TARRIO ET AL. 2000; TARRIO ET AL. 2001; Foster 2004; PHILIPPE ET AL. 2005B; GOWRI-SHANKAR & RATTRAY 2007; COX ET AL. 2008; DAVALOS & PERKINS 2008; FOSTER ET AL. 2009). Referring to those, an observed compositional base heterogeneity can compromise a phylogenetic reconstruction that relies only on simple, standard models. The best choice in that case is to implement timeheterogeneity in the model assumptions or to compare both approaches using a complex and a standard model, similar to analysis [B] in this thesis. Modeling for the single gene data: From the phylogenetic point of view the extremely sophisticated analysis [B] ends in a phylogeny below the author s expectations regarding a better resolution of crustacean phylogeny. However, as discussed and demonstrated, this is an important test case to identify the improvements of complex modeling considering compositional heterogeneity along the tree compared to standard procedures (REUMONT ET AL. 2009). The improvements and obvious artifacts evoked in standard methods relying on compositional homogeneity along the tree are underlined. Complex modeling is important. In this light, some often cited specific results of previous studies relying on rrna data (e.g. SPEARS & ABELE 1998; GIRIBET ET AL. 1996; GIRIBET & RIBERA 2000) obtain a different flavor for the interpretation of crustacean phylogeny. However, many processes of molecular sequence evolution are still not fully understood, like LBA (WÄGELE & MAYER 2007) and need further, more investigation. Especially for groups like Remipedia, Pentastomida and Myriapoda, it remains unclear which effects mislead the reconstruction in analysis [B]. Modeling and gene-choice for the phylogenomic data: The complex setting for analysis [B] is a test case for the influence of inhomogeneous base compositions. Regarding the phylogenomic data it is assumed that compositional heterogeneity along the tree influences phylogenetic reconstructions to a greater extent than previously assumed (JEFFROY ET AL. 2006). Implementing and developing heterogeneous modeling to protein data might be another point of eminent importance to avoid misleading reconstructions as demonstrated exemplarily for the rrna data. This is demonstrated by SEO & KISHINO (2008) for synonymous substitutions processes, see also WHELAN (2008). FOSTER ET AL. (2009) recently apply a new approach that employs composition heterogeneous-methods to consider for phylogenomic data compositional heterogeneity along the tree (they used two datasets, protein and rrna data). For the phylogenomic data an even more complicated situation exists regarding the choice of suitable genes. There is a consensus that at the moment the supermatrix approach is to be preferred over the supertree method (DE QUEIROZ 2006; SANDERSON & DRISKELL 2003, 112
125 Molecular insights to crustacean phylogeny 4. Discussion MISOF ET AL. submitted). However, so far the impact of chosen genes is not really understood. An enormous amount of different methods used to identify orthologous genes (e.g. ZHOU & LANDWEBER 2007; EBERSBERGER ET AL. 2009; SCHREIBER ET AL. 2009) is borne in the meantime, but the impact of single genes on the reconstructed topology remains in the darkness. This is unfortunately also the case for the present phylogenomic study. Handling phylogenomic data to date is like using a black box producing the final topology. With the presented MARE-approach (MISOF ET AL., in prep) a great step is made towards a more specific selection of genes, based on potential relative information content. Still demanded are tools that identify conflicts in the data and respectively between single genes. Identifying conflicting splits within the data respectively within the alignment will be an essential task. Tools like SAMS (WÄGELE & MAYER 2007) that can accomplish this need further development and adaptation to protein data. Proceeding the analyses for this thesis it was unsatisfying that working with such sophisticated settings and extensively enlarged datasets the computational power and the existing software is limited. Many aspects and interesting further questions of each analysis could not be addressed in detail for this reason and due to the time limitation. Crustacean phylogeny today not to recover with single gene data? Existing studies using single genes or rrna data show ambiguous and partly unresolved results for crustacean phylogeny as previously shown and discussed. It is one hope borne from the experience of the highly sophisticated rrna analysis presented in this thesis and REUMONT ET AL. (2009) to transfer this approach of complex modeling to phylogenomic data, as attempted in first studies in this field (FOSTER ET AL.2009). However, with new tools developed to identify contradicting signal it might turn out that in the evolutionary process of crustaceans for some groups the signal in sequence data is eroded. The best and most complex and sophisticated analysis is useless in that case. It might be speculated that this scenario will not change applying genomic approaches based on the sequence data. A totally new approach would be the search for patterns or phrases within the sequences, which would be used as single characters with higher complexity. The first studies of these word-orientated alignments (BEIKO ET AL. 2005; DIDIER ET AL. 2007) are promising. Eventually, this approach is one solution to recover the phylogeny of such old groups like crustaceans in which the signal might be eroded at the level of nucleotides. 113
126 4. Discussion Molecular insights to crustacean phylogeny 4.5 Conclusions and further aspects Synergistic collaboration for the future (taxa & genes) The author of the present thesis cannot avoid one sentence very common in most molecular studies, namely that more and further taxa should be included in future analyses. Unfortunately, at least for crustaceans and probably myriapods this is absolutely essential and demanded. Regarding the rrna study it would be interesting to extend taxon sampling to more species per group. Unfortunately the problematic taxa (Pentastomida, Cephalocarida, Remipedia) are very hard to sequence. Based on the revealed conflict in the data this might be using a cannon to kill a mosquito. Anyhow, a future collaboration with the MALLATT-laboratory (Washington State University, Washington) could be established and plans for an extensive further rrna analyses are sketched. As mentioned earlier, the existing phylogenomic data on crustaceans is recently summarized by STILLMAN ET AL. (2008) (see supplementary table S14). A clearly unbalanced batch of malacostracan EST sequences overbalances underrepresented non-malacostracan EST projects. Future plans are to collect Cephalocarida and Pentastomida to conduct pyrosequencing projects (Roche, 454 Titanium). The tissue of newly collected Mystacocarida is in preparation. 454 runs of Remipedia, Ostracoda and Leptostraca are in progress and were started while finishing the thesis. To include a broader and more even malacostracan sampling a cooperation with the JENNER group (Natural History Museum, London) is settled. Further development of phylogenomic data analysis and data quality assessment tools Just adding more and more taxa or genes is obviously not the way to improve future molecular studies (PHILIPPE ET AL. 2005), except to correct the unbalanced taxon sample as stated before). It seems more important to investigate the impact of different methods and strategies to analyze molecular data. The identification of conflicts and contradicting signal is one of the major topics in future analyses. A further aim is the identification of suitable marker genes using phylogenomic data. Eventually phylogenomic data brings one back to the point of single to multi gene analyses relying only on a few genes. Suitable genes can be identified with tools like MARE. This would be a strategy to identify promising molecular markers with less conflict revealing a clear phylogenetic signal. A step toward this direction is made within this thesis. In the so called primer toolbox specific DNA primers are constructed from EST data (single gene alignments) to amplify interesting, new marker genes. This enables one to sequence promising genes for rare species of which only few tissue exists without the need of an EST or pyrosequencing project. A similar approach is in parallel developed in the lab of CUNNINGHAM and coworkers ( but they amplify the genes with degenerated primers via mrna isolation and cdna 114
 but is very time consuming and not successful for all tested crustacean taxa.")
127 Molecular insights to crustacean phylogeny 4. Discussion generation (see REGIER ET AL. 2005; REGIER ET AL. 2008) instead directly from DNA. The approach in this thesis works for the crustaceans with one gene (rpl11b, a nuclear ribosomal protein) but is very time consuming and not successful for all tested crustacean taxa. Designing primers for such a heterogeneous group like the Crustacea demands an intensive work in the laboratory, for many major crustacean groups different specific primers have to bee designed. Also the settings for PCR reactions have to be changed between some crustaceans groups. The genes were chosen by hand, main criteria are the overlap with most arthropod and crustacean taxa and the existence of suitable conservative regions for the primer design. With a software like MARE the selection can be automated and based on potential information content of the chosen genes, which is much more promising and effective. The primer toolbox is tested and extended with several working groups, the author created a common platform to enable exchange of laboratory protocols and procedures (see figure 4.1). Figure 4.1: Primer toolbox platform. The open sourced internet homepage with diverse information of the, cooperating international working groups, included arthropod species and the laboratory protocols and procedures. Alignments of EST based genes are also to download. Also, a comparison of nucleotide vs. protein matrices could be promising. At the moment protein models are less understood. Site variability (LE ET AL. 2008; QUANG ET AL. 2008) and also time-heterogeneity (FOSTER ET AL. 2009) should be implemented. A comparison of both, nucleotide and protein sequence levels and the further development of protein models in combination with the software MARE (extended to these issue) would be a preferred strategy of the author. Working and collecting experience at the nucleotide level of phylogenomic data would additionally result in one advantage: It provides the basis for a different phylogenetic approach like the use of word orientated alignment procedures as previously mentioned (see BEIKO ET AL. 2005; DIDIER ET AL. 2007). 115
128 4. Discussion Molecular insights to crustacean phylogeny Towards a sophisticated total evidence analysis If the molecular analyses are grown in the direction that the best possible modeling is to apply a goal that is not yet achieved - combined total evidence analysis including morphological and fossil data would be a further final goal. But until this can be reached a lot needs to be done. 116
129 5. REFERENCES ABASCAL, F. (2005). ProtTest: selection of best-fit models of protein evolution. Bioinformatics 21, ABELE, L. G., KIM, W. & FELGENHAUER, B. E. (1989). Molecular evidence for inclusion of the phylum Pentastomida in the Crustacea. Molecular Biology and Evolution 6, ABELE, L. G., SPEARS, T., KIM, W. & APPLEGATE, M. (1992). Phylogeny of selected maxillopodan and other crustacean taxa based on 18S ribosomal nucleotide sequences: a preliminary analysis. Acta Zoologica (Stockholm) 73, ADACHI, J. & HASEGAWA, M. (1996). Model of amino acid substitution in proteins encoded by mitochondrial DNA. Journal of Molecular Evolution 42, ADAMS, M. D., KELLEY, J. M., GOCAYNE, J. D., DUBNICK, M., POLYMEROPOULOS, M. H., XIAO, H., MERRIL, C. R., WU, A., OLDE, B. & MORENO, R. F. (1991). Complementary DNA sequencing: expressed sequence tags and human genome project. Science 252, AGUINALDO, A. M., TURBEVILLE, J. M., LINFORD, L. S., RIVERA, M. C., GAREY, J. R., RAFF, R. A. & LAKE, J. A. (1997). Evidence for a clade of nematodes, arthropods and other moulting animals. Nature 387, AX, P. (1999). Das System der Metazoa II. Ein Lehrbuch der phylogenetischen Systematik. BABBIT, C. C. & PATEL, N. H. (2005). Relationships within the Pancrustacea: Examining the influence of additional malacostracan 18S and 28S rdna. In Crustacea and arthropod relationships (ed. S. Koenemann and R. A. Jenner). Taylor and Francis, London. BÄCKER, H., FANENBRUCK, M. & WÄGELE, J. W. (2008). A forgotten homology supporting the monophyly of Tracheata: The subcoxa of insects and myriapods re-visited. Zoologischer Anzeiger-A Journal of Comparative Zoology 247, BALLARD, J. W., OLSEN, G. J., FAITH, D. P., ODGERS, W. A., ROWELL, D. M. & ATKINSON, P. W. (1992). Evidence from 12S ribosomal RNA sequences that onychophorans are modified arthropods. Science 258, BAN, N., NISSEN, P., HANSEN, J., MOORE, P. B. & STEITZ, T. A. (2000). The complete atomic structure of the large ribosomal subunit at 2.4 Å Resolution. Science 289, BANDELT, H. J. & DRESS, A. W. (1992). Split decomposition: a new and useful approach to phylogenetic analysis of distance data. Molecular Phylogenetics and Evolution 1, BAURAIN, D., BRINKMANN, H. & PHILIPPE, H. (2007). Lack of Resolution in the Animal Phylogeny: Closely Spaced Cladogeneses or Undetected Systematic Errors? Molecular Biology and Evolution 24, 6-9. BEIKO, R., KEITH, J., HARLOW, T. & RAGAN, M. (2006). Searching for Convergence in Phylogenetic Markov Chain Monte Carlo. Systematic Biology 55, BEIKO, R. G., CHAN, C. X. & RAGAN, M. A. (2005). A word-oriented approach to alignment validation. Bioinformatics 21, BEKLEMISHEV, W. N. (1952). Principles of Comparative Anatomy of Invertebrates., 2nd edition Moscow: Nauka. BERGSTEN, J. (2005). A review of long-branch attraction. Cladistics 21, BININDA-EMONDS, O. (2004). The evolution of supertrees. Trends in Ecology & Evolution 19,
130 5. References Molecular insights to crustacean phylogeny BININDA-EMONDS, O. R. (2004). The evolution of supertrees. Trends in Ecology & Evolution (Amst) 19, BIRNEY, E., CLAMP, M. & DURBIN, R. (2004). GeneWise and Genomewise. Genome Research 14, BITSCH, C. & BITSCH, J. (2004). Phylogenetic relationships of basal hexapods among the mandibulate arthropods: a cladistic analysis based on comparative morphological characterscomparative morphological characters. Zoologica Scripta 33, BLANQUART, S. & LARTILLOT, N. (2006). A Bayesian compound stochastic process for modeling nonstationary and nonhomogeneous sequence evolution. Molecular Biology and Evolution 23, BLEIDORN, C., PODSIADLOWSKI, L., ZHONG, M., EECKHAUT, I., HARTMANN, S., HALANYCH, K. M. & TIEDEMANN, R. (2009). On the phylogenetic position of Myzostomida: Can 77 genes get it wrong? BMC Evolutionary Biology 9, 150. BOGUSKI, M. S. (1995). The turning point in genome research. Trends in Biochemical Sciences 20, BOORE, J. L., COLLINS, T. M., STANTON, D., DAEHLER, L. L. & BROWN, W. M. (1995). Deducing the pattern of arthropod phylogeny from mitochondrial DNA rearrangements. Nature 376, BOSCH, H. (1986). Experimental life-cycle studies of Raillietiella Sambon, 1910 (Pentastomida: Cephalobaenida): the fourth-stage larvae is infective for the definitive host. Parasitology Research 72, BOSCH, H. (1987). Vergleichende experimentelle Untersuchungen zur Biologie der Pentastomidengattungen Raillietiella (Cephalobaenida) und Elenia (Porocephalida) unter BerÜcksichtigung der Erforschungsgeschichte der Pentastomiden. Dissertation, Abteilung für Parasitologie des Instituts für Zoologie der Universität Hohenheim BOUCK, A. & VISION, T. (2007). The molecular ecologist's guide to expressed sequence tags. Molecular Ecology 16, BOUDREAUX, H. B. (1979). Arthropod phylogeny, with special reference to insects. Wiley, New York. BOURLAT, S. J., NIELSEN, C., ECONOMOU, A. & TELFORD, M. (2008). Testing the new animal phylogeny: A phylum level molecular analysis of the animal kingdom. Molecular Phylogenetics and Evolution 49, BOXSHALL, G. A. (1983). A comparative functionaly analysis of the major maxillopodan groups. Crustacean Issues 1, BOXSHALL, G. A. & HUYS, R. (1989). New tantulocarid, Stygotantulus stocki, parasitic on harpacticoid copepods, with an analysis of the phylogenetic relationships within Maxillopoda. Journal of Crustacean Biology 9, BRABAND, A., RICHTER, S., HIESEL, R. & SCHOLTZ, G. (2002). Phylogenetic relationships within the Phyllopoda (Crustacea, Branchiopoda) based on mitochondrial and nuclear markers. Molecular Phylogenetics and Evolution 25, BRENNEIS, G., UNGERER, P. & SCHOLTZ, G. (2008). The chelifores of sea spiders (Arthropoda, Pycnogonida) are the appendages of the deutocerebral segment. Evolution & Development 10, BRENNER, S. (1990). The human genome: the nature of the enterprise. Ciba Found Symp 149, 6-12; discussion BRINKMANN, H. & PHILIPPE, H. (2008). Animal phylogeny and large-scale sequencing: progress and pitfalls. Journal of Systematics and Evolution 46, BRINKMANN, H., VAN DER GIEZEN, M., ZHOU, Y., DE RAUCOURT, G. & PHILIPPE, H. 118
131 Molecular insights to crustacean phylogeny 5. References (2005). An Empirical Assessment of Long-Branch Attraction Artefacts in Deep Eukaryotic Phylogenomics. Systematic Biology 54, BROWN, J. & LEMMON, A. (2007). The Importance of Data Partitioning and the Utility of Bayes Factors in Bayesian Phylogenetics. Systematic Biology 56, BRUSCA, R. C. & BRUSCA, G. J. (1990). Invertebrates, first edition. Sinauer Associates. BRUSCA, R. C. & BRUSCA, G. J. (2003). Invertabrates, second edition. Sinauer Associates. BUCKLEY, T. R., SIMON, C., FLOOK, P. K. & MISOF, B. (2000). Secondary structure and conserved motifs of the frequently sequenced domains IV and V of the insect mitochondrial large subunit rrna gene. Insect Molecular Biology9, BUDD, G. E. (1996). Progress and problems in arthropod phylogeny. Trends in Ecology & Evolution 11, BUDD, G. E. (2001). Tardigrades as 'stem-group arthropods': the evidence from the Cambrian fauna. Zoologischer Anzeiger 240, BUDD, G. E. (2002). A palaeontological solution to the arthropod head problem. Nature 417, BUDD, G. E. & TELFORD, M. (2009). The origin and evolution of arthropods. Nature 457, BUHAY, J. E. (2009). "COI-like Sequences are Becoming Problematic in Molecular Systematic and DNA Barcoding Studies. Journal of Crustacean Biology 29, BURMESTER, T. (2001). Molecular evolution of the arthropod hemocyanin superfamily. Molecular Biology and Evolution 18, BURMESTER, T. (2002). Origin and evolution of arthropod hemocyanins and related proteins. Journal of Comparative Physiology B, Biochemical, Systemic and Environmental Physiology 172, CAMERON, S. L., MILLER, K. B., D'HAESE, C., WHITING, M. F. & BARKER, S. C. (2004). Mitochondrial genome data alone are not enough to unambiguously resolve the relationships of Entognatha, Insecta and Crustacea sensu lato (Arthropoda). Cladistics 20, CANNONE, J. J., SUBRAMANIAN, S., SCHNARE, M. N., COLLETT, J. R., D'SOUZA, L. M., DU, Y., FENG, B., LIN, N., MADABUSI, L. V., MÜLLER, K. M., PANDE, N., SHANG, Z., YU, N. & GUTELL, R. R. (2002). The comparative RNA web (CRW) site: an online database of comparative sequence and structure information for ribosomal, intron, and other RNAs. BMC Bioinformatics 3, 2. CARAPELLI, A., LIÒ, P., NARDI, F., VAN DER WATH, E. & FRATI, F. (2007). Phylogenetic analysis of mitochondrial protein coding genes confirms the reciprocal paraphyly of Hexapoda and Crustacea. BMC Evolutionary Biology 7, CARAPELLI, A., NARDI, F., DALLAI, R., BOORE, J., LìO, P. & FRATI, F. (2005). Relationships between hexapods and crustaceans based on four mitochondrial genes. In Crustacea and arthropod relationships (ed. S. Koenemann and R. A. Jenner), pp Taylor and Francis, CRC press, Boca Raton. CASTRESANA, J. (2000). Selection of conserved blocks from multiple alignments for their use in phylogenetic analysis. Molecular Biology and Evolution 17, CHOU, H. & HOLMES, M. H. (2001). DNA sequence quality trimming and vector removal. Bioinformatics 17, CISNE, J. L. (1974). Evolution of the world fauna of aquatic free-living arhtropods. Evolution 28, COBBETT, A., WILKINSON, M. & WILLS, M. A. (2007). Fossils impact as hard as living taxa in parsimony analyses of morphology. Systematic Biology 56,
132 5. References Molecular insights to crustacean phylogeny COHEN, A. C., MARTIN, J. W. & KORNICKER, L. S. (1998). Homology of holocene ostracode biramous appendages wiith those of other crustaceans: the protopod, epipod, exopod and endopos. Lethaia 31, COLGAN, D., HUTCHINGS, P. & BEACHAM, E. (2008). Multi-Gene Analyses of the Phylogenetic Relationships among the Mollusca, Annelida, and Arthropoda. Zoological Studies 47, COOK, C., YUE, Q. & AKAM, M. (2005). Mitochondrial genomes suggest that hexapods and crustaceans are mutually paraphyletic. Proceedings of the Royal Society B: Biological Sciences 272, COX, C., FOSTER, P., HIRT, R., HARRIS, S. R. & EMBLEY, T. M. (2008). The archaebacterial origin of eukaryotes. Proceedings of the national Academy of Sciences, USA105, D'HAESE, C. (2002). Were the first springtails semi-aquatic? A phylogenetic approach by means of 28S rdna and optimization alignment. Proceedings of the Royal Society B: Biological Sciences 269, DAHL, E. (1956). Some crustacean relationships. Zoological Institute, Lund. DAHL, E. (1963). Main evolutionary lines among recent Crustacea. In Phylogeny and Evolution of Crustacea (ed. H. B. Whittington and W. D. I. Rolfe), pp Museum of Comparative Zoology, Cambridge. DÁVALOS, L. M. & PERKINS, S. L. (2008). Saturation and base composition bias explain phylogenomic conflict in Plasmodium. Genomics 91, DAYHOFF, M. O., SCHWARTZ, R. M. & ORCUTT, B. C. (1978). A model for evolutionary change in proteins. In Collection, pp DE OLIVEIRA ALMEIDA, W., CHRISTOFFERSEN, M. L., SOUSA AMORIN, D. & COSTA ELOY, E. C. (2008). Morphological support for the phylogenetic positioning of Pentastomida and related fossils. Revista Biotemas 3, DE QUEIROZ, A. & GATESY, J. (2006). The supermatrix approach to systematics. Trends in Ecology & Evolution (Amst) 22, DE RIJK, P., WUYTS, J., VAN DE PEER, Y. & WINKELMANS, T. (2000). The European large subunit ribosomal RNA database. Nucleic Acids Research 28, DELL'AMPIO, E., SZUCSICH, N., CARAPELLI, A., FRATI, F., STEINER, G., STEINACHER, A. & PASS, G. (2009). Testing for misleading effects in the phylogenetic reconstruction of ancient lineages of hexapods: influence of character dependence and character choice in analyses of 28S rrna sequences. Zoologica Scripta 38, DELSUC, F., BRINKMANN, H. & PHILIPPE, H. (2005). Phylogenomics and the reconstruction of the tree of life. Nat Rev Genet 6, DELSUC, F., PHILLIPS, M. J. & PENNY, D. (2003). Comment on "Hexapod origins: monophyletic or paraphyletic?. Science 301, DELSUC, F., TSAGKOGEORGA, G., LARTILLOT, N. & PHILIPPE, H. (2008). Additional molecular support for the new chordate phylogeny. Genesis 46, DEWAARD, J., SACHEROVA, V., CRISTESCU, M., REMIGIO, E., CREASE, T. & HEBERT, P. (2006). Probing the relationships of the branchiopod crustaceans. Molecular Phylogenetics and Evolution 39, DIDIER, G., DEBOMY, L., PUPIN, M., ZHANG, M., GROSSMANN, A., DEVAUCHELLE, C. & LAPREVOTTE, I. (2007). Comparing sequences without using alignments: application to HIV/SIV subtyping. BMC Bioinformatics 8, 1. DOHLE, W. (2001). Are the insects terrestrial crustaceans? A discussion of some new facts and arguments and the proposal of the proper name "Tetraconata"' for the 120
133 Molecular insights to crustacean phylogeny 5. References monophyletic unit Crustacea + Hexapoda. Annales de la Societe Entomologique de France (New Series) 37, DRESS, A. W., FLAMM, C., FRITZSCH, G., GRÜNEWALD, S., KRUSPE, M., PROHASKA, S. J. & STADLER, P. F. (2008). Noisy: identification of problematic columns in multiple sequence alignments. Algorithms for Molecular Biology: 3, 7. DRUMMOND, A. J. & RAMBAUT, A. (2007). BEAST: Bayesian evolutionary analysis by sampling trees. BMC Evolutionary Biology 7, 214. DUNGER, W. (1993). Überklasse Antennata. In Lehrbuch der speziellen Zoologie, vol. I Wirbellose Tiere (ed. H.-E. Gruner, M. Moritz and W. Dunger), pp Gustav Fischer Verlag, Jena. DUNLOP, J. A. (2005). New ideas about the euchelicerate stem-lineage. European Arachnology, DUNLOP, J. A. & ARANGO, C. P. (2005). Pycnogonid affinities: a review. Journal of Zoological Systematics and Evolutionary Research 43, DUNN, C., HEJNOL, A., MATUS, D., PANG, K., BROWNE, W., SMITH, S., SEAVER, E., ROUSE, G., OBST, M., EDGECOMBE, G., SØRENSEN, M., HADDOCK, S. H., SCHMIDT-RHAESA, A., OKUSU, A., KRISTENSEN, R., WHEELER, W., MARTINDALE, M. & GIRIBET, G. (2008). Broad phylogenomic sampling improves resolution of the animal tree of life. Nature 452, EBERSBERGER, I., STRAUSS, S. & VON HAESELER, A. (2009). HamsTr: Profile Hidden markov Model Based Search for Orthologs in ESTs. BMC Evolutionary Biology 9, 1-9. EDGAR, R. C. (2004a). MUSCLE: a multiple sequence alignment method with reduced time and space complexity. BMC Bioinformatics 5, EDGAR, R. C. (2004b). MUSCLE: multiple sequence alignment with high accuracy and high throughput. Nucleic Acids Research 32, EDGECOMBE, G. (2000). Arthropod Cladistics: Combined Analysis of Histone H3 and U2 snrna Sequences and Morphology. Cladistics 16, EDGECOMBE, G. (2009). Palaeontological and Molecular Evidence Linking Arthropods, Onychophorans, and other Ecdysozoa. Evolution: Education and Outreach 2, EDGECOMBE, G. & GIRIBET, G. (2002). Myriapod phylogeny and the relationships of Chilopoda. Collection, vol. III, pp EDGECOMBE, G. D. (2004). Morphological data, extant Myriapoda, and the myriapod stemgroup. Contibutions to Zoology 73, EISEN, J. A. (1998). Phylogenomics: improving functional predictions for uncharacterized genes by evolutionary analysis. Genome Research 8, EMERSON, M. J. & SCHRAM, F. (1991). Remipedia; part II, Palaeontology. Proceedings of the San Diego Soiety of Natural History 7, ERTAS, B., V REUMONT, B. M., WÄGELE, J. W., MISOF, B., BURMESTER, T. (2009). Hemocyanin suggests a close relationship of Remipedia and Hexapoda. Molecular Biology and Evolution, doi: /molbev/msp186 (advanced access). FANENBRUCK, M. (2003). Die Anatomie des Kopfes und des cephalen Skelett-Muskelsystems der Crustacea, Myriapoda und Hexapoda: Ein Beitrag zum phylogenetischen System der Mandibulata und zur Kenntnis der Herkunft der Remipedia und Tracheata, Ruhr Universität Bochum. FANENBRUCK, M. & HARZSCH, S. (2005). A brain atlas of Godzillognomus frondosus Yager, 1989 (Remipedia, Godzilliidae) and comparison with the brain of Yager, 1987 (Remipedia, Speleonectidae): implications for arthropod relationships. Arthropod Structure & Development 34,
134 5. References Molecular insights to crustacean phylogeny FANENBRUCK, M., HARZSCH, S. & WÄGELE, J. W. (2004). The brain of the Remipedia (Crustacea) and an alternative hypothesis on their phylogenetic relationships. Proceedings of the national Academy of Sciences, USA 101, FELSENSTEIN, J. (1978). Cases in which Parsimony or Compatibility Methods Will be Positively Misleading. Systematic Zoology 27, FELSENSTEIN, J. (1988). Phylogenies from molecular sequences: inference and reliability. Annual Review of Genetics 22, FITCH, W. M. (1970). Further improvements in the method of testing for evolutionary homology among proteins. Journal of Molecular Biology 49, FITCH, W. M. (2000). Homology a personal view on some of the problems. Trends in Genetics 16, FORTEY, R. A., THOMAS, R. H. & (EDS). (1998). Arthropod relationships. Chapman and Hall, London. FOSTER, P. (2004). Modeling Compositional Heterogeneity. Systematic Biology 53, FOSTER, P., COX, C. & EMBLEY, T. (2009). The primary divisions of life: a phylogenomic approach employing composition-heterogeneous methods. Philosophical Transactions of the Royal Society B: Biological Sciences 364, FOX, G. E. & WOESE, C. R. (1975). The architecture of 5S rrna and its relation to function. Journal of Molecular Evolution 6, FRIEDRICH, M. & TAUTZ, D. (1995). Ribosomal DNA phylogeny of the major extant arthropod classes and the evolution of myriapods. Nature 376, FRIEDRICH, M. & TAUTZ, D. (1997). An episodic change of rdna nucleotide substitution rate has occurred during the emergence of the insect order Diptera. Molecular Biology and Evolution 14, FRIEDRICH, M. & TAUTZ, D. (2001). Arthropod rdna phylogeny revisited: A consistency analysis using Monte Carlo simulation. Ann Soc Entomol Fr (New Series) 37, GAI, Y., SONG, D., SUN, H. & ZHOU, K. (2006). Myriapod Monophyly and Relationships Among Myriapod Classes Based on Nearly Complete 28S and 18S rdna Sequences. Zoo Sci 23, GALTIER, N. (2004). Sampling Properties of the Bootstrap Support in Molecular Phylogeny: Influence of Nonindependence Among Sites. Systematic Biology 53, GALTIER, N. & GOUY, M. (1995). Inferring phylogenies from DNA sequences of unequal base compositions. Proceedings of the national Academy of Sciences, USA 92, GARCíA-MACHADO, E., PEMPERA, M., DENNEBOUY, N., OLIVA-SUAREZ, M., MOUNOLOU, J. C. & MONNEROT, M. (1999). Mitochondrial genes collectively suggest the paraphyly of Crustacea with respect to Insecta. Journal of Molecular Evolution 49, GERHOLD, D. & CASKEY, C. T. (1996). It's the genes! EST access to human genome content. Bioessays 18, GILLESPIE, J. (2005). A Secondary Structural Model of the 28S rrna Expansion Segments D2 and D3 for Chalcidoid Wasps (Hymenoptera: Chalcidoidea). Molecular Biology and Evolution 22, GILLESPIE, J., JOHNSTON, J. S., CANNONE, J. J. & GUTELL, R. R. (2006). Characteristics of the nuclear (18S, 5.8S, 28S and 5S) and mitochondrial (12S and 16S) rrna genes of Apis mellifera (Insecta : Hymenoptera): structure, organization, and retrotransposable elements. Insect Molecular Biology 15, GIRIBET, G. (2008). Assembling the lophotrochozoan (=spiralian) tree of life. Philosophical Transactions of the Royal Society B, Biological Science 363,
135 Molecular insights to crustacean phylogeny 5. References GIRIBET, G., CARRANZA, S., BAGUNA, J., RIUTORT, M. & RIBERA, C. (1996). First molecular evidence for the existence of a Tardigrada plus arthropoda clade. Molecular Biology and Evolution 13, GIRIBET, G., EDGECOMB, G. D., CARPENTER, J. M., D'HAESE, C. & WHEELER, W. C. (2004). Is Ellipura monophyletic? A combined analysis of basal hexapod relationships with emphasis on the origin of insects. Organisms Diversity & Evolution 4, GIRIBET, G., EDGECOMBE, G. D. & WHEELER, W. C. (2001). Arthropod phylogeny based on eight molecular loci and morphology. Nature 413, GIRIBET, G. & RIBERA, C. (2000). A review of arthropod phylogeny: New data based on ribosomal DNA sequences and direct character optimization. Cladistics 16, GIRIBET, G., RICHTER, S., EDGECOMBE, G. D. & WHEELER, W. C. (2005). The position of crustaceans within the Arthropoda - evidence from nine molecular loci and morphology. In Crustacea and arthropod relationships (ed. S. Koenemann and R. A. Jenner). Taylor and Francis, CRC press, Boca Raton. GLENNER, H. & HEBSGAARD, M. B. (2006). Phylogeny and evolution of life history strategies of the parasitic barnacles (Crustacea, Cirripedia, Rhizocephala). Molecular Phylogenetics and Evolution 41, GLENNER, H., THOMSEN, P., HEBSGAARD, M., SORENSEN, M. & WILLERSLEV, E. (2006). EVOLUTION: The Origin of Insects. Science 314, GOWRI-SHANKAR, V. & JOW, H. (2006). PHASE: a software package for Phylogenetics And Sequence Evolution. In manual. GOWRI-SHANKAR, V. & RATTRAY, M. (2006). On the correlation between composition and site-specific evolutionary rate: implications for phylogenetic inference. Molecular Biology and Evolution 23, GOWRI-SHANKAR, V. & RATTRAY, M. (2007). A Reversible Jump Method for Bayesian Phylogenetic Inference with a Nonhomogeneous Substitution Model. Molecular Biology and Evolution 24, GRYGIER, M. (1983). Ascothoracida and the unity of Maxillopoda. In Crustacean Phylogeny, vol. 1 Crustacean Issues (ed. F. R. Schram). A.A. Balkema, Rotterdam. GRYGIER, M. (1987). New records, external and internal anatomy, and systematic position of Hansen's Y-larvae(Crustacea, Maxillopoda, Facetotecta). Sarsia 72, GUTELL, R. R., LEE, J. C. & CANNONE, J. J. (2002). The accuracy of ribosomal RNA comparative structure models. Current Opinion in Structural Biology 12, HAECKEL, E. H. P. A. (1866). Generelle Morphologie der Organismen: allgemeine GrundzÜge derr organischen Formen-Wissenschaft, mechanisch begründet durch die von Charles Darwin reformierte Descendenz-Theorie. Georg Reimer, Berlin. HAGNER-HOLLER, S., SCHOEN, A., ERKER, W., MARDEN, J., RUPPRECHT, R., DECKER, H. & BURMESTER, T. (2004). A respiratory hemocyanin from an insect. Proceedings of the national Academy of Sciences, USA 101, HALL, T. A. (1999). Bioedit: a user-friendly biological sequence alignment editor and anaylses program for Windos 95/98/NT. Nucleic Acids Symposium Series 41, HANCOCK, J. M., TAUTZ, D. & DOVER, G. A. (1988). Evolution of the secondary structures and compensatory mutations of the ribosomal RNAs of Drosophila melanogaster. Molecular Biology and Evolution 5, HARTMANN, S. & VISION, T. J. (2008). Using ESTs for phylogenomics: Can one accurately infer a phylogenetic tree from a gappy alignment? In BMC Evolutionary Biology, vol. 8, pp. 95. HARZSCH, S. (2004). Phylogenetic comparison of serotonin-immunoreactive neurons in 123
136 5. References Molecular insights to crustacean phylogeny representatives of the Chilopoda, Diplopoda, and Chelicerata: Implications for arthropod relationships. Journal of Morphology 259, HARZSCH, S. (2006). Neurophylogeny: Architecture of the nervous system and a fresh view on arthropod phyologeny. Integrative and Comparative Biology 46, HARZSCH, S., MÜLLER, C. & WOLF, H. (2005). From variable to constant cell numbers: cellular characteristics of the arthropod nervous system argue against a sister-group relationship of Chelicerata and?myriapoda? but favour the Mandibulata concept. Development, Genes and Evolution 215, HARZSCH, S., VILPOUX, K., BLACKBURN, D., PLATCHETZKI, D., BROWN, N., MELZER, R., KEMPLER, K. & BATTELLE, B. (2006). Evolution of arthropod visual systems: Development of the eyes and central visual pathways in the horseshoe crablimulus polyphemus Linnaeus, 1758 (Chelicerata, Xiphosura). Developmental Dynamics 235, HASSANIN, A. (2006). Phylogeny of Arthropoda inferred from mitochondrial sequences: strategies for limiting the misleading effects of multiple changes in pattern and rates of substitution. Molecular Phylogenetics and Evolution 38, HASSANIN, A., LEGER, N. & DEUTSCH, J. (2005). Evidence for Multiple Reversals of Asymmetric Mutational Constraints during the Evolution of the Mitochondrial Genome of Metazoa, and Consequences for Phylogenetic Inferences. Systematic Biology 54, HAUG, J. T., (2009). Arthropod ontogeny fossil record of development and 4-dimensional data (morphologtical changes during ontogeny) in phylogenetic systematics. Dissertation, Biosystematische Dokumentation, Universität Ulm. HEATH, T. A., HEDTKE, S. M. & HILLIS, D. M. (2008). Taxon sampling and the accuracy of phylogenetic analyses. Journal of Systematics and Evolution 46, HENDY, M. & PENNY, D. (1989). A framework for the quantitative study of evolutionary trees. Systematic Zoology 38, HENNIG, W. (1969). Die Stammesgeschichte der Insekten, Frankfurt a. M. HESSLER, R. (1982). The structural morphology of walking mechanisms in eumalacostracan crustaceans. Philosophical Transactions of the Royal Society B 296, HESSLER, R. (1992). Reflections on the phylogenetic position of the Cephalocarida. Acta Zoologica (Stockholm). HESSLER, R. & NEWMAN, W. (1975). A trilobitomorph origin for the Crustacea. Fossils and Strata 4. HEYMONDS, R. (1901). Die Entwicklungsgeschichte derr Scolopender. Zoological Studies 33, HICKSON, R. E., SIMON, C. & PERREY, S. W. (2000). The performance of several multiplesequence alignment programs in relation to secondary-structure features for an rrna sequence. Molecular Biology and Evolution 17, HIGGINS, R. P. & THIEL, H. (1988). Introducton to the study of Meiofauna. Smithonian Institution Press, Washington, D.C. HOLLAND, B. & MOULTON, V. (2003). Consensus networks: A Method for Visualising Incompatibilities in Collections of Trees. Springer Berlin / Heidelberg. HOLLAND, B. R., HUBER, K. T., MOULTON, V. & LOCKHART, P. J. (2004). Using Consensus Networks to Visualize Contradictory Evidence for Species Phylogeny. Molecular Biology and Evolution 21, HOLTHUIS, L. B. (1973). Caridean Shrimps Found in Land-locked Saltwater Pools at Four Indo-West Pacific localities (Sinai Peninsula, Funafuti Atoll, Maui and Hawaii Islands), 124
137 Molecular insights to crustacean phylogeny 5. References with the description of one new genus and four new species. Brill. HOMBERG, U. (2008). Evolution of the central complex in the arthropod brain with respect to the visual system. Arthropod Structure & Development 37, HORNE, D. J., SCHÖN, I., SMITH, R. J. & MARTENS, C. (2005). What are Ostracoda? A cladistic analysis of the extant superfamilies of the subclasses Myodocopa and Podocopa (Crustacea: Ostracoda). In Crustacea and Arthropod Relationships (ed. S. Koenemann and R. A. Jenner), pp Taylor and Francis CRC PRess, Boca Raton. HØEG, J. T., ACHITUV, Y., CHAN, B. K., CHAN, K., JENSEN, P. G. & PÉREZ-LOSADA, M. (2009). Cypris morphology in the barnacles Ibla and Paralepas (Crustacea: Cirripedia Thoracica) implications for cirripede evolution. Journal of Morphology 270, HØEG, J. T. & KOLBASOV, G. A. (2002). Lattice organs in y-cyprids of the Facetotecta and their significance in the phylogeny of the Crustacea Thecostraca. Acta Zoologica 83, HØEG, J. T., LARSON, N. C. & GLENNER, H. (2004). The complete cypris larva and its significance in thecostracan phylogeny. In Evolutionary Developmental Biology of Crustacea, vol. 15 Crustacean Issues (ed. G. Scholtz), pp HUDSON, M. E. (2008). Sequencing breakthroughs for genomic ecology and evolutionary biology. Molecular Ecology Resources 8, HUELSENBECK, J. P. & RONQUIST, F. (2001). MRBAYES: Bayesian inference of phylogenetic trees. Bioinformatics 17, HUGHES, J., LONGHORN, S. J., PAPADOPOULOU, A., THEODORIDES, K., DE RIVA, A., MEJIA-CHANG, M., FOSTER, P. & VOGLER, A. (2006). Dense taxonomic EST sampling and its applications for molecular systematics of the Coleoptera (beetles). Molecular Biology and Evolution 23, HUGHES, N., HAUG, J. & WALOSZEK, D. (2008). Basal euarthropod development: a fossilbased perspective. In Evolutionary Pathways: Key Themes in Evolutionary Developmental Biology (ed. A. Minelli and G. Fusco). Cambridge University Press. HUSON, D. H. (1998). SplitsTree: analyzing and visualizing evolutionary data. Bioinformatics 14, HUSON, D. H. & BRYANT, D. (2006). Application of phylogenetic networks in evolutionary studies. Molecular Biology and Evolution 23, HUSON, D. H., KLOEPPER, T., LOCKHART, P. J. & STEEL, M. (2005). Reconstruction of reticulate networks from gene trees. In Ninth International Conference on Research in Computational Molecular Biology. Proceedings of the Ninth International Conference on Research in Computational Molecular Biology (ed. S. Miyano). HWANG, U. W., FRIEDRICH, M., TAUTZ, D., PARK, C. J. & KIM, W. (2001). Mitochondrial protein phylogeny joins myriapods with chelicerates. Nature 413, ILIFFE, T. M. (1992a). Anchialine Cave Biology. The Natural History of Biospeleology, 24. ILIFFE, T. M. (1992b). An annotated list of the troglobitic anchialine and freshwater fauna of Quintana Roo. Diversidad Biologica en la Reserva de la Biosfera de Sian ka#an Quintana Roo, Mexico II, 20. ILIFFE, T. M. & SARBU, S. (1990). Anchialine Caves and Cave fauna of the South Pacific. NSS, JEFFROY, O., BRINKMANN, H., DELSUC, F. & PHILIPPE, H. (2006). Phylogenomics: the beginning of incongruence? Trends in Genetics 22, JENNER, R. A. & LITTLEWOOD, D. T. J. (2008). Problematica old and new. Philosophical Transactions of the Royal Society B 363,
138 5. References Molecular insights to crustacean phylogeny JENNER, R. A., Ní DHUBHGHAILL, C., FERLA, M. P. & WILLS, M. A. (2009). Eumalacostracan phylogeny and total evidence: limitations of the usual suspects. BMC Evolutionary Biology 9, 21. JENSEN, P. G., MOYSE, J., HØEG, J. & AL-YAHYA, H. (1994). Comparative SEM studies of lattice organs: Putative sensory structures on the carapace of larvae from Ascothoracida and Cirripedia (Crustacea Maxillopoda Thecostraca). Acta Zoologica 75, JERMIIN, L. S., HO, S. Y., ABABNEH, F., ROBINSON, J. & LARKUM, A. W. D. (2004). The biasing effect of compositional heterogeneity on phylogenetic estimates may be underestimated. Systematic Biology 53, JONES, D. T., TAYLOR, W. R. & THORNTON, J. M. (1992). The rapid generation of mutation data matrices from protein sequences. Computer Applications in the Biosciences 8, JONGENEEL, C. V. (2000). Searching the expressed sequence tag (EST) databases: panning for genes. Briefings in Bioinformatics 1, JORDAL, B., GILLESPIE, J. J. & COGNATO, A. I. (2008). Secondary structure alignment and direct optimization of 28S rdna sequences provide limited phylogenetic resolution in bark and ambrosia beetles (Curculionidae: Scolytinae). Zoologica Scripta 37, JOW, H., HUDELOT, C., RATTRAY, M. & HIGGS, P. G. (2002). Bayesian phylogenetics using an RNA substitution model applied to early mammalian evolution. Molecular Biology and Evolution 19, JURKA, J., KAPITONOV, V. V., PAVLICEK, A., KLONOWSKI, P., KOHANY, O. & WALICHIEWICZ, J. (2005). Repbase update, a database of eukaryotic repetitive elements. Cytogenet Genome Research 110, KASS, R. E. & RAFTERY, A. E. (1993). Bayes Factors and model unceratinty. Technical Report 254, 73. KASS, R. E. & RAFTERY, A. E. (1995). Bayes Factors. Journal of the American Statistical Association 90, KATOH, K., MISAWA, K., KUMA, K. & MIYATA, T. (2002). MAFFT: a novel method for rapid multiple sequence alignment based on fast Fourier transform. Nucleic Acids Research 30, KATOH, K. & TOH, H. (2008). Recent developments in the MAFFT multiple sequence alignment program. Briefings in Bioinformatics 9, KELCHNER, S. & THOMAS, M. (2007). Model use in phylogenetics: nine key questions. Trends in Ecology & Evolution 22, KILPERT, F. & PODSIADLOWSKI, L. (2006). The complete mitochondrial genome of the common sea slater, Ligia oceanica (Crustacea, Isopoda) bears a novel gene order and unusual control region features. BMC Genomics 7, 241. KIM, S., KANG, J., CHUNG, Y. J., LI, J. & RYU, K. H. (2008). Clustering orthologous proteins across phylogenetically distant species. Proteins 71, KJER, K. (2004). Aligned 18S and Insect Phylogeny. Systematic Biology 53, KJER, K., GILLESPIE, J. J. & OBER, K. A. (2007). Opinions on Multiple Sequence Alignment, and an Empirical Comparison of Repeatability and Accuracy between POY and structural alignment. Systematic Biology 56, KJER, K. M. (1995). Use of rrna secondary structure in phylogenetic studies to identify homologous positions: an example of alignment and data presentation from the frogs. Molecular Phylogenetics and Evolution 4, KJER, K. M., CARLE, F. L., LITMAN, J. & WARE, J. (2006). A Molecular Phylogeny of 126
139 Molecular insights to crustacean phylogeny 5. References Hexapoda. Arthropod Systematics & Phylogeny 64, KLUGE, A. G. (1989). A concern for evidence and a phylogenetic hypotheis of relationships among epicrates (Boidae, serpentes). Systematic Zoology 38, KOENEMANN, S., ILIFFE, T. M. & VAN DER HAM, J. (2003). Three new sympatric species of Remipedia (Crustacea) from Great Exuma Island, Bahamas Islands. Contributions to Zoology 72, KOENEMANN, S., SCHRAM, F. R., ILIFFE, T. & HINDERSTEIN, L. M. (2007). Behavior of Remipedia in the laboratory, with suppoting field observations. Journal of Crustacean Biology 27, KOONIN, E. (2005). Orthologs, paralogs and evolutionary genomics. Annual Review of Genetics 39, KRISTENSEN, N. P. (1998). The groundplan and basal diversification of the hexapods. In Arthropod Relationships (ed. R. A. Fortey and R. H. Thomas), pp Chapman and Hall, London. KUKALOVÁ-PECK, J. (1998). Arthropod phylogeny and 'basal' morphological structures. In Arthropod Relationships (ed. R. A. Fortey and R. H. Thomas), pp Chapman and Hall, London. KUMAR, S. & FILIPSKI, A. (2007). Multiple sequence alignment: In pursuit of homologous DNA positions. Genome Research 17, KUSCHE, K. & BURMESTER, T. (2001). Diplopod hemocyanin sequence and the phylogenetic position of the Myriapoda. Molecular Biology and Evolution 18, KUSCHE, K., RUHBERG, H. & BURMESTER, T. (2002). A hemocyanin from the Onychophora and the emergence of respiratory proteins. Proceedings of the national Academy of Sciences, USA 99, LANKESTER, E. R. (1904). the structure and classification of the Arthropoda. Microscopical Society (London), Quaterly Journal 47, LARKIN, M. A., BLACKSHIELDS, G., BROWN, N. P., CHENNA, R., MCGETTIGAN, P. A., MCWILLIAM, H., VALENTIN, F., WALLACE, I. M., WILM, A., LOPEZ, R., THOMPSON, J. D., GIBSON, T. J. & HIGGINS, D. G. (2007). Clustal W and Clustal X version 2.0. Bioinformatics 23, LARTILLOT, N., BRINKMANN, H. & LEPAGE, T. (2007b). Phylobyes 2.3.c manual. LARTILLOT, N., BRINKMANN, H. & PHILIPPE, H. (2007a). Suppression of long-branch attraction artefacts in the animal phylogeny using a site-heterogeneous model. BMC Evolutionary Biology 7, LARTILLOT, N. & PHILIPPE, H. (2004). A Bayesian mixture model for across-site heterogeneities in the amino-acid replacement process. Molecular Biology and Evolution 21, LARTILLOT, N. & PHILIPPE, H. (2008). Improvement of molecular phylogenetic inference and the phylogeny of Bilateria. Philosophical Transactions of the Royal Society B, Biological Science 363, LATREILLE, P. A. (1817). Les crustaces, les arachnides et les insectes., Paris. LAUTERBACH, K. E. (1983). Zum Problem derr Monophylie der Crustacea. Verh. naturwiss. Ver. Hamburg 26, LAUTERBACH, K. E. (1986). Zum Grundplan der Crustacea. Verh. naturwiss. Ver., Hamburg (N.F.) 28, LAVROV, D., BROWN, W. & BOORE, J. (2004). Phylogenetic position of the Pentastomida and (pan)crustacean relationships. Proceedings of the Royal Society B: Biological Sciences 271,
140 5. References Molecular insights to crustacean phylogeny LE, S. Q., LARTILLOT, N. & GASCUEL, O. (2008). Phylogenetic mixture models for proteins. Philosophical Transactions of the Royal Society B, Biological Science 363, LIM, J. T. & HWANG, U. W. (2006). The complete mitochondrial genome of Pollicipes mitella (Crustacea, Maxillopoda, Cirripedia): non-monophylies of maxillopoda and crustacea. Molecules and Cells 22, LIÒ, P. & GOLDMAN, N. (1998). Models of molecular evolution and phylogeny. Genome Research 8, LOESEL, R. (2005). The arthropod brain: retracing six hundred million years of evolution. Arthropod Structure & Development 34, LÖYTYNOJA, A. & GOLDMAN, N. (2005). An algorithm for progressive multiple alignment of sequences with insertions. Proceedings of the national Academy of Sciences, USA 102, LUAN, Y., MALLATT, J., XIE, R., YANG, J. M. & YIN, W. (2005). The Phylogenetic Positions of Three Basal-Hexapod Groups (Protura, Diplura, and Collembola) Based on Ribosomal RNA Gene Sequences. Molecular Biology and Evolution 22, MAAS, A. & WALOSZEK, D. (2001). Cambrian Derivatives of the Early Arthropod Stem Lineage, Pentastomids, Tardigrades and Lobopodians An Orsten Perspective. Zoologischer Anzeiger-A 240, MAAS, A. & WALOSZEK, D. (2005). Phosphatocopina ostracode-like sister group of Eucrustacea. Hydrobiologia 538, MADSEN, O., SCALLY, M., DOUADY, C. J., KAO, D. J., DEBRY, R. W., ADKINS, R., AMRINE, H. M., STANHOPE, M. J., DE JONG, W. W. & SPRINGER, M. S. (2001). Parallel adaptive radiations in two major clades of placental mammals. Nature 409, MALIA, M. J., LIPSCOMB, D. L. & ALLARD, M. W. (2003). The misleading effects of composite taxa in supermatrices. Molecular Phylogenetics and Evolution 27, MALLATT, J. & GIRIBET, G. (2006). Further use of nearly complete 28S and 18S rrna genes to classify Ecdysozoa: 37 more arthropods and a kinorhynch. Molecular Phylogenetics and Evolution 40, MALLATT, J. M., GAREY, J. R. & SHULTZ, J. (2004). Ecdysozoan phylogeny and Bayesian inference: first use of nearly complete 28S and 18S rrna gene sequences to classify the arthropods and their kin. Molecular Phylogenetics and Evolution 31, MANGUM, C. P. (1985). Oxygen transport in invertebrates. American Journal of Physiology 248. MANTON, S. M. (1973). Arthropod phylogeny - a modern synthesis. Journal of the Zoological Society of London 171, MARKL, J. & DECKER, H. (1992). Molecular structure of the arthropod hemocyanins. Advances in Comparative Environmental Physiology 13, MARLÉTAZ, F., GILLES, A., CAUBIT, X., PEREZ, Y., DOSSAT, C., SAMAIN, S., GYAPAY, G., WINCKER, P. & LE PARCO, Y. (2008). Chætognath transcriptome reveals ancestral and unique features among bilaterians. Genome Biolology 9, R94. MARTIN, J. & DAVIS, G. E. (2001). An update classification of the recent Crustacea. Natural History Museum of Los Angeles County Science Series 39, MAXMEN, A., BROWNE, W., MARTINDALE, M. & GIRIBET, G. (2005). Neuroanatomy of sea spiders implies an appendicular origin of the protocerebral segment. Nature 437, MELAND, K. & WILLASSEN, E. (2007). The disunity of "Mysidacea" (Crustacea). Molecular Phylogenetics and Evolution 44, MELDRUM, D. (2000). Automation for genomics, part two: sequencers, microarrays, and 128
141 Molecular insights to crustacean phylogeny 5. References future trends. Genome Research 10, MICHOT, B., BACHELLERIE, J. P. & RAYNAL, F. (1983). Structure of mouse rrna precursors. Complete sequence and potential folding of the spacer regions between 18S and 28S rrna. Nucleic Acids Research 11, MISOF, B. & MISOF, K. (2009). A Monte Carlo Approach Successfully Identifies Randomness in Multiple Sequence Alignments: A More Objective Means of Data Exclusion Systematic Biology 58, 1: MISOF, B., NIEHUIS, O., BISCHOFF, I., RICKERT, A., ERPENBECK, D. & STANICZEK, A. (2006). A Hexapod nuclear SSU rrna secondary-structure model and catalog of taxonspecific structural variation. Journal of Experimental Zoology 306B, MISOF, B., NIEHUIS, O., BISCHOFF, I., RICKERT, A., ERPENBECK, D. & STANICZEK, A. (2007). Towards an 18S phylogeny of hexapods: Accounting for group-specific character covariance in optimized mixed nucleotide/doublet models. Zoology 110, MISOF, B., MEYER, B., V. REUMONT, B. M., KÜCK, P., MEUSEMANN, K. Selecting informative subsets of sparse super matrices increases the chance to find correct trees. In preparation. MORRISON, D. (2006). Multiple sequence alignments for the phylogenetic purposes. Aust Systematic Botany 19, MOURA, G., CHRISTOFFERSEN, M., L. (1996). The system of the mandibulate arthropods: Tracheata and Remipedia as sister groups, Crustacea non-monoiphyletic. Journal of Comparative Biology I 3,4. MØLLER, O. S., OLESEN, J., AVENANT-OLDEWAGE, A., THOMSEN, P. F. & GLENNER, H. (2008). First maxillae suction discs in Branchiura (Crustacea): development and evolution in light of the first molecular phylogeny of Branchiura, Pentastomida, and other "Maxillopoda". Arthropod Structure & Development 37, MÜLLER, C. (2007). Vergleichend-ultrastrukturelle Untersuchungen an Augen ausgewählter HundertfÜßer (Mandibulata: Chilopoda) und zur Bedeutung von Augenmerkmalen fur die phylogentische Rekonstruktion der Euarthropoda. Inaugural-Dissertation, Cuvillier Verlag GÖttingen. NARDI, F., SPINSANTI, G., BOORE, J., CARAPELLI, A., DALLAI, R. & FRATI, F. (2003). Hexapod Origins: Monophyletic or Paraphyletic? Science 299, NIESELT-STRUWE, K. & VON HAESELER, A. (2001). Quartet-mapping, a generalization of the likelihood-mapping procedure. Molecular Biology and Evolution 18, NISHIHARA, H., OKADA, N. & HASEGAWA, M. (2007). Rooting the eutherian tree: the power and pitfalls of phylogenomics. Genome Biology 8, R199. NOLLER, H. (2005). RNA Structure: Reading the Ribosome. Science 309, NOTREDAME, C. (2002). Recent progress in multiple sequence alignment: a survey. Pharmacogenomics 3, NOTREDAME, C., HIGGINS, D. G. & HERINGA, J. (2000). T-Coffee: A novel method for fast and accurate multiple sequence alignment. Journal of Molecular Biology 302, NUIN, P. A., WANG, Z. & TILLIER, E. R. (2006). The accuracy of several multiple sequence alignment programs for proteins. BMC Bioinformatics 7, 471. NYLANDER, J. A. A., RONQUIST, F., HUELSENBECK, J. P. & NIEVES-ALDREY, J. L. (2004). Bayesian phylogenetic analysis of combined data. Systematic Biology 53, O'BRIEN, K. P., REMM, M. & SONNHAMMER, E. L. (2005). Inparanoid: a comprehensive database of eukaryotic orthologs. Nucleic Acids Research 33, D O'BRIEN, S. J. & STANYON, R. (1999). Phylogenomics. Ancestral primate viewed. Nature 129
142 5. References Molecular insights to crustacean phylogeny 402, OGDEN, T. & ROSENBERG, M. (2006). Multiple sequence alignment accuracy and phylogenetic inference. Systematic Biology 55, OGDEN, T. H., WHITING, M. F. & WHEELER, W. C. (2005). Poor taxon sampling, poor character sampling, and non-repeatable analyses of a contrived dataset do not provide a more credible estimate of insect phylogeny: a reply to Kjer. Cladistics 21, OLESEN, J. (2007). Monophyly and phylogeny of Branchiopoda, with focus on morphology and homologies of branchiopod phyllopodus limbs. Journal of Crustacean Biology 27, OTT, M., ZOLA, J., STAMATAKIS, A. & ALURU, S. (2007). Large-scale maximum likelihoodbased phylogenetic analysis on the IBM BlueGene/L. In Proceedings of the 2007 ACM/IEEE conference on Supercomputing. ACM, Reno, Nevada. PABST, T. & SCHOLTZ, G. (2009). The development of phyllopodous limbs in Leptostraca and Branchiopoda. Journal of Crustacean Biology 29: 1, PAPS, J., BAGUñà, J. & RIUTORT, M. (2009). Lophotrochozoa internal phylogeny: new insights from an up-to-date analysis of nuclear ribosomal genes. Proc Biol Sci 276, PAULUS, H. (2007). Euarthropoda. In Spezielle Zoologie, vol. I (ed. W. Westheide and R. Rieger). Elsevier, Spektrum Akademischer Verlag, MÜnchen. PAULUS, H. F. (1979). Eye structure and the monophyly of the Arthropoda. In Arthropod Phylogeny (ed. A. P. Gupta), pp Van Nostrand Rheinold Co., New York. PENNY, D., LOCKHART, P. J., STEEL, M. A. & HENDY, M. D. (1994). The role of models in recontructing evolutionary trees. In Models in phylogeny estimation. The Systematics Association Special Volume Series (ed. S. R.W., D. D.J. and W. D.M.), pp Oxford University Press. PÉREZ-LOSADA, M., HARP, M., HØEG, J. T., ACHITUV, Y., JONES, D., WATANABE, H. & CRANDALL, K. A. (2008). The tempo and mode of barnacle evolution. Molecular Phylogenetics and Evolution 46, PÉREZ-LOSADA, M., HØEG, J. T. & CRANDALL, K. (2004). Unraveling the evolutionary radiation of the thoracican barnacles using molecular and morphological evidence: a comparison of several divergence time estimation approaches. Systematic Biology 53, PERTEA, G., HUANG, X., LIANG, F., ANTONESCU, V., SULTANA, R., KARAMYCHEVA, S., LEE, Y., WHITE, J., CHEUNG, F., PARVIZI, B., TSAI, J. & QUACKENBUSH, J. (2003). TIGR Gene Indices clustering tools (TGICL): a software system for fast clustering of large EST datasets. Bioinformatics 19, PHILIPPE, H., DELSUC, F., BRINKMANN, H. & LARTILLOT, N. (2005a). Phylogenomics. Annual Review of Ecology, Evolution and Systematics 36, PHILIPPE, H., DERELLE, R., LOPEZ, P., PICK, K., BORCHIELLINI, C., BOURY-ESNAULT, N., VACELET, J., RENARD, E., HOULISTON, E., QUÉINNEC, E., DA SILVA, C., WINCKER, P., LE GUYADER, H., LEYS, S., JACKSON, D. J., SCHREIBER, F., ERPENBECK, D., MORGENSTERN, B., WÖRHEIDE, G. & MANUEL, M. (2009). Phylogenomics revives traditional views on deep animal relationships. Current Biology 19, PHILIPPE, H., LOPEZ, P., BRINKMANN, H., BUDIN, K., GERMOT, A., LAURENT, J., MOREIRA, D., MULLER, M. & LE GUYADER, H. (2000). Early-branching or fast-evolving eukaryotes? An answer based on slowly evolving positions. Proceedings of the Royal Society B: Biological Sciences 267, PHILIPPE, H., SNELL, E. A., BAPTESTE, E., LOPEZ, P., HOLLAND, P. W. & CASANE, D. 130
143 Molecular insights to crustacean phylogeny 5. References (2004). Phylogenomics of eukaryotes: impact of missing data on large alignments. Molecular Biology and Evolution 21, PHILIPPE, H. & TELFORD, M. (2006). Large-scale sequencing and the new animal phylogeny. Trends in Ecology & Evolution (Amst) 21, PHILIPPE, H., ZHOU, Y., BRINKMANN, H., RODRIGUE, N. & DELSUC, F. (2005b). Heterotachy and long-branch attraction in phylogenetics. BMC Evolutionary Biology 5, 50. PHILLIPS, M. J. & PENNY, D. (2003). The root of the mammalian tree inferred from whole mitochondrial genomes. Molecular Phylogenetics and Evolution 28, PICK, C., HAGNER-HOLLER, S. & BURMESTER, T. (2008). Molecular characterization of hemocyanin and hexamerin from the firebrat Thermobia domestica (Zygentoma). Insect Biochemistry and Molecular Biology 38, PICK, C., SCHNEUER, M. & BURMESTER, T. (2009). The occurrence of hemocyanin in Hexapoda. FEBS Journal 276, PISANI, D. (2004). Identifying and removing fast-evolving sites using compatibility analysis: An example from the arthropoda. Systematic Biology 53, POCOCK, R. I. (1893). On the classification of the tracheate Arthropoda. Zoologischer Anzeiger 16, POCOCK, R. I. (1893). On the classification of the tracheate Arthropoda- A correction. Nature 49, 124. PODSIADLOWSKI, L. & BARTOLOMAEUS, T. (2005). Organization of the Mitochondrial Genome of Mantis Shrimp Pseudosquilla ciliata (Crustacea: Stomatopoda). Marine Biotechnology 7, PODSIADLOWSKI, L. & BARTOLOMAEUS, T. (2006). Major rearrangements characterize the mitochondrial genome of the isopod Idotea baltica (Crustacea: Peracarida). Molecular Phylogenetics and Evolution 40, PODSIADLOWSKI, L., BRABAND, A. & MAYER, G. (2008). The complete mitochondrial genome of the onychophoran Epiperipatus biolleyi reveals a unique transfer RNA set and provides further support for the ecdysozoa hypothesis. Molecular Biology and Evolution 25, PODSIADLOWSKI, L., KOHLHAGEN, H. & KOCH, M. (2007). The complete mitochondrial genome of Scutigerella causeyae (Myriapoda: Symphyla) and the phylogenetic position of Symphyla. Molecular Phylogenetics and Evolution 45, PUTNEY, S. D., HERLIHY, W. C. & SCHIMMEL, P. (1983). A new troponin T and cdna clones for 13 different muscle proteins, found by shotgun sequencing. Nature 302, QUANG, L. S., GASCUEL, O. & LARTILLOT, N. (2008). Empirical profile mixture models for phylogenetic reconstruction. Bioinformatics 24, RAMSKÖLD, L. & JUNYUAN, C. (1998). Cambrian Lobopodians: Morphology and Phylogeny. In Arthropod fossils and phylogeny (ed. G. D. Edgecomb), pp Columbia University Press, New York. RANNALA, B. & YANG, Z. (2008). Phylogenetic Inference Using Whole Genomes. Annual Review of Genomics and Human Genetics 9, REGIER, J., SHULTZ, J. & KAMBIC, R. (2005). Pancrustacean phylogeny: hexapods are terrestrial crustaceans and maxillopods are not monophyletic. Proceedings of the Royal Society B: Biological Sciences 272, REGIER, J. C. & SHULTZ, J. W. (1997). Molecular phylogeny of the major arthropod groups indicates polyphyly of Crustaceans and a new hypothesis for the origin of hexapods. Molecular Biology and Evolution 14,
144 5. References Molecular insights to crustacean phylogeny REGIER, J. C. & SHULTZ, J. W. (2001). Elongation factor-2: a useful gene for arthropod phylogenetics. Molecular Phylogenetics and Evolution 20, REGIER, J. C., SHULTZ, J. W., GANLEY, A. R., HUSSEY, A., SHI, D., BALL, B., ZWICK, A., STAJICH, J. E., CUMMINGS, M. P., MARTIN, J. W. & CUNNINGHAM, C. W. (2008). Resolving arthropod phylogeny: exploring phylogenetic signal within 41 kb of proteincoding nuclear gene sequence. Systematic Biology 57, RICHTER, S. (2002). The Tetraconata concept: hexapod-crustacean relationships and the phylogeny of Crustacea. Organisms Diversity & Evolution 2, RICHTER, S., OLESEN, J. & WHEELER, W. C. (2007). Phylogeny of Branchiopoda (Crustacea) based on a combined analysis of morphological data and six molecular loci. Cladistics 23, RICHTER, S. & SCHOLTZ, G. (2001). Phylogenetic analysis of the Malacostraca (Crustacea). Journal of Zooogical Systematic and Evolutionary Research 39, RICHTER, S. & WIRKNER, C. S. (2004). Kontroversen in der phylogenetische Systematik der Euarthropoda. In: Kontroversen der phylogenetischen Systematik der Metazoa, vol. 43 (ed. S. Richter and W. Sudhaus), pp Sitzungsberichte der Gesellschaft Naturforschender Freunde zu Berlin. RODRíGUEZ-EZPELETA, N., BRINKMANN, H., ROURE, B., LARTILLOT, N., LANG, B. F. & PHILIPPE, H. (2007). Detecting and overcoming systematic errors in genome-scale phylogenies. Systematic Biology 56, ROEDING, F., HAGNER-HOLLER, S., RUHBERG, H., EBERSBERGER, I., VON HAESELER, A., KUBE, M., REINHARDT, R. & BURMESTER, T. (2007). EST sequencing of Onychophora and phylogenomic analysis of Metazoa. Molecular Phylogenetics and Evolution 45, ROKAS, A., KRÜGER, D. & CARROLL, S. B. (2005). Animal evolution and the molecular signature of radiations compressed in time. Science 310, ROKAS, A., WILLIAMS, B. L., KING, N. & CARROLL, S. B. (2003). Genome-scale approaches to resolving incongruence in molecular phylogenies. Nature 425, RONAGHI, M. (2001). Pyrosequencing Sheds Light on DNA Sequencing. Genome Research 11, RONAGHI, M., KARAMOHAMED, S., PETTERSSON, B., UHLÉN, M. & NYRÉN, P. (1996). Realtime DNA sequencing using detection of pyrophosphate release. Analytical Biochemistry 242, RONAGHI, M., UHLÉN, M. & NYRÉN, P. (1998). A sequencing method based on real-time pyrophosphate. Science 281, RONQUIST, F. & HUELSENBECK, J. P. (2003). MrBayes 3: Bayesian phylogenetic inference under mixed models. Bioinformatics 19, ROTA-STABELLI, O. & TELFORD, M. (2008). A multi criterion approach for the selection of optimal outgroups in phylogeny: recovering some support for Mandibulata over Myriochelata using mitogenomics. Molecular Phylogenetics and Evolution 48, RUDD, S. (2003). Expressed sequence tags: alternative or complement to whole genome sequences? Trends in Plant Science 8, SANDERS, H. L. (1955). The Cephalocarida, a new subclass of Crustacea from Long Island sound. Proceedings of the national Academy of Sciences, USA41, SANDERSON, M. J. (1998). Phylogenetic supertrees: assembling the trees of life. Trends in Ecology & Evolution (Amst) 13, SANDERSON, M. J. & DRISKELL, A. C. (2003). The challenge of constructing large phylogenetic trees. Trends in Plant Science 8,
145 Molecular insights to crustacean phylogeny 5. References SANDERSON, M. J. & MCMAHON, M. M. (2007). Inferring angiosperm phylogeny from EST data with widespread gene duplication. BMC Evolutionary Biology 7, SANGER, F., NICKLEN, S. & COULSON, A. R. (1977). DNA sequencing with chain-terminating inhibitors. Proceedings of the national Academy of Sciences, USA74, SCHMIDT, H. A., STRIMMER, K., VINGRON, M. & VON HAESELER, A. (2002). TREE-PUZZLE: maximum likelihood phylogenetic analysis using quartets and parallel computing. Bioinformatics 18, SCHOLTZ, G. & EDGECOMBE, G. (2006). The evolution of arthropod heads: reconciling morphological, developmental and palaeontological evidence. Development, Genes and Evolution 216, SCHOLTZ, G., MITTMANN, B. & GERBERDING, M. (1998). The pattern of Distal-less expression in the mouthparts of crustaceans, myriapods and insects: new evidence for a gnathobasic mandible and the common origin of Mandibulata. International Journal of Developmental Biology 42, SCHÖNINGER, M. & VON HAESELER, A. (1994). A stochastic model for the evolution of autocorrelated DNA sequences. Molecular Phylogenetics and Evolution 3, SCHRAM, F. R. (1983). Remipedia and crustacean phylogeny. Crustacean Issues 1, SCHRAM, F. R. (1986). Crustacea. Oxford Univeristy Press, Oxford. SCHRAM, F. R. & HOF, C. H. J. (1998). Fossils and interrelationships of major crustacean groups. In Arthropod Fossils and Phylogeny (ed. G. D. Edgecomb), pp Columbia University Press, New York. SCHRAM, F. R. & KOENEMANN, S. (2001). Developmental genetics and arthropod evolution: part I, on legs. Evolution & Development 3, SCHRAM, F. R. & KOENEMANN, S. (2004). Are the crustaceans monophyletic? In Assembling the tree of life (ed. J. Cracraft and M. J. Donoghue), pp Oxford University Press, New York. SCHRAM, F. R. & KOENEMANN, S. (2004). Developmental genetics and arthropod evolution: on body regions of Crustacea. In Evolutionary Developmental Biology of Crustacea, Crustacean Issues, vol. 15 (ed. G. Scholotz), pp SCHREIBER, F., WORHEIDE, G. & MORGENSTERN, B. (2009). OrthoSelect: a web server for selecting orthologous gene alignments from EST sequences. Nucleic Acids Research 434, 1-4. SCHUSTER, S. C. (2008). Next-generation sequencing transforms today's biology. Nature Methods 5, SEO, T. & KISHINO, H. (2008). Synonymous substitutions substantially improve evolutionary inference from highly diverged proteins. Systematic Biology 57, SHENDURE, J., MITRA, R. D., VARMA, C. & CHURCH, G. M. (2004). Advanced sequencing technologies: methods and goals. Nature Reviews Genetics 5, SHOSHANI, J. & MCKENNA, M. C. (1998). Higher taxonomic relationships among extant mammals based on morphology, with selected comparisons of results from molecular data. Molecular Phylogenetics and Evolution 9, SHULTZ, J. W. & REGIER, J. C. (2000). Phylogenetic analysis of arthropods using two nuclear protein-encoding genes supports a crustacean + hexapod clade. Proceedings of the Royal Society B: Biological Sciences 267, SIMON, C., BUCKLEY, T. R., FRATI, F., STEWART, J. B. & BECKENBACH, A. T. (2006). Incorporating Molecular Evolution into Phylogenetic Analysis, and a New Compilation of Conserved Polymerase Chain Reaction Primers for Animal Mitochondrial DNA. Annual Review of Ecology, Evolution, and Systematics 37,
146 5. References Molecular insights to crustacean phylogeny SIVETER, D. J., WILLIAMS, M. & WALOSZEK, D. (2001). A phosphatocopid crustacean with appendages from the Lower Cambrian. Science 293, SMIT, A. F. A. (1996). The origin of interspersed repeats in the human genome. Current Opinion in Genetics and Development 6, SMITH, S. & DUNN, C. (2008). Phyutility: a phyloinformatics tool for trees, alignments and molecular data. Bioinformatics 24, SNODGRASS, R. E. (1935). The principles of insect morphology. McGraw-Hill, New York. SNODGRASS, R. E. (1938). Evolution of the Annelida, Onychophora, and Arthropoda. Smithsonian Miscellaneous Collection 97, SPEARS, T. & ABELE, L. G. (1998). Crustacean phylogeny inferred from 18S rdna. In Arthropod Relationships (ed. R. A. Fortey and R. H. Thomas), pp Chapman and Hall, London. SPEARS, T., ABELE, L. G. & KIM, W. (1992). The monophyly of brachyuran crabs: a phylogenetic study based on 18S rrna. Systematic Biology. SPEARS, T., DEBRY, R. W., ABELE, L. G. & CHODYLA, K. (2005). Peracarid monophyly and interordinal phylogeny inferred from nuclear small-subunit. Proceedings of the Biological Society of Washington. SPRINGER, M. S., SCALLY, M., MADSEN, O., DE JONG, W. W., DOUADY, C. J. & STANHOPE, M. J. (2004). The use of composite taxa in supermatrices. Molecular Phylogenetics and Evolution 30, STAMATAKIS, A. (2006). RAxML-VI-HPC: maximum likelihood-based phylogenetic analyses with thousands of taxa and mixed models. Bioinformatics 22, STEEL, M., HUSON, D. H. & LOCKHART, P. J. (2000). Invariable sites models and their use in phylogeny reconstruction. Systematic Biology 49, STEEL, M. & PENNY, D. (2000). Parsimony, likelihood, and the role of models in molecular phylogenetics. Molecular Biology and Evolution 17, STENDERUP, J., OLESEN, J. & GLENNER, H. (2006). Molecular phylogeny of the Branchiopoda (Crustacea) Multiple approaches suggest a diplostracan ancestry of the Notostraca. Molecular Phylogenetics and Evolution 41, STEPHAN, W. (1996). The Rate of Compensatory Evolution. Genetics 144, STILLMAN, J. H., COLBOURNE, J. K., LEE, C. E. & PATEL, N. H. (2008). Recent advances in crustacean genomics. In Annual meeting of the Society for Integrative and Comparative Biology, pp. 1-17, San Antonio, Texas. STOCSITS, R., LETSCH, H., HERTEL, J., MISOF, B. & STADLER, P. (2009). Accurate and efficient reconstruction of deep phylogenies from structured RNAs. Nucleic Acids Research, STOLLEWERK, A. & CHIPMAN, A. D. (2006). Neurogenesis in myriapods and chelicerates and its importance for understanding arthropod relationships. Integrative Computational Biology 46, STRAUSFELD, N., SINAKEVITCH, I., BROWN, S. M. & FARRIS, S. M. (2009). Ground plan of the insect mushroom body: functional and evolutionary implications. Journal of Comparative Neurology. 513, STRAUSFELD, N., STRAUSFELD, C. M., LOESEL, R., ROWELL, D. & STOWE, S. (2006a). Arthropod phylogeny: onychophoran brain organization suggests an archaic relationship with a chelicerate stem lineage. Proceedings of the Royal Society B: Biological Sciences 273, STRAUSFELD, N., STRAUSFELD, C. M., STOWE, S., ROWELL, D. & LOESEL, R. (2006b). The organization and evolutionary implications of neuropils and their neurons in the brain 134
147 Molecular insights to crustacean phylogeny 5. References of the onychophoran Euperipatoides rowelli. Arthropod Structure & Development 35, STRAUSFELD, N. J. (2009). Brain organization and the origin of insects: an assessment. Proceedings of the Royal Society B: Biological Sciences 276, SULLIVAN, J. & SWOFFORD, D. L. (2001). Should we use model-based methods for phylogenetic inference when we know that assumptions about among-site rate variation and nucleotide substitution pattern are violated? Systematic Biology 50, SUSKO, E., SPENCER, M. & ROGER, A. (2005). Biases in phylogenetic estimation can be caused by random sequence segments. Journal of Molecular Evolution61, SWOFFORD, D. L. (2002). PAUP*4.0b10. Phylogenetic analysis using parsimony (*and other methods). Sinauer Associates, Sunderland, Massachusetts. TARRIO, R., RODRIGUEZ-TRELLES, F. & AYALA, F. J. (2000). Tree rooting with outgroups when they differ in their nucleotide composition from the ingroup: the Drosophila saltans and willistoni groups, a case study. Molecular Phylogenetics and Evolution 16, TARRIO, R., RODRIGUEZ-TRELLES, F. & AYALA, F. J. (2001). Shared nucleotide composition biases among species and their impact on phylogenetic reconstructions of the drosophilidae. Molecular Biology and Evolution 18, TATENO, Y., NEI, M. & TAJIMA, F. (1982). Accuracy of estimated phylogenetic trees from molecular data. I. Distantly related species. Journal of Molecular Evolution 18, TELFORD, M. (2005). Consideration of RNA secondary structure significantly improves likelihood-based estimates of phylogeny: examples from the Bilateria. Molecular Biology and Evolution 22, TELFORD, M. (2006). Animal phylogeny. Current Biology 16, R981-R985. TELFORD, M., BOURLAT, S., ECONOMOU, A., PAPILLON, D. & ROTA-STABELLI, O. (2008). The evolution of the Ecdysozoa. Philosophical Transactions of the Royal Society B: Biological Sciences 363, THOMPSON, J. D., GIBSON, T. J., PLEWNIAK, F., JEANMOUGIN, F. & HIGGINS, D. G. (1997). The CLUSTAL_X windows interface: flexible strategies for multiple sequence alignment aided by quality analysis tools. Nucleic Acids Research 25, THOMPSON, J. D., HIGGINS, D. G. & GIBSON, T. J. (1994). CLUSTAL W: improving the sensitivity of progressive multiple sequence alignment through sequence weighting, position-specific gap penalties and weight matrix choice. Nucleic Acids Research 22, THORLEY, J. L. & WILKINSON, M. (1999). Testing the Phylogenetic Stability of Early Tetrapods. Journal of Theoretical Biology 200, THORNE, J. (2000). Models of protein sequence evolution and their applications. Current Opinion in Genetics and Development 10, TIMMERMANS, M., ROELOFS, D., MARIEN, J. & VAN STRAALEN, N. M. (2008). Revealing pancrustacean relationships: Phylogenetic analysis of ribosomal protein genes places Collembola /springtails) in a monophyletic Hexapoda and reinforces the discrepancy between mitochondrial and nuclear markers. BMC Evolutionary Biology 8, UNGERER, P. & SCHOLTZ, G. (2008). Filling the gap between identified neuroblasts and neurons in crustaceans adds new support for Tetraconata. Proceedings of the Royal Society B: Biological Sciences 275, VACCARI, N. E., EDGECOMBE, G. D. & ESCUDERO, C. (2004). Cambrian origins and affinities 135
148 5. References Molecular insights to crustacean phylogeny of an enigmatic fossil group of arthropods. Nature 430, VAN DE PEER, Y., DE RIJK, P., WUYTS, J., WINKELMANS, T. & DE WACHTER, R. (2000). The European small subunit ribosomal RNA database. Nucleic Acids Research 28, VAN HOLDE, K. E. & MILLER, K. I. (1995). Hemocyanins. Advances in Protein Chemistry 47, VANNIER, J. & ABE, K. (1995). Size, body plan and respiration in the Ostracoda. Palaeontology 38, V. REUMONT, B.M., MEUSEMANN K., SZUCSICH, N. U., DELL AMPIO, E., GOWRI_SHANKAR, V., BARTEL, D., SIMON, S., LETSCH, H. O., STOCSITS, R., LUAN, Y. X., WÄGELE J. W., PASS G., HADRYS, H., MISOF, B. (2009). Can comprehensive background knowledge be incorporated into substitution models to improve phylogenetic analyses? A case study on major arthropod relationships. BMC Evol.Biol. 9:119. WADDELL, P. J., PENNY, D. & MOORE, T. (1997). Hadamard Conjugations and Modeling Sequence Evolution with Unequal Rates across Sites. Molecular Phylogenetics and Evolution 8, WAEGELE, J. W., LETSCH, H., KLUSSMANN-KOLB, A., MAYER, C., MISOF, B. & WAGELE, H. (2009). Phylogenetic support values are not necessarily informative: the case of the Serialia hypothesis (a mollusk phylogeny). Front Zool 6, 12. WÄGELE, J., HOLLAND, B., DREYER, H. & HACKETHAL, B. (2003). Searching factors causing implausible non-monophyly: ssu rdna phylogeny of Isopoda Asellota (Crustacea: Peracarida) and faster evolution in marine than in freshwater habitats. Molecular Phylogenetics and Evolution 28, WÄGELE, J. W. (1993). Rejection of the 'Uniramia' hypothesis and implications of the Mandibulata concept. Zoologische JahrbÜcher. Abteilung für Systematik, Ökologie und Geographie der Tiere 120, WÄGELE, J. W. & MAYER, C. (2007). Visualizing differences in phylogenetic information content of alignments and distinction of three classes of long-branch effects. BMC Evolutionary Biology 7, WALLACE, I. M., O'SULLIVAN, O. & HIGGINS, D. G. (2005). Evaluation of iterative alignment algorithms for multiple alignment. Bioinformatics 21, WALLACE, I. M., O'SULLIVAN, O., HIGGINS, D. G. & NOTREDAME, C. (2006). M-Coffee: combining multiple sequence alignment methods with T-Coffee. Nucleic Acids Research 34, WALOSSEK, D. (1993). The upper Cambrian Rehbachiella and the phylogeny of Branchiopoda and Crustacea. Fossils and Strata 32, WALOSSEK, D. (1999). On the Cambrian diversity of Crustacea. In Crustaceans and the biodiversity crisis (ed. F. Schram and J. Vaupel Klein). Brill Acadamic Publishers, Leiden, Amsterdam. WALOSSEK, D. & MÜLLER, K. (1998a). Cambrian'Orsten'-type arthropods and the phylogeny of Crustacea. In Arthropod relationships (ed. R. A. Fortey and R. H. Thomas), pp Chapman and Hall, London. WALOSSEK, D. & MÜLLER, K. J. (1998b). Early arthropod phylogeny in light of the Cambrian "Orsten" fossils. In Arthropod fossils and phylogeny (ed. G. D. Edgecomb), pp Columbia University Press, New York. WALOSZEK, D. (2003). Cambrian 'Orsten'-type preserved arthropods and the phylogeny of Crustacea. In The new panorama of animal evolution., Proc. 18th Congr. Zoology (ed. A. Legakis, R. Sfenthourakis, R. Polymeni and M. Thessaqlou-Legaki), pp Pensoft Publishers. 136
149 Molecular insights to crustacean phylogeny 5. References WALOSZEK, D., CHEN, J., MAAS, A. & WANG, X. (2005). Early Cambrian arthropods new insights into arthropod head and structural evolution. Arthropod Structure & Development 34, WALOSZEK, D., MAAS, A., CHEN, J. & STEIN, M. (2007). Evolution of cephalic feeding structures and the phylogeny of Arthropoda. Palaeogeography, Paleoclimatology, Paleoecology 254, WALOSZEK, D., REPETSKI, J. E. & MAAS, A. (2006). A new Late Cambrian pentastomid and a review of the relationships of this parasitic group. Transactions of the Royal Society Edingurgh: Earth Science 96, WEYGOLDT, P. (1998). REVIEW Evolution and systematics of the Chelicerata. Experimental and Applied Acarology 22, WHEELER, W. & HAYASHI, C. (1998). The phylogeny of the extant chelicerate orders. Cladistics 14, WHEELER, W. C. (1998). Sampling, groundplans, total evidence and the systematics of arthropods. In Arthropod relationships (ed. R. A. Fortey and R. H. Thomas), pp Chapman and Hall, London. WHEELER, W. C., GIRIBET, G. & EDGECOMBE, G. D. (2004). Arthropod systematics. The comparative study of genomic, anatomical, and paleontological information. In Assembling the tree of life (ed. J. Cracraft and M. J. Donoghue), pp Oxford University Press, New York. WHELAN, S. (2008). The genetic code can cause systematic bias in simple phylogenetic models. Philosophical Transactions of the Royal Society B: Biological Sciences 363, WHELAN, S. & GOLDMAN, N. (2001). A general empirical model of protein evolution derived from multiple protein families using a maximum-likelihood approach. Molecular Biology and Evolution 18, WHELAN, S., LIÒ, P. & GOLDMAN, N. (2001b). Molecular phylogenetics: state-of-the-art methods for looking into the past. Trends in Genetics 17, WHITFIELD, J. B. & KJER, K. M. (2008). Ancient rapid radiations of insects: Challenges for phylogenetic analysis. Annual Review of Entomology 53, WIENS, J. J. (1998). Does adding characters with missing data increase or decrease phylogenetic accuracy? Systematic Biology 47, WIENS, J. J. (2003). Missing Data, Incomplete Taxa, and Phylogenetic Accuracy. Systematic Biology 52, WIENS, J. J. (2005). Can incomplete taxa rescue phylogenetic analyses from long-branch attraction? Systematic Biology 54, WIENS, J. J. (2006). Missing data and the design of phylogenetic analyses. Journal of Biomedical Informatics 39, WIENS, J. J., KUCZYNSKI, C. A., SMITH, S. A., MULCAHY, D. G., SITES, J. W., TOWNSEND, T. M. & REEDER, T. W. (2008). Branch lengths, support, and congruence: testing the phylogenomic approach with 20 nuclear loci in snakes. Systematic Biology 57, WIENS, J. J. & MOEN, D. S. (2008). Missing data and the accuracy of Bayesian phylogenetics. Journal of Systematics and Evolution 46, WILLS, M. A. (1998). A phylogeny of recent and fossil crustacea derived from morphological characters. In Arthropod Relationships, vol. The systematics Association Special Volume Series (ed. R. A. Fortey and R. H. Thomas). Chapman and Hall, London. WILSON, G. D. F. (1992). Computerized analysis of crustacean relationships. Acta Zoologica 72,
150 5. References Molecular insights to crustacean phylogeny WILSON, K., CAHILL, V., BALLMENT, E. & BENZIE, J. (2000). The complete sequence of the mitochondrial genome of the crustacean Penaeus monodon: Are malacostracan crustaceans more closely related to insects than to branchiopods? Molecular Biology and Evolution 17, WINGSTRAND, K. G. (1972). Comparative spermatology of a pentastomid Raillietiella hemidactyli and a branchiuran crustacean Argulus foliacaetus with a discussion of pentstomid relationships. Biologiske Skrifter 19, WONG, K. M., SUCHARD, M. A. & HUELSENBECK, J. P. (2008). Alignment uncertainty and genomic analysis. Science 319, WUYTS, J., DE RIJK, P., VAN DE PEER, Y. & PISON, G. (2000). Comparative analysis of more than 3000 sequences reveals the existence of two pseudoknots in area V4 of eukaryotic small subunit ribosomal RNA. Nucleic Acids Research 28, WUYTS, J., PERRIèRE, G. & VAN DE PEER, Y. (2004). The European ribosomal RNA database. Nucleic Acids Research 32, D WUYTS, J., VAN DE PEER, Y., WINKELMANS, T. & DE WACHTER, R. (2002). The European database on small subunit ribosomal RNA. Nucleic Acids Research 30, YAGER, J. (1981). Remipedia, a new class of Crustacea from a marine cave in the Bahamas. Journal of Crustacean Biology 1, YAMAGUCHI, S. & ENDO, K. (2003). Molecular phylogeny of Ostracoda (Crustacea) inferred from 18S ribosomal DNA sequences: implication for its origin and diversification. Marine Biology 143, YANG, Z. (1994). Maximum likelihood phylogenetic estimation from DNA sequences with variable rates over sites: approximate methods. Journal of Molecular Evolution 39, YANG, Z. (1996). Among-site rate variation and its impact on phylogenetic analyses. Trends in Ecology & Evolution 11, ZANTKE, J., WOLFF, C. & SCHOLTZ, G. (2008). Three-dimensional reconstruction of the central nervous system of Macrobiotus hufelandi (Eutardigrada, Parachela): implications for the phylogenetic position of Tardigrada. Zoomorphology 127, ZHANG, X., SIVETER, D., WALOSZEK, D. & MAAS, A. (2007). An epipodite-bearing crowngroup crustacean from the Lower Cambrian. Nature 449, ZHOU, Y. & LANDWEBER, L. (2007). BLASTO: a tool for searching orthologous groups. Nucleic Acids Research 35, W678-W682. ZRZAV, J., HYPSA, V. & VLÁSKOVÁ. (1998a). Arthropod phylogeny: taxonomic congruence, total evidence and conditional combination approaches to morphological and molecular data sets. In Arthropod relationships (ed. R. A. Fortey and R. H. Thomas), pp Columbia University Press, New York. ZRZAV, J., MIHULKA, S., KEPKA, P. & TIETZ, D. (1998b). Phylogeny of the Metazoa Based on Morphological and 18S Ribosomal DNA Evidence. Cladistics 14, ZRZAV, J. & STYS, P. (1997). The basic body plan of arthropods: insights from evolutionary morphology and developmental biology. Journal of Evolutionary Biology 10, ZWICKL, D. J. & HILLIS, D. M. (2002). Increased taxon sampling greatly reduces phylogenetic error. Systematic Biology 51, ZWICKL, D. J. & HOLDER, M. T. (2004). Model parameterization, prior distributions, and the general time-reversible model in bayesian phylogenetics. Systematic Biology 53,
151 Molecular insights to crustacean phylogeny 5. References ELECTRONICAL REFERENCES (LINKS) SOFTWARE - PROGRAMS ALICUT ALISCORE CROSSMATCH INPARANOID RNASALSA SEQCLEAN TRACER UNIVEC crossmatch.html UniVec.html HOMEPAGES Arthropod primer toolbox Deep Arthropod Phylogeny Project (CUNNINGHAM lab) NCBI dbest database NCBI nucleotide BLAST SPP: Deep Metazoan Phylogeny
152 6. Abbreviations Molecular insights to crustacean phylogeny ABBREVIATIONS AIC AIC ASRV BFT cdna COI DNA DNA-POL I e.g. EST GHz GB HDD HGP HP IANTD kda LBA LSU rrna MB Mb MCMC ML mrna MSA NACD NCBI NSS PCR pp RAM rrna rrna RT-PCR SG SSU rrna TCC TiHo ZFMK Akaike Information Criterion Akaike information criterion Among site rate variation Bayes Factor Test Copy desoxyribonucleine acid Cytochrome oxidase subunit I Desoxyribonucleine acid DNA Polymerase I For example Expressed sequence tag Gigahertz Gigabyte Hard disc drive Human Genome Project Hewlet Packard (corporation) International Association for Nitrox and Trimix Diving Kilo Dalton Long Branch Artifact Large subunit rrna Megabyte Megabase Markov Chains Monte Carlo Maximum Likelihood Messenger ribonucleine acid Multiple sequence alignment National Association for Cave Diving National Center for Biotechnology Information National Speleological Society Polymerase chain reaction Posterior probability Random Access Memory Ribosomal ribonuceline acid Ribosomal ribonucleine acid Reverse transcriptase PCR Sistergroup Small subunit rrna Trilobita-Chelicerata-Crustacea concept Medizinische Tier-Hochschule Hannover Zoologisches Forschungsmuseum Alexander Koenig 140
153 Molecular insights to crustacean phylogeny 7. Index of figures and tables INDEX OF FIGURES AND TABLES FIGURES Figure 1.1: Representatives of the six major crustacean classes. 4 Figure 1.2: Conflicting hypotheses of crustacean phylogeny. 6 Figure 1.3: Cladograms representing the most commonly suggested, competing 7 relationships of Crustacea. Figure 1.4: Conflicting hypothesis on the phylogeny within arthropoda. 10 Figure 1.5: Summarized recent hypotheses of arthropod evolution. 12 Figure 2.1: Some impressions of the field and species collection work. 22 Figure 2.2: Pentastomid parasitizing Hemidactylus host. 23 Figure 2.3: Longitudinal section of an anchialine cave system. 24 Figure 2.4: Cenote Crustacea on the Eastern Yucatan, Mexico. 25 Figure 2.5: EST cloning and sequencing procedure. 28 Figure 2.6: Phylogenetic analyses process prior to tree reconstruction. 30 Figure 2.7: Design of analysis [B]. 41 Figure 2.8: Detailed flow of the procedure of analyses [B] using the software 43 package PHASE-2.0. Figure 2.9: Processing of EST data and orthology assignment. 48 Figure 2.10: Alignment masking, selecting an optimal data-subset and phylogenetic 49 analyses. Figure 2.11: Potential relative information content of genes visualised by 2D simplex 50 bipartite graphs. Figure 2.12: Original data matrix with potential relative information content of each 51 gene and taxon. Figure 2.13: Optimal data subset. 52 Figure 3.1: Networks of the processed, MAFFT-aligned (A) and additionally RY 58 coded (B) dataset. Figure 3.2: Networks of the manually aligned (A) and additionally manually 59 optimized (B) dataset. Figure 3.3: Navajo rugs showing the distribution of clades for all analyses. 62 Figure 3.4: Resulting topology of the by hand aligned and optimized dataset 63 (run7). Figure 3.5: Resulting topology of the processed MAFFT-based dataset (run2). 64 Figure 3.6: Neighbornet graph of the concatenated 18S & 28S rrna 66 Figure 3.7: Neighbornet graph based on LogDet correction reconstructed in 67 Splitstree 4. Figure 3.8: Time-heterogeneous consensus tree of the 18S and 28S rrna 72 dataset considering secondary structure information. Figure 3.9: Time-homogeneous consensus tree tree of the 18S and 28S rrna 73 dataset considering secondary structure information. Figure 3.10: Cladogram of the 233-taxon RAxML analysis of the unreduced original 75 data set Figure 3.11: Phylogram of the 117-taxon Bayesian analysis. 76 Figure 3.12: Phylogram of 117-taxon ML analysis 77 Figure 3.13: Consensus network of all PhyloBayes trees. 80 Figure 3.14: Simplified Bayesian phylogenetic tree or arthropod hemocyanins and 82 hexamerins Figure 4.1: Sreenshot of the primer toolbox platform
154 7. Index of figures and tables Molecular insights to crustacean phylogeny Figure S1 Primer card of PCR and CS primer v Figure S2 Resulting topoplogy of final run 1 L Figure S3 Resulting topoplogy of final run 3 li Figure S4 Resulting topoplogy of final run 4 lii Figure S5 Resulting topoplogy of final run 5 Liii Figure S6 Resulting topoplogy of final run 6 Liv Figure S7 Resulting topoplogy of final run 8. Lv Figure S8 Resulting topoplogy of final run 9. lvi Figure S9 Resulting topoplogy of final run 10. Lvii Figure S10 BLAST result of the two mystacocarid sequences Lii TABLES Table 2.1: Main analyses included in present thesis 31 Table 2.2: Final runs for the dataset of analysis [A] 38 Table 2.3: Number of different alignment positions for the partitioned data sets 39 based on alignments using the programs MAFFT and MUSCLE. Table 2.4: Chains included to infer the time-heterogeneous and homogeneous 45 trees of analysis [B] Table 2.5: EST sequencing projects for crustacean taxa 46 Table 2.6: ikelihood values and chain combinations of the 25 Phylobayes runs of 54 analysis [C] Table 3.1: Base frequency test for the dataset of analysis [A], mafft aligned 60 without RY coding Table 3.2: Bayesian support values for selected clades of analysis [B] 70 Table S1 Collection plan of crustacean and pycnogonid outgroup species i Table S2 Localities and fixation methods for collected specimens ii Table S3 Primer list for all amplified and sequenced fragments of this thesis iii Table S4 Used PCR chemicals vi Table S5 PCR temperature profiles vi Table S6 Overview of sequenced genes for the collected specimens. viii Table S7 Taxa list for analysis A ix Table S8 Pretests for the Bayes Factor Tests (BFT). xii Table S9 Finalruns for the final Bayes Factor Tests (BFT). xiii Table S10 Taxa list of sampled sequences for analysis B. xiv Table S11 List of chimeran species reconstructed for concatenated 18S and 28S xviii rrna sequences. Table S12 Setting of exchangeability parameters used for the pre-runs. xviii Table S13 Taxa included in analyses xix Table S14 Current Genome and EST projects of Crustacea. xxiv Table S15 Genes selected by HaMStR and used in phylogenetic analyses xxv 142
155 Molecular insights to crustacean phylogeny 8. Acknowledgement ACKNOWLEDGEMENT If my doctor told me I had only six minutes to live, I wouldn t brood. I d type a little faster ISAAC ASIMOV. I have the need to thank so many persons that I hope nobody is forgotten in this section. I would like to thank first all those persons who provided and determined specimens in the framework of this thesis: E. EDER, A. BRABAND, D. WALOßEK, G. STRIESO, H. BOSCH, P. FRENZEL, M. RAUPACH, J. OTT, F. KRAPP. The present taxon sample was only possible with their help. Of course many people supported me in the field to collect successfully and with fun (which is at least equally important) specimens, T. ILIFFE, J. MOREIRA-MORALEZ, K. MEUSEMANN, K. HÄNDELER are to mention here. You will meet the Karen later again. Very special appearance while respectively cave diving, featured B. GONZALES, J. PAKES and B. MALONEY. So much fun and serious diving combined. Puh what a task. Howdy! A word is to be said regarding my cave diving instructors, T. WÄLDE & P. WIDGET and my buddy S. LIER. Yes, I know, I am not a full cave diver yet. We will see us at latest in summer 2010 for that issue hope so. You got the bottles I got the brain lets start nitrogen flooding the vein. Thank you so much for drilling me without that I would not have managed to see the remipedes in their habitat. Well, at least not in the combination with coming back alive and telling about it. Unforgettable! The impressions of the Mexican underworld were in general - unforgettable 2. T. ILLIFE is really a great buddy and indeed a special, luminary diver to meet. Thank you so much for everything, including the addiction to cave diving! I will never forget the time at your house and especially your hospitality in the emergency flat after the destruction of your house by the hurricane IKE in In the context of the Remipedes I have to thank so much S. KOENEMANN, he is really great and open minded for cooperation that I am really happy about this cooperation and I hope that it proceeds for a long time. And I really hope that I will meet more scientists like him in future. The time, discussions and talks within the meetings and framework of the Deep Metazoan Phylogeny program were really great, hard work and stress but also damn pushing and bringing awesome experiences in diverse issues. Especially the contact and network with Co- PhD students, postdocs (A. BRABAND, M. HELMKAMPF, A. MEYER, M. PERSEKE, K. PICK, P. UNGERER, C. MÜLLER, L. PODSIADLOWSKI) and cooperating partners (T. BURMESTER, M. WIENS, S. HARZSCH) was very fruitful. Anke, thank you so much for the comments to this thesis! A great influence had also the discussions with D. WALOSZEK, A. MAAS AND J. HAUG. The importance of morphology and respectively the fossil record was since that always in my mind and hopefully our molecular results are soon good enough to start the total evidence paper(s) bringing it all together. I will remember the PhD time as a time of traveling physically and mentally. A very influencing and pushing experience was the visit to K. KJER in New Jersey and the visit of the Evolution 2008 meeting in Minneapolis together. Thank you so much Karl, also for the great barbecues and the first own baseball gaming. The evenings on the bridge over the 143
156 8. Acknowledgement Molecular insights to crustacean phylogeny Mississippi at the UoM joining the poster sessions while drinking a cold beer watching in parallel the skyline of Minneapolis. Awsome! Best poster session I ever participated. Also the Vienna gang was really great and always a challenge for me being per definiton not a hexapod expert. But who knows. Lets see Ingroup strangers feature: G. PASS, N. SUCSICZ, E. DELL AMPIO and D. BARTEL. Emiliano, thank you so much for your primer setting help! It worked fdg. Regarding the molecular work I have to thank C. ETZBAUER our famous lab chief in charge. Or head of anything. Every lab should have a Claudia. Perhaps soon available as a non smoking version. Jokes apart. THANK YOU. Of course also to the rest of the Lab crew (B. ULLRICH, O. SCHULTZ, J. DAMBACH, P. KÜCK, H. LETSCH, K. LANGEN, J. SCHWARZER, C. GREVE), it was always fun to work with you guys. My two scientific assistents S. BECKER and B. ULLRICH really were a great help. And yes, I was an official member of the famous lab inauguration party finally ending outside the roof. And here she comes. KAREN TINY TANTE MEUSEMANN. The colleague who never sleeps. Especially if looking for typos. The Duracell Bunny. Our discussions were really great. Sometimes hard - but always very professional It was great joining all the meetings together and keeping talks after each other. The Big B. and tiny t. Karen, my officially apologies at this place for hiding your cigarettes at the ceiling (it did not work anyway ). At the end I would like to thank the two captains and chiefs of the boat: PROF. WÄGELE for the great opportunity and the confidence in me to conduct this thesis. He was always open for my plans and suggestions and also pushed me to feel and collect the specimens. He supported all the fieldtrips and meetings I joined. By this I got really fascinated in the crustaceans and as by product also to diving. Thank you so much! Together with PROF. MISOF he opened and sharpened the mind for analyses, interpretation and argumentation of data. A suspicious mind is extended. And I am really grateful for the critical remarks and suggestions of both while practicing talks and discussions. I know from so many Co-students that this is not the standard procedure. I am also very grateful to PROF. RUST and PROF. HOCH from the University Bonn who agreed to co-correct this thesis. The Alexander Koenig Stiftung and the Raiffeisenbank Rhein Sieg I have to thank for financial support for fieldtrips. The travel grant from the Raiffeisenbank was mostly arranged by U. SCHÄKEL and R. MÜLLER, I am very grateful for their trust in me to succeed in collecting the remipedes in Mexican caves systems. Last but not least I thank my family. My parents, my sister and Phillip supported me in so many ways that I really had a guideline in some times of trouble. If there were some really troubles, I do not really feel so. Stressy times, okay But all the awesome meals and energy sessions at Rheidt and Rheinbreitbach were unforgettable and they always helped a lot to come down. A last word is directed to all of my good old friends, I know sometimes I am hardly available, sorry for that and thank you so much for your respect! 144
157 9. SUPPLEMENT 2. MATERIAL AND METHODS Table S1 Collection plan of crustacean and pycnogonid outgroup species. Species of groups that were aimed but impossible to collect are marked by xxx. Thecostraca Branchiopoda Major group Infraorder Family Species Mystacocarida Derocheilocaridae Derocheilocaris typicus (Pennak & Zinn 1943) Copepoda Gymnoplea Platicopidae xxx Calanoida Tigriopus fulvus (Fischer 1860) Podoplea Canuellidae Canuella perplexa (Scott & Scott 1893) Cyclopidae Cyclops (Muller 1785) sp. Ostracoda Paleocopida Punciidae xxx Myodocopida xxx Podocopida Cyprididae Heterocypris incongruens (Ramdohr 1808) Pontocypris mytiloides (Norman 1862) Cirripedia Thoracica Lepadomorpha Pollicipes pollicipes (Gmelin (1789) Facetotecta Balanomorpha Semibalanus balanoides (Linneaus 1758) Acrothoracica xxx Rhizocephala too derived too derived Ascothoracica not available Cephalocarida Lightiella Lightiella incisa (Gooding 1963) Anostraca Artemiidae Artemia (Leach 1819) sp. Branchiopodidae Branchipus schaefferi (Fischer 1834) Notostraca Triopsidae Triops cancriformis (Bosc 1801) Cladocera Haplopoda Leptodoridae Leptodora kindtii (Focke 1844) Spinicaudata Eucladocera Daphniidae Daphnia magna (Straus 1820) Polyphemus pediculus (Linneaus 1761) Bosmiidae Bosminia (Baird, 1845) sp. Caenestheria (Daday 1914) sp. Laevicaudata Lynceus brachyurus (Muller 1776) Remipedia Speleonectidae Speleonectes tulumensis (Yager 1987) Branchiura Argulus foliacaeus (Linnaeus 1758) Pentastomida Raillitiella (Sambon 1910) sp. Leptostraca Nebaliidae Sarsinebalia urgorrii (Moreira, Gestoso & Troncoso 2003) Stomatopoda Squilla mantis (Linneaus 1758) Pantopoda Nymphon stroemii (Kroyer 1844) Colossendeis (Jarzinsky 1870) sp.
158 9. Supplement Molecular insights to crustacean phylogeny Table S2 Localities and fixation methods for collected specimens. Collectors of specimes and collection date are additionally given. Major group Taxon Collection Locality date Collector Fixation Mystacocarida Derocheilocaris typicus Playa dos ninos, Ferrol, Galicia, Spain 2006 v. Reumont 98% Ethanol Copepoda Tigriopus fulvus Vigo, Galicia, Spain 2006 v. Reumont 98% Ethanol Canuella perplexa Hooksiel, Niedersachsen, Germany 2005 v. Reumont 98% Ethanol Cyclops sp. Wahner Heide, Nord-Rhein-Westfalia, Germany Ostracoda Heterocypris incongruens Hirschweiher, Röttgen, Nord-Rhein-Westfalia, Germany Pontocypris mytiloides Wilhelmshaven, Niedersachsen, Germany Podocopida Campese Bay, Isla di Giglioi, Italy (bait trap, 15m depth) 2005 v. Reumont 98% Ethanol 2005 v. Reumont 98% Ethanol 2007 v. Reumont 98% Ethanol 2008 v. Reumont 98% Ethanol RNAlater Cirripedia Pollicipes pollicipes Ferrol supermercado, Galicia, Spain 2006 v. Reumont 98% Ethanol RNAlater Semibalanus balanoides Hooksiel, Niedersachsen, Germany 2006 v. Reumont 98% Ethanol Cephalocarida Lightiella incisa Carry Bow Cay, Barrier Reef, Belize 2008 Ott 98% Ethanol Anostraca Artemia sp. Tegler See, Berlin, Germany 2005 Braband DNA-sample Branchipus schaefferi Marchauen, Austria 2006 Eder 98% Ethanol Notostraca Triops cancriformis Marchauen, Austria 2005 Eder 98% Ethanol RNAlater Cladocera Leptodoria Tegler See, Berlin, Germany 2005 Braband DNA-sample Daphnia sp. Bonn, Nord-Rhein-Westfalia, 2005 v. Reumont 98% Ethanol Germany Polyphemus pediculus Tegler See, Berlin, Germany 2005 Braband DNA-sample Bosminia Tegler See, Berlin, Germany 2005 Braband DNA-sample Spinicaudata Caenestheria berneyi Tegler See, Berlin, Germany 2005 Braband DNA-sample Laevicaudata Lynceus brachyurus Tegler See, Berlin, Germany 2005 Braband DNA-sample Remipedia Speleonectes tulumensis Cenote Eden, Puerto Aventuras, 2006 Koenemann 98% Ethanol Quintana Roo, Mexico Speleonectes tulumensis Cenote Crustacea, Akumal, Quintana Roo, Mexico v. Reumont 98% Ethanol RNAlater Branchiura Argulus foliacaetus Sweden 2007 Waloßek 98% Ethanol Argulus foliacaetus Bochum, fishpond, 2006 Strieso 98% Ethanol Nord-Rhein-Westfalia, Germany Pentastomida Raillitiella sp. Asia, 2007 v. Reumont 98% Ethanol host: Hemidactylus cf. frenatus Leptostraca Sarsinebalia urgorrii Ria Ferrol, Ferrol, Galicia, Spain v. Reumont 98% Ethanol RNAlater Stomatopoda Squilla mantis Porto San Stefano, Italy 2007 v. Reumont 98% Ethanol Pantopoda Nymphon stroemii Hinlopen Svalbard, Arctica 2003 Krapp 98% Ethanol Colosseides spec. ANDEEP I Expedition, Ant XIX-3, Antarctica 2002 Raupach 94% Ethanol ii
159 Molecular insights to crustacean phylogeny 9.Supplement Table S3 Primer list for all amplified and sequenced fragments. Primer sequences are given in 5 to 3 prime end direction. References and modifications are given for each primer. PCR indicates the use of primers in the PCR reaction, CS indicates that primer were applied for cycle sequencing. For combination of used primers see Figure S1. Marker Primer name Reaction Sequence (in 5' - 3' direction) Direction Reference 16S rrna 16Sa PCR & CS CGCCTGTTTATCAAAAACAT forward Palumbi et al. (1991) 16S rrna 16Sb PCR & CS CCGGTCTGAACTCAGATCACG reverse Palumbi et al. (1991) 16S rrna LRJ12887 PCR & CS CCGGTCTGAACTCAGATCACGT forward Simon et al. (1994) 16S rrna LRN13398 PCR & CS CGCCTGTTTAACAAAAACAT reverse Simon et al. (1994) 18S rrna 18A1 PCR & CS CTGGTTGATCCTGCCAGTCATATGC forward Dreyer & Wägele (2001) 18S rrna 1800 PCR & CS GATCCTTCCGCAGGTTTCACCTACG reverse Dreyer & Wägele (2001) 18S rrna 700 F-MR CS GCCGCGGTAATTCCAGC forward Raupach unpubl. 18S rrna 700R CS CGCGGCTGCTGGCACCAGAC reverse Dreyer & Wägele (2001) 18S rrna 1000F CS CGATCAGATACCGCCCTAGTTC forward Dreyer & Wägele (2001) 18S rrna 1155R CS CCGTCAATTCCTTTAAGTTTCAG reverse Dreyer & Wägele (2001) 18S rrna 1250 FN-MR CS GGCCGTTCTTAGTTGGTGGAG forward Raupach unpubl. 18S rrna 1500R CS CATCTAGGGCATCACAGACC reverse Wollscheid et al. unpubl. 28S rrna CS632 PCR & CS CGATGAAGAACGCAGC forward Schlötterer et al. (1994) 28S rrna 427 or D1a PCR & CS CCC(C/G)CGTAA(T/C)TTAAGCATAT forward Friedrich & Tautz (1997) 28S rrna D2a PCR & CS GATAGCGAACAAGTACC forward Dell'Ampio et al. (2009) 28S rrna D3a PCR & CS GACCCGTCTTGAAACACGGA forward Nunn et al. (1996) 28S rrna D3b.rev.MOD PCR & CS TAGTAGCTGGTTCCTTCCG forward Nunn et al. (1996), modif. reverse D3b, Dell'Ampio et al. (2009) 28S rrna 742 or D5a PCR & CS CTCAAACTTTAAATGG forward Friedrich & Tautz (1997) 28S rrna 28ee.mod PCR & CS CCGCTAAGGAGTGTGTAAC forward Hillis & Dixon (1991), modif. Dell'Ampio, unpubl. (PHDthesis) 28S rrna 476 or D7a1 PCR & CS CTGAAGTGGAGAAGGGT forward Friedrich & Tautz (1997) 28S rrna D7aN PCR & CS AGAACCTGGTGACGGAAC forward Dell'Ampio, unpubl. (PHDthesis) 28S rrna D7b.rev PCR & CS ATGTAGGTAAGGGAAGTC forward Friedrich & Tautz (1997), reverse D7b, Dell'Ampio et al. (2009) 28S rrna D7b.rev.MOD PCR & CS GATCCGTAACTTCG forward Friedrich & Tautz (1997), reverse D7b modif., Dell'Ampio et al. (2009) 28S rrna D8aN PCR & CS TCAGAACTGGCACGGACCGG forward Dell'Ampio, unpubl. (PHDthesis) 28S rrna 28v PCR & CS AAGGTAGCCAAATGCCTCATC forward Hillis & Dixon (1991) 28S rrna 28w PCR & CS CCT(G/T)TTGAGCTTGACTCTAATCTG forward Hillis & Dixon (1991) 28S rrna D10aPC PCR & CS GGGGAGTTTGACTGGGGCGG forward Dell'Ampio et al. (2009) 28S rrna D12aN PCR & CS GAGCAAGAGGTGTCAGAAAAGTTAC forward Dell'Ampio, unpubl. PHDthesis 28S rrna D1a.rev PCR & CS ATATGCTTAAATTAAGCGGG reverse Friedrich & Tautz (1997), reverse D1a, Dell'Ampio 28S rrna D1b2 PCR & CS CGTACTATTGAACTCTCTCTT reverse Dell'Ampio et al. (2002) 28S rrna D3a.rev PCR & CS TCCGTGTTTCAAGACGGGAC reverse Nunn at al. (1996), reverse D3a, Dell'Ampio, unpubl. (PHDthesis) 28S rrna D3b PCR & CS TCCGGAAGGAACCAGCTACTA reverse Nunn et al. (1996) iii
160 9. Supplement Molecular insights to crustacean phylogeny 28S rrna 706 or D5b2 PCR & CS CGCCAGTTCTGCTTACC reverse Friedrich &Tautz (1997) 28S rrna 689 or D5b1 PCR & CS ACACACTCCTTAGCGGA reverse Friedrich & Tautz ( S rrna D7a1.rev PCR & CS AAACCCTTCTCCACATCGG reverse Friedrich & Tautz (1997), reverse D7a1.rev, Dell'Ampio et al. (2009) 28S rrna 477 or D7b PCR & CS GACTTCCCTTACCTACAT reverse Friedrich & Tautz (1997) 28S rrna D7bNLe PCR & CS GGACCCGACGGATTCTC reverse Dell'Ampio 28S rrna 23 or 28f PCR & CS CAGAGCACTGGGCAGAAATCAC reverse Dell'Ampio, unpubl. (PHDthesis) 28S rrna 28w.rev PCR & CS CAGATTAGAGTCAAGCTCAACAGG reverse Hillis & Dixon (1991), reverse 28w, Dell'Ampio et al. subm 28S rrna 28jj PCR & CS AGTAGGGTAAAACTAACCT reverse Hillis & Dixon (1991) 28S rrna D10bN PCR & CS TTTGACAGATGTACCCCCCC reverse Dell'Ampio, unpubl. (PHDthesis) 28S rrna D12b.PLANB PCR & CS GAGTACGACACCCC reverse Dell'Ampio et al. (2009) 28S rrna D12bN PCR & CS TATGGCAGCTGCTCTACC reverse Dell'Ampio, unpubl. (PHDthesis) 28S rrna Mallat.Rv1 PCR & CS ACTTTCAATAGATCGCAG reverse Mallat & Sullivan (1998) COI HCO PCR & CS TAAACTTCAGGGTGACCAAAAAATCA forward Folmer et al. (1994) COI LCO PCR & CS GGTCAACAAATCATAAAGATATTGG reverse Folmer et al. (1994) PRIMER REFERENCES DELL`AMPIO, E., CARAPELLI, A. & FRATI, F. (2002). Secondary structure and sequence variation of the 28S rrna gene in the Neanuridae, and its utility as a phylogenetic marker: Proceedings of the Xth international Colloquium on Apterygota, Ceske Budejovice 2000: Apterygota at the Beginning of the Third Millennium. Pedobiologia (Jena) 46, DELL'AMPIO, E., SZUCSICH, N., CARAPELLI, A., FRATI, F., STEINER, G., STEINACHER, A. & PASS, G. (2009). Testing for misleading effects in the phylogenetic reconstruction of ancient lineages of hexapods: influence of character dependence and character choice in analyses of 28S rrna sequences. Zoologica Scripta, 38, DREYER, H. & WÄGELE, J. W. (2001). Parasites of crustaceans (Isopoda: Bopyridae) evolved from fish parasites: molecular and morphological evidence. Zoology (Jena) 103, FOLMER, O., BLACK, M.; HOEH, W., LUTZ, R., VRIJENHOEK, R. (1994). DANN primers for amplification of mitochondrial cytochrome c oxidase subunit I from diverse metazoan invertebrates. Molecular Marine Biology Biotech 3: FRIEDRICH, M. & TAUTZ, D. (1997). An episodic change of rdna nucleotide substitution rate has occurred during the emergence of the insect order Diptera. Molecular Biology and Evolution 14, HILLIS, D. M. & DIXON, M. T. (1991). Ribosomal DNA: molecular evolution and phylogenetic inference. The Quarterly review of biology 66, MALLATT, J. & SULLIVAN, J. (1998). 28S and 18S rdna sequences support the monophyly of lampreys and hagfishes. Molecular Biology and Evolution 15, NUNN, G. B., THEISSEN, B. F., CHRISTENSEN, B. & ARCTANDER, P. (1996). Simplicity-correlated size growth of the nuclear 28S ribosomal RNA D3 expansion segment in the crustacean order Isopoda. Journal of Molecular Evolution 42, PALUMBI, S. R., MARTIN, A., ROMANO, S., MCMILLAN, W. O., STICE, L., GRABOWSKI, G. (1991). The simple fools guide to PCR. A collection of PCR protocols, version 2. Honolulu, University of Hawai. SCHLÖTTERER, C., HAUSER, M. T., VON HAESELER, A. & TAUTZ, D. (1994). Comparative evolutionary analysis of rdna ITS regions in Drosophila. Molecular Biology and Evolution 11, SIMON, C., FRATI, F., BECKENBACH, A., CRESPI, B., LIU, H., FLOOK, P. (1994). Evolution, weighting and phylogenetic utility of mitochondrial gene sequences and a compilation of conserved polymerase chain reaction primers. Annals of the Emtomological Society of America 87, iv

161 Molecular insights to crustacean phylogeny 9.Supplement Figure S1 Primer card. Used primers and their positions for the 18S (A) and the 28S rrna genes are shown. Green arrows mark the position of forward primers, red arrows the position of reverse primers. In case that different primers were used for the same position combined primers are given on the specific arrow. The 18S in crustaceans was amplified in one PCR product (18A1/1800) and sequenced with eight primers (700F, 1000F, 1155F, 1250FN, 700R, 1000R, 1155R and 1500R), see table S3. Unless otherwise noted all applied protocols refer to manufacturers advices. The PCR-Multiplex- Kit (Qiagen) was used to prevent pooling of weak PCR products, in case this failed, weak PCR products were pooled for purificaton. PCR Products were purified with the NucleoSpin Extract II (Macherey-Nagel). Purified products were checked on agarose gel. To estimate the DNA concentration a mass marker (BioRad) and Nanodrop Spectrophotometer ND-1000 (peqlab) was used. The nuclear 28S rrna gene was amplified in nine overlapping fragments using following primer combinations: CS632/D1b2, D1a/D3b, D2a/D3a.rev, D3a/D5b1, D5a/D7b, D7a1/28f, D7b.rev/28w.rev, 28v 28jj and D12aN/D12bN or alternatively D12aN/D12bPLANB, D12aN/D12bMYR or D12aN/MallatRv1. Different primer combinations were used whenever necessary for specific taxa. Alternative combinations for crustaceans are: D3b.rev/D5b2, D3b.rev/D5b1, D1a/D5b1, D1a/D5b2, D2a/D5b1, D2a/D5b2, D3a/D5b2, D7aN/28f, D7b.rev/28f, D7brev/D10bN, D10aPC/D12bN and D12aN/D12b.PLANB. Cycle Sequencing reactions were performed using DNA Quick Start Mastermix (Beckman Coulter). CS products were ethanol-precipitated or purified with CleanSeq magnetic bead system (Agencourt) followed by sequencing on Beckman Coulter capillary sequencers CEQTM 8000 and v
162 9. Supplement Molecular insights to crustacean phylogeny CEQTM Table S4 Used PCR chemicals. The two different chemical mixes are given. Concentration of primers and the use of DMSO was tested in different gradients and varied in for the reactions. Cycle sequencing was conducted following the Beckmann Coulter protocol for the 8000/8800 capillary sequencers. PCR= Polymerase chain reaction, HPLC= High Performance Liquid Chromatography, dntps= di-nucleotidetriphosphate. PCR reaction mix Chemicals [Concentration] Volume Gene Specifications (A) Reagents (SIGMA) 18S, 28S 28S : Different MgCl 2 - gardients, PCR-profile 10 x PCR buffer without 1; MgCl l 12S, 16S, 18S : DMSO replaced MgCl 2 [25 mm] 5.0 l H3, COI, by sterile water dntps [2 mm] 4.0 l DMSO 2.5 l Primer forward [10 pmol/ l] 0.8 l Primer reverse [10 pmol/ l] 0.8 l Taq-Polymerase [5 u/ l] 0.15 l HPLC-H 2 O l DNA template l total volume 50 l generally test gradients for each gene fragment were performed to settle the optimal PCR reaction set. DMSO and MgCl2 concentrations varied (B) Reagents (Qiagen) 18S, 28S generally test gradients for each Multiplex Mastermix (incl. gene fragment were mixture of taq, dntps, performed to settle MgCl 2, reaction buffer 10.0 l 12S, 16S, the optimal PCR 2 l Q-solution 2.0 l H3, CO I reaction set. DMSO 1.6 l Primer forward [10 pmol/ l] 1.6 l and MgCl2 concentrations varied 1.6 l Primer reverse [10 pmol/ l] 1.6 l HPLC-H 2 O 4.3 l DNA template l total volume 20 l Table S5 PCR temperature profiles. Temperature is given in Celsius C, the runtime in minutes. TD= touchdown. Profile Temperature profile Cycles Gene Thermocycler Remarks / Primer specification 1 94 C 3:00 min 16S, COI 94 C 0:35 min 15 cycles 18S, 28S 60 C 0:30 min, TD -1 C to 45 C 72 C 1:30 min 94 C 0:35 min 25 cycles 50 C 0:30 min GeneAmp PCR System 2720, GeneAmp PCR System 2700, (Applied Biosystems) T3000 Thermocycler Depending on fragments and taxa the 1st annealing temperature varied from 60 C-45 C or 55 C-40 C or 50 C-35 C. In each cycle the temperature was decreased by 1 C. vi
163 Molecular insights to crustacean phylogeny 9.Supplement 72 C 1:30 min 72 C 10:00 min 4 C 2 94 C 3:00 min 18S, 28S 94 C 1:00 min 15 cycles 60 C 0:30 min, TD -1 C to 45 C 72 C 1:30 min 94 C 0:35 min 25 cycles 50 C 0:30 min 72 C 1:30 min 72 C 12:00 min 4 C 3 94 C 5:00 min 18S, 28S 94 C 1:00 min 15 cycles 60 C 0:35 min, TD -1 C to 45 C 72 C 1:30 min 94 C 0:35 min 25 cycles 50 C 0:30 min 72 C 1:30 min 72 C 10:00 min 4 C 4 94 C 4:00 min 18S, 28S 94 C 1:00 min 15 cycles 60 C 1:00 min, TD -1 C to 45 C 72 C 1:30 min 94 C 1:00 min 25 cycles 50 C 0:35 min 72 C 1:30 min 72 C 12:00 min 4 C (Biometra) GeneAmp PCR System 2720, GeneAmp PCR System 2700, (Applied Biosystems) T3000 Thermocycler (Biometra) GeneAmp PCR System 2720, GeneAmp PCR System 2700, (Applied Biosystems) T3000 Thermocycler (Biometra) GeneAmp PCR System 2720, GeneAmp PCR System 2700, (Applied Biosystems) T3000 Thermocycler (Biometra) Depending on fragments and taxa the 1st annealing temperature varied from 60 C-45 C or 55 C-40 C or 50 C-35 C. In each cycle the temperature was decreased by 1 C. Depending on fragments and taxa the 1st annealing temperature varied from 60 C-45 C or 55 C-40 C or 50 C-35 C. In each cycle the temperature was decreased by 1 C. Depending on fragments and taxa the 1st annealing temperature varied from 60 C-45 C or 55 C-40 C or 50 C-35 C. In each cycle the temperature was decreased by 1 C C 3:00 min 16S, COI 94 C 1:00 min 15 cycles 18S, 28S 60 C 0:30 min, TD -1 C to 45 C 72 C 1:30 min 94 C 0:35 min 25 cycles 50 C 0:30 min 72 C 1:30 min 72 C 10:00 min 4 C Applied Biosystems 9600 Depending on fragments and taxa the 1st annealing temperature varied from 60 C-45 C or 55 C-40 C or 50 C-35 C. In each cycle the temperature was decreased by 1 C. vii
164 9. Supplement Molecular insights to crustacean phylogeny Table S6 Overview of sequenced genes for the collected specimens. Green plus indicates the sequencing and implementation into analyses of the sequence. A circle represents sequences that were not successfully sequenced. A minus incdicates that the amplification was not successful at all. For the NCBI accession numbers see the taxon lists of each analysis. taxon group species sequenced genes Standard Fragments and additional Genes 16S rrna 18S rrna 28S rrna CO I Crustacea out group C02 Ostracoda Heterocypris incongruens C01 Notostraca Triops cancriformis C10 Mystacocarida Derocheilocaris typica C16 Copepoda Canuella perplexa C21 Tigriopus fulvus C18 Pontocypris mytiloides C17 Cirripedia Pollicipes pollicipes C37 Semibalanus balanoides C38 Branchiura Argulus foliaceus C44 Anostraca Branchipus schaefferii + + o + C32 Cladocera Daphnia sp C34 Bosmina sp C56 Polyphemus pediculus C53 Spinicaudata Caenestheria berneyi C51 Laevicaudata Lynceus brachyurus C42 Remipedia Speleonectes tulumensis + + o + C14 Leptostraca Nebalia spec C63 Stomatopoda Squilla mantis C68 Cephalocarida Lightiella incisa + o o + C65 Pentastomida Raillietiella sp. + o o + C28 Pantopoda Nymphon stroemii C40 Colosseides spec viii
165 Molecular insights to crustacean phylogeny 9.Supplement Table S7 Taxa list for analysis A. List of genetic markers, specimens and taxa used for the phylogenetic analysis. Sequences obtained from GenBank are shown by accession numbers (Acc. no.); new sequences from this thesis are colored in bold green. Gene sequences that we were unable to acquire are marked as n/a. Classification of Crustacea is according to Martin and Davis (2001). Sequences marked with 1 were sequenced by the group Koenemann in Hannover. * 18S sequences for Labidura riparia consisted of three, noncontiguous fragments. CRUSTACEA Acc. no. COI Acc. no. 16S Acc. no. 18S Remipedia Speleonectidae Speleonectes tulumensis NC_ NC_ L81936 Godzilliidae Pleomotra apletocheles xxx 1 xxx 1 xxx 1 Branchiopoda Anostraca Artemia franciscana NC_ NC_ AJ Notostraca Triops cancriformis GQ GQ EU Diplostraca Laevicaudata Lynceus brachyurus +L. macleyanus DQ GQ GQ Spinicaudata Eulimnadia braueriana EF EF EF Cyclestherida Cyclestheria hislopi DQ EF AF Cladocera Anomopoda Daphnia magna + D. cf. magna AY GQ EU Ctenopoda Sida crystallina AF DQ AM Onychopoda Polyphemus pediculus GQ GQ EF Haplopoda Leptodora kindtii DQ GQ AF Malacostraca Stomatopoda Squilla mantis GQ GQ GQ Leptostraca Paranebalia longipes n/a AY EF Syncarida Anaspidacea Anaspides tasmaniae DQ AF L81948 Eucarida Euphausiacea Euphausia pacifica AF AF AY Meganyctiphanes norvegica AY AY DQ Decapoda Dendrobranchiata Penaeus monodon + P. NC_ NC_ DQ semisulcatus Pleocyemata Stenopodidea Stenopus hispidus AF AY AY Anomura Eumunida sternomaculata EU AY AF Palinura Jasus verreauxi AF AF AF Astacidea Parastacus pugnax EF AF AF Brachyura Carcinus maenas FJ AJ AY Caridea Atyoida bisulcata n/a EF DQ Peracarida Mysida Mysis oculata EF DQ AM Lophogastrida Neognathophausia ingens DQ n/a AM Mictacea Thetispelecaris remex n/a n/a AY Amphipoda Orchestia cavimana EF AY AY Gammarus pulex EF AJ EF Isopoda Ligia oceanica NC_ NC_ AF Colubotelson thomsoni AF AF AF Cumacea Diastylis sculpta + D. sp. AF U81512 Z22519 Tanaidacea Tanaidacea sp. AF n/a AY Spelaeogriphacea Spelaeogriphus lepidops n/a n/a AY Thermosbaenacea Tethysbaena argentarii n/a DQ AY ix
166 9. Supplement Molecular insights to crustacean phylogeny x Maxillopoda Mystacocarida Derocheilocaris typicus 1 GQ n/a EU Derocheilocaris typicus 2 GQ n/a L81937 Copepoda Calanoida Calanus pacificus AF AF L81939 Harpacticoida Cletocamptus deitersi AF AF n/a Tigriopus cf. fulvus n/a n/a EU Cyclopoida Stellicola sp. DQ n/a AY Cyclopoida Thermocyclops inversus + T. sp. EU n/a DQ Siphonostomatoida Caligus elongatus EF AY AY Ostracoda Myodocopa Myodocopida Parasterope gamurru n/a EU EU Halocyprida Polycope japonica n/a n/a AB Podocopa Platycopida Cytherella leizhouensis n/a n/a AB Podocopida Cypridocopina Heterocypris incongruens n/a GQ EU Branchiura Arguloida Argulus nobilis n/a n/a M27187 Arguloida Dolops ranarum + D. sp. DQ n/a DQ Pentastomida Cephalobaenida Raillitiellia sp. n/a n/a EU Thecostraca Facetotecta Hansenocaris itoi n/a n/a AF Ascothoracida Dendrogaster asterinae n/a n/a AF Ulophysema oeresundense n/a n/a L26521 Cirripedia Sessilia Semibalanus balanoides GQ GQ EU Pedunculata Pollicipes pollicipes GQ GQ EU Kentrogonida Heterosaccus californicus n/a AY AY Cephalocarida Hutchinsoniella macracantha AY AY L81935 Lightiella incisa GQ n/a GQ HEXAPODA Protura Sinentomata Fujientomon dicestum n/a n/a AY Acerentomata Neocondeellum dolichotarsum n/a n/a AY Diplura Campodea fragilis + C. tillyardi DQ NC_ AF Collembola Sminthurinus bimaculatus AY AY AY Insecta Archaeognatha Trigoniophthalmus alternatus NC_ NC_ U65106 Zygentoma Tricholepidion gertschi AY AY AF Pterygota Callibaetis ferrugineus AY AF AF Lestes rectangularis n/a EF FJ Neoptera Echinosoma yorkense n/a AY AY Labidura riparia* AB AY U65114, AY707333, AY Ceuthophilus gracilipes + C. AY AY AY uthaensis Tipula sp. AY EU X89496 Anopheles gambiae + A. DQ L20934 L78065 albimanus MYRIAPODA Chilopoda Thereuopoda clunifera AY AY AF119088
167 Molecular insights to crustacean phylogeny 9.Supplement Symphyla Scutigerella causeyae 1 DQ DQ AY Scutigerella causeyae 2 DQ DQ AF Pauropoda Allopauropus sp. n/a n/a DQ Diplopoda Polyxenus lagurus AF n/a X90667 CHELICERATA Pycnogonida Austrodecus glaciale DQ DQ DQ Nymphon sp. GQ GQ EU Colossendeis sp. GQ GQ EU Xiphosura Limulus polyphemus AF AF L81949 Arachnida Araneae Atrax sp. n/a AF AF Hypochilus thorelli + H. pococki NC_ NC_ AF Scorpiones Pandinus imperator AY AY AY Androctonus australis AJ AJ X77908 Acari Amblyomma triguttatum AB AB AF Opiliones Siro valleorum AY AY AY Uropygi Mastigoproctus giganteus NC_ NC_ AF ONYCHOPHORA Peripatidae Epiperipatus biolleyi + NC_ NC_ U49910 Euperipatoides leuckarti TARDIGRADA Heterotardigrada Echiniscus testudo EF n/a DQ xi
168 9. Supplement Molecular insights to crustacean phylogeny Table S8 Pretests for the Bayes Factor Tests (BFT). Best harmonic means of the model likelihood was reached in runs D1 and F1. D1 was consequently the 0-hypothesis in the BFT (A) and F1 the 0-hypothesis in BFT (B). All other hypotheses (ln likelihoods of remaining runs) were tested against these. Testruns run A1 run A2 run B1 run B2 run C1 run C2 run C3 run D1 run D2 run F1 run F3 Align. prog. muscle muscle muscle muscle mafft mafft mafft mafft mafft mafft mafft Optimization RNAsalsa RNAsalsa RNAsalsa RNAsalsa RNAsalsa RNAsalsa RNAsalsa RNAsalsa RNAsalsa Aliscore (-r) Aliscore (-r) Aliscore (-r) Aliscore (-r) Aliscore (-r) Aliscore (-r) Aliscore (-r) Aliscore (-r) Aliscore (-r) Alicut Alicut Alicut Alicut Alicut Alicut Alicut Alicut Alicut RY-coded RY-coded Model nst=6 nst=6, r-diff nst=6 nst=6, r-diff nst=6 nst=6, r-diff nst=2, r-diff nst=6 (all) nst=2 (all) nst=2 + 1 nst=2 + 1 gamma gamma gamma gamma gamma gamma gamma gamma gamma 5 partitions, unlinked 5 partitions, unlinked 5 partitions, unlinked 5 partitions Iterations 20 mio. 20 mio. 20 mio. 20 mio. 20 mio. 20 mio. 30 mio 20 mio 20 mio 30 mio 30 mio Excluded burnin 7 mio. 7 mio. 7 mio. 7 mio. 7 mio. 7 mio. 7 mio 7 mio 7 mio 7 mio 7 mio n-chains 2 x 4 2 x 4 2 x 4 2 x 4 2 x 4 2 x 4 2 x 4 2 x 4 2 x 4 2 x 4 2 x 4 HarMean BFT not included not included A A A A A A A B B Hypothesis Hypothesis ln (B10) ln (B10) H H xii
169 Molecular insights to crustacean phylogeny 9.Supplement Table S9 Finalruns for the final Bayes Factor Tests (BFT). Best harmonic means of the model likelihood was reached in finalruns 4 and 5. But the topologies of these runs showed no resolution, obviously affected by the MUCLE alignment reconstruction. Thus finalrun 1 and finalrun 3 were chosen as best models. Finalrun 1 was consequently the 0-hypothesis in the BFT (A) and finalrun 3 the 0-hypothesis in BFT (B). For resulting topologies of all runs see figures S2-S11. Testruns finalrun 1 finalrun 2 finalrun 3 finalrun 4 finalrun 5 finalrun 6 finalrun 7 finalrun 8 finalrun 9 finalrun 10 Align. prog. mafft mafft mafft muscle muscle by hand by hand by hand by hand mafft Optimization RNAsalsa RNAsalsa RNAsalsa RNAsalsa RNAsalsa alignment RNAsalsa RNAsalsa RNAsalsa Aliscore (r) Aliscore (r) Aliscore (r) Aliscore (r) Aliscore (r) masked Aliscore (r) Aliscore (r) Aliscore (r) Alicut Alicut Alicut Alicut Alicut by hand Alicut Alicut Alicut RYcoded RYcoded RYcoded RYcoded RYcoded RYcoded RYcoded Model nst=2 + 1 nst=2 + 1 nst=2 + 1 nst=2 + 1 nst=2 + 1 nst=2 + 1 nst=2 + 1 nst=2 + 1 nst=2 + 1 gamma gamma invgamma gamma gamma 5 partitions 5 partitions 5 partitions 5 partitions 5 partitions 3 partitions 3 partitions 3 partitions 3 partitions RAXML iierations 40 mio 40 mio 40 mio 40 mio 40 mio 40 mio 40 mio 40 mio 40 mio Excluded burnin unlinked unlinked unlinked unlinked unpartitioned Alignment positions HarMean BFT Hypothesis Not included Not included Hypothesis 0 H ln (B10) ln (B10) xiii
170 9. Supplement Molecular insights to crustacean phylogeny Table S10 Taxa list of sampled sequences for analysis B. An aterisk (*) at species names indicates concatenated 18S and 28S rrna sequences form different species. For combinations of genes to reconstruct concatenated sequences of chimeran taxa see table S11. Two aterisks (**) indicate contributed sequences in the present study from colleagues (author names of sequences are given). Own sequences are marked in bold green. Order Taxon Accession number 28S rrna xiv Length (bp) 28S rrna Accession number 18S rrna Arachnida Amblyomma americanum AF AF Dermacentor sp. * AY L Chalocheiridius cf. termitophilus AY AY Pandinus imperator AY AY Siro rubens AY U Eremobates sp. AY AY Aphonopelma hentzi * AY DQ Misumenops asperatus AY AY Mastigoproctus giganteus AY AF Paraphrynus sp. AY AF Xiphosura Limulus polyphemus AF L Pycnogonida Callipallene sp. AY AF Colossendeis sp. EU ** 3864 EU ** 1798 (v. Reumont) (v. Reumont) Anoplodactylus portus AY AY Nymphon stroemii EU ** 3818 EU ** 1825 (v. Reumont) (v. Reumont) Anostraca Artemia sp. * AY AJ Notostraca Triops cancriformis EU ** 3420 EU ** 1784 (v. Reumont) (v. Reumont) Triops longicaudatus AY AF Diplostraca Daphnia cf. magna EU ** 3823 EU ** 2291 (v. Reumont) (v. Reumont) Bosmina sp. * EU ** 3332 Z (v. Reumont) Eulimnadia texana AY AF Ostracoda Heterocypris incongruens EU ** 3279 EU ** 1786 (v. Reumont) (v. Reumont) Pontocypris mytiloides EU ** 3672 EU ** 1897 (v. Reumont) (v. Reumont) Cirripedia Semibalanus balanoides EU ** 3274 EU ** 1847 (v. Reumont) (v. Reumont) Megabalanus californicus AY AY Pollicipes pollicipes EU ** 3549 EU ** 1852 (v. Reumont) (v. Reumont) Branchiura Argulus foliaceus EU ** 3512 EU ** 1851 (v. Reumont) (v. Reumont) Mystacocarida Derocheilocaris typicus EU ** 3663 EU ** 2171 (v. Reumont) (v. Reumont) Copepoda Cyclopidae sp. * AY AJ Chondracanthus lophii DQ L Tigriopus cf. fulvus EU ** 3532 EU ** 1792 (v. Reumont) (v. Reumont) Canuella perplexa EU ** 3462 EU ** 1573 (v. Reumont) (v. Reumont) Lepeophtheirus salmonis DQ AF Remipedia Speleonectes tulumensis EU ** (v. Reumont) 3797 EU ** (v. Reumont) / L81936 Cephalocarida Hutchinsoniella macracantha EF L Leptostraca Nebalia sp. EU ** 3519 EU ** 1789 Length (bp) 18S rrna 1302 / 1965
171 Molecular insights to crustacean phylogeny 9. Supplement (v. Reumont) (v. Reumont) Anaspidacea Anaspides tasmaniae AY L Mysidacea Heteromysis sp. AY AY Decapoda Homarus americanus AY AY Penaeus vannamei * AF DQ Stomatopoda Squilla empusa AY L Pentastomida Raillietiella sp. * EU ** (v. Reumont) AY / 1983 EU ** (v. Reumont) 1814 Chilopoda Craterostigmus tasmanianus EU ** 4024 EU ** 1786 (Bartel) (Meusemann) Otostigmus politus DQ DQ Scolopendra mutilans DQ DQ Scutigera coleoptrata AY AF Lithobius forficatus EF EU ** 1752 (Meusemann) Diplopoda Polyxenus lagurus EU ** 3967 EU ** 1733 (Bartel) (Meusemann) Monographis sp. EF ** 3866 AY (Bartel / Luan) Paradoxosomatidae sp. DQ DQ Polydesmus complanatus EU ** 4271 EU ** 1689 (Bartel) (Meusemann) Cherokia georgiana AY AY Orthoporus sp. AY AY Cylindroiulus caeruleocinctus EF EU ** 1753 (Meusemann) Pauropoda Allopauropus sp. DQ DQ Pauropodidae sp. EU ** 4238 EU ** 2250 (Bartel) (Meusemann) Symphyla Scutigerella sp. DQ DQ Hanseniella sp. AY AY Symphylella sp. DQ DQ Protura Acerentomon franzi EF EU ** 1790 (Meusemann) Baculentulus densus * EU AY Eosentomon sp. EU ** 3654 EU ** 1860 (Dell'Ampio) (Meusemann) Eosentomon sakura EF ** 3789 AY (Dell'Ampio / Luan) Sinentomon erythranum EF ** 4043 AY (Dell'Ampio / Luan) Diplura Campodeidae sp. AY AY Campodea augens EF EU ** 1788 (Meusemann) Lepidocampa weberi EU AY Catajapyx aquilonaris EF EU ** 2154 (Meusemann) Parajapyx emeryanus EF ** 4143 AY (Dell'Ampio / Luan) Octostigma sinensis EF ** 4001 AY (Dell'Ampio / Luan) Collembola Tetrodontophora bielanensis EU AY Gomphiocephalus hodgsoni EF EU ** 1746 (Meusemann) Triacanthella sp. AY AY Bilobella aurantiaca AJ EU ** 1759 xv
172 9. Supplement Molecular insights to crustacean phylogeny (Meusemann) Anurida maritima AJ EU ** 1680 (Meusemann) Podura aquatica EF EU ** 1696 (Meusemann) Cryptopygus antarcticus EF EU ** 1724 (Meusemann) Isotoma viridis EU AY Orchesella villosa EF EU ** 1739 (Meusemann) Pogonognathellus flavescens EU EU ** 1688 (Meusemann) Megalothorax minimus EF EU ** 1703 (Meusemann) Sminthurus viridis EF EU ** 1695 (Meusemann) Allacma fusca EU EU ** 1759 (Meusemann) Dicyrtomina saundersi EF EU ** 1739 (Meusemann) Archaeognatha Machilis hrabei EF EU ** 1703 (Meusemann) Lepismachilis y-signata EF EU ** 1679 (Meusemann) Pedetontus okajimae EU EU ** 1742 (Meusemann) Zygentoma Lepisma saccharina EU ** 3506 EU ** 1703 (Dell'Ampio) (Meusemann) Ctenolepisma longicaudata AY EU ** 1744 (Meusemann) Odonata Brachytron pratense EU ** 3738 AF (Letsch) Aeshna juncea EU ** 3736 AF (Letsch) Oxygastra curtisi EU ** 3736 DQ (Letsch) Cordulia aenea EU ** 3795 AF (Letsch) Somatochlora flavomaculata EU ** 3795 AF (Letsch) Epiophlebia superstes EU ** 3736 AF (Letsch) Progomphus obscurus EU ** 3756 AY (Letsch) Sympetrum danae EU ** 3756 AF (Letsch) Leucorrhinia sp. AY AY Lestes viridis EU ** 3747 AJ (Letsch) Ephemeroptera Callibaetis ferrugineus AY AF Epeorus sylvicola * EU ** 3680 AY (Simon) Siphlonura aestivalis * EU ** 4151 DQ (Simon) Phasmatodea Carausius morosus EU ** 3737 X (Simon) Bacillus rossius EU ** (Simon) 3889 AY Mantophasmatodea Mantophasma zephyra * EU ** 3383 DQ (Simon) Tyrannophasma gladiator EU ** (Simon) 3878 AY Mantodea Mantis religiosa AY AY xvi
173 Molecular insights to crustacean phylogeny 9. Supplement Hierodula membranacea * EU ** 3603 AY (Simon) Blattaria Gromphadorhina laevigata AY AY Ectobius lapponicus EU ** 4006 DQ (Simon) Blattella germanica AF AF Isoptera Zootermopsis angusticollis AY AY Dermaptera Forficula auricularia EU ** 4016 Z (Simon) Plecoptera Isoperla sp. * EU ** 4299 AF (Simon) Nemoura flexuosa * EU ** 3256 AF (Simon) Hemiptera Pyrrhocoris apterus * EU ** 3389 AY (Simon) Rhaphigaster nebulosa EU ** 3983 X (Simon) Harpocera thoracica * EU ** 3405 AY (Simon) Cercopis vulnerata * EU ** 3615 AY (Simon) Clastoptera obtusa AF AY Pectinariophyes reticulata AF AY Orthoptera Gomphocerinae sp. AY AY Anacridium aegypticum * EU ** 3819 AY (Simon) Acheta domesticus AY X Leptophyes punctatissima * EU ** 3918 AY (Simon) Pholidoptera griseoaptera * EU ** 3950 Z (Simon) Hymenoptera Myrmecia croslandi AB AB Vespula pensylvanica AY AY Nomada sp. * EU ** 3386 AY (Simon) Scolia sp. * EU ** 3405 EF (Simon) Tenthredinidae sp. * EU ** 3472 AF (Simon) Coleoptera Tenebrio sp. * AY X Silpha obscura EU ** 2783 AJ (Simon) Siphonaptera Ctenocephalides felis * EU ** 3333 AF (Simon) Mecoptera Merope tuber DQ AF Boreus hyemalis EU ** 3534 AF (Simon) Lepidoptera Pieris napi * EU ** 3743 AF (Simon) Trichoptera Oxyethira rossi * DQ AF Triaenodes sp. * EU ** 3095 AF (Simon) Diptera Acricotopus lucens AJ AJ Chironomus tentans X X Anopheles albimanus L L Aedes albopictus L X Drosophila melanogaster M M Simulium sanctipauli AF AF Onyphora Peripatus sp. AY AY Peripatoides novaezealandiae AF AF Tardigrada Milnesium sp. * AY U xvii
174 9. Supplement Molecular insights to crustacean phylogeny Table S11 List of chimeran species reconstructed for concatenated 18S and 28S rrna sequences. Crustaceans are marked in bold green. Given subgroups have not necessarily the same hierarchical level. in Table S 10 listed Species 28S rrna Species 18S rrna subgroup* as: Dermacentor sp. * Dermacentor sp. Dermacentor andersoni Ixodoidea Aphonopelma hentzi * Aphonopelma hentzi Aphonopelma reversum Mygalomorphae Artemia sp. * Artemia sp. Artemia franciscana Anostraca Bosmina sp. * Bosmina sp. Bosmina longirostris Cladocera Cyclopidae sp. * Cyclopidae sp. Macrocyclops albidus Cyclopoida Penaeus vannamei * Penaeus vannamei Penaeus semisulsatus Dendrobranchiata Raillietiella sp. * Raillietiella sp. Raillietiella sp. Pentastomida Baculentulus densus * Baculentulus densus Baculentulus tianmushanensis Acerentomata Epeorus sylvicola * Epeorus sylvicola Epeorus longimanus Setisura Siphlonura aestivalis * Siphlonura aestivalis Siphlonura croaticus Pisciforma Mantophasma zephyra * Mantophasma zephyra Mantophasma cf. zephyra Mantophasmatodea Hierodula membranacea Hierodula * membranacea Hierodula schultzei Mantodea Isoperla sp. * Isoperla sp. Isoperla obscura Perloidea Nemoura flexuosa * Nemoura flexuosa Nemoura cinerea Nemouroidea Pyrrhocoris apterus * Pyrrhocoris apterus Dysdercus poecilus Heteroptera Harpocera thoracica * Harpocera thoracica Polymerus castilleja Heteroptera Cercopis vulnerata * Cercopis vulnerata Mahanarva costaricensis Cercopoidea Anacridium Anacridium aegypticum * aegypticum Acrida cinerea Caelifera Leptophyes punctatissima * Leptophyes punctatissima Microcentrum rhombifolium Ensifera Pholidoptera griseoaptera * Pholidoptera griseoaptera Tettigonia viridissima Ensifera Nomada sp. * Nomada sp. Apis mellifera Aculeata Scolia sp. * Scolia sp. Scolia verticalis Aculeata Tenthredinidae sp. * Tenthredinidae sp. Dolerus sp. Tenthredinoidea Tenebrio sp. * Tenebrio sp. Tenebrio molitor Polyphaga Ctenocephalides felis * Ctenocephalides felis Ctenocephalides canis Pulicomorpha Pieris napi * Pieris napi Anthocharis sara Glossata Oxyethira rossi * Oxyethira rossi Oxyethira dualis Spicipalpia Triaenodes sp. * Triaenodes sp. Oecetis avara Integripalpia Milnesium sp. * Milnesium sp. Milnesium tardigradum Apochela Table S12 Setting of exchangeability parameters used for the pre-runs. See GOWRI- SHANKAR & RATTRAY (2007). Parameters time-homogeneous preruns (500,000 and 3,000,000 generations) Model MIXED Tree, proposal priority 1 Model, proposal priority 5 Topology changes, proposal priority 10 Branch lengths, proposal priority 40 xviii
175 Molecular insights to crustacean phylogeny 9. Supplement Model 1, 3, proposal priority 7 Model 2, 4 proposal priority 8 Average rates, proposal priority 1 Frequencies, proposal priority 2 Rate ratios, proposal priority 1 Gamma parameter, proposal priority 1 random seed new seed set for each run Table S 13 Taxa included in analyses. Species are written in capitals represent used proteome data. Taxa included in the optimal data subset were selected by reduction heuristics. represents taxa used to train Hidden Markov Models (HMMs) to predict putative orthologous gene loci. Sources were: dbest = Gene Index Project (gendix) = NCBI Trace Archive =ftp://ftp.ncbi.nih.gov/pub/tracedb, JGI = InParanoidx v6.1 = VectorBase = BeetleBase = SilkDB = UniProt (integr8) = UCSC = Data of C. pipiens quinquefasciatus was kindly provided by the Broad Institute of MIT and Harvard (USA). No. of EST contigs = number of assembled EST contigs. No. of genes orig. data set = number of orthologous genes per taxon in the original data set. No. of genes data subset = number of orthologous genes per taxon in the optimal data subset after performing reduction heuristics. Crustacean taxa are colored in green, onw EST species in bold green. species group source no. of EST contigs no. of genes unreduced dataset Hypsibius dujardini Tardigrada dbest Richtersius coronifer Tardigrada NCBI Trace Archive Epiperipatus sp. TB-2001 Onychophora dbest Peripatopsis sedgwicki Onychophora Burmester Euperipatoides kanangrensis Onychophora NCBI Trace Archive Julida sp. APV-2005 Myriapoda dbest Archispirostreptus gigas Myriapoda Burmester Scutigera coleoptrata Myriapoda NCBI Trace Archive Anoplodactylus eroticus Chelicerata NCBI Trace Archive Endeis spinosa Chelicerata Burmester Limulus polyphemus Chelicerata Burmester Carcinoscorpius rotundicauda Chelicerata dbest Mesobuthus gibbosus Chelicerata dbest Loxosceles laeta Chelicerata dbest Dysdera erythrina Chelicerata dbest Cupiennius salei Chelicerata dbest Araneus ventricosus Chelicerata dbest Acanthoscurria gomesiana Chelicerata dbest Chilobrachys jingzhao Chelicerata dbest no. of genes data subset xix
176 9. Supplement Molecular insights to crustacean phylogeny Ixodes scapularis Chelicerata genidx Ixodes ricinus Chelicerata dbest Amblyomma variegatum Chelicerata genidx Amblyomma americanum Chelicerata dbest Amblyomma cajennense Chelicerata dbest Dermacentor andersoni Chelicerata dbest Dermacentor variabilis Chelicerata dbest Boophilus microplus Chelicerata dbest Rhipicephalus appendiculatus Chelicerata genidx Argas monolakensis Chelicerata dbest Ornithodoros porcinus porcinus Chelicerata dbest Ornithodoros parkeri Chelicerata dbest Ornithodoros coriaceus Chelicerata dbest Glycyphagus domesticus Chelicerata dbest Blomia tropicalis Chelicerata dbest Psoroptes ovis Chelicerata dbest Sarcoptes scabiei Chelicerata dbest Dermatophagoides pteronyssinus Chelicerata dbest Dermatophagoides farinae Chelicerata dbest Suidasia medanensis Chelicerata dbest Tyrophagus putrescentiae Chelicerata dbest Acarus siro Chelicerata dbest Aleuroglyphus ovatus Chelicerata dbest Gammarus pulex Crustacea dbest Eurydice pulchra Crustacea dbest Euphausia superba Crustacea dbest Homarus americanus Crustacea dbest Pacifastacus leniusculus Crustacea dbest Petrolisthes cinctipes Crustacea dbest Callinectes sapidus Crustacea dbest Carcinus maenas Crustacea dbest Cancer magister Crustacea dbest Celuca pugilator Crustacea dbest Gecarcoidea natalis Crustacea dbest Ilyoplax pusilla Crustacea dbest Eriocheir sinensis Crustacea dbest Marsupenaeus japonicus Crustacea dbest Fenneropenaeus chinensis Crustacea dbest Penaeus monodon Crustacea dbest Litopenaeus vannamei Crustacea dbest Litopenaeus stylirostris Crustacea dbest Litopenaeus setiferus Crustacea dbest Tigriopus californicus Crustacea own EST Calanus finmarchicus Crustacea dbest Lepeophtheirus salmonis Crustacea dbest Pollicipes pollicipes Crustacea own EST Artemia franciscana Crustacea dbest Triops cancriformis Crustacea own EST xx
177 Molecular insights to crustacean phylogeny 9. Supplement Daphnia magna Crustacea dbest DAPHNIA PULEX, 2 Crustacea JGI Acerentomon franzi Hexapoda Meusemann Campodea cf. fragilis Hexapoda Meusemann Folsomia candida Hexapoda dbest Anurida maritima Hexapoda Meusemann Onychiurus arcticus Hexapoda dbest Lepismachilis y-signata Hexapoda Meusemann Tricholepisma aurea Hexapoda dbest Ischnura elegans Hexapoda Simon Baetis sp. Hexapoda Simon Locusta migratoria Hexapoda dbest Allonemobius fasciatus Hexapoda dbest Laupala kohalensis Hexapoda dbest Gryllus bimaculatus Hexapoda dbest Gryllus pennsylvanicus Hexapoda dbest Gryllus firmus Hexapoda dbest Periplaneta americana Hexapoda dbest Blattella germanica Hexapoda dbest Diploptera punctata Hexapoda dbest Hodotermopsis sjoestedti Hexapoda dbest Reticulitermes flavipes Hexapoda dbest Sphodromantis centralis Hexapoda dbest PEDICULUS HUMANUS Hexapoda VectorBase Pediculus humanus corporis Hexapoda dbest Pediculus humanus capitis Hexapoda dbest Homalodisca coagulata Hexapoda dbest Graphocephala atropunctata Hexapoda dbest Oncometopia nigricans Hexapoda dbest Lygus lineolaris Hexapoda dbest Oncopeltus fasciatus Hexapoda dbest Rhodnius prolixus Hexapoda dbest Triatoma infestans Hexapoda dbest Triatoma brasiliensis Hexapoda dbest Bemisia tabaci Hexapoda dbest Aleurothrixus sp. APV-2005 Hexapoda dbest Pachypsylla venusta Hexapoda dbest Diaphorina citri Hexapoda dbest Aphis gossypii Hexapoda dbest Myzus persicae Hexapoda dbest Acyrthosiphon pisum Hexapoda dbest Rhopalosiphum padi Hexapoda dbest Toxoptera citricida Hexapoda dbest Sogatella furcifera Hexapoda dbest Nilaparvata lugens Hexapoda dbest Maconellicoccus hirsutus Hexapoda dbest Nasonia giraulti Hexapoda dbest Nasonia vitripennis Hexapoda dbest xxi
178 9. Supplement Molecular insights to crustacean phylogeny Copidosoma floridanum Hexapoda dbest Lysiphlebus testaceipes Hexapoda dbest Microctonus hyperodae Hexapoda dbest Vespula squamosa Hexapoda dbest Solenopsis invicta Hexapoda dbest Camponotus festinatus Hexapoda dbest Lasius niger Hexapoda dbest Bombus ignitus Hexapoda dbest APIS MELLIFERA, 2 Hexapoda Inparanoid Melipona quadrifasciata Hexapoda dbest Eoxenos laboulbenei Hexapoda dbest Mengenilla chobauti Hexapoda dbest Micromalthus debilis Hexapoda dbest Carabus granulatus Hexapoda dbest Meladema coriacea Hexapoda dbest Cicindela litorea Hexapoda dbest Cicindela campestris Hexapoda dbest Cicindela littoralis Hexapoda dbest Sphaerius sp. APV-2005 Hexapoda dbest Eucinetus sp. APV-2005 Hexapoda dbest Dascillus cervinus Hexapoda dbest Georissus sp. APV-2005 Hexapoda dbest Trox sp. JH-2005 Hexapoda dbest Scarabaeus laticollis Hexapoda dbest Julodis onopordi Hexapoda dbest Hister sp. APV-2005 Hexapoda dbest Agriotes lineatus Hexapoda dbest Tenebrio molitor Hexapoda dbest TRIBOLIUM CASTANEUM, 2 Hexapoda BeetleBase Mycetophagus quadripustulatus Hexapoda dbest Biphyllus lunatus Hexapoda dbest Hypothenemus hampei Hexapoda dbest Diaprepes abbreviatus Hexapoda dbest Curculio glandium Hexapoda dbest Sitophilus zeamais Hexapoda dbest 82 8 Ips pini Hexapoda dbest Platystomus albinus Hexapoda dbest Diabrotica virgifera virgifera Hexapoda dbest Timarcha balearica Hexapoda dbest Leptinotarsa decemlineata Hexapoda dbest Callosobruchus maculatus Hexapoda dbest Anoplophora glabripennis Hexapoda dbest Limnephilus flavicornis Hexapoda dbest Hydropsyche sp. T20 Hexapoda dbest Plutella xylostella Hexapoda dbest Tineola bisselliella Hexapoda dbest Danaus plexippus Hexapoda dbest Bicyclus anynana Hexapoda dbest xxii
179 Molecular insights to crustacean phylogeny 9. Supplement Heliconius erato Hexapoda dbest Heliconius melpomene Hexapoda dbest Papilio dardanus Hexapoda dbest Plodia interpunctella Hexapoda dbest Ostrinia nubilalis Hexapoda dbest Epiphyas postvittana Hexapoda dbest Choristoneura fumiferana Hexapoda dbest Trichoplusia ni Hexapoda dbest Agrotis segetum Hexapoda dbest Spodoptera litura Hexapoda dbest 61 3 Spodoptera frugiperda Hexapoda dbest Heliothis virescens Hexapoda dbest Helicoverpa armigera Hexapoda dbest Euclidia glyphica Hexapoda dbest Bombyx mandarina Hexapoda dbest BOMBYX MORI, 2 Hexapoda SilkDB Manduca sexta Hexapoda dbest Lonomia obliqua Hexapoda dbest Samia cynthia ricini Hexapoda dbest Antheraea yamamai Hexapoda dbest Antheraea assama Hexapoda dbest Antheraea mylitta Hexapoda dbest Panorpa cf. vulgaris APV-2005 Hexapoda dbest Ctenocephalides felis Hexapoda dbest Xenopsylla cheopis Hexapoda dbest Culicoides sonorensis Hexapoda dbest Chironomus tentans Hexapoda dbest ANOPHELES GAMBIAE Hexapoda Uniprot (integr8) Anopheles aquasalis Hexapoda dbest Anopheles darlingi Hexapoda dbest Anopheles albimanus Hexapoda dbest Anopheles anthropophagus Hexapoda dbest Anopheles funestus Hexapoda dbest AEDES AEGYPTI, 2 Hexapoda Inparanoid Armigeres subalbatus Hexapoda NCBI Trace Archive CULEX PIPIENS Hexapoda Broad QUINQUEFASCIATUS Institute Culex pipiens pallens Hexapoda dbest 76 3 Toxorhynchites amboinensis Hexapoda dbest Lutzomyia longipalpis Hexapoda dbest Phlebotomus papatasi Hexapoda dbest Rhynchosciara americana Hexapoda dbest Mayetiola destructor Hexapoda dbest Sitodiplosis mosellana Hexapoda dbest Orseolia oryzae Hexapoda dbest Glossina morsitans morsitans Hexapoda dbest Musca domestica Hexapoda dbest xxiii
180 9. Supplement Molecular insights to crustacean phylogeny Stomoxys calcitrans Hexapoda dbest Haematobia irritans Hexapoda dbest Haematobia irritans irritans Hexapoda dbest Ceratitis capitata Hexapoda dbest Rhagoletis suavis Hexapoda dbest Rhagoletis pomonella Hexapoda dbest Drosophila arizonae Hexapoda dbest DROSOPHILA ANANASSAE Hexapoda USCS DROSOPHILA ERECTA Hexapoda USCS DROSOPHILA MELANOGASTER, 2 Hexapoda Inparanoid Meloidogyne hapla Nematoda dbest CAENORHABDITIS ELEGANS, 2 Nematoda Inparanoid CAENORHABDITIS REMANEI Nematoda Inparanoid CAENORHABDITIS BRIGGSAE, 2 Nematoda Inparanoid Haemonchus contortus Nematoda dbest Ascaris suum Nematoda dbest Xiphinema index Nematoda dbest Trichinella spiralis Nematoda dbest CAPITELLA CAPITATA, 2 Annelida JGI HELOBDELLA ROBUSTA Annelida JGI Lumbricus rubellus Annelida dbest LOTTIA GIGANTEA, 2 Mollusca JGI Crassostrea gigas Mollusca dbest Argopecten irradians Mollusca dbest Table S14 Current Genome and EST projects of Crustacea. At the moment existing genome-scale and EST sequencing projects of crustaceans and own projects are given. In the EST analysis C integrated new crustacean species are colored in dark green. Ongoing own projects are colored in lighter green. Nr Species major group group Scource ESTs Raw EST processed EST contigs 1 Litopeneaus stylirostris Decapoda Penaeoidea NCBI Pacifastacus leniusculus Decapoda Astacidea NCBI Homarus americanus Decapoda Astacidea NCBI 29,558 29,680 28,280 4 Litopenaeus vannamei Decapoda Penaeoidea NCBI 155, ,411 11,280 5 Penaeus monodon Decapoda Penaeoidea NCBI 8,073 7,800 7,928 6 Marsupenaeus japonicus Decapoda Penaeoidea NCBI ,152 1,944 7 Fenneropaeneus chinensis Decapoda Penaeoidea NCBI ,446 3,458 8 Litopeneaus setiferus Decapoda Penaeoidea NCBI , Carcinus maenas Decapoda Brachyura NCBI 15,558 15,558 4, Celuca pugilator Decapoda Brachyura NCBI 3,646 3,656 2, Callinectes sapidus Decapoda Brachyura NCBI ,563 2, Eriocheir sinensis Decapoda Brachyura NCBI 3,153 3,152 1, Daphnia pulex Branchiopoda Cladocera NCBI 152,659 1, xxiv
181 Molecular insights to crustacean phylogeny 9. Supplement 14 Daphnia magna Branchiopoda Cladocera NCBI 13,183 13,134 10, Artemia franciscana Branchiopoda Anostraca NCBI 37,607 37,579 10, Lepeophtheirus salmonis Copepoda Siphonostomatoida NCBI 15,018 15,018 5, Calanus finmarchicus Copepoda Calanoida NCBI 10,049 6,822 11,93 18 Eurydice pulchra Perarcarida Isopoda NCBI Gammarus pulex Perarcarida Amphipoda NCBI ,645 4, Cancer magister Decapoda Brachyura NCBI 1,137 1, Euphausa superba Euphausiacea Euphausia NCBI 1,770 1,770 1, Gecarcoidea Decapoda Brachyura NCBI 2,118 2, Ilyoplax pusilla Decapoda Brachyura NCBI Petrolisthes cinctipes Decapoda Anomura NCBI 97,806 97,806 27, Triops cancriformis Branchiopoda Notostraca own ESTs 3,981 2, Pollicipes pollicipes Cirripedia Thecostraca own ESTs 4,224 1, Tigriopus californicus Copepoda Harpacticoida own ESTs 5,024 2, Speleonectes tulumensis Remipedia Speleonectidae own ESTs 1,384 1,282 in progress 28 Speleonectes tulumensis Remipedia Speleonectidae own "454" 400,000 in progress 29 Sarsinebalia urgorrii Hoplocarida Leptostraca own "454" 400,000 in progress 30 Ostracoda sp. Ostracoda to determine own "454" 400,000 in progress Table S15 Genes selected by HaMStR and used in phylogenetic analyses. Gene ID = numerical internal identifier that corresponds to the partition number (gene number) of the data matrix. Protein ID = FlyBase-ID from Ensembl Archive February 2007 (Ensembl Arch. 02/07) for Drosophila melanogaster, ensembl.org/ respectively AEE-ID from Inparanoidxx v6.1 for Aedes aegypti, sbc.su.se. Gene / Description = Description of genes as determined from the Ensemble Archive / Flybase for D. melanogaster (Dmel), from InParanoid v6.1 for A. aegypti (Aaeg) or from HomoloGene for Homo sapiens (Hsap), Other studies = genes shared with other studies: ph= Philippe et al.x; de= Delsuc et al.x; du= Dunn et al.x; ba= Baurain et al.x; name is assigned to the genes in previous studies are given in squared brackets. Rib. Protein = gene is characterised as ribosomal protein (x). Pot. rel. info. content = potential relative information content calculated by new reduction heuristics (MARE). No. of taxa in data set = amount of taxa in the original data set. present in data subset = indicates the presence of that gene in the optimal data set safter performing matrix reduction. No. of taxa in data subset = amount of taxa in the optimal data subset. Gene ID Protein ID Gene / Description Ensemble Arch. 02/07 / InParanoid v6.1 Gene / Description Other studies InParanoid v6.1 (Aaeg) / [abbrivated] HomoloGene (Hsap) Rib. Protein Pot. rel. info. content No. of taxa in data set present in data subset No. of taxa in data subset FBpp ADP-ribosylation factor x FBpp Tubulin alpha-1 chain x FBpp S proteasome non x 61 ATPase regulatory subunit FBpp S protease regulatory ph, de, ba [nsf1-g] x 76 subunit FBpp Beta-2 tubulin x FBpp AP-2 clathrin coat assembly protein ap x 46 xxv
182 9. Supplement Molecular insights to crustacean phylogeny FBpp Rpt3 26S protease regulatory subunit 6bProteasome 26S subunit ATPase FBpp AP-50, isoform A clathrin coat associated protein ap-50 de, ba [nsf1-l] x x FBpp Vacuolar ATP synthase ph, de, ba [vatb] x 69 subunit B FBpp Histone H2A x FBpp smt x FBpp S ribosomal protein ph, de, ba [rps23] x x 95 S FBpp S protease regulatory ph, de, ba [nsf1-m] x 69 subunit FBpp Elongation factor 2 ph, de, ba [ef x 65 EF2] FBpp ATP synthase beta chain, mitochondrial precursor x FBpp AP-47 clathrin coat assembly protein ap FBpp CG6767-PB, isoform B ribose-phosphate pyrophosphokinase x x FBpp Tat-binding protein-1 26S protease regulatory ph, de, ba [nsf1-k ] x 71 subunit 6a FBpp CG1970-PA NADH-ubiquinone x 67 oxidoreductase fe-s protein 2 (ndufs2) FBpp GTP-binding protein x up FBpp Splicing factor U2af 38 kda subunit de [u2snrnp] x FBpp S ribosomal protein L23 ph, du, de, ba [rpl23a] x x FBpp Cdc42 homolog rac GTPase x FBpp Heat shock 70 kda ph, de, ba [hsp x 58 protein cognate 3 precursor E] FBpp Vacuolar ATP synthase catalytic subunit A isoform 2 ph, de, ba [vata] x FBpp CG9140-PA NADH-ubiquinone x 63 oxidoreductase flavoprotein 1 (ndufv1) FBpp SF2 arginine/serine-rich x 46 splicing factor FBpp CG8351-PA chaperonin ph, de, ba [cct-n] x FBpp S ribosomal protein ph, de, ba [rps26] x x 93 S FBpp Tropomyosin x FBpp CG5525-PA chaperonin T-complex protein 1 subunit delta ph, de, ba [cct-d] x FBpp S ribosomal protein ph, du, de, ba x x 97 S18 [rps18] FBpp Enolase x FBpp T-complex protein 1 chaperonin ph, de, ba [cct-a] x 62 subunit alpha FBpp Eukaryotic translation ph, de, ba [if2b] x 60 initiation factor 2 beta subunit FBpp CG7033-PB, isoform B chaperonin ph, de, ba [cct-b] x FBpp S proteasome non x 58 ATPase regulatory subunit FBpp Polyadenylate-binding protein x FBpp S ribosomal protein ph, ba [rps5] x x 108 S5a FBpp GTP-binding nuclear protein Ran x 77 xxvi
183 Molecular insights to crustacean phylogeny 9. Supplement FBpp CG3731-PB, isoform B mitochondrial processing peptidase beta subunit FBpp Guanine nucleotidebinding protein beta subunit-like protein FBpp Vacuolar ATP synthase subunit H FBpp S ribosomal protein L27a FBpp Proteasome p44.5 subunit, isoform B du [rpl27] x x x 61 ph, de, ba [rpl27] x x x FBpp VhaPPA1-1 vacuolar ATP synthase proteolipid subunit FBpp Heat shock 70 kda protein cognate FBpp S proteasome non- ATPase regulatory subunit FBpp Eukaryotic initiation factor 3 p66 subunit x x x x FBpp Phosphoglycerate kinase x FBpp lesswright, isoform A ubiquitin-conjugating enzyme E2 i x FBpp S ribosomal protein ph, de, ba [rps22a] x x 91 S15Aa FBpp ATP synthase alpha x 92 chain, mitochondrial precursor FBpp Catalase x FBpp Ribosomal protein S15, ph, du, de, ba x x 97 isoform B [rps15] FBpp Probable small nuclear ribonucleoprotein Sm D2 du [small nuclear ribonucleo-protein polypeptide D2] x FBpp Vacuolar ATP synthase 16 kda proteolipid subunit FBpp Vacuolar ATP synthase subunit D FBpp Probable 26S proteasome non-atpase regulatory subunit FBpp Adenosylhomocysteinase ph, de [ Sadhchydrolase-E1] x x x x FBpp CG5001-PA DNA-J/hsp x FBpp S acidic ribosomal ph, de, ba [rpp0] x x 108 protein P FBpp Isocitrate dehydrogenase, isoform F x FBpp S acidic ribosomal du, de, ba [rla2-b] x x 89 protein P FBpp Surfeit locus protein x 57 homolog FBpp T-complex protein 1 ph, de, ba [cct-g] x 55 subunit gamma FBpp Calreticulin precursor x FBpp CG8446-PA lipoyltransferase x FBpp CG5590-PA short-chain x 65 dehydrogenase FBpp CG9769-PA eukaryotic translation initiation factor 3f eif3f x FBpp Proteasome subunit alpha type FBpp Proteasome subunit alpha type 4 ph, de, ba [psma- D] x x 64 xxvii
184 9. Supplement Molecular insights to crustacean phylogeny FBpp CG32276-PB, isoform B stress-associated endoplasmic reticulum protein family member x FBpp Signal peptide protease x FBpp S ribosomal protein L8 ph, du, de, ba x x 101 [rpl2] Fbpp Oligosaccharyltransferase Dolichyldiphosphooligosaccharide x 64 48kD subunit protein glycosyltransferase FBpp CaBP1 protein disulfideisomerase x 64 A6 precursor FBpp Arginine x 62 methyltransferase Fbpp CG1532-PA lactoylglutathione lyase x FBpp Proteasome subunit ph, de, ba [psma x 61 alpha type 5 A] FBpp S ribosomal protein S9 ph, ba [rps9] x x FBpp Ribosomal protein L30, ph, du, de, ba x x 88 isoform A [rpl30] FBpp ribosomal protein L5 ph, de, ba [rpl5] x x FBpp Succinate dehydrogenase [ubiquinone] iron-sulfur protein, mitochondrial precursor x FBpp CG7998-PA malate dehydrogenase x FBpp S ribosomal protein L19 ph, du, de, ba [rpl19a] x x FBpp CG7834-PB, isoform B electron transfer x 68 flavoprotein beta-subunit FBpp Uev1A, isoform B ubiquitin-conjugating x 58 enzyme FBpp CG5362-PA malate dehydrogenase x FBpp Inorganic x 59 pyrophosphatase FBpp Proteasome subunit alpha type x FBpp S ribosomal protein L10a-2 ph, de, ba [rpl1] x x FBpp CG8636-PA eukaryotic translation du [eukaryotic x 71 initiation factoreukaryotic trans-lation initiation translation initiation factor 3 subunit 4 factor 3, subunit 4 delta] FBpp Eip55E cystathionine beta-lyase x FBpp yippee interacting protein x FBpp S ribosomal protein S20 ph, du, de, ba [rps20] x x FBpp walrus, isoform B electron transport oxidoreductase x FBpp S ribosomal protein L10 ph, de, ba [grc5] x x FBpp Lethal (1), isoform A citrate synthase x FBpp S ribosomal protein L4 ph, de, ba [rpl4b] x x FBpp Thioredoxin-like x FBpp S ribosomal protein S7 ph [rps7] x x FBpp Ubiquitin conjugating x 62 enzyme FBpp Clathrin light chain x FBpp Annexin-B x FBpp Erp60, isoform B protein disulfide isomerase x FBpp S ribosomal protein S FBpp Voltage-dependent anion-selective channel ph, du, de, ba [rps16] x x x 84 xxviii
185 Molecular insights to crustacean phylogeny 9. Supplement FBpp Proteasome 2 subunit ph, de, ba [psmb x 81 K] FBpp S ribosomal protein S3a ph, de, ba [rps1] x x FBpp CG4769-PA cytochrome C x FBpp Ribosomal protein L27 x x FBpp Glutamine synthetase 2, cytoplasmic x FBpp cathd cathepsin d x FBpp NADH:ubiquinone x 66 reductase 23kD subunit precursor FBpp Elongation factor 1- gamma x FBpp S ribosomal protein ph, du, de, ba x x 97 L18a [rpl20] FBpp Rieske iron-sulfur protein, ubiquinol-cytochrome c isoform B x 80 reductase iron-sulfur subunit du [Ubiquinol cytochrome c reductase, Rieske iron-sulfur polypeptide I] FBpp S ribosomal protein S4 ph, ba [rps4] x x FBpp Proteasome subunit beta ph, du, de, ba x 72 type 3 [psmb-i] FBpp Nascent polypeptideassociated complex alpha subunit x FBpp S ribosomal protein ph, de, ba [rpl31] x x 89 L FBpp S ribosomal protein S8 ph, du, ba [rps8] x x FBpp Ribosomal protein L6, ph, de, ba [rpl6] x x 106 isoform B FBpp hydrogen-transporting ATP synthase, G-subunit, putative x FBpp S ribosomal protein L13A FBpp Ribosomal protein S30, isoform B du [Ubiquitin-like FUBI and riboribosomal protein S30 precursor] ph, du, de, ba [rpl12b] x x 98 x x FBpp CG3195-PA, isoform A 60S ribosomal protein L12 x x FBpp Ribosomal protein L18 ph, du, de, ba x x 95 [rpl18] FBpp Ras-related protein Rab Fbpp Pka-C1: camp-dependent camp-dependent protein protein kinase catalytic kinase subunit catalytic subunit FBpp diablo FBpp CG2944-PF, isoform F spla/ryanodine receptor domain and SOCS box containing FBpp Protein mothers against dpp FBpp reptin FBpp CG10889-PA zinc finger CCCH-type containing 12B FBpp Transcription initiation factor IIB FBpp SNF1A/AMP-activated protein kinase, isoform B FBpp CG5343-PA orf protein FBpp camp-dependent protein kinase type I regulatory subunit xxix
186 9. Supplement Molecular insights to crustacean phylogeny FBpp Potassium voltage-gated channel protein Shaker FBpp Putative ATP-dependent RNA helicase me31b FBpp Small nuclear ribonucleoprotein SM D FBpp COP9 signalosome complex subunit 5 voltage-gated potassium channel FBpp Unc-76, isoform B FBpp CG11266-PG, isoform G splicing factor FBpp CG5451-PA WD-repeat protein AAEL casein kinase PA FBpp Ef1-like factor FBpp UGP, isoform A FBpp Katanin 60 de [nsf1-n] FBpp CG5934-PA AAEL cytosolic purine PA nucleotidase FBpp Guanine nucleotidebinding protein G(q) subunit alpha FBpp Lissencephaly-1 homolog FBpp Syntaxin-1A FBpp CG6439-PA isocitrate dehydrogenase FBpp phosphofructo kinase, isoform I FBpp CG11990-PA cdc73 domain protein FBpp Sterol carrier protein X related thiolase FBpp Guanine nucleotidebinding protein G(s), alpha subunit FBpp RluA-1, isoform C FBpp Probable ATP-dependent RNA helicase pitchoune FBpp CG10465-PA potassium channel tetramerisation domain containing FBpp CAMP-dependent protein kinase catalytic subunit FBpp tricornered FBpp DNA-directed RNA du [DNA directed polymerase II largest subunit RNA polymerase II polypeptide C] FBpp Succinate dehydrogenase [ubiquinone] flavoprotein subunit, mitochondrial precursor FBpp endophilin A, isoform B FBpp Protein ariadne FBpp CG4279-PA Sm protein G putative FBpp CG31005-PA trans-prenyltransferase FBpp Suppressor of hairless protein FBpp synaptosomal associated protein FBpp Inosine-5' monophosphate dehydrogenase FBpp Spliceosomal protein on the X xxx
187 Molecular insights to crustacean phylogeny 9. Supplement FBpp GTP-binding-protein FBpp CG14641-PA RNA binding motif protein FBpp ADP-ribosylation factorlike protein FBpp CG6842-PA skd/vacuolar sorting FBpp CG32810-PB potassium channel tetramerisation domain containing FBpp Rae FBpp atlastin, isoform B FBpp Serine/threonine-protein de [stcproptase2ac] phosphatase PP-V FBpp Aryl hydrocarbon receptor nuclear translocator homolog FBpp pontin FBpp Ard1, isoform A FBpp CG4203-PA KIAA FBpp Stress-activated protein kinase JNK FBpp CG32105-PB LIM homeobox transcription factor 1, alpha FBpp Tyrosine-protein phosphatase Lar precursor FBpp Elongation factor Tu mitochondrial FBpp Malic enzyme, isoform A FBpp Males-absent on the first protein FBpp CG9281-PC, isoform C ATP-dependent transporter FBpp CG31137-PE, isoform E carbon catabolite repressor protein FBpp CG11963-PA succinyl-coa synthetase beta chain FBpp Soluble NSF attachment protein FBpp Echinoderm microtubuleassociated protein-like CG13466 WD-repeat protein Fbpp Cpr: NADPH-cytochrome NADPH cytochrome P P450 reductase FBpp Succinyl-CoA ligase [GDP-forming] alpha-chain, mitochondrial precursor ph, de, ba [suca] FBpp CG7236-PA cdkl1/ FBpp S proteasome non ATPase regulatory subunit FBpp CG12858-PA major facilitator superfamily domain containing FBpp Transcription factor IIE FBpp steamer duck, isoform C FBpp CG1513-PA oxysterol binding protein FBpp CG6560-PA ADP-ribosylation factor arf FBpp Protein peanut FBpp Congested-like trachea protein FBpp Transcription elongation transcription elongation factor S-II factor s-ii FBpp eif5b xxxi
188 9. Supplement Molecular insights to crustacean phylogeny FBpp Notchless FBpp Transcription initiation factor IIF alpha subunit FBpp Rab FBpp UDP-glucose dehydrogenase FBpp CG4164-PA DNA-J/hsp FBpp phosphocholine cytidylyltransferase 1, isoform D FBpp Calcium-transporting ATPase sarcoplasmic/endoplasmi c reticulum type FBpp Glutamate dehydrogenase, mitochondrial precursor FBpp Probable small nuclear ribonucleoprotein Sm D FBpp CG33096-PB, isoform B family with sequence similarity 108, member C FBpp CG3714-PB, isoform B nicotinate phosphoribosyltransferas e FBpp Protein ROP FBpp tex FBpp Guanine nucleotidebinding GTP-binding proteininvertebrate protein-like 3 homolog FBpp CG32758-PA sorting nexin FBpp Tao-1, isoform E FBpp Proliferating cell nuclear antigen du [Proliferating cell nuclear antigen] FBpp CG1640-PA, isoform A alanine aminotransferase FBpp Spectrin alpha chain FBpp Splicing factor 3A subunit FBpp CG17184-PB, isoform B ADP-ribosylation factor interacting protein FBpp CG12140-PA electron transfer flavoprotein-ubiquinone oxidoreductase FBpp Dystrobrevin-like, isoform A FBpp no extended memory, isoform B FBpp Pyruvate kinase FBpp Rs FBpp CG7145-PD, isoform D pyrroline-5-carboxylate dehydrogenase FBpp CG14939-PA cyclin Y FBpp Puff-specific protein Bx FBpp conserved hypothetical protein FBpp CG17593-PA coiled-coil domain containing FBpp Protein bys FBpp CG9911-PA, isoform A endoplasmic reticulum resident protein (ERp44) putative FBpp Putative inner dynein arm axonemal inner arm light chain dynein light chain xxxii
189 Molecular insights to crustacean phylogeny 9. Supplement FBpp Probable eukaryotic ph, de, ba [if6] translation initiation factor FBpp eif3-s9, isoform B FBpp CG33303-PA ribophorin FBpp CG14782-PA pleckstrin homology domain containing, family F (with FYVE domain) member FBpp DNA-directed RNA polymerases I, II, and III 14.4 kda polypeptide FBpp CG5284-PA, isoform A chloride channel protein FBpp CG8500-PA MRAS2 putative FBpp mrj, isoform D FBpp Tudor-SN ebna2 binding protein P FBpp belphegor FBpp lethal (1) G FBpp Clipper FBpp Transmembrane GTPase Marf FBpp CG18347-PA mitochondrial glutamate carrier protein FBpp CG11859-PA serine/threonine-protein kinase rio2 (rio kinase 2) FBpp CHIP FBpp nop FBpp ATP-dependent RNA helicase abstrakt FBpp cap binding protein 80, isoform A FBpp crinkled, isoform A FBpp EHP eukaryotic translation initiation factor 4e type FBpp Probable signal srp recognition particle 68 kda protein FBpp belle DEAD box ATPdependent RNA helicase FBpp CG9018-PB, isoform B regulation of nuclear premrna domain containing 1B FBpp RhoGAP68F FBpp CG6838-PB, isoform B ADP-ribosylation factor GTPase activating protein FBpp CG12797-PA WD-repeat protein FBpp MLF1-adaptor molecule FBpp Armadillo segment polarity protein FBpp Mannosyl-oligosaccharide alpha-1,2- mannosidase isoform FBpp Tenascin major FBpp CG9523-PA FIC domain containing FBpp CG31004-PB, isoform B sushi domain containing AAEL arsenical pump-driving PA ATPase AAEL PA growth hormone inducible transmembrane protein du [growth hormone inducible transmembrane protein] xxxiii
190 9. Supplement Molecular insights to crustacean phylogeny FBpp Probable small nuclear ribonucleoprotein G du [small nuclear ribonucleoprotein polypeptide G] FBpp Fumarylacetoacetase FBpp CG6194-PA ATG4 autophagy related homolog D FBpp Tetraspanin 26A FBpp Voltage-dependent calcium channel type D alpha-1 subunit FBpp Receptor mediated endocytosis FBpp conserved membrane protein at 44E, isoform A FBpp CG16903-PA cyclin l FBpp CG9547-PA acyl-coa dehydrogenase FBpp escl, isoform A FBpp Flap endonuclease FBpp Protein frizzled precursor FBpp Dynamitin AAEL formyltetrahydrofolate PB cyclo-ligase FBpp Protein henna FBpp Beta-amyloid-like protein precursor FBpp CG31033-PB, isoform B ATG16 autophagy related like FBpp CG9461-PA F-box only protein FBpp Eph receptor tyrosine kinase, isoform D FBpp phosphogluconate dehydrogenase, decarboxylating FBpp CG6051-PA lateral signaling target protein FBpp CG1140-PA, isoform A succinyl-coa: 3-ketoacidcoenzyme a transferase FBpp HMG Coenzyme A synthase, isoform A FBpp PICK1, isoform B FBpp sec23, isoform B FBpp Protein tumorous imaginal discs, mitochondrial precursor FBpp CG3016-PA ubiquitin-specific protease FBpp Rox8, isoform F FBpp Hypothetical protein CG FBpp CG1732-PB, isoform B sodium/chloride dependent neurotransmitter transporter FBpp Hypothetical protein CG32795 in chromosome FBpp CG7338-PA ribosome biogenesis protein tsr FBpp CG4525-PA tetratricopeptide repeat domain FBpp CG1458-PA CDGSH iron sulfur domain FBpp CG7628-PA phosphate transporter xxxiv
191 Molecular insights to crustacean phylogeny 9. Supplement FBpp CG12135-PA CWC15 spliceosomeassociated protein homolog FBpp CG6179-PA nitric oxide synthase interacting protein FBpp RhoGAP5A, isoform A FBpp CG5366-PA cullin-associated NEDD dissociated protein FBpp RNA-binding protein 8A FBpp Hsp90 co-chaperone Cdc FBpp Lipoic acid synthase, lipoic acid synthetase isoform B FBpp Neurexin-4 precursor FBpp Aut FBpp Molybdenum cofactor molybdopterin synthesis protein cinnamon biosynthesis protein FBpp CG10153-PA trafficking protein particle complex FBpp CG11777-PA cyclophilin FBpp CG3004-PA vegetatible incompatibility protein HET-E-1 putative FBpp CG7686-PA LTV1 homolog FBpp CG3358-PB, isoform B TatD DNase domain containing FBpp Nup44A, isoform A FBpp CG17446-PA cpg binding protein FBpp CG2185-PA calcineurin b subunit AAEL conserved hypothetical PA protein FBpp CG8142-PA replication factor C 37- kda subunit putative FBpp CG11642-PC, isoform C translocation associated membrane protein FBpp CG8394-PA amino acid transporter FBpp NUCB FBpp CG32687-PA internalin A putative FBpp lethal (1) G0196, isoform E FBpp CG5676-PA FBpp CG4332-PA CLPTM1-like FBpp Probable phenylalanyltrna synthetase alpha chain FBpp CG9543-PA coatomer protein complex, subunit epsilon FBpp Probable tyrosyl-dna phosphodiesterase FBpp Ubiquitin-conjugating enzyme E2-22 kda ubiquitin-conjugating enzyme E2-25kDa FBpp Protein ariadne FBpp lethal (3) s FBpp Sorbitol dehydrogenase FBpp F-box/SPRY-domain protein FBpp CG12121-PA lung seven transmembrane receptor FBpp CG13887-PB, isoform B B-cell receptorassociated protein bap du [B-cell receptorassociated protein xxxv
192 9. Supplement Molecular insights to crustacean phylogeny 31] FBpp Threonyl-tRNA synthetase, isoform C FBpp CG15433-PA elongator component putative FBpp CG8080-PA chromosome 5 open reading frame 33 ba [trs] FBpp CG6812-PA sideroflexin FBpp CG1749-PA ubiquitin-activating enzyme E FBpp Serine/threonine-protein kinase FBpp multiple C2 domain and transmembrane region protein FBpp CG7039-PA ARL3 putative FBpp Replication factor C 38kD subunit FBpp supercoiling factor, isoform B FBpp Cysteinyl-tRNA synthetase FBpp CG11919-PA, isoform A peroxisome assembly factor-2 (peroxisomaltype ATPase 1) FBpp CDK5RAP3-like protein FBpp rogdi, isoform A FBpp CG8841-PC, isoform C chromosome 17 open reading frame FBpp Probable ribosome production factor 1 U3 small nucleolar ribonucleoprotein protein imp FBpp CG4338-PA chromosome 16 open reading frame FBpp thickveins, isoform D FBpp CG12125-PA family with sequence similarity 73, member B FBpp CG11660-PA, isoform A serine/threonine-protein kinase rio1 (rio kinase 1) FBpp CG2656-PA GPN-loop GTPase FBpp CG5861-PA transmembrane protein FBpp CG4933-PA o-sialoglycoprotein endopeptidase FBpp Calcium-dependent secretion activator FBpp GlcT FBpp S ribosomal protein x S12, mitochondrial precursor FBpp UDP-sugar transporter UST74c FBpp Rpn FBpp BM-40-SPARC FBpp Mekk1, isoform B FBpp Tousled-like kinase, isoform D FBpp MTA1-like, isoform B FBpp lethal (3) IX FBpp Protein within the bgcn gene intron FBpp CG5805-PA mitochondrial glutamate carrier putative xxxvi
193 Molecular insights to crustacean phylogeny 9. Supplement FBpp Dpld (Protein dappled) FBpp CG6910-PA myoinositol oxygenase AAEL RNA polymerase II PA holoenzyme component FBpp CG3756-PA DNA-directed RNA FBpp Anaphase-promoting complex subunit 10 polymerase FBpp CG9373-PA myelinprotein expression factor FBpp CG1622-PA PRP38 pre-mrna processing factor FBpp CG12295-PB: straightjacket dihydropyridine-sensitive l-type calcium channel FBpp mitochondrial ribosomal x protein L FBpp Ngp FBpp CG1646-PC, isoform C PRP39 pre-mrna processing factor 39 homolog FBpp GDI interacting protein 3, isoform C FBpp Integrin beta-ps integrin beta subunit precursor FBpp ATP synthase B chain, mitochondrial precursor FBpp pebble, isoform D FBpp CG8635-PA zinc finger CCCH-type containing FBpp CG9099-PA density-regulated protein FBpp Probable maleylacetoacetate isomerase FBpp calnexin FBpp rapsynoid FBpp Tyrosyl-tRNA synthetase FBpp CG9236-PA calcium and integrinbinding protein FBpp CG11920-PA U3 small nucleolar ribonucleoprotein protein imp FBpp O-glycosyltransferase, isoform B FBpp Fat-spondin, isoform B FBpp Protein neuralized FBpp CG6724-PA WD-repeat protein FBpp CG6015-PA pre-mrna splicing factor prp FBpp CG8286-PA tetratricopeptide repeat protein putative FBpp Probable GDP-mannose 4,6 dehydratase FBpp Mystery 45A FBpp mrityu, isoform C FBpp CG5840-PB, isoform B pyrroline-5-carboxylate reductase FBpp Probable 28 kda Golgi SNARE protein FBpp Sur-8, isoform A FBpp CG8036-PD, isoform D transketolase I FBpp Prp xxxvii
194 9. Supplement Molecular insights to crustacean phylogeny FBpp Glutamate--cysteine ligase FBpp CG32528-PA parvin FBpp Katanin 80, isoform B FBpp CG6841-PA pre-mrna splicing factor FBpp La protein homolog FBpp CG10333-PA DEAD box ATPdependent RNA helicase FBpp CG11537-PB, isoform B hippocampus abundant transcript FBpp PDCD-5 programmed cell death 5 du, de [pace6] FBpp pyd FBpp Coatomer subunit beta' FBpp Kinesin-like protein at D FBpp CG7112-PA rab6 GTPase activating protein gapcena (rabgap1 protein) FBpp CG18005-PA red protein (ik factor) (cytokine ik) FBpp Sirt FBpp CG6509-PB, isoform B discs large protein FBpp CG3835-PA, isoform A D-lactate dehydrognease FBpp Ubiquitin thioesterase otubain-like protein FBpp mitochondrial ribosomal ph, du, de, ba x protein L17 [rpl17] FBpp Coatomer protein, isoform B FBpp MRNA-capping-enzyme FBpp CG31938-PA exosome component FBpp Probable UDP-glucose epimerase FBpp CG6095-PB, isoform B exocyst complex-subunit protein 84kDa-subunit putative FBpp CG14232-PA acyl-coenzyme A binding domain containing FBpp CG1800-PA: partner of drosha double-stranded binding protein putative FBpp CG10932-PA acetyl-coa acetyltransferase mitochondrial FBpp Probable phosphomannomutase FBpp CG8531-PA DnaJ (Hsp40) homolog, subfamily C, member FBpp COP, isoform B FBpp CG5991-PC, isoform C FBpp CG14407-PA glutaredoxin FBpp CG11107-PA ATP-dependent RNA helicase FBpp CG16865-PA chromosome X open reading frame FBpp CG11134-PA APAF1 interacting protein FBpp Exostosin FBpp Multidrug-Resistance like Protein 1, isoform B FBpp C FBpp CG3961-PB, isoform B long-chain-fatty-acid coa ligase xxxviii
195 Molecular insights to crustacean phylogeny 9. Supplement FBpp CG11178-PB, isoform B AVL9 homolog FBpp misshapen, isoform E FBpp AP-1, isoform E FBpp CG9391-PA, isoform A myo inositol monophosphatase FBpp CG12703-PA peroxisomal membrane protein 70 abcd FBpp eclair FBpp CG8798-PA, isoform A ATP-dependent Lon protease putative FBpp CG33505-PA WD-repeat protein FBpp CG12343-PA SYF2 homolog, RNA splicing factor FBpp CG1907-PA solute carrier family 25 (mitochondrial carrier; oxoglutarate carrier), member FBpp mitochondrial ribosomal protein L24 x FBpp CG10711-PA conserved hypothetical protein FBpp nude FBpp Gas AAEL DEAD box ATPdependent PA RNA helicase FBpp Exocyst complex component FBpp Lamin-C FBpp CG10903-PA Williams Beuren syndrome chromosome region AAEL conserved hypothetical PA protein FBpp Lethal (1), isoform A FBpp CG5214-PA dihydrolipoamide succinyltransferase component of 2- oxoglutarate dehydrogenase FBpp CG5703-PA NADH-ubiquinone oxidoreductase 24 kda subunit du [NADH dehydrogenase (ubiquinone) flavoprotein 2, 24kDa] FBpp CG5885-PA translocon-associated protein gamma subunit FBpp Glucose-6-phosphate 1- dehydrogenase FBpp CG4225-PA ABC transporter Mitochondrial ABC FBpp eukaryotic translation initiation factor 3, theta subunit transporter FBpp Dgp-1, isoform A FBpp CG6227-PA DEAD box ATPdependent RNA helicase FBpp Polycomb protein l(1)g FBpp CG6465-PA aminoacylase putative FBpp NEDD8-activating enzyme E1 regulatory subunit app binding protein xxxix
196 9. Supplement Molecular insights to crustacean phylogeny FBpp CG7728-PA ribosome biogenesis protein FBpp CG11858-PA peptidyl-prolyl cis/trans isomerase putative du [protein (peptidyl-prolyl cis/trans isomerase) NIMAinteracting 1] FBpp drosha FBpp CG8793-PA KIAA AAEL PA conserved hypothetical protein ph, de [stbproptase2a-b] FBpp CG4169-PA ubiquinol-cytochrome c reductase complex core protein FBpp Regulator of chromosome condensation FBpp Histidyl-tRNA synthetase, isoform B FBpp phosphofructokinase FBpp Bifunctional aminoacyltrna synthetase FBpp DNA polymerase alpha subunit B FBpp Secretory Pathway Calcium atpase, isoform C FBpp CG9119-PA chromosome 11 open reading frame FBpp CG9245-PB, isoform B phosphatidylinositol synthase Fbpp smallminded CG8571-PB, isoform B peroxisome assembly factor-2 (peroxisomal-type ATPase 1) de [nsf2-b] FBpp hydroxy methylglutaryl-coenzyme A reductase FBpp CG16728-PA G protein-coupled receptor kinase interacting ArfGAP FBpp Two A-associated protein of 42kDa FBpp CG6643-PB, isoform B synaptotagmin putative FBpp CG1317-PB ssm4 protein FBpp falafel, isoform C FBpp CG3564-PA copii-coated vesicle membrane protein P FBpp CG14211-PB dual-specificity protein phosphatase putative FBpp hydroxyacyl-CoA dehydrogenase type-2 hydroxyacyl dehydrogenase FBpp Mediator complex subunit FBpp CG11208-PA 2-hydroxyphytanoyl-coa lyase FBpp CG13900-PB, isoform B spliceosomal protein sap FBpp CG1410-PA, isoform A GTP-binding protein lepa FBpp CG5589-PA DEAD box ATPdependent RNA helicase FBpp Aminopeptidase P FBpp Chromatin remodelling complex ATPase chain Iswi FBpp lethal (2) 35Df xl
197 Molecular insights to crustacean phylogeny 9. Supplement FBpp CG2051-PC, isoform C histone acetyltransferase type b catalytic subunit FBpp CG3704-PA xpa-binding protein 1 (mbdin) FBpp Late endosomal/lysosomal Mp1-interacting protein homolog FBpp CG8386-PA ubiquitin-fold modifier conjugating enzyme FBpp Ski6 du, de [rrp46-b] FBpp Caf FBpp Golgin FBpp CG33298-PB, isoform B phospholipid-transporting ATPase 1 (aminophospholipid flippase 1) FBpp neither inactivation nor afterpotential B FBpp Alpha-catenin-related, isoform B FBpp Exocyst complex component FBpp CG5434-PA (Srp72) Signal recognition particle 72 kda protein AAEL tyrosine-protein kinase PA drl FBpp Mlh FBpp Vacuolar protein sorting protein 72 homolog FBpp CG12091-PA protein phosphatase 2c FBpp Interleukin enhancerbinding interleukin enhancer factor 2 homolog binding factor AAEL PA Dipeptidyl-peptidase FBpp CG10467-PA aldose-1-epimerase FBpp Signal sequence receptor du [signal sequence receptor, beta precursor] FBpp Ral guanine nucleotide exchange factor 2, isoform A FBpp Hsc70Cb, isoform C FBpp CG32626-PD, isoform D AMP deaminase FBpp multiprotein bridging factor, isoform B du [endothelialdifferentiationrelated factor 1 isoform alpha] FBpp Dis FBpp CG1126-PA Bardet-Biedl syndrome FBpp CG6401-PA glycosyltransferase FBpp CG6905-PA cell division control protein FBpp Zpr FBpp CG31957-PA translation initiation factor 1A putative FBpp CG8632-PB, isoform B solute carrier family 30 (zinc transporter), member FBpp Uridine 5'- orotidine-5'-phosphate monophosphate synthase decarboxylase, putative FBpp CG3703-PA RUN domain containing FBpp CG7429-PA coiled-coil domain xli
198 9. Supplement Molecular insights to crustacean phylogeny containing FBpp CG5484-PC, isoform C Yip1 interacting factor homolog B FBpp CG6259-PA charged multivesicular body protein FBpp CG6133-PA NOL1/NOP2/Sun domain family, member FBpp FRG1 protein homolog FBpp CG12214-PA, isoform A tubulin-specific chaperone e FBpp CG7791-PA mitochondrial intermediate peptidase FBpp CG13827-PA peroxisomal biogenesis factor 11 gamma FBpp Hypothetical UPF0172 protein CG FBpp CG15087-PA chromosome 11 open reading frame FBpp CG3061-PA DNA-J, putative FBpp COQ FBpp anti-silencing factor FBpp CG7550-PA 2-aminoethanethiol (cysteamine) dioxygenase FBpp Putative conserved oligomeric Golgi complex component FBpp CG18177-PB, isoform B FBpp CG3542-PB, isoform B U1 small nuclear ribonucleoprotein putative FBpp CG6420-PA WD-repeat protein FBpp CG14997-PB, isoform B sulfide quinone reductase FBpp Transcription elongation factor SPT FBpp CG12375-PA metallo-beta-lactamase putative FBpp CG4537-PA cysteine-rich PDZ-binding protein FBpp Spermidine Synthase FBpp CG6415-PA aminomethyltransferase FBpp Aos FBpp CG4159-PA pseudouridylate synthase FBpp Enhancer of bithorax, isoform C FBpp CG9865-PB, isoform B phosphatidylinositol glycan anchor biosynthesis, class M (CG9865) FBpp Vacuolar ATP synthase subunit G FBpp S ribosomal protein x L32, mitochondrial precursor FBpp CG12750-PA cell cycle control protein cwf FBpp FK506-binding protein FBpp CG6859-PA perixosomal biogenesis factor FBpp CG1416-PC, isoform C AHA1, activator of heat shock 90kDa protein ATPase homolog FBpp CG9153-PB, isoform B hect E3 ubiquitin ligase FBpp mitochondrial ribosomal protein S35 x xlii
199 Molecular insights to crustacean phylogeny 9. Supplement FBpp SCAP FBpp Probable DNA replication GINS complex subunit complex GINS (Psf2 homolog) protein PSF FBpp Myb-interacting protein FBpp CG8506-PA zinc finger, FYVE domain containing FBpp C-1-tetrahydrofolate synthase, cytoplasmic FBpp CG4098-PA nudix hydrolase FBpp phosphatidylinositol ,5-bisphosphate phosphodiesterase FBpp CG11526-PB, isoform B family with sequence similarity 40, member A AAEL tryptophanyl-trna PA synthetase FBpp CG2614-PA KIAA FBpp CG6443-PA chromosome 20 open reading frame FBpp CG14967-PA KIAA FBpp tho FBpp CG12170-PA 3-oxoacyl-[acyl-carrierprotein] synthase FBpp CG3808-PA RNA m5u methyltransferase FBpp Clathrin heavy chain FBpp iodotyrosine iodotyrosine dehalogenase dehalogenase FBpp CG6746-PA ptpla domain protein FBpp Probable mitochondrial import receptor subunit TOM40 homolog FBpp CG30022-PA beta lactamase domain FBpp tolkin, isoform B FBpp CG4849-PA 116 kda U5 small nuclear ribonucleoprotein component FBpp CG9630-PA DEAD box ATPdependent RNA helicase FBpp CG8443-PA eukaryotic translation initiation factor 3 subunit (eif-3) FBpp CG13926-PA chromosome 11 open reading frame FBpp ligatin FBpp CG6608-PB, isoform B mitochondrial carrier protein putative FBpp CG5026-PA, isoform A myotubularin FBpp adipose FBpp Probable U3 small nucleolar RNAassociated protein FBpp Integrin alpha-ps precursor FBpp CG1824-PA lipid a export ATPbinding/permease protein msba FBpp Protein retinal degeneration B FBpp CG17840-PA inositol 5-phosphatase xliii
200 9. Supplement Molecular insights to crustacean phylogeny FBpp CG5880-PA zinc finger, DHHC-type containing FBpp okra FBpp CG30390-PA coiled-coil domain containing FBpp Ire-1 Serine threonine-protein kinase endoplasmic reticulum to nucleus signaling FBpp gata FBpp ,2-dihydroxy-3-keto-5- methylthiopentene dioxygenase acireductone dioxygenase FBpp CG14290-PB brain protein 44-like FBpp CG16941-PA spliceosome associated protein FBpp CG14805-PA PAF acetylhydrolase kda subunit putative FBpp pavarotti FBpp Probable proteasome subunit beta type 4 ph, du, de, ba [psmb-n] AAEL ATP-binding cassette PA transporter FBpp phosphoinositidedependent protein kinase FBpp CG11267-PA heat shock protein putative du [Heat shock 10 kda protein 1 (chaperonin 10)] FBpp CG5288-PC, isoform C galactokinase FBpp CG6751-PA WD-repeat protein FBpp conserved hypothetical protein FBpp CG8397-PA actin binding protein putative FBpp Homeotic gene regulator FBpp Elongin B du [elongin B isoform a] AAEL PA conserved hypothetical protein FBpp Transcription-associated transformation/transcripti protein 1 (Nipped-A) on domain-associated protein FBpp Neuroglian precursor FBpp CG4199-PA, isoform A disulfide oxidoreductase FBpp nitrate, fromate, iron dehydrogenase AAEL diacylglycerol kinase PA FBpp CG7650-PA viral IAP-associated factor putative FBpp CG8993-PA thioredoxin putative FBpp Transportin, isoform A FBpp Protein tailless FBpp CG1461-PA tyrosine aminotransferase FBpp CG3573-PA inositol polyphosphate phosphatase FBpp CG5009-PA acyl-coa oxidase FBpp CG4743-PA mitochondrial carrier protein FBpp Actin-like protein 13E xliv
201 Molecular insights to crustacean phylogeny 9. Supplement FBpp cdc FBpp BBS FBpp Protein angel FBpp CG3735-PA chromosome 1 open reading frame FBpp CG6700-PA leukocyte receptor cluster (lrc) member FBpp CG11788-PA defective in sister chromatid cohesion 1 homolog FBpp Importin beta subunit FBpp CG12203-PA NADH: ubiquinone dehydrogenase putative du [NADH dehydrogenase (ubiquinone) Fe-S protein 4] FBpp Mitochondrial import inner membrane translocase subunit TIM FBpp Protein preli-like FBpp CG8709-PA lipin FBpp Probable phosphomevalonate kinase FBpp Protein arginine N- methyltransferase capsuleen FBpp Pyruvate dehydrogenase phosphatase (CG PA) FBpp Niemann-Pick Type C AAEL PA 1-acylglycerol-3- phosphate acyltransferase FBpp CG12512-PA AMP dependent coa ligase FBpp CG5608-PA Vac14 homolog FBpp CG31715-PA myotrophin FBpp Cytochrome b FBpp Pole FBpp Dihydroorotate dehydrogenase, mitochondrial precursor FBpp CG1104-PA, isoform A FBpp DNA polymerase alpha catalytic subunit FBpp CG3534-PA xylulose kinase FBpp Translocase of outer membrane FBpp CG13126-PA methyltransferase domain containing FBpp poly a polymerase FBpp CG10365-PA, isoform A ChaC, cation transport regulator homolog FBpp Probable signal peptidase complex subunit 2 du [signal peptidase complex subunit 2 homolog] FBpp CG9867-PA glycosyltransferase FBpp CG8891-PA inosine triphosphate pyrophosphatase (itpase) (inosine triphosphatase) xlv
202 9. Supplement Molecular insights to crustacean phylogeny FBpp Protein kinase C FBpp mitochondrial ribosomal protein L16 x FBpp CG5800-PA DEAD box ATPdependent RNA helicase FBpp CG4973-PA zinc finger protein putative FBpp CG1951-PA SCY1-like FBpp CG7146-PA vacuolar protein sorting homolog FBpp CG9399-PA, isoform A brain protein FBpp CG32579-PA XK, Kell blood group complex subunit-related family, member FBpp CG31717-PA phosphatidic acid phosphatase type 2 domain containing FBpp UPF0315 protein FBpp jagunal, isoform C FBpp Pdsw, isoform B FBpp DNA-directed RNA polymerase III 128 kda polypeptide FBpp Probable oligoribonuclease FBpp CG17187-PA DnaJ (Hsp40) homolog, subfamily C, member FBpp Arginine methyltransferase FBpp Putative 6-6- phosphogluconolactonase phosphogluconolactonas e FBpp CG4646-PA chromosome 1 open reading frame FBpp twister FBpp Adenosine deaminase FBpp CG15161-PA FBpp CG1826-PA BTB (POZ) domain containing FBpp CG9154-PA N-6 adenine-specific DNA methyltransferase 2 (putative) FBpp CG9588-PA 26S proteasome non- ATPase regulatory subunit FBpp CG3560-PA ubiquinol-cytochrome c reductase complex 14 kd protein FBpp Laminin gamma-1 chain precursor FBpp mitochondrial ribosomal x protein L FBpp Vesicular-fusion protein Nsf FBpp CG6206-PB, isoform B lysosomal alphamannosidase (mannosidase alpha class 2b member 1) FBpp Adenine phosphoribosyltransferas e AAEL PIWI xlvi
203 Molecular insights to crustacean phylogeny 9. Supplement PA FBpp CG10914-PA FBpp Cleavage and polyadenylation specificity factor, 160 kda subunit FBpp Xanthine dehydrogenase FBpp DNA-directed RNA polymerase I largest subunit DNA-directed RNA polymerase I largest subunit FBpp DNA mismatch repair protein spellchecker FBpp SMC FBpp Graf, isoform A FBpp CG9804-PA lipoate-protein ligase b FBpp Dak FBpp Tripeptidyl-peptidase FBpp Rhythmically expressed gene 2 protein FBpp Probable ATP-dependent RNA helicase Dbp73D FBpp Hypothetical protein CG FBpp Putative succinate dehydrogenase [ubiquinone] cytochrome b small subunit, mitochondrial precursor FBpp Signal recognition particle srp kda protein FBpp CG4511-PA viral IAP-associated factor putative FBpp lethal (3) neo18 du [NADH dehydrogenase (ubiquinone) 1 beta subcomplex, 5, 16kDa precursor] FBpp Probable DNA mismatch repair protein MSH FBpp thoc7, isoform A FBpp Probable ATP-dependent ATP-dependent RNA RNA helicase helicase FBpp CG31739-PA aspartyl-trna synthetase FBpp mitochondrial ribosomal x protein L FBpp ATP synthase O subunit, mitochondrial precursor du [Mitochondrial ATP synthase, O subunit precursor] FBpp CG33158-PB translation elongation factor longation factor Tu GTP binding domain containing 1 isoform FBpp CG33123-PA leucyl-trna synthetase FBpp CG11242-PA tubulin-specific chaperone b (tubulin folding cofactor b) FBpp CG9542-PA arylformamidase FBpp Superoxide dismutase [Mn], mitochondrial precursor xlvii
204 9. Supplement Molecular insights to crustacean phylogeny FBpp CG6379-PA FtsJ methyltransferase domain containing FBpp CG11079-PC, isoform C 5-formyltetrahydrofolate cyclo-ligase FBpp CG4686-PA FBpp Probable mitochondrial 28S ribosomal protein S25 x FBpp CG15014-PA THUMP domain containing FBpp Transportin Serine/Arginine rich FBpp CG31961-PA, isoform A tubulin folding cofactor c AAEL nuclear pore complex PA protein nup FBpp Probable prefoldin subunit FBpp CG9187-PA partner of sld FBpp CG1884-PB, isoform B FBpp CG13625-PA BUD13 homolog FBpp Protein male-less ATP-dependent RNA helicase FBpp CG13397-PA alpha-nacetylglucosaminidase FBpp Rev AAEL conserved hypothetical PA protein AAEL WD-repeat protein PA AAEL dj-1 protein PA FBpp CG15261-PA ribonuclease UK putative AAEL PA conserved hypothetical protein xlviii

205 Molecular insights to crustacean phylogeny 9. Supplement 3. RESULTS Figure S2 Resulting topology of final run 1. Pre-alignment conducted with MAFFT, mixed models are applied and the dataset is RY coded. Model settings are (gamma, linked) xlix

206 9. Supplement Molecular insights to crustacean phylogeny Figure S3 Resulting topology of final run 3. Pre-alignment conducted with MAFFT, no mixed models are applied and the dataset is RY coded. Model settings are (3 partitions, gamma, unlinked). l

207 Molecular insights to crustacean phylogeny 9. Supplement Figure S4 Resulting topology of final run 4. Pre-alignment conducted with MUSCLE, mixed models are applied and the dataset is RY coded. Model settings are (gamma, linked) li

208 9. Supplement Molecular insights to crustacean phylogeny Figure S5 Resulting topology of final run 5. Prealignment conducted with MUSCLE, mixed models are applied and the dataset is RY coded. Model settings are (gamma, unlinked) lii

209 Molecular insights to crustacean phylogeny 9. Supplement Figure S6 Resulting topology of final run 6. Manual alignment pre-aligned with MUSCLE, the dataset is parted in three partitions. Model settings are (gamma, linked) liii

210 9. Supplement Molecular insights to crustacean phylogeny Figure S7 Resulting topology of final run 8. Manual alignment pre-aligned with MUSCLE, the dataset is parted in three partitions. Model settings are (gamma, linked) liv

211 Molecular insights to crustacean phylogeny 9. Supplement Figure S8 Resulting topology of final run 9. Manual alignment pre-aligned with MUSCLE, the dataset is parted in three partitions. Model settings are (gamma, linked) lv
 with 10.000 bootstrap replicates.")
212 9. Supplement Molecular insights to crustacean phylogeny Figure S9 Resulting topology of final run 10. RAXML analysis (-f, a, GTR+CAT) with bootstrap replicates. lvi
 shows the MEGABLAST result of the mystacocarid sequence that was obtained in this thesis. B) pictures the result of the published sequence L81937.")
213 Molecular insights to crustacean phylogeny 9. Supplement Figure S10 MEGABLAST result of the two mystacocarid sequences. A) shows the MEGABLAST result of the mystacocarid sequence that was obtained in this thesis. B) pictures the result of the published sequence L The species color code is identical to all previous graphics. The mimimum-evolution trees (left) give a graphical (tree-like) summary of the BLAST results. The hits for highly similar sequences to the query sequence are shown on the right, the matching sequence parts are represented by the red bars. The first three hits are given more detailed in lvii
214 9. Supplement Molecular insights to crustacean phylogeny the tables. The first hits for A) are crustaceans, for B) chelicerates. As pictured in the tree and in the table the BLAST analysis finds highly similar sequences that are only chelicerates in the case of the published sequence (B). lviii
215 SUPPLEMENT - MANUSCRIPT I
216 BMC Evolutionary Biology BioMed Central Research article Can comprehensive background knowledge be incorporated into substitution models to improve phylogenetic analyses? A case study on major arthropod relationships Björn M von Reumont* 1, Karen Meusemann 1, Nikolaus U Szucsich 2, Emiliano Dell'Ampio 2, Vivek Gowri-Shankar, Daniela Bartel 2, Sabrina Simon 3, Harald O Letsch 1, Roman R Stocsits 1, Yun-xia Luan 4, Johann Wolfgang Wägele 1, Günther Pass 2, Heike Hadrys 3,5 and Bernhard Misof 6 Open Access Address: 1 Molecular Lab, Zoologisches Forschungsmuseum A. Koenig, Bonn, Germany, 2 Department of Evolutionary Biology, University Vienna, Vienna, Austria, 3 ITZ, Ecology & Evolution, Stiftung Tieraerztliche Hochschule Hannover, Hannover, Germany, 4 Institute of Plant Physiology and Ecology, Shanghai Institutes for Biological Sciences, Chinese Academy of Sciences, Shanghai, PR China, 5 Department of Ecology and Evolutionary Biology, Yale University, New Haven, CT, USA and 6 UHH Biozentrum Grindel und Zoologisches Museum, University of Hamburg, Hamburg, Germany Björn M von Reumont* - bmvr@arcor.de; Karen Meusemann - mail@karen-meusemann.de; Nikolaus U Szucsich - nikola.szucsich@univie.ac.at; Emiliano Dell'Ampio - emiliano.dell.ampio@univie.ac.at; Vivek Gowri- Shankar - gowrishv@cs.man.ac.uk; Daniela Bartel - dani.bartel@chello.at; Sabrina Simon - sabrina.simon@ecolevol.de; Harald O Letsch - hletsch@freenet.de; Roman R Stocsits - roman.stocsitz@gmail.com; Yun-xia Luan - yxluan@sibs.ac.cn; Johann Wolfgang Wägele - w.waegele.zfmk@uni-bonn.de; Günther Pass - guenther.pass@univie.ac.at; Heike Hadrys - heike.hadrys@ecolevol.de; Bernhard Misof - bernhard.misof@uni-hamburg.de * Corresponding author Published: 27 May 2009 BMC Evolutionary Biology 2009, 9:119 doi: / Received: 29 September 2008 Accepted: 27 May 2009 This article is available from: von Reumont et al; licensee BioMed Central Ltd. This is an Open Access article distributed under the terms of the Creative Commons Attribution License ( which permits unrestricted use, distribution, and reproduction in any medium, provided the original work is properly cited. Abstract Background: Whenever different data sets arrive at conflicting phylogenetic hypotheses, only testable causal explanations of sources of errors in at least one of the data sets allow us to critically choose among the conflicting hypotheses of relationships. The large (28S) and small (18S) subunit rrnas are among the most popular markers for studies of deep phylogenies. However, some nodes supported by this data are suspected of being artifacts caused by peculiarities of the evolution of these molecules. Arthropod phylogeny is an especially controversial subject dotted with conflicting hypotheses which are dependent on data set and method of reconstruction. We assume that phylogenetic analyses based on these genes can be improved further i) by enlarging the taxon sample and ii) employing more realistic models of sequence evolution incorporating nonstationary substitution processes and iii) considering covariation and pairing of sites in rrna-genes. Results: We analyzed a large set of arthropod sequences, applied new tools for quality control of data prior to tree reconstruction, and increased the biological realism of substitution models. Although the split-decomposition network indicated a high noise content in the data set, our measures were able to both improve the analyses and give causal explanations for some incongruities mentioned from analyses of rrna sequences. However, misleading effects did not completely disappear. Page 1 of 19 (page number not for citation purposes)
217 BMC Evolutionary Biology 2009, 9:119 Conclusion: Analyses of data sets that result in ambiguous phylogenetic hypotheses demand for methods, which do not only filter stochastic noise, but likewise allow to differentiate phylogenetic signal from systematic biases. Such methods can only rely on our findings regarding the evolution of the analyzed data. Analyses on independent data sets then are crucial to test the plausibility of the results. Our approach can easily be extended to genomic data, as well, whereby layers of quality assessment are set up applicable to phylogenetic reconstructions in general. Background Most recent studies that focused on the reconstruction of ancient splits in animals, have relied on 18S and/or 28S rrna sequences, e.g. [1]. These data sets strongly contributed to our knowledge of relationships, however, several nodes remain that are suspected of being artifacts caused by peculiar evolutionary rates which may be lineage specific. Particular unorthodox nodes were discussed as long branch artifacts, others were held to be clusters caused by non-stationary evolutionary processes as indicated by differences in nucleotide composition among the terminals. The reconstruction of ancient splits seems to be especially dependent on taxon sampling and character choice, since in single lineages the signal-to-noise ratio is consistently marginal in allowing a reasonable resolution. Thus, quality assessment of data via e.g. secondary structure guided alignments, discarding of randomly similar aligned positions or heterogeneity of the data set prior to analysis is a crucial step to obtain reliable results. Arthropod phylogeny is especially suitable as a case study, since their ancient and variable phylogenetic history, which may have included intermittent phases of fast radiation, impedes phylogenetic reconstruction. Major arthropod relationships While currently there is wide agreement about the monophyly of Arthropoda, relationships among the four major subgroups (Chelicerata, Myriapoda, Crustacea, Hexapoda) remain contested, even the monophyly of each of the subgroups has come under question. The best supported relationship among these subgroups seems to be the clade comprising all crustaceans and hexapods. This clade, named Pancrustacea [2], or Tetraconata [3], is supported by most molecular analyses, e.g. [1,4-14]. Likewise, the clade has increasingly found support from morphological data [3,15-18], especially when malacostracans are directly compared with insects. Most of these studies reveal that crustaceans are paraphyletic with respect to a monophyletic Hexapoda. However, most analyses of mitochondrial genes question hexapod monophyly [19-22]. Additionally, various crustacean subgroups are discussed as potential hexapod sister groups. Fanenbruck et al. [15] favored a derivation of Hexapoda from a common ancestor with Malacostraca + Remipedia based on neuroanatomical data. In recent molecular studies, either Branchiopoda [12] or Copepoda [1,11,23] emerged as the sister group of Hexapoda. The Pancrustacea hypothesis implies that Atelocerata (Myriapoda + Hexapoda) is not monophyletic. In most of the above mentioned molecular studies, the Myriapoda appear at the base of the clade Mandibulata or as the sistergroup to Chelicerata. The combination of Chelicerata + Myriapoda [1,7,13,14,24] was coined Paradoxopoda [11] or Myriochelata [10]. It seems that this grouping can be partly explained by signal erosion [25], and likewise is dependent on outgroup choice [26]. In addition, the most recent morphological data is consistent with the monophyly of Mandibulata [27], but not of Myriochelata. Almost no morphological data corroborate Myriochelata except for a reported correspondence in neurogenesis [28]; this however alternatively may reflect the plesiomorphic state within Arthropoda [29,30]. Within Hexapoda, relationships among insect orders are far from being resolved [31-35]. Open questions concern the earliest splits within Hexapoda, e.g. the monophyly or paraphyly of Entognatha (Protura + Diplura + Collembola) [9,19,22,32,34,36-45]. Goals and methodological background The aim of the present study is to optimize the phylogenetic signal contained in 18S and 28S rrna sequences for the reconstruction of relationships among the major arthropod lineages. A total of 148 arthropod taxa representing all major arthropod clades including onychophorans and tardigrades (the latter as outgroup taxa) were sampled to minimize long-branch artifacts [25]. A new alignment procedure that takes secondary structure into account is meant to corroborate the underlying hypotheses of positional homology as accurately as possible. A new tool for quality control optimizes the signal-to-noise ratio for the final analyses. In the final step, we try to improve the analyses by fitting biologically realistic mixed DNA/RNA substitution models to the rrna data. Timeheterogeneous runs were performed to allow for lineage specific variation of the model of evolution. The use of secondary structure information both corroborates hypotheses of positional homology in the course of sequence alignment, as well as helps to avoid misleading effects of character dependence due to covariation among sites. It was demonstrated that ignoring correlated variance may mislead tree reconstructions biased by an over- Page 2 of 19 (page number not for citation purposes)
218 BMC Evolutionary Biology 2009, 9:119 emphasis of changes in paired sites [34,46,47]. Evolutionary constraints on rrna molecules are well known, for example constraints resulting from secondary structure interactions. The accuracy of rrna comparative structure models [48-50] has been confirmed by crystallographic analyses [51,52]. Based on this background knowledge, rrna sequences are an ideal test case to study the effect of biologically realistic substitution models on tree reconstructions. Recent studies of genome scale data revealed that a careful choice of biologically realistic substitution models and model fitting are of particular importance in phylogenetic reconstructions [53-55]. The extent, however, to which biological processes can/should be modeled in detail is still unclear. The analyses of rrna sequences can still deliver new insights in this direction, since the relatively comprehensive background knowledge allows to better separate different aspects of the substitution processes. In order to model covariation in rrna sequences, we estimated secondary structure interactions by applying a new approach implemented in the software RNAsalsa [56] (download available from which helps to accommodate inadequate modeling (e.g. missing covariotide effects) of rrna substitution processes in deep phylogenetic inference [34,57]. Essentially, this approach combines prior knowledge of conserved site interactions modeled in a canonical eukaryote secondary structure consensus model with the estimation of alternative and/or additional site interactions supported by the specific data. Inferred site covariation patterns were used then to guide the application of mixed substitution models in subsequent phylogenetic analyses. Finally, we accounted for inhomogeneous base composition across taxa, a frequently observed phenomenon indicating non-stationary substitution processes [58-60]. Non-stationary processes, if present, clearly violate assumptions of stationarity regularly assumed in phylogenetic analyses [60-62]. Thus, we modeled non-stationary processes combined with the application of mixed DNA/ RNA substitution models in a Bayesian approach using the PHASE-2.0 software package [63] to provide a better fit to our data than standard substitution models [60,64]. In PHASE-2.0 a nonhomogeneous substitution model is implemented [...] "by introducing a reversible jump Markov chain Monte Carlo method for efficient Bayesian inference of the model order along with other phylogenetic parameters of interest" [60]. Application of a new hierarchical prior leads to more reasonable results when only a small number of lineages share a particular substitution process. Additionally PHASE-2.0 includes specialized substitution models for RNA genes with conserved secondary structure [60]. Results We contributed 103 new and nearly complete 18S or 28S rrna sequences and analyzed sequences for 148 taxa (Additional file 1), of which 145 are Arthropoda sensu stricto, two onychophorans and Milnesium sp. (Tardigrada). The alignment of the 18S rrna sequences comprised 3503 positions, and the 28S rrna alignment The final secondary consensus structures included 794 paired positions in the 18S and 1326 paired positions in the 28S. The consensus structures contained all paired sites that in 60% or more sequences were detected after folding (default s3 = 0.6 in RNAsalsa). ALISCORE[65] scored 1873 positions as randomly similar (negative scoring values in the consensus profile) to the 18S and 5712 positions of the 28S alignment (Figure 1). Alignment filtering and concatenation of data After the exclusion of randomly similar sections identified by ALISCORE, 1630 (originally 3503) of the 18S rrna and 2472 (originally 8184) positions of the 28S rrna remained. Filtered alignments were concatenated and used for analyses in PHASE-2.0. The concatenated alignment comprised 4102 positions. Split supporting patterns The neighbornet graph, which results from a split decomposition based on uncorrected p-distances (Figure 2) and LogDet correction plus invariant sites model (see Additional file 2) pictured a dense network, which hardly resembles a tree-like topology. This indicates the presence of some problems typical in studies of deep phylogeny: a) Some taxa like Diptera (which do not cluster with ectognathous insects), Diplura, Protura and Collembola each appear in a different part of the network with Diplura and Protura seperated from other hexapods, Lepisma saccharina (clearly separated from the second zygentoman Ctenolepisma that is nested within Ectognatha), Symphyla, Pauropoda, as well as Remipedia and Cephalocarida have very long branches. Consequently the taxa may be misplaced due to signal erosion or occurrence of homoplasies, and their placement in trees must be discussed critically [25]. The usage of the LogDet distance adjusts the length of some branches but does not decrease the amount of conflicts in deep divergence splits. b) The inner part of the network shows little treeness, which indicates a high degree of conflicting signal. A remarkable observation seen in both phylogenetic networks is that some taxa have long stem-lineages, which means that the species share distinct nucleotide patterns not present in other taxa. Such well separated groups are Copepoda, Branchiopoda, Cirripedia, Symphyla, Collembola, Diplura, Protura and Diptera, while e.g. Myriapoda partim, Chelicerata and the Ectognatha (bristletails, silver- Page 3 of 19 (page number not for citation purposes)
219 score score BMC Evolutionary Biology 2009, 9:119 Aliscore profile of 18S rrna positions Aliscore profile of 28S rrna positions ALISCORE Figure 1 consensus profiles of rrna alignments ALISCORE consensus profiles of rrna alignments. 1A ALISCORE consensus profile of the 18S rrna alignment generated from single profiles of aligned positions after applying the sliding window approach based on MC resampling. Randomly similar sections (1873 positions) show negative score values or positive values non-random similarity (y-axis). Sequence length and positions are given on the x-axis. 1B ALISCORE consensus profile of the 28S rrna alignment generated from single profiles of aligned positions after applying the sliding window approach based on MC resampling. Randomly similar sections (5712 positions) show negative score values or positive values for non-random similarity (y-axis). Sequence length and positions are given on the x-axis. fish/firebrats and pterygote insects) excluding Diptera share weaker patterns. Compositional heterogeneity of base frequency We excluded in PAUP 4.0b10 [66] parsimony uninformative positions explicitely for the base compositional heterogeneity test. Randomly similar alignment blocks identified by ALISCORE were excluded for both, the base compositional heterogeneity test and phylogenetic recontructions. 901 characters of the 18S rrna and 1152 characters of the 28S rrna were separately checked for inhomogeneous base frequencies. Results led to a rejection of the null hypothesis (H 0 ), which assumes homogeneous base composition among taxa (18S: 2 = , df = 441, P = 0.00; 28S: 2 = , df = 441, P = 0.00). Thus, base frequencies significantly differed across taxa in both 18S and 28S data sets. Page 4 of 19 (page number not for citation purposes)
220 BMC Evolutionary Biology 2009, 9:119 Collembola Pentastomida Mystacocarida Myriapoda partim Chelicerata Tardigrada Pauropoda Symphyla Onychophora Diplura Protura Copepoda Lepisma ( Zygentoma ) Ectognatha Branchiura Cirripedia 0.01 Branchiopoda Malacostraca Ostracoda hexapods crustaceans myriapods chelicerates Diptera Penaeus ( Malacostraca ) Cephalocarida Remipedia Neighbornet Figure 2 graph of the concatenated 18S and 28S rrna alignment Neighbornet graph of the concatenated 18S and 28S rrna alignment. Neighbornet graph based on uncorrected p- distances constructed in SplitsTree4 using the concatenated 18S and 28S rrna alignment after exclusion of randomly similar sections evaluated with ALISCORE. Hexapods are colored blue, crustaceans red, myriapods brown and chelicerates green. Quotation marks indicate that monophyly is not supported in the given neighbornet graph. A data partition into stems and loops revealed 477 unpaired positions and 424 paired positions in the 18S, and 515 unpaired and 637 paired positions in the 28S. Separate analyses of all four partitions confirmed heterogeneity of base frequencies across taxa in all sets (P = 0.00 in all four partitions). We repeated the homogeneity test for partitions as used in tree reconstruction, if base pairs were disrupted by the identification of the corresponding partner as randomly similar (ALISCORE), remaining formerly paired positions were treated as unpaired. Hence, 1848 characters of the concatenated alignment (18S: 706; 28S: 1142) were treated as paired in all analyses. Again the test revealed heterogeneity in unpaired characters of both the 18S and 28S (P = 0.00 for both genes; 18S: 506 characters; 28S: 567 characters). Examination at paired positions also rejected the null hypothesis H 0 (18S, 395 characters included: P < , 28S, 585 characters included: P = 0.00). Since non-stationary processes in all tests were strongly indicated, we chose to apply time-heterogeneous models to account for lineage-specific substitution patterns. To fix the number of "free base frequency sub-models" in time-heterogeneous analyses, we identified the minimal exclusive set of sequence groups. Based on 2 - tests the dataset could be divided into three groups for both rrna genes. In both genes Diptera are characterized by a high A/T content and Diplura by a low A/T content. Exclusion of only one of the groups was not sufficient to retain a homogeneous data set (18S: excluding Diptera: 2 = , df = 423, P = 0.00, excluding Diplura: 2 = , df = 423, P < ; 28S: excluding Diptera: 2 = Page 5 of 19 (page number not for citation purposes)
221 BMC Evolutionary Biology 2009, 9: , df = 423, P = 0.00, excluding Diplura: 2 = 813.8, df = 423, P = 0.00). Simultaneous exclusion of both groups led to acceptance of H 0 for 18S sequences ( 2 = , df = 405, P = 0.99). For the 28S, after exclusion of both groups, H 0 was still rejected ( 2 = , df = 405, P < ). After sorting taxa according to base frequencies in ascending order, additional exclusion of Peripatus sp. and Sinentomon erythranum resulted in a homogeneous base composition for the 28S gene (H 0 : 2 = , df = 399, P = 0.1), likewise indicating that three sub-models are suffucient to cover the taxon set. We repeated the homogeneity-test for stem and loop regions of each gene seperately. The exclusion of Diplura was sufficient to obtain homogeneity in the loop regions for both genes (18S: 474 characters, P = ; 28S: 541 characters, P = ). For stem regions in the 18S it likewise was sufficient to exclude either Diptera (378 characters, P = ) or Diplura (385 characters, P = 0.99). These partitions would make two sub-models sufficient to cover the data set. However, in the stem regions of the 28S homogeneity was received only after the exclusion of both Diptera and Diplura (547 characters, P = 0.99). Since PHASE-2.0 does not allow to vary the number of chosen sub-models among partitions, we applied and fitted three sub-models to each data partition. Phylogenetic reconstructions Three combinations of mixed DNA/RNA models (REV + & RNA16I +, TN93 + & RNA16J + and HKY85 + & RNA16K + ) were compared to select the best model set. Overall model ln likelihoods converged for all tested mixed models after a burn-in of 250,499 generations in an initial pre-run of 500,000 generations. However, most parameters did not converge for the combined REV + & RNA16I + models, consequently, this set up was excluded from further analyses. For each of the remaining two sets a chain was initiated for 3 million generations, with a burn-in set to 299,999 generations. The applied Bayes Factor Test [[67,68], BFT], favored the TN93 + & RNA16J + model combination (2lnB 10 = , harmonic mean lnl 0 (TN93 + & RNA16J + ) = ; harmonic mean lnl 1 (HKY85 + & RNA16K + ) = ). For each approach (Aditional file 3) all chains which passed a threshold value in a BFT were assembled to a metachain. Each resulting extended majority rule consensus tree was rooted with Milnesium. Node support values for clades were deduced from 56,000 sampled trees for the time-heterogeneous set (Figure 3) and from 18,000 sampled trees for the time-homogeneous set (Figure 4), detailed support values are shown in Additional file 3. Harmonic means of the ln likelihoods of included time-heterogeneous chains were compared against all ln likelihoods of included time-homogeneous chains (burnin discarded) in a final BFT: the time-heterogeneous model was strongly favored (2lnB 10 = ). Resulting topologies Representatives of Symphyla and Pauropoda, already identified in the neighbornet graph as taxa with conspicuously long branches (Figure 2), assumed unorthodox positions in both trees which are clearly incongruent with morphological evidence and results obtained from other genes. Symphyla formed the sister group of all remaining arthropod clades, and Pauropoda clustered with Onychophora. Consequently, myriapods always appeared polyphyletic in both analyses. We consider these results as highly unlikely, since they contradict all independent evidence from morphology, development, and partly from other genes. In the following, we focus on major clades and point out differences between time-heterogeneous tree (Figure 3) and time-homogeneous tree (Figure 4) without considering the position of Symphyla and Pauropoda. Possible causes for the misplacement of these groups, however, will be treated in the discussion. Both analyses supported a monophyletic Chelicerata (pp 0.91 in the time-heterogeneous tree and maximal support in the time-homogeneous tree) with Pycnogonida (sea spiders) as sister group to remaining chelicerates. Pycnogonida received maximal support in both analyses. Euchelicerata received highest support in the time-homogeneous approach while this clade in the time-heterogeneous approach received a support of only pp Limulus polyphemus (horseshoe crab) clustered within arachnids, but some internal relationships within Euchelicerata received only low support. Chilopoda always formed the sister group of a monophyletic Diplopoda in both analyses with high support. Within the latter the most ancient split lied between Penicillata and Helminthomorpha. This myriapod assemblage Myriapoda partim formed the sister group of Chelicerata, thus giving support to the Myriochelata hypothesis, respectively Myriochelata partim, when the long-branch clades Symphyla and Pauropoda are disregarded. Pancrustacea showed always maximal support. The monophyly of Malacostraca and Branchiopoda received highest support in both approaches while their position varied. Branchiopoda was the sister group of the clade consisting of Copepoda + Hexapoda in the homogeneous tree (Figure 4), however the cephalocarid Hutchinsoniella nested within hexapods. Among hexapods, monophyly was unambiguously supported for Protura, Diplura, Collembola, Archaeognatha, Odonata, Ephemeroptera, Phasmatodea, Mantophasmatodea, Mantodea, Plecoptera, Hemiptera, Coleoptera, Hymenoptera, Lepidoptera and Diptera. Diplura clustered with Protura, and gave support to a monophyletic Nonoculata. Pterygota occurred in both topologies, well supported in the non-stationary tree (pp 0.97) and with moderate support (pp 0.94) in stationary tree. Within the winged insects, both analyses resolved Odonata as the sister group to a well supported mono- Page 6 of 19 (page number not for citation purposes)


222 BMC Evolutionary Biology 2009, 9:119 Myriochelata partim Pancrustacea Milnesium sp Entognatha Hexapoda Ectognatha Dicondyla Pterygota Neoptera Holometabola Nymphon stroemii Colossendeis sp. Anoplodactylus portus Callipallene sp. Eremobates sp. Symphyla Siro rubens Pandinus imperator Limulus polyphemus Mastigoproctus giganteus Paraphrynus sp. Pauropodidae sp. Allopaurus sp Chalocheiridius cf. termitophilus Dermacentor sp. Amblyomma americanum Misumenops asperatus Aphonopelma hentzi Monographis sp. Polyxenus lagurus Cylindroiulus caeruleocinctus Orthoporus sp. Polydesmus complanatus Paradoxosomatidae sp. Cherokia georgiana Scutigera coleoptrata Craterostigmus tasmanianus Lithobius forficatus Scolopendra mutilans Otostigmus politus Derocheilocaris typicus Pontocypris mytiloides Heterocypris incongruens Peripatoides novaezealandiae Peripatus sp. Symphylella sp. Hanseniella sp. Scutigerella sp. Argulus foliacaeus Semibalanus balanoides Speleonectes tulumensis Pollicipes pollicipes Megabalanus californicus Cirripedia Nebalia sp. Penaeus vannamei Homarus americanus Anaspides tasmaniae Squilla empusa Malacostraca Heteromysis sp. Raillietiella sp. Pentastomida Bosmina sp. Hutchinsoniella macracantha Cephalocarida Daphnia cf. magna 0.77 Triops longicaudatus Triops cancriformis Branchiopoda Eulimnadia texana Artemia sp. Canuella perplexa Chondracanthus lophii Cyclopidae sp. Copepoda Lepeophtheirus salmonis 0.70 Tigriopus cf. fulvus 0.99 Eosentomon sakura Sinentomon erythranum Eosentomon sp. Protura Baculentulus densus 0.98 Acerentomon franzi Campodea augens Campodeidae sp Lepidocampa weberi Octostigma sinensis 0.98 Diplura Parajapyx emeryanus Catajapyx aquilonaris Megalothorax minimus Pogonognathellus flavescens Orchesella villosa Isotoma viridis Cryptopygus antarcticus Dicyrtomina saundersi Allacma fusca Sminthurus viridis Triacanthella sp. Tetrodontophora bielanensis Podura aquatica Gomphiocephalus hodgsoni Anurida maritima Bilobella aurantiaca Lepismachilis y-signata Pedetontus okajimae Machilis hrabei 0.98 Ctenolepisma longicaudata Epiophlebia superstes Lestes viridis Progomphus obscurus 0.95 Aeshna juncea Brachytron pratense Leucorrhinia sp Sympetrum danae Oxygastra curtisi 0.88 Somatochlora flavomaculata Cordulia aenea Callibaetes ferrugineus Siphlonura aestivalis Epeorus sylvicola Pycnogonida Acheta domesticus Thyrannophasma gladiator 0.82 Mantophasma zephyra Bacillus rossius 0.81 Carausius morosus Pholidoptera griseoaptera Leptophyes punctatissima Anacridium aegypticum 0.99 Gomphocerinae sp. Harpocera thoracica Rhaphigaster nebulosa Phyrrocoris apterus Cercopis vulnerata Pectinariophyes reticulata Clastoptera obtusa Forficula auricularia Nemoura flexuosa Isoperla sp Zootermopsis angusticollis Ectobius lapponicus Blattella germanica Gromphadorhina laevigata Hierodula membranacea Mantis religiosa Tenthredinidae sp. Myrmecia croslandi Vespula pensylvanica Scolia sp. Nomada sp. Silpha obscura Tenebrio sp Pauropoda Diplopoda Merope tuber Ctenocephalides felis Boreus hyemalis Pieris napi Triaenodes sp. Oxyethira rossi Euchelicerata Chilopoda Mystacocarida Ostracoda Odonata Collembola Archaeognatha Ephemeroptera Neoptera Branchiura Drosophila melanogaster 0.85 Lepisma saccharina Onychophora Remipedia Zygentoma Chironomus tentans Acricotopus lucens Simulium sanctipauli Aedes albopictus Anopheles albimanus Diptera Hexapoda Myriapoda Myriapoda Chelicerata Crustacea Time-heterogeneous Figure 3 consensus tree Time-heterogeneous consensus tree. Consensus tree from 56,000 sampled trees of the time-heterogeneous substitution process inferred by PHASE-2.0, graphically processed with Adobe Illustrator CS2. Support values below 0.70 are not shown (nodes without dots), nodes with a maximum posterior probability (pp) of 1.0 are represented by dots only. Quotation marks indicate that monophyly is not supported in the given tree. Page 7 of 19 (page number not for citation purposes)


223 BMC Evolutionary Biology 2009, 9:119 Myriochelata partim Pancrustacea Pterygota Neoptera Holometabola Milnesium sp. Nymphon stroemii Colossendeis sp. Anoplodactylus portus Callipallene sp. Eremobates sp Symphyla Pauropodidae sp. Allopaurus sp. Pycnogonida Chalocheiridius cf. termitophilus Dermacentor sp. Amblyomma americanum Siro rubens Pandinus imperator Limulus polyphemus Mastigoproctus giganteus 0.91 Paraphrynus sp. Misumenops asperatus 0.99 Aphonopelma hentzi Monographis sp. Polyxenus lagurus Cylindroiulus caeruleocinctus Orthoporus sp. Polydesmus complanatus 0.98 Paradoxosomatidae sp. Cherokia georgiana Scutigera coleoptrata 0.98 Craterostigmus tasmanianus Lithobius forficatus Scolopendra mutilans Chilopoda Otostigmus politus 0.75 Derocheilocaris typicus Raillietiella sp Argulus foliacaeus Canuella perplexa Cyclopidae sp. Tigriopus cf. fulvus 0.93 Chondracanthus lophii Lepeophtheirus salmonis Lepisma saccharina Pauropoda Peripatoides novaezealandiae Peripatus vsp. Diplopoda Euchelicerata Mystacocarida Pentastomida Semibalanus balanoides Pollicipes pollicipes Megabalanus californicus Pontocypris mytiloides Heterocypris incongruens Ostracoda 0.99 Nebalia sp. Penaeus vannamei Homarus americanus Anaspides tasmaniae Squilla empusa Heteromysis sp. Bosmina sp. Daphnia cf. magna Triops longicaudatus Triops cancriformis Eulimnadia texana Artemia sp. Megalothorax minimus Pogonognathellus flavescens Orchesella villosa Isotoma viridis 0.75 Cryptopygus antarcticus Dicyrtomina saundersi Allacma fusca Sminthurus viridis Triacanthella sp. Tetrodontophora bielanensis Gomphiocephalus hodgsoni Podura aquatica Anurida maritima Bilobella aurantiaca Lepismachilis y-signata Pedetontus okajimae Machilis hrabei Ctenolepisma longicaudata Epiophlebia superstes Lestes viridis Progomphus obscurus 0.99 Aeshna juncea Brachytron pratense Leucorrhinia sp. Sympetrum danae Oxygastra curtisi Somatochlora flavomaculata Cordulia aenea Callibaetes ferrugineus Siphlonura aestivalis Epeorus sylvicola Zootermopsis angusticollis Ectobius lapponicus Blattella germanica Gromphadorhina laevigata Hierodula membranacea Mantis religiosa Acheta domesticus 0.99 Thyrannophasma gladiator Mantophasma zephyra Bacillus rossius 0.98 Carausius morosus Pholidoptera griseoaptera Leptophyes punctatissima Anacridium aegypticum 0.78 Gomphocerinae sp. Harpocera thoracica Rhaphigaster nebulosa Phyrrocoris apterus Cercopis vulnerata Pectinariophyes reticulata Clastoptera obtusa Forficula auricularia Nemoura flexuosa Isoperla sp. Tenthredinidae sp. Myrmecia croslandi Vespula pensylvanica Scolia sp. Nomada sp. Silpha obscura Tenebrio sp. Merope tuber Ctenocephalides felis Boreus hyemalis Pieris napi Triaenodes sp. Oxyethira rossi Branchiopoda Collembola Archaeognatha Zygentoma Odonata Ephemeroptera Neoptera Symphylella sp. Hanseniella sp. Scutigerella sp. Onychophora Branchiura Cirripedia Copepoda Eosentomon sakura 0.89 Malacostraca Zygentoma Hutchinsoniella macracantha Eosentomon sp. Sinentomon erythranum Baculentulus densus Acerentomon franzi Campodea augens Campodeidae sp. Lepidocampa weberi Octostigma sinensis Parajapyx emeryanus Catajapyx aquilonaris Drosophila melanogaster Remipedia Speleonectes tulumensis Protura Cephalocarida Diplura Chironomus tentans Acricotopus lucens Simulium sanctipauli Aedes albopictus Anopheles albimanus Diptera Hexapoda Myriapoda Myriapoda Chelicerata Crustacea Time-homogeneous Figure 4 consensus tree Time-homogeneous consensus tree. Consensus tree from 18,000 sampled trees of the time-homogeneous substitution process inferred by PHASE-2.0, graphically processed with Adobe Illustrator CS2. Support values below 0.70 are not shown (nodes without dots), nodes with a maximum posterior probability (pp) of 1.0 are represented by dots only. The grey dot indicates the clade containing all hexapod taxa including Hutchinsoniella (Crustacea) + Lepisma (Zygentoma); its node value is pp Quotation marks indicate that monophyly is not supported in the given tree. Page 8 of 19 (page number not for citation purposes)
224 BMC Evolutionary Biology 2009, 9:119 phyletic clade Ephemeroptera + Neoptera (heterogeneous: pp 0.96; homogeneous: pp 0.97), known as the "Chiastomyaria" clade [32,34,35,69]. Blattodea were always paraphyletic with respect to the isopteran representative. This assemblage formed a sister group relationship with Mantodea, thus giving support to a monophyletic Blattopteroidea or Dictyoptera while the position of Dictyoptera among hemimetabolan insects differed. Dermaptera always clustered with Plecoptera. Hemiptera (Heteroptera + Homoptera) in both approaches formed a clade with the remaining orthopterans + ((Acheta + Mantophamsmatodea)Phasmatodea) with low statistical support. Caused by Acheta orthopteran insects appeared always polyphyletic. Within the monophyletic Holometabola (pp 1.0), Hymenoptera formed the sister group of the remaining taxa. While the time-heterogeneous and time-homogeneous trees corresponded in overall topologies, they differed in a number of remarkable details. 1) Hexapoda, Entognatha, Ectognatha and Dicondylia were only reconstructed in the time-heterogeneous approach. 2) The cephalocarid Hutchinsoniella clustered among crustaceans as sister group to the Branchiopoda only in the heterogeneous approach, this clade formed the sister group to (Copepoda + Hexapoda) although with low support. 3) The time-homogeneous runs revealed highly supported (Malacostraca + Ostracoda) as the sister group to a clade ((Mystacocarida + Pentastomida) + (Branchiura + Cirripedia)). In contrast, in the time-heterogeneous analysis more terminal positioned Malacostraca are the sister group of a clade (Pentastomida((Cephalocarida + Branchiopoda) + (Copepoda + Hexapoda))). The altered postition of Pentastomida was only low supported in this tree. 4) In the homogeneous tree Hutchinsoniella emerged as sister taxon to Lepisma with low support (pp 0.72), and this cluster was positioned within the remaining hexapods (Figure 4). Hexapoda were monophyletic only in the time-heterogeneous approach, well supported (pp 0.96, Figure 3), with Copepoda as sister group, latter with low support (pp 0.69). 5) In the time-homogeneous tree (Figure 4), Copepoda emerged as sister group, again with a low support value (pp 0.70) of ((Lepisma + Hutchinsoniella) + "Hexapoda"). 6) Entognatha (pp 0.98), and Ectognatha (pp 1.0) and Dicondylia (pp 0.99) were monophyletic only in the time-heterogeneous tree. 7) The time-heterogeneous tree showed the expected paraphyly of primarily wing-less insects with Archaeognatha as sister group to Zygentoma + Pterygota. 8) Within pterygote insects (Dermaptera + Plecoptera) emerged as sister group of Dictyoptera in the non-stationary tree, contrary as sister group of Holometabola in the stationary tree, both scenarios with negligible support. Discussion Among arthropods 18S and 28S rrna genes have the densest coverage of known sequences. Apart of some exceptions most studies on phylogenetic relationships at least partly rely on rrna data. Often, however, only one of the genes was used, sometimes even just fragments of a gene [23,32,34,40,42,44,70-72], while only few studies used nearly complete 18S and 28S rrna sequences [1,11,73]. Despite this wide usage, the reliability of reconstructions based on rrna markers is still debated (for contradicting views see [34,74,75]. A major cause of concern is the pronounced site heterogeneity of evolutionary rates, the non-stationarity of base composition among taxa and rate variation in time. All three phenomena quickly lead to the erosion of phylogenetic signal [76]. On the one hand, our understanding of the molecular structure of other markers and about taxon-dependent processes of molecular evolution remains poor. On the other hand, our vast background knowledge regarding rrna molecules offers a unique opportunity to study the effects of selection and application of substitution models in greater detail. Quality check and character choice in alignments Phylogenetic signal in sequence data can get noisy due to (i) multiple substitution processes (saturation) and (ii) erroneous homology hypotheses caused by ambiguous sequence alignment. Both effects correspond in that they result in random similarity of alignment regions. Such noisy sections potentially bias tree reconstructions in several ways which have been appreciated for years but only recently been applied, that allow to account for these problems [25,54,77,78]. Exclusion of these ambiguously aligned or saturated regions can help to reduce noise, see e.g. [65]. If this topic is addressed at all, the majority of studies include a manual alignment check for untrustworthy regions [1,4,22,32,34,39,44,71-73]. Only some recent publications addressing arthropod relationships have used automated tools, e.g. [14,79,80]. To identify alignment sections of random similarity prior to tree reconstructions, we used ALISCORE, which, compared to the commonly used Gblocks [81], is not dependent on the specification of an arbitrary threshold [65]. To improve the signal-to-noise ratio we restricted our character choice to alignment sections which contained nucleotide patterns that differ from randomized patterns. Phylogenetic reconstruction methods Arthropod phylogenies have been inferred with reconstruction methods like Maximum Parsimony, Maximum Likelihood and Bayesian approaches. We tried to implement knowledge about the evolution of rrna in two ways: (i) the use of mixed DNA/RNA models is meant to Page 9 of 19 (page number not for citation purposes)
225 BMC Evolutionary Biology 2009, 9:119 account for known instances of character dependence due to compensatory mutations in stem regions, (ii) the application of time-heterogeneous models accounts for nonstationary processes that occurred in arthropod lineages. The consensus secondary structure of our dataset, generated with RNAsalsa, can be understood as a model parameter that defines site interactions and thus character dependence due to compensatory mutations [34,82,83]. Neglect of character dependence surely results in unrealistic support values. In single low supported nodes, where the signal-to-noise ratio is at the edge of resolution, such a neglect theoretically can even turn the balance between two competing hypotheses. Additionally a consensus secondary structure is necessary to apply a mixed model approach, since it determines whether the evolution of a given site is modeled by the DNA-model, or as part of a base-pair by the RNA-model. Within the mixed model approach, we opted for DNA-corresponding 16-state RNA models [63]. It can certainly be argued that the choice of 16-state models is problematic because it is difficult to fit these models to real data due to their parameter richness and heavy computational costs. However, even the best choice of a consensus secondary structure can only capture the predominantly conserved structural features among the sequences. This implies that the applied RNA models must be able to cope with mismatches in basepairing. Less complex RNA models like those of the 6 and 7-state families either ignore mismatches completely or pool these mismatches into a single character state which produces artificial synapomorphies. Additionally, according to Schöninger and v. Haeseler [84], it is more likely that co-variation is a multiple step process which allows for the intermediate existence of instable (non Watson- Crick) pairs. These intermediate states are only described in 16-state RNA models. Concerning rrna-genes of arthropods, shifts in base composition are mentioned for Diptera, Diplura, Protura and Symphyla [1,23,34,44,73,85]. Since base compositional heterogeneity within a dataset can mislead phylogenetic reconstruction [61,86,87] and [60], some of these studies discussed observed but not incorporated non-stationary processes as possible explanations for misplacements of some taxa [11,23,24,44,73]. The selective exclusion of these taxa to test for misleading effects on the remaining topology, however, is not appropriate to test whether non-stationarity really fits as the causal explanation of the placement incongruent with other analyses. LogDet methods have been applied to compensate for variations of base frequencies [1,11,44], which leads to some independence of non-stationarity, but among site rate variation (ASRV) cannot be handled efficiently. After detecting compositional base frequency heterogeneity in our data, we chose a non-stationary approach implemented in PHASE-2.0. Because no previous study of arthropod phylogeny has used a time-heterogeneous approach including mixed DNA/RNA models, we compared this approach with a "classical" time-homogeneous setup. Our results prove that the time-heterogeneous approach produces improved likelihood values with improved branch lengths estimates and more realistic, though not perfect (see below), topology estimates. Since modeling of general time-heterogeneous processes is in its infancy and since its behavioural effect on real data is relatively unknown [60,61], we favored a set up accounting for the three different "submodels" corresponding to three base frequency categories in our dataset (Additional file 4). The application of the three submodels to individual branches in a tree by the MCMC process was not further constrained. This scheme allowed for a maximum of flexibility without losing the proper mix of parameters. Conflicting phylogenetic hypotheses and non-stationary processes of rrna evolution The comparison of our time-homogeneous approach to our time-heterogeneous one was not only meant to show improvements in the application of more realistic models, but also to indicate which incongruities of analyses of rrna genes may be causally explained by non-stationary processes during the evolution of these genes. In our time-homogeneous approach, the crustacean Hutchinsoniella (Cephalocarida) clustered with Lepisma (Zygentoma, Hexapoda) within enthognathans as sister group to Nonoculata (Protura + Diplura), (see Figure 4). This led to the polyphyly or paraphyly of several major groups (e.g. Hexapoda, Entognatha, Ectognatha, Dicondylia). In our time-heterogeneous analysis, Cephalocarida clustered as sister group to Branchiopoda. This result, although marginal supported, is congruent, at least, with some morphological data [88]. Most recent molecular studies have not included Cephalocarida, e.g. [1,11]. Regier et al. [12] reconstructed a sister group relationship of Remipedia and Cephalocarida (likewise represented by Hutchinsoniella), but his result also received only moderate bootstrap support. The same clade was presented in Giribet et al. [9] based on morphological and molecular data. Independent of the sister group relationship of Cephalocarida within crustaceans, the correction of the misplacement of Hutchinsoniella, by allowing for non-stationary processes, has a major effect on the heuristic value of our analyses. Not only is the monophyletic status of Hexapoda, Entognatha, Ectognatha, Dicondylia supported after the correction, but likewise a causal explanation is given for the misplacement in the time-homogeneous approach, which cannot be accomplished by alternatively Page 10 of 19 (page number not for citation purposes)
226 BMC Evolutionary Biology 2009, 9:119 excluding the taxon. Our time-heterogeneous analyses resulted in a sister group relationship of Diplura and Protura, which lends support to a monophyletic Nonoculata within a monophyletic Entognatha. This result is congruent with trees published by Kjer [32], Luan et al. [44], Mallat and Giribet [1], and Dell'Ampio et al. [23]. Following Luan et al. [44] Dell'Ampio et al. [23] cautioned that Nonoculata may be an artificial cluster caused by a shared nucleotide bias and long branch attraction. Since this node is recovered with high support by our non-stationary approach, Nonoculata cannot be suspected of being an artificial group based on shared compositional biases alone. However, one must keep in mind that Protura and Diplura have longer branches than Ectognatha and Collembola (Figure 3 and 4), and long-branch effects may still be present. Thus monophyly of a clade Nonoculata still awaits support from a data set independent from rrna sequences. Clades not affected by non-stationary processes Symphyla and Pauropoda Although we tried to break down long branches by a dense taxon sampling, some long-branch problems persisted. We cannot clearly address the reason but, due to the symptoms, assume that saturation by multiple substitution caused signal erosion (class II effect, [25]). To evaluate the impact on the topology of the very likely incorrect positions of Symphyla and Pauropoda, we repeated the time-heterogeneous analysis using a reduced dataset excluding these taxa. We limited the analysis to ten chains with 7, 000, 000 generations each (2, 000, 000 burn-in). Differences occurring in the inferred consensus topology (not shown) of the final three chains (15, 000, 000 generations) show that some nodes are still sensitive to taxon sampling, since e.g. Pycnogonida clustered with (Chilopoda + Diplopoda) after exclusion of pauropod and symphylan sequences. Also the crustacean topology changed, remaining long branch taxa Hutchinsoniella and Speleonectes clustered together in the reduced dataset, forming a clade with (Branchiura + Cirripedia). Mandibulata versus Myriochelata Analyses of rrna sequences up till now were held to favor Myriochelata (Myriapoda + Chelicerata) over Mandibulata [1,4,11]. Our analyses provide no final conclusion with respect to this conflict, since the position of Pauropoda and Symphyla is unusual, it results in polyphyletic myriapods. The exact reconstruction of the position of myriapods within the Euarthropoda thus demands e.g. the application of new markers and suitable phylogenetic strategies. Phylogenetic position of Malacostraca and Pentastomida The position of Malacostraca differs among molecular studies. Often, Malacostraca emerge as nested within the remaining crustacean groups, e.g. [5,89]. Complete mitochondrial genomes place Malacostraca close to insects [90,91]. However, studies of rrna sequences recover this group as the sister group to all remaining crustaceans [1,11,92]. Since in our stationary tree monophyletic Malacostraca branched off at a more basal split within crustaceans [88,93], forming a sister group relationship to Ostracoda and contrary they branched off at a more terminal split in the non-stationary tree we cannot draw a final conclusion about the placement of Malacostraca. Unfortunately the position of the Pentastomida remains ambiguous in our analyses, we argue that low pp values might be induced by conflicting phylogenetic signal. Sister group of Hexapoda The sister group of Hexapoda is still disputed. Most molecular studies support paraphyly of crustaceans with respect to hexapods. A sister group relationship between Branchiopoda and Hexapoda was proposed for the first time by Regier and Shultz [94], yet with low support. Shultz and Regier [5] and Regier et al. [12] corroborated this relationship, which is likewise favored by authors of rrna-based studies [1,11], despite their result that Cyclopidae (Copepoda) is the sister group of Hexapoda. Our denser taxon sampling further supports Copepoda as the sister group to Hexapoda, but the low support value might indicate conflicting signal. This clade up till now, however, lacks any support from morphological studies. Ancient splits within pterygote insects We find that the rrna data cannot robustly resolve the most ancient splits within Pterygota. Nonetheless, rrna data, when analyzed under more realistic models favour Chiastomyaria as the most likely hypothesis. Since all three possible arrangements of Odonata, Ephemeroptera and Neoptera likewise receive morphological support, we agree with Whitfield and Kjer [35] that the ambiguity can best be explained by early 'explosive radiation' within Pterygota. Conclusion We conclude that the implementation of biologically realistic model parameters, such as site interaction (mixed DNA/RNA models) and compositional heterogeneity of base frequency, is fundamental to robustly reconstruct phylogenies. The most conspicuous examples comparing our tress are a) the position of Hutchinsoniella (Crustacea), although a low pp value of 0.59 in the non-stationary tree prohibits conclusions about its internal crustacean relationship and b) the well supported position of Ctenolepisma and Lepisma (Zygentoma). As a consequence, the monophyly of Hexapoda, Entognatha and Ectognatha and Dicondylia received support only in the time-heterogeneous approach. Sev- Page 11 of 19 (page number not for citation purposes)
227 BMC Evolutionary Biology 2009, 9:119 eral artificial clades remain in our analyses which cannot be causally explained unambiguously. However, the examples given here clearly demonstrate that the probability to causally explain some incongruities between different data sets, as well as the correction of certain obvious misplacements, is enhanced by using more complex but realistic models. The present study aimed to incorporate background knowledge on the evolution of molecular sequences in general and ribosomal RNAgenes in special into various steps of data processing. For all steps fully automated methods were used, including an automated secondary structure guided alignment approach, a software that enables to distinguish random similarity from putative phylogenetic signal, mixed models that avoid artefacts due to co-variation among sites, and analyses that account for variation of evolutionary rates among lineages. The resolution of many relationships among arthropods, and the minimization of obvious misplacements demonstrate that the increased computational effort pays off. Methods Taxon Sampling Our taxon sampling was designed to represent a taxonomically even collection of specimens across arthropod groups. In particular, we took care to include taxa which do not differ too widely from the hypothetical morphological ground-pattern of the represented group, when possible [53,78]. In total we included 148 concatenated 18S and 28S rrna sequences in the analysis (Additional file 1). Of these, we contributed 103 new sequences, 41 for the 18S and 62 for the 28S rrna gene, respectively. Only sequences which span at least 1500 bp for the 18S and 3000 bp for the 28S were included. For 29 taxa we had to construct chimeran concatenated sequences of 18S and 28S rrna sequences of different species, marked with an asterisk. Details are listed in Additional file 5, we chose species as closely related as possible depending on it's availability in GenBank. The outgroup included the concatenated 18S and 28S rrna sequences of Milnesium sp. (Tardigrada). Laboratory work Collected material was preserved in 94 99% ethanol or liquid nitrogen. Samples were stored at temperatures ranging from -20 C to -80 C. DNA extraction of complete specimens or tissue followed different standard protocols. We used phenol-chloroform isoamyl extraction [95], standard column DNA extraction kits DNeasy Blood & Tissue Kit (Qiagen) and NucleoSpin Tissue Kit (Machery-Nagel) following the manual. Single specimens were macerated for extraction, only specimens of Ctenocephalides felis were pooled. Manufacturer protocols were modified for all crustaceans, some apterygote hexapods and myriapods (overnight incubation and adding 8 l RNAse [10 mg/ml] after lysis). Extracted genomic DNA was amplified with the Illustra GenomiPhi V2 DNA Amplification Kit (GE Healthcare) for tiny, rare or hard to collect specimens. Partly published rrna primer sets were used, they were designed in part for specific groups (Additional file 6 and 7). The 18S of crustaceans was amplified in one PCR product and sequenced using four primer combinations. The 18S of apterygotes was amplified in three or four fragments (Additional file 8). The 28S of crustaceans and basal hexapods was amplified in nine overlapping fragments starting approximately in the middle of the rrna 5.8S to the nearly end of the D12 of 28S rrna (Additional file 9). The 28S of odonats was amplified in seven or eight, the 28S of ephemeropterans and neopterans in eight overlapping fragments (Additional file 10). Primers were ordered from Metabion, Biomers or Sigma-Genosys. PCR products were purified using following kits: NucleoSpin ExtractionII (Machery-Nagel), QIAquick PCR purification kit (Qiagen), peqgold Gel Extraction Kit (peqlab Biotechnologie GmbH), MultiScreen PCR Plate (Millipore) and ExoI (Biolabs Inc.)/SAP (Promega). Some samples were purified using a NHAc [4 mol] based ethanol precipitation. In case of multiple bands fragments with the expected size were cut from 1% 1.5% agarose gel and purified according to manufacturer protocols. Cycle sequencing and sequence analyses took place on different thermocyclers and sequencers. Cycle sequencing products were purified and sequenced double stranded. Several amplified and purified PCR products were sequenced by Macrogen (Inc.), Korea. Sequencing of the 28S fragment 28V D10b.PAUR of the Pauropodidae sp. (Myriapoda) was only successful via cloning. Fragments of the 28S rrna of the diplopod Monographis sp. (Myriapoda) were processed following Mallatt et al. [11] and Luan et al. [44]. Please refer to the electronic supplement (Additional file 11) for detailed information about PCRconditions, applied temperature profiles (Additional file 12), primer combinations, used chemicals (Additional file 13) and settings to amplify DNA fragments. Sequence electropherograms were analyzed and assembled to consensus sequences applying the software SeqMan (DNAStar Lasergene) or BioEdit 7.0 [96]. All sequences or composed fragments were blasted in NCBI using BLASTN, mega BLAST or "BLAST 2 SEQUENCES" [97] to exclude contaminations. Alignments and alignment evaluation Secondary structures of rrna genes were considered (as advocated in [98-101] to improve sequence alignment. Structural features are the targets of natural selection, thus Page 12 of 19 (page number not for citation purposes)
228 BMC Evolutionary Biology 2009, 9:119 the primary sequence may vary, as long as the functional domains are structurally retained. Alignments and their preparation for analyses were executed for each gene separately. We prealigned sequences using MUSCLE v3.6 [102]. Sequences of 24 taxa of Pterygota were additionally added applying a profile-profile alignment [103]. The 28S sequences of Hutchinsoniella macracantha (Cephalocarida), Speleonectes tulumensis (Remipedia), Raillietiella sp. (Pentastomida), Eosentomon sp. (Protura) and Lepisma saccharina (Zygentoma) were incomplete. Apart from L. saccharina, prealignments of these taxa had to be corrected manually. We used the "BLAST 2 SEQUENCES" tool to identify the correct position of sequence fragments in the multiple sequence alignment (MSA) for these incomplete sequences. The software RNAsalsa [56] is a new approach to align structural RNA sequences based on existing knowledge about structure patterns, adapted constraint directed thermodynamic folding algorithms and comparative evidence methods. It automatically and simultaneously generates both individual secondary structure predictions within a set of homologous RNA genes and a consensus structure for the data set. Successively sequence and structure information is taken into account as part of the alignment's scoring function. Thus, functional properties of the investigated molecule are incorporated and corroborate homology hypotheses for individual sequence positions. The program employs a progressive multiple alignment method which includes dynamic programming and affine gap penalties, a description of the exact algorithm of RNAsalsa will be presented elsewhere. As a constraint, we used the 28S + 5.8S (U53879) and 18S (V01335) sequences and the corresponding secondary structures of Saccharomyces cerevisae extracted from the European Ribosomal Database [ ]. Structure strings were converted into dot-bracket-format using Perlscripts. Folding interactions between 28S and 5.8S [74,107,108] required the inclusion of the 5.8S in the constraint to avoid artificial stems. Alignment sections presumably involved in the formation of pseudoknots were locked from folding to avoid artifacts. Pseudoknots in Saccharomyces cerevisae are known for the 18S (stem 1 and stem 20, V4-region: stem E23 9, E23 10, E23 11 and E23 13) while they are lacking in the 28S secondary structure. Prealignments and constraints served as input, and RNAsalsa was run with default parameters. We constructed manually chimeran 18S sequences of Speleonectes tulumensis (EU370431, present study and L81936) and 28S sequences of Raillietiella sp. (EU370448, present study and AY744894). Concerning the 18S of Speleonectes tulumensis we combined positions of L81936 and positions of sequence EU Regarding the 28S of Raillietiella we combined positions of AY with positions of sequence EU Position numbers refer to aligned positions. RNAsalsa alignments were checked with ALISCORE[65]. ALISCORE generates profiles of randomness using a sliding window approach. Sequences within this window are assumed to be unrelated if the observed score does not exceed 95% of scores of random sequences of similar window size and character composition generated by a Monte Carlo resampling process. ALISCORE generates a list of all putative randomly similar sections. No distinction is made between random similarity caused by mutational saturation and alignment ambiguity. A sliding window size (w = 6) was used, and gaps were treated as ambiguities (- N option). The maximum number of possible random pairwise comparisons (- r: 10,878) was analyzed. After the exclusion of putative random sections and uninformative positions using PAUP 4.0b10, alignments were checked for compositional base heterogeneity using the 2 -test. Additionally, for each sequence the heterogeneity-test was performed for paired and unpaired sites separately. Further heterogeneity-tests were applied to determine the minimal number of base frequency groups. RNAsalsa generated consensus structure strings for 18S and 28S rrna sequences, subsequently implemented in the MSA. Randomly similar sections identified by ALIS- CORE were excluded using a Perl-script. ALISCORE currently ignores base pairings. If ambiguously aligned positions within stems are discarded the corresponding positions will be handled as an unpaired character in the tree reconstruction. The cleaned 18S and 28S alignments were concatenated. To analyze information content of raw data SplitsTree4 was used to calculate phylogenetic networks (see Huson and Bryant [109] for a review of applications). We compared the network structure based on the neighbornet algorithm [110] and applying the LogDet transformation, e.g. [111,112]. LogDet is a distance transformation that corrects for biases in base composition. The network graph gives a first indication of signal-like patterns and conflict present in the alignments. We used the alignment after filtering of random-like patterns with ALISCORE. Phylogenetic reconstruction Mixed DNA/RNA substitution models were chosen, in which sequence partitions corresponding to loop regions were governed by DNA models and partitions corresponding to stem regions by RNA models that consider co-variation. Among site rate variation [113] was imple- Page 13 of 19 (page number not for citation purposes)
229 BMC Evolutionary Biology 2009, 9:119 mented in both types of substitution models. Base frequency tests indicated that base composition was inhomogeneous among taxa (see results), suggesting nonstationary processes of sequence evolution. To take such processes into account the analyses were performed in PHASE-2.0 [63] to accommodate this compositional heterogeneity to minimize bias in tree reconstruction. Base compositional heterogeneity is implemented in PHASE- 2.0 according to the ideas developed by Foster [87]. We limited the number of candidate models to the REV +, TN93 + and the HKY85 + models for loop regions and the corresponding RNA16I +, RNA16J + and RNA16K + models for stem regions. Site heterogeneity was modeled by a discrete gamma distribution [114] with six categories. The extent of invariant characters was not estimated since it was shown to correlate strongly with the estimation of the shape parameter of the gamma distribution [113, ]. The data was partitioned into four units representing loop and stem regions of 18S rrna and loop and stem regions of 28S rrna. DNA and RNA substitution model parameters were independently estimated for each partition. Substitution models were selected based on results of time-homogeneous setups. We tested three different combinations of substitution models, REV + & RNA16I +, TN93 + & RNA16J + and HKY85 + & RNA16K +. We used Dirichlet distribution for priors, proposal distribution and Dirichlet priors and proposals for a set of exchangeability parameters (Additional file 14) described in Gowri-Shankar and Rattray [60]. Appropriate visiting of the parameter space according to the posterior density function [118] was checked by plotting values of each parameter and monitoring their convergence. This was calculated for all combinations after 500,000 generations (sampling period: 150 generations). We discarded models in which values of several parameters did not converge. For models which displayed convergence of nearly all parameter values, we re-run MCMC processes with 3,000,000 generations and a sampling period of 150 generations. Prior to comparison of the harmonic means of lnl values, 299,999 generations were discarded as burn-in. After a second check for convergence the model with the best fitness was selected applying a Bayes Factor Test (BFT) to the positive values of the harmonic means calculated from lnl values [67,68]. The favored model (2lnB 10 > 10) was used for final phylogenetic reconstructions. To compare results of time-homogeneous and time-heterogeneous models, 14 independent chains of 7,000,000 generations and two chains of 10 million generations for both setups were run on Linux clusters (Pentium 4, 3.0 GHz, 2 Gb RAM, and AMD Opteron Dual Core, 64 bit systems, 32 Gb RAM). For each chain the first two million generations were discarded as burn-in (sampling period of 1000). The setup for the time-homogeneous approach was identical to the pre-run except for number of generations, sampling period and burn-in. The setting for the time-heterogeneous approach differed (Additional file 4). We followed the method of Foster [87] and Gowri- Shankar and Rattray [60] in the non-homogeneous setup whereby only a limited number of composition vectors can be shared by different branches in the tree. Exchangeability parameters (average substitution rate ratio values, rate ratios and alpha shape parameter) were fixed as input values. Values for these parameters were computed from results of the preliminary time-homogeneous pre-run (3,000,000 generations). A consensus tree was inferred in PHASE mcmcsummarize using the output of the pre-run. This consensus tree topology and the model file of this run served as input for a ML estimation of parameters in PHASE optimizer. Estimated values of exchangeability parameters from the resulting optimizer output file and estimated start values for base frequencies were fed into mcmcphase for the time-heterogeneous analysis. Values of exchangeability parameters remained fixed during the analysis. The number of allowed base frequency categories (models) along the tree was also fixed. The number of base frequency groups was set to three "submodels"), reflecting base frequency heterogeneity. Harmonic means of lnl values of these 16 independent chains were again compared with a BFT to identify possible local optima in which a single chain might have been trapped. We only merged sample data of chains with a 2lnB 10 -value < 10 [67] using a Perl-script to construct a "metachain" [119]. Finally we included ten time-heterogeneous chains and three time-homogeneous chains. The assembled meta-chains included 56 million generations for the non-stationary approach (Additional file 15) and 18 million generations for the time-homogeneous approach (Additional file 16), burn-ins were discarded. Consensus trees and posterior probability values were inferred using mcmcsummarize. Branch lengths of the timehomogeneous and time-heterogeneous consensus tree were estimated using three mcmcphase chains (4 million generations, sampling period 500, topology changes turned off, starting tree = consensus tree, burn-in: 1 million generations) from different initial states with a Gowri-Shankar modified PHASE version. To infer mean branch lengths we combined data with the described branch lengths and mcmcsummarize. These mean branch lengths were used to redraw the consensus tree (Additional file 4). Localities of sampled specimen used for amplication are listed in Additional file 17. Page 14 of 19 (page number not for citation purposes)
230 BMC Evolutionary Biology 2009, 9:119 List of abbreviations rrna: ribosomal RNA; PCR: polymerase chain reaction; RNA: ribonucleic acid; DNA: deoxyribonucleic acid; df: degree of freedom; P: probability; pp: posterior probability; sp.: species epithet not known; ln: natural logarithm or log e ; BFT: Bayes Factor Test. Authors' contributions BMvR, KM and BM conceived the study, designed the setup and performed all analyses. VG complemented PHASE-2.0 and contributed to PHASE-2.0 analyses setup. RRS, HOL, BM provided RNAsalsa and software support. JWW allocated the neighbornet-analysis. BMvR, KM, ED, SS, HOL, DB and YL contributed sequence data and designed primers. BMvR, KM, BM, NUS and JWW wrote the paper with comments and revisions from ED, VG, RRS, DB, SS, GP, HH and YL. All authors read and approved the final manuscript. Additional material Additional file 1 Taxa list. Taxa list of sampled sequences. * indicates concatenated 18S and 28S rrna sequences from different species. For combinations of genes to construct concatenated sequences of chimeran taxa, see Table S1. ** contributed sequences in the present study (author of sequences). Click here for file [ Additional file 2 LogDet corrected network of concatenated 18S and 28S rrna alignment. LogDet corrected network plus invariant site models (30.79% invariant sites) using SplitsTree4 based on the concatenated 18S and 28S rrna alignment after exclusion of randomly similar sections evaluated with ALISCORE. Click here for file [ Additional file 3 Bayesian support values for selected clades. List of Baysian support values (posterior probability, pp) for selected clades of the time-heterogeneous and time-homogeneous tree. Click here for file [ Additional file 4 Detailed flow of the analysis procedure in the software package PHASE-2.0. Options used in PHASE-2.0 are italicized above the arrows and are followed by input files. Black arrows represent general flows of the analysis procedure, green arrows show that results or parameter values after single steps were inserted or accessed in a further process. Red blockarrows mark the final run of the time-heterogeneous and time-homogeneous approach with 16 chains each (2 118,000,000 generations). First row: I.) We prepared 3 control files (control.mcmc) for mcmcphase using three different mixed models. This "pre-run" was used for a first model selection (500,000 generations for each setting). We excluded model (C) based on non-convergence of parameter values. II.) We repeated step one (I.) with 3,000,000 generations using similar control files (different number of generations and random seeds) of the two remaining model settings. Calculated ln likelihoods values of both chains were compared in a BFT resulting in the exclusion of mixed model (A). Parameter values of the remaining model (B) were implemented in the time-heterogeneous setting. III.) We started the final analysis (final run) using sixteen chains for both the time-homogeneous and the time-heterogeneous approach. In the final time-homogeneous approach, the control files were similar to step II.) except for a different number of generations and random seeds. Second row: Additional steps were necessary prior to the computation of the final time-heterogeneous chains. We applied mcmcsummarize for the selected mixed model (B) to calculate a consensus tree. Optimizer was executed to conduct a ML estimation for each parameter value (opt.mod) based on the inferred consensus tree and optimized parameter-values (mcmc-best.mod), a data file delivered by mcmcphase. Estimated values were implemented in an initial.mod file. The initial.mod file and its parameter values were accessed by the control files of the final time-heterogeneous chains (only topology and base frequencies estimated). Third row: Trees were reconstructed separately for the timehomogeneous and time-heterogeneous setting. All chains of each approach were tested in a BFT against the chain with the best lnl. We only included chains with a 2lnB 10 -value > 10. From these chains we constructed a metachain for each setting using Perl and applied mcmcsummarize to infer the consensus topology. To estimate branch lengths properly we ran mcmcphase, resulting branch lengths were implemented in the consensus trees. Finally, both trees were optimized using graphic programs (Dendroscope, Adobe Illustrator CS II). Click here for file [ Additional file 5 List of chimeran species for concatenated 18S and 28S rrna sequences Click here for file [ Additional file 6 Primer list 18S rrna Click here for file [ Additional file 7 Primer list 28S rrna Click here for file [ Page 15 of 19 (page number not for citation purposes)
231 BMC Evolutionary Biology 2009, 9:119 Additional file 8 Primercard of the 18S rrna gene for hexapods, myriapods and crustaceans. Primers used for hexapods or myriapods are shown in the upper part, primers for crustaceans in the lower part. Positions of forward primers are marked with green arrows, those of reverse primers with red arrows. When different primers with identical position were used, all primer labels are given at the single arrow for the specific position. Primers and their combinations are given in Additional file 6 and 11. Click here for file [ Additional file 9 Primercard of the 28S rrna gene for crustaceans, hexapods and myriapods. Positions of forward primers are tagged with green arrows, those of reverse primers with red arrows. When different primers with identical position were used, all primer labels are given at the single arrow for the specific position. Primers and their combinations are given in Additional file 7 and 11. Click here for file [ Additional file 10 Primercard of the 28S rrna gene for pterygots. Positions of forward primers are assigned by green arrows, those of reverse primers with red arrows. When different primers with identical position were used, all primer labels are given at the single arrow for the specific position. Primers and their combinations are given in Additional file 7 and 11. Click here for file [ Additional file 11 Supplementary Information. Supplementary information for lab work (amplificaion, purification and sequencing of PCR products). Click here for file [ Additional file 12 PCR temperature-profiles Click here for file [ Additional file 13 PCR chemicals Click here for file [ Additional file 14 Setting of exchangeability parameters used in pre-runs. Listed settings of exchangeability parameters used in pre-runs in PHASE-2.0. Click here for file [ Additional file 15 Included chains to infer the time-heterogeneous consensus tree. Number of chains, generations per chain, harmonic means (lnl) and 2lnB 10 -values included to infer the time-heterogeneous consensus tree. Click here for file [ Additional file 16 Included chains to infer the time-homogeneous consensus tree. Number of chains, generations per chain, harmonic means (lnl) and 2lnB 10 -values included to infer the time-homogeneous consensus tree. Click here for file [ Additional file 17 Localities of sampled taxa Click here for file [ Acknowledgements We thank Matty Berg, Anke Braband, Antonio Carapelli, Erhard Christian, Romano Dallai, Johannes Dambach, Wolfram Dunger, Erich Eder, Christian Epe, Pietro Paolo Fanciulli, Makiko Fikui, Francesco Frati, Peter Frenzel, Yan Gao, Max Hable, Bernhard Huber, Herbert Kliebhan, Stefan Koenemann, Franz Krabb, Ryuichiro Machida, Albert Melber, Wolfgang Moser, Reinhard Predel, Michael Raupach, Sven Sagasser, Kaoru Sekiya, Marc Sztatecsny, Dieter Waloßek, Manfred Walzl and Yi-ming Yang for help in collecting specimens, for providing tissue or other DNA-samples or for laboratory help. Thanks also go to Andreas Wißkirchen, Theory Department, Physikalisches Institut, University of Bonn for using their computational power. We thank Berit Ullrich, Oliver Niehuis and Patrick Kück for providing Perl- Scripts and Thomas Stamm for suggestions on the discussion structure. Special thanks go to John Plant for linguistic help. This work was supported by the German Science Foundation (DFG) in the priority program SPP 1174 "Deep Metazoan Phylogeny" Work by JWW, BMvR is supported by the DFG grant WA 530/34; BM, KM are funded by the DFG grant MI 649/6, HH and SS are supported by the DFG grant HA 1947/5. NUS, ED, DB and GP are funded by the Austrian Science Foundation (FWF) grant P B17. References 1. Mallatt J, Giribet G: Further use of nearly complete 28S and 18S rrna genes to classify Ecdysozoa: 37 more arthropods and a kinorhynch. Mol Phylogenet Evol 2006, 40(3): Zrzavý J, Štys P: The basic body plan of arthropods: insights from evolutionary morphology and developmental biology. J Evol Biol 1997, 10(3): Dohle W: Are the insects terrestrial crustaceans? A discussion of some new facts and arguments and the proposal of the proper name "Tetraconata" for the monophyletic unit Crustacea + Hexapoda. Ann Soc Entomol Fr (New Series) 2001, 37(3): Friedrich M, Tautz D: Ribosomal DNA phylogeny of the major extant arthropod classes and the evolution of myriapods. Nature 1995, 376(6536): Shultz JW, Regier JC: Phylogenetic analysis of arthropods using two nuclear protein-encoding gene ssupports a crustacean + hexapod clade. Proc Biol Sci 2000, 267(1447): Page 16 of 19 (page number not for citation purposes)
232 BMC Evolutionary Biology 2009, 9: Friedrich M, Tautz D: Arthropod rdna phylogeny revisited: A consistency analysis using Monte Carlo simulation. Ann Soc Entomol Fr (New Series) 2001, 37(1 2): Hwang UW, Friedrich M, Tautz D, Park CJ, Kim W: Mitochondrial protein phylogeny joins myriapods with chelicerates. Nature 2001, 413(6852): Regier JC, Shultz JW: Elongation factor-2: A useful gene for arthropod phylogenetics. Mol Phylogenet Evol 2001, 20: Giribet G, Edgecombe GD, Wheeler WC: Arthropod phylogeny based on eight molecular loci and morphology. Nature 2001, 413(6852): Pisani D, Poling L, Lyons-Weiler M, Hedges SB: The colonization of land by animals: molecular phylogeny and divergence times among arthropods. BMC Biol 2004, 2: Mallatt JM, Garey JR, Shultz JW: Ecdysozoan phylogeny and Bayesian inference: first use of nearly complete 28S and 18S rrna gene sequences to classify the arthropods and their kin. Mol Phylogenet Evol 2004, 31: Regier JC, Shultz JW, Kambic RE: Pancrustacean phylogeny: hexapods are terrestrial crustaceans and maxillopods are not monophyletic. Proc Biol Sci 2005, 272(1561): Hassanin A: Phylogeny of Arthropoda inferred from mitochondrial sequences: strategies for limiting the misleading effects of multiple changes in pattern and rates of substitution. Mol Phylogenet Evol 2006, 38: Dunn CW, Hejnol A, Matus DQ, Pang K, Browne WE, Smith SA, Seaver E, Rouse GW, Obst M, Edgecombe GD, Sorensen MV, Haddock SHD, Schmidt-Rhaesa A, Okusu A, Kristensen RM, Wheeler WC, Martindale MQ, Giribet G: Broad phylogenomic sampling improves resolution of the animal tree of life. Nature 2008, 452(7188): Fanenbruck M, Harzsch S, Wägele JW: The brain of the Remipedia (Crustacea) and an alternative hypothesis on their phylogenetic relationships. Proc Natl Acad Sci USA 2004, 101(11): Harzsch S, Müller CHG, Wolf H: From variable to constant cell numbers: cellular characteristics of the arthropod nervous system argue against a sister-group relationship of Chelicerata and "Myriapoda" but favour the Mandibulata concept. Dev Genes Evol 2005, 215(2): Harzsch S: Neurophylogeny: Architecture of the nervous system and a fresh view on arthropod phyologeny. Integr Comp Biol 2006, 46(2): Ungerer P, Scholtz G: Filling the gap between identified neuroblasts and neurons in crustaceans adds new support for Tetraconata. Proc Biol Sci 2008, 275(1633): Nardi F, Spinsanti G, Boore JL, Carapelli A, Dallai R, Frati F: Hexapod origins: monophyletic or paraphyletic? Science 2003, 299(5614): Cameron SL, Miller KB, D'Haese CA, Whiting MF, Barker SC: Mitochondrial genome data alone are not enough to unambiguously resolve the relationships of Entognatha, Insecta and Crustacea sensu lato (Arthropoda). Cladistics 2004, 20(6): Cook CE, Yue Q, Akam M: Mitochondrial genomes suggest that hexapods and crustaceans are mutually paraphyletic. Proc Biol Sci 2005, 272(1569): Carapelli A, Liò P, Nardi F, Wath E van der, Frati F: Phylogenetic analysis of mitochondrial protein coding genes confirms the reciprocal paraphyly of Hexapoda and Crustacea. BMC Evol Biol 2007:S Dell'Ampio E, Szucsich NU, Carapelli A, Frati F, Steiner G, Steinacher A, Pass G: Testing for misleading effects in the phylogenetic reconstruction of ancient lineages of hexapods: influence of character dependence and character choice in analyses of 28S rrna sequences. Zool Scr 2009, 38(2): Hassanin A, Léger N, Deutsch J: Evidence for multiple reversals of asymmetric mutational constraints during the evolution of the mitochondrial genome of Metazoa, and consequences for phylogenetic inferences. Syst Biol 2005, 54(2): Wägele JW, Mayer C: Visualizing differences in phylogenetic information content of alignments and distinction of three classes of long-branch effects. BMC Evol Biol 2007, 7: Rota-Stabelli O, Telford ML: A multi criterion approach for the selection of optimal outgroups in phylogeny: Recovering some support for Mandibulata over Myriochelata using mitogenomics. Mol Phylogenet Evol 2008, 48: Bäcker H, Fanenbruck M, Wägele JW: A forgotten homology supporting the monophyly of Tracheata: The subcoxa of insects and myriapods re-visited. Zool Anz 2008, 247(3): Kadner D, Stollewerk A: Neurogenesis in the chilopod Lithobius forficatus suggests more similarities to chelicerates than to insects. Dev Genes Evol 2004, 214(8): Stollewerk A, Simpson P: Evolution of early development of the nervous system: a comparison between arthropods. Bioessays 2005, 27(9): Stollewerk A, Chipman AD: Neurogenesis in myriapods and chelicerates and its importance for understanding arthropod relationships. Integr Comp Biol 2006, 46(2): Ogden TH, Whiting MF: The problem with "the Paleoptera Problem": sense and sensitivity. Cladistics 2003, 19(5): Kjer KM: Aligned 18S and insect phylogeny. Syst Biol 2004, 53(3): Kukalová-Peck J, Lawrence JF: Relationships among coleopteran suborders and major endoneopteran lineages: Evidence from hind wing characters. Eur J Entomol 2004, 101: Misof B, Niehuis O, Bischoff I, Rickert A, Erpenbeck D, Staniczek A: Towards an 18S phylogeny of hexapods: Accounting for group-specific character covariance in optimized mixed nucleotide/doublet models. Zoology (Jena) 2007, 110(5): Whitfield JB, Kjer KM: Ancient rapid radiations of insects: Challenges for phylogenetic analysis. Annu Rev Entomol 2008, 53: Koch M: Monophyly and phylogenetic position of the Diplura (Hexapoda). Pedobiologia (Jena) 1997, 41(9): Kristensen NP: The groundplan and basal diversification of the hexapods. In Arthropod Relationships London: Chapman and Hall: Carapelli A, Frati F, Nardi F, Dallai R, Simon C: Molecular phylogeny of the apterygotan insects based on nuclear and mitochondrial genes. Pedobiologia (Jena) 2000, 44(3 4): Carapelli A, Nardi F, Dallai R, Boore JL, Liò P, Frati F: Relationships between hexapods and crustaceans based on four mitochondrial genes. In Crustacean and Arthropod Relationships, Volume 16 of Crustacean Issues Edited by: Koenemann S, Jenner RA. CRC Press; 2005: D'Haese CA: Were the first springtails semi-aquatic? A phylogenetic approach by means of 28S rdna and optimization alignment. Proc Biol Sci 2002, 269(1496): Luan Yx, Zhang Y, Qiaoyun Y, Pang J, Xie R, Yin W: Ribosomal DNA gene and phylogenetic relationships of Diplura and lower hexapods. Sci China C Life Sci 2003, 46: Giribet G, Edgecombe GD, Carpenter JM, D'Haese CA, Wheeler WC: Is Ellipura monophyletic? A combined analysis of basal hexapod relationships with emphasis on the origin of insects. Org Divers Evol 2004, 4(4): Regier JC, Shultz JW, Kambic RE: Phylogeny of basal hexapod lineages and estimates of divergence times. Ann Entomol Soc Am 2004, 97(9): Luan Yx, Mallatt JM, Xie Rd, Yang Ym, Yin Wy: The phylogenetic positions of three basal-hexapod groups (Protura, Diplura, and Collembola) based on on ribosomal RNA gene sequences. Mol Biol Evol 2005, 22(7): Szucsich NU, Pass G: Incongruent phylogenetic hypotheses and character conflicts in morphology: The root and early branches of the hexapodan tree. Mitt Dtsch Ges Allg Angew Entomol 2008, 16: Jow H, Hudelot C, Rattray M, Higgs PG: Bayesian phylogenetics using an RNA substitution model applied to early mammalian evolution. Mol Biol Evol 2002, 19(9): Galtier N: Sampling properties of the bootstrap support in molecular phylogeny: Influence of nonindependence among sites. Syst Biol 2004, 53: Fox GE, Woese CR: The architecture of 5S rrna and its relation to function. J Mol Evol 1975, 6: Wuyts J, De Rijk P, Peer Y Van de, Pison G, Rousseeuw P, De Wachter R: Comparative analysis of more than 3000 sequences reveals the existence of two pseudoknots in area V4 of eukaryotic small subunit ribosomal RNA. Nucleic Acids Res 2000, 28(23): Page 17 of 19 (page number not for citation purposes)
233 BMC Evolutionary Biology 2009, 9: Gutell JC, Robin R, Lee, Cannone JJ: The accuracy of ribosomal RNA comparative structure models. Curr Opin Struct Biol 2002, 12(3): Ban N, Nissen P, Hansen J, Moore PB, Steitz TA: The complete atomic structure of the large ribosomal subunit at 2.4 Å Resolution. Science 2000, 289(5481): Noller HF: RNA structure: reading the ribosome. Science 2005, 309(5740): Lartillot N, Philippe H: Improvement of molecular phylogenetic inference and the phylogeny of Bilateria. Philos Trans R Soc Lond B Biol Sci 2008, 363(1496): Rodríguez-Ezpeleta N, Brinkmann H, Roure B, Lartillot N, Lang BF, Philippe H: Detecting and overcoming systematic errors in genome-scale phylogenies. Syst Biol 2007, 56(3): Philippe H, Germot A, Moreira D: The new phylogeny of eukaryotes. Curr Opin Genet Dev 2000, 10(6): Stocsits RR, Letsch H, Hertel J, Misof B, Stadler PF: RNAsalsa. Version 0.7.3, current versions 2008 [ Zoologisches Forschungsmuseum A. Koenig, Bonn 57. Brown JM, Lemmon AR: The importance of data partitioning and the utility of bayes factors in bayesian phylogenetics. Syst Biol 2007, 56(4): Galtier N, Gouy M: Inferring phylogenies from DNA sequences of unequal base compositions. Proc Natl Acad Sci USA 1995, 92(24): Tarrío R, Rodríguez-Trelles F, Ayala FJ: Shared nucleotide composition biases among species and their impact on phylogenetic reconstructions of the Drosophilidae. Mol Biol Evol 2001, 18(8): Gowri-Shankar V, Rattray M: A reversible jump method for bayesian phylogenetic inference with a nonhomogeneous substitution model. Mol Biol Evol 2007, 24(6): Blanquart S, Lartillot N: A Bayesian compound stochastic process for modeling nonstationary and nonhomogeneous sequence evolution. Mol Biol Evol 2006, 23(11): Gowri-Shankar V, Rattray M: On the correlation between composition and site-specific evolutionary rate: Implications for phylogenetic inference. Mol Biol Evol 2006, 23(2): Gowri-Shankar V, Jow H: PHASE: a software package for Phylogenetics And Sequence Evolution. 2.0 University of Manchester; Telford MJ, Wise MJ, Gowri-Shankar V: Consideration of RNA secondary structure significantly improves likelihood-based estimates of phylogeny: Examples from the Bilateria. Mol Biol Evol 2005, 22(4): Misof B, Misof K: A Monte Carlo approach successfully identifies randomness in multiple sequence alignments: a more objective means of data exclusion. Syst Biol 2009, 58:syp Swofford DL: PAUP*. Phylogenetic Analysis Using Parsimony (*and other methods). Version 4 Sinauer Associates, Sunderland, Massachusetts; Kaas RE, Raftery AE: Bayes Factors. Journal of the American Statistical Association 1995, 90(430): Nylander JAA, Ronquist F, Huelsenbeck JP, Nieves-Aldrey JL: Bayesian phylogenetic analysis of combined data. Syst Biol 2004, 53(21): Boudreaux BH: Arthropod phylogeny: with special reference to insects John Wiley & Sons Inc; Edgecombe GD, Giribet G: Myriapod phylogeny and the relationships of Chilopoda. Biodiversidad, Taxonomía y Biogeografia de Artrópodos de México: Hacia una Síntesis de su Conocimiento 2002, III: Kjer KM, Carle FL, Litman J, Ware J: A Molecular Phylogeny of Hexapoda. Arthropod Systematics & Phylogeny 2006, 64: Yamaguchi S, Endo K: Molecular phylogeny of Ostracoda (Crustacea) inferred from 18S ribosomal DNA sequences: implication for its origin and diversification. Mar Biol 2003, 143: Gai YH, Song DX, Sun HY, Zhou KY: Myriapod monophyly and relationships among myriapod classes based on nearly complete 28S and 18S rdna sequences. Zool Sci 2006, 23(12): Gillespie JJ, Johnston JS, Cannone JJ, Gutell RR: Characteristics of the nuclear (18S, 5.8S, 28S and 5S) and mitochondrial (12S and 16S) rrna genes of Apis mellifera (Insecta: Hymenoptera): structure, organization, and retrotransposable elements. Insect Mol Biol 2005, 15(5): Jordal B, Gillespie JJ, Cognato AI: Secondary structure alignment and direct optimization of 28S rdna sequences provide limited phylogenetic resolution in bark and ambrosia beetles (Curculionidae: Scolytinae). Zool Scr 2008, 37: Simon C, Buckley TR, Frati F, Stewart JB, Beckenbach AT: Incorporating Molecular Evolution into Phylogenetic Analysis, and a New Compilation of Conserved Polymerase Chain Reaction Primers for Animal Mitochondrial DNA. Annu Rev Ecol Evol Syst 2006, 37: Susko E, Spencer M, Roger AJ: Biases in phylogenetic estimation can be caused by random sequence segments. J Mol Evol 2005, 61(3): Philippe H, Delsuc F, Brinkmann H, Lartillot N: Phylogenomics. Annual Review of Ecology, Evolution, and Systematics 2005, 36: Roeding F, Hagner-Holler S, Ruhberg H, Ebersberger I, von Haeseler Arndt, Kube M, Reinhardt R, Burmester T: EST sequencing of Onychophora and phylogenomic analysis of Metazoa. Mol Phylogenet Evol 2007, 45(3): Podsiadlowski L, Kohlhagen H, Koch M: The complete mitochondrial genome of Scutigerella causeyae (Myriapoda: Symphyla) and the phylogenetic position of Symphyla. Mol Phylogenet Evol 2007, 45: Castresana J: Selection of conserved blocks from multiple alignments for their use in phylogenetic analysis. Mol Biol Evol 2000, 17(4): Hancock JM, Tautz D, Dover GA: Evolution of the secondary structures and compensatory mutations of the ribosomal RNAs of Drosophila melanogaster. Mol Biol Evol 1988, 5(4): Stephan W: The rate of compensatory evolution. Genetics 1996, 144: Schöninger M, von Haeseler A: A stochastic model for the evolution of autocorrelated DNA sequences. Mol Phylogenet Evol 1994, 3(3): Friedrich M, Tautz D: An episodic change of rdna nucleotide substitution rate has occurred during the emergence of the insect order Diptera. Mol Biol Evol 1997, 14(6): Jermiin LS, Ho SYW, Ababneh F, Robinson J, Larkum AWD: The biasing effect of compositional heterogeneity on phylogenetic estimates may be underestimated. Syst Biol 2004, 53(4): Foster PG: Modeling compositional heterogeneity. Syst Biol 2004, 53(3): Walossek D: On the Cambrian diversity of Crustacea. In Crustaceans and the Biodiversity Crisis, Proceedings of the Fourth International Crustacean Congress, Amsterdam, The Netherlands, July 20 24, 1998 Volume 1. Edited by: von Vaupel Klein FRSJC. Brill Academic Publishers, Leiden; 1998: Edgecombe GD, Wilson GDF, Colgan DJ, Gray MR, Cassis G: Arthropod Cladistics: Combined analysis of histone H3 and U2 snrna sequences and morphology. Cladistics 2000, 16(2): Lim JT, Hwang UW: The complete mitochondrial genome of Pollicipes mitella (Crustacea, Maxillopoda, Cirripedia): nonmonophylies of Maxillopoda and Crustacea. Mol Cells 2006, 22(3): Wilson K, Cahill V, Ballment E, Benzie J: The complete sequence of the mitochondrial genome of the crustacean Penaeus monodon: Are malacostracan crustaceans more closely related to insects than to branchiopods? Mol Biol Evol 2000, 17(6): Glenner H, Thomsen PF, Hebsgaard MB, Sørensen MV, Willerslev E: Evolution: The origin of insects. Science 2006, 314(5807): Zhang Xg, Siveter DJ, Waloszek D, Maas A: An epipodite-bearing crown-group crustacean from the Lower Cambrian. Nature 2007, 449(7162): Regier JC, Shultz JW: Molecular phylogeny of the major arthropod groups indicates polyphyly of crustaceans and a new hypothesis for the origin of hexapods. Mol Biol Evol 1997, 14(9): Schierwater B, Hadrys H: Environmental factors and metagenesis in the hydroid Eleutheria dichotoma. Invertebr Reprod Dev 1998, 34(2 3): Page 18 of 19 (page number not for citation purposes)
234 BMC Evolutionary Biology 2009, 9: Hall TA: BioEdit: a user-friendly biological alignment sequence EDITOR and analysis program for Windows95/98/ NT. Nucleic Acids Symp Ser 1999, 41(2 3): Tatusova TA, Madden TL: BLAST 2 Sequences, a new tool for comparing protein and nucleotide sequences. FEMS Microbiol Lett 1999, 174(2): Kjer KM: Use of rrna secondary structure in phylogenetic studies to identify homologous positions: An example of alignment and data presentation from the frogs. Mol Phylogenet Evol 1995, 4(3): Hickson RE, Simon C, Perrey SW: The performance of several multiple-sequence alignment programs in relation to secondary-structure features for an rrna sequence. Mol Biol Evol 2000, 17(4): Buckley TR, Simon C, Chambers GK: Exploring among-site rate variation models in a maximum likelihood framework using empirical data: Effects of model assumptions on estimates of topology, branch lengths, and bootstrap support. Syst Biol 2001, 50: Misof B, Niehuis O, Bischoff I, Rickert A, Erpenbeck D, Staniczek A: A hexapod nuclear SSU rrna secondary-structure model and catalog of taxon-specific structural variation. J Exp Zool B Mol Dev Evol 2006, 306B: Edgar RC: MUSCLE: multiple sequence alignment with high accuracy and high throughput. Nucleic Acids Res 2004, 32(5): Edgar RC: MUSCLE: a multiple sequence alignment method with reduced time and space complexity. BMC Bioinformatics 2004, 5: Peer Y Van de, De Rijk P, Wuyts J, Winkelmans T, De Wachter R: The European Small Subunit Ribosomal RNA database. Nucleic Acids Res 2000, 28: Wuyts J, Peer Y Van de, Winkelmans T, De Wachter R: The European database on small subunit ribosomal RNA. Nucleic Acids Res 2002, 30: Wuyts J, Perrière G, Peer Y Van de: The European ribosomal RNA database. Nucleic Acids Res 2004, 32(Suppl 1, Database):D Michot B, Bachellerie JP, Raynal F: Structure of mouse rrna precursors. Complete sequence and potential folding of the spacer regions between 18S and 28S rrna. Nucleic Acids Res 1983, 11(10): Gillespie JJ, Munro JB, Heraty JM, Yoder MJ, Owen AK, Carmichael AE: A secondary structural model of the 28S rrna expansion segments D2 and D3 for chalcidoid wasps (Hymenoptera: Chalcidoidea). Mol Biol Evol 2005, 22(7): Huson DH, Bryant D: Application of phylogenetic networks in evolutionary studies. Mol Biol Evol 2006, 23(2): Bryant D, Moulton V: Neighbor-Net: An agglomerative method for the construction of phylogenetic networks. Mol Biol Evol 2004, 21(2): Penny D, Lockhart PJ, Steel MA, Hendy MD: The role of models in reconstructing evolutionary trees. In Models in phylogeny reconstruction, The Systematics Association Special Volume Series Edited by: Scotland RW, Diebert DJ, Williams DM. Oxford University Press; 1994: Steel M, Huson D, Lockhart PJ: Invariable sites models and their use in phylogeny reconstruction. Syst Biol 2000, 49(2): Yang Z: Among-site rate variation and its impact on phylogenetic analyses. Trends Ecol Evol (Amst.) 1996, 11(9): Yang Z: Maximum likelihood phylogenetic estimation from DNA sequences with variable rates over sites: approximate methods. J Mol Evol 1994, 39(3): Kelchner SA, Thomas MA: Model use in phylogenetics: nine key questions. Trends Ecol Evol (Amst.) 2007, 22(2): Sullivan J, Swofford DL: Should we use model-based methods for phylogenetic inference when we know that assumptions about among-site rate variation and nucleotide substitution pattern are violated? Syst Biol 2001, 50(5): Waddell PJ, Penny D, Moore T: Hadamard conjugations and modeling sequence evolution with unequal rates across sites. Mol Phylogenet Evol 1997, 8: Zwickl DJ, Holder MT: Model parameterization, prior distributions, and the general time-reversible model in bayesian phylogenetics. Syst Biol 2004, 53(6): Beiko RG, Keith JM, Harlow TJ, Ragan MA: Searching for convergence in phylogenetic Markov Chain Monte Carlo. Syst Biol 2006, 55(4): Publish with BioMed Central and every scientist can read your work free of charge "BioMed Central will be the most significant development for disseminating the results of biomedical research in our lifetime." Sir Paul Nurse, Cancer Research UK Your research papers will be: available free of charge to the entire biomedical community peer reviewed and published immediately upon acceptance cited in PubMed and archived on PubMed Central yours you keep the copyright Submit your manuscript here: BioMedcentral Page 19 of 19 (page number not for citation purposes)
235 SUPPLEMENT - MANUSCRIPT II
236 MBE Advance Access published August 19, 2009 Hemocyanin suggests a close relationship of Remipedia and Hexapoda Research Article Beyhan Ertas 1, Björn M. von Reumont 2, Johann-Wolfgang Wägele 2, Bernhard Misof 1, Thorsten Burmester 1 1 Biozentrum Grindel und Zoologisches Museum, Universität Hamburg, Martin-Luther-King- Platz 3, D Hamburg, Germany 2 Zoologisches Forschungsmuseum Alexander Koenig, Adenauerallee 160, D Bonn, Germany Corresponding author: Thorsten Burmester Biozentrum Grindel und Zoologisches Museum Universität Hamburg Martin-Luther-King-Platz 3 D Hamburg Germany Phone: (+49) Fax: (+49) thorsten.burmester@uni-hamburg.de Key words: Crustacea, Hemocyanin, Hexapoda, Insecta, Pancrustacea, Remipedia Running head: Remipede hemocyanin 1 The Author Published by Oxford University Press on behalf of the Society for Molecular Biology and Evolution. All rights reserved. For permissions, please journals.permissions@oxfordjournals.org
237 Abbreviations: Hc, hemocyanin; PCR, polymerase chain reaction; SDS-PAGE, sodium dodecyl sulfate-polyacrylamide gel electrophoresis; see Supplementary Table 1 for abbreviations of hemocyanins. 2
238 Abstract The remipedia are enigmatic crustaceans from anchialine cave systems, first described only 30 years ago, whose phylogenetic affinities are as yet unresolved. Here we report the sequence of hemocyanin from Speleonectes tulumensis Yager, 1987 (Remipedia, Speleonectidae). This is the first proof of the presence of this type of respiratory protein in a crustacean taxon other than Malacostraca. S. tulumensis hemocyanin consists of multiple distinct (at least three) subunits (StuHc1 to 3). Surprisingly, the sequences are most similar to hexapod hemocyanins. Phylogenetic analyses showed that the S. tulumensis hemocyanin subunits StuHc1 and StuHc3 associate with the type 1 hexapod hemocyanin subunits, whereas StuHc2 associates with the type 2 subunits of hexapods. Together, remipede and hexapod hemocyanins are in the sister-group position to the hemocyanins of malacostracan crustaceans. Hemocyanins provide no indication of a close relationship of Myriapoda and Hexapoda, but tend to support Pancrustacea (Crustacea + Hexapoda). Our results also indicate that Crustacea are paraphyletic and that Hexapoda may have evolved from a Remipedia-like ancestor. Thus, Remipedia occupy a key position for the understanding of the evolution of hexapods, which are and have been one of the world's most speciose lineage of animals. 3
239 Introduction In 1979 Yager discovered in an anchialine cave in the Bahamas the first specimens of Remipedia, which represented a new class of crustaceans with currently about 20 described extant species (Yager 1981; Koenemann et al. 2007b). Living remipedes harbor a number of unique features, which include the loss of eyes, biramous antennulae, three pairs of postmandibular mouthparts adapted to a predatory feeding mode and to grooming, and the lack of tagmatization of the trunk (Schram and Lewis 1989; Koenemann et al. 2007c; van der Ham and Felgenhauer 2008). The phylogenetic affinities of Remipedia are still controversial. On the basis of the homonomous segmentation of their trunk, which supposedly represents the ancestral ground pattern in the evolution of Arthropoda, it has been suggested that Remipedia occupy a basal position within Crustacea or even Mandibulata (Schram 1986; Wills 1997; Giribet, Edgecombe, and Wheeler 2001). Molecular phylogenetic analyses of ribosomal RNA and mitochondrial genomes, as well as limb morphology have indicated an association of Remipedia with various crustacean classes assigned to the "Maxillopoda" (Ito 1989; Spears and Abele 1997; Lim and Hwang 2006). However, these results may be due to long branch attraction phenomena (Spears and Abele 1997; Telford et al. 2008; von Reumont et al. 2009). In fact, the pattern of mitochondrial gene arrangement convincingly excluded Remipedia from the maxillopod assemblage, which in that study comprised Branchiura, Cephalocarida, Cirripedia, and Pentastomida (Lavrov, Brown, and Boore 2004). Other molecular phylogenetic analyses have found Remipedia at various positions within Crustacea, albeit with poor support (Regier and Shultz 2001; Regier, Shultz, and Kambic 2005; Hassanin 2006; Carapelli et al. 2007). A recent study of arthropod brain morphology suggested that Remipedia belong to a monophylum of Malacostraca and Hexapoda within paraphyletic crustaceans (Fanenbruck, Harzsch, and Wagele 2004; Fanenbruck and Harzsch 2005). The discovery of free-living lecithotrophic remipede larvae and analysis of early larval 4
240 development of Remipedia tentatively support their assumed relationship to malacostracan crustaceans (Koenemann et al. 2007a; Koenemann et al. 2009). Oxygen transport in the hemolymph of various arthropod and mollusk taxa is facilitated by copper-proteins referred to as hemocyanins (Markl and Decker 1992; van Holde and Miller 1995; Burmester 2002). Arthropod and mollusk hemocyanins are not related, but evolved independently from distinct copper-containing enzymes (Burmester 2001; Burmester 2002). Hemocyanins of Arthropoda are large hexameric or oligohexameric proteins composed of similar or identical subunits in the size range of 75 kda. Each subunit can bind to an O 2 molecule by the virtue of two copper ions that are coordinated by six histidine residues. Hemocyanins have been thoroughly studied in Chelicerata and Crustacea, occur in Myriapoda (Jaenicke et al. 1999; Kusche and Burmester 2001), and have recently been identified in Onychophora (Kusche, Ruhberg, and Burmester 2002) and Hexapoda (Hagner-Holler et al. 2004; Pick, Hagner-Holler, and Burmester 2008; Pick, Schneuer, and Burmester 2009). Within Crustacea, hemocyanins have been thought to be confined to Malacostraca (Mangum 1985; Markl and Decker 1992). Hemocyanin sequences have been shown to be informative for the inference of phylogenies within Arthropoda (Burmester 2001; Kusche and Burmester 2001; Kusche, Ruhberg, and Burmester 2002; Kusche et al. 2003). Thus, lineage-specific presence and phylogenetic analyses could be useful in assessing the position of Remipedia. Here we report the identification and molecular cloning of hemocyanin cdna from the remipede Speleonectes tulumensis and show that molecular phylogenetic analyses of these hemocyanin sequences provide evidence for a close relationship of Remipedia and Hexapoda. 5
241 Materials and Methods Sample preparation Speleonectes tulumensis was collected on Yucatan Peninsula, Mexico. Animals were cut in small pieces and the tissue was preserved in RNAlater (Qiagen, Hilden, Germany). Total RNA and protein was extracted using TriFast TM (Peqlab, Erlangen, Germany) according to the manufacturer's instructions. The protein and RNA samples were immediately used or kept frozen at -20 C until use. Cloning of hemocyanin cdna Three µg total RNA were converted into cdna by Superscript III reverse transcriptase employing an oligo-dt primer according the manufacturer's instructions (Invitrogen, Carlsbad, USA). The resulting cdna was used for standard PCR, using degenerate primers (forward primer: 5'-ATGGAYTTYCCNTTYTGGTGGA-3'; reverse primer 5'- GTNGCGGTYTCRAARTGYTCCAT-3') that had been derived from conserved coding regions of arthropod hemocyanins (amino acid sequences: MDFPFWW and MEHFETAT) (Burmester 2001; Hagner-Holler et al. 2004; Pick, Schneuer, and Burmester 2009). Fragments of the expected size were cloned into the pgem-t Easy/JM109 E. coli system (Promega, Mannheim, Germany) and 14 independent clones were sequenced by a commercial service (Genterprise, Mainz, Germany). 5' and 3' RACE experiments were carried out by a RNA ligase-mediated rapid amplification method employing the GeneRacer Kit with SuperScript III reverse transcriptase. Sets of gene-specific primers were constructed according to the partial sequences (Supplementary Table 1). The cdna fragments were cloned and sequenced as described. Sequences were 6
242 assembled using ContigExpress (Vector NTI Advance 10.3; Invitrogen) and GeneDoc 2.7 (Nicholas and Nicholas 1997). Western Blotting Protein extracts were denatured in sample buffer (31.25 mm Tris-HCl, ph 6.8, 1% SDS, 2.5% mercaptoethanol, 5% glycerol) at 95 C for 5 min and loaded onto a 10% polyacrylamide gel. SDS-PAGE was carried out according to standard procedures. Semi-dry electro-transfer of proteins onto nitrocellulose membranes (Hartenstein, Würzburg, Germany) was carried out for 2 h at 0.8 ma/cm 2. Non-specific binding sites were blocked for 1 h with 2% non-fat dry milk in TBS (10 mm Tris-HCl, ph 7.4; 140 mm NaCl). The membranes were incubated for 2 h at room temperature with polyclonal antibodies that had been raised against various insect and crustacean hemocyanins (anti-homarus americanus, anti-panulirus interruptus, anti-cancer pagurus, and anti-thermobia domestica hemocyanin antibodies) diluted 1:5.000 in 2 % milk/tbs. The nitrocellulose filters were washed three times with TBS for 15 min and incubated for 1 h with a goat anti-rabbit antibody coupled with alkaline phosphatase (Dianova, Hamburg, Germany), diluted 1: in TBS. After a final washing step, detection was carried out with nitro-bluetetrazolium-chloride and 5-bromo-4-chloro-3-indolyl-phosphate as substrates. Sequence and phylogenetic analyses Tools provided with the ExPASy Molecular Biology Server of the Swiss Institute of Bioinformatics ( were used for the analyses of DNA and amino acid sequences. Signal peptides were predicted using SignalP 1.1 (Nielsen et al. 1997). Deduced amino acid sequences of S. tulumensis hemocyanin were included in a previously published multiple alignment of arthropod hemocyanins, insect hexamerins and crustacean 7
243 pseudohemocyanins (Pick, Schneuer, and Burmester 2009) employing MAFFT with the L-INS-i method and the BLOSUM 62 matrix (Katoh et al. 2005). A list of sequences used in this study is provided in Supplementary Table 1. After the exclusion of N- and C-terminal extensions, the final multiple sequence alignment contained 800 positions and 96 sequences. The appropriate model of amino acid sequence evolution (WAG + Gamma model; Whelan and Goldman 2001) was selected by ProtTest (Abascal, Zardoya, and Posada 2005) using the Akaike Information Criterion (AIC). Bayesian phylogenetic analysis was performed using MrBayes (Huelsenbeck and Ronquist 2001). We assumed the WAG model with a gamma distribution of substitution rates. We used uninformative priors on all trees. Metropolis-coupled Markov chain Monte Carlo (MCMCMC) sampling was performed with one cold and three heated chains that were run for 8,000,000 generations. Starting trees were random and trees were sampled every 100 th generation. Two independent runs were performed in parallel and were continued until runs had converged (average standard deviations of split frequencies were stationary and lower than 0.005). The program Tracer 1.4 ( was used to examine log-likelihood plots and MCMC summaries for all parameters. Posterior probabilities were estimated on the final 60,000 trees (burnin = 20,000). RAxML 7.0.4, assuming the WAG evolutionary model with gamma distributions, was used for maximum likelihood analyses, and the resulting tree was tested by bootstrapping with 1000 replicates. TREE-PUZZLE 5.2 (Schmidt et al. 2002) was used to test alternative tree topologies. Hypothesis testing was performed by four methods: A Shimodaira-Hasegawa (SH) test (Shimodaira and Hasegawa 1999), a two sided Kishino- Hasegawa (2sKH) test (Kishino and Hasegawa 1989), a one sided KH test based on pairwise SH tests (Goldman, Anderson, and Rodrigo 2000), and an Expected Likelihood Weight (ELW) test (Strimmer and Rambaut 2002). SH, 1sKH, and ELW tests performed 1,000 resamplings using the RELL method. 8
244 Results and Discussion Identification of hemocyanin in S. tulumensis A set of degenerate oligonucleotide primers were designed according to conserved regions arthropod hemocyanin sequences (Burmester 2001; Pick, Schneuer, and Burmester 2009). RT- PCR using total RNA extracted from an adult S. tulumensis resulted in the amplification of fragments in the range of 550 bp. After cloning and sequencing, three distinct hemocyanin cdna sequences were identified, which were termed StuHc1, StuHc2 and StuHc3, respectively. The missing 5' and 3' regions of the hemocyanin cdnas were obtained by 5' and 3'-RACE. The full length cdna sequences measure 2422, 2531, and 2506 bp (Supplementary Fig. 1). The deduced amino acid sequences comprise 686, 672, and 671 amino acids, of 51.6 to 55.6% identity (Fig. 1). Sequence comparisons with other hemocyanins showed that the residues required for reversible oxygen binding and subunit cooperativity (Hazes et al. 1993; Burmester 2002) are present in all three sequences of S. tulumensis, suggesting that these proteins are able to carry out respiratory functions. The conserved residues include the six copper-binding site histidines in the central second domain, as well as three phenylalanines that stabilize the binding of O 2 in the first and second domain (Fig. 1). The phenylalanine in the first domain of the subunits is assumed to be a key residue in the regulation of oxygen binding in most hemocyanins (Hazes et al. 1993). All S. tulumensis hemocyanins harbor the typical N-terminal leader sequences required for transmembrane export via the endoplasmic reticulum (cf. Fig. 1 and Supplementary Fig. 1), resulting in native polypeptides of 656 to 667 amino acids with inferred molecular masses of 75.7 to 77.1 kda. The occurrence of hemocyanin proteins in S. tulumensis was further established by Western blotting employing various polyclonal antibodies and antisera that had been raised against insect or crustacean hemocyanins. Two distinct bands in the range of 75 to 80 kda were recognized by 9
245 most antibodies (Fig. 2), which are in excellent agreement with the molecular masses predicted from the translated cdna sequences: StuHc1 is interpreted to form the upper band, and StuHc2 and StuHc3 are together the lower band. In summary, Remipedia do have functional hemocyanin sequences that occur in three subunits and are expressed in the adult organism. Respiratory proteins in Remipedia and other Crustacea Among the crustacean groups, hemocyanins have only been identified in Malacostraca (Mangum 1985; Markl and Decker 1992; Burmester 2002). In various non-malacostracan crustaceans (Branchiopoda, Ostracoda, Copepoda and Cirripedia), hemoglobins usually serve as oxygen carriers (Mangum 1985). Sequence data corroborate these findings because extensive BLAST searches on genomic sequences or expressed sequence tags (ESTs) in EMBL/GenBank and in the database of the Deep Metazoan Phylogeny project did not recover any hemocyanin from a nonmalacostracan crustacean. There have been only two reports of the possible presence of hemocyanins in Cirripedia and Remipedia. It is, however, uncertain whether the putative hemocyanin of the parasitic cirriped Sacculina carcini is an endogenous protein or actually derives from the decapod host, Carcinus maenas (Herberts and de Frescheville 1981). Yager (1991) observed large crystal structures in remipede hemocytes that resemble those of the Limulus polyphemus hemocyanin. In a more recent report, van der Ham and Felgenhauer (2007) also speculated about the presence of a hemocyanin-like protein in Speleonectes sp. Here we demonstrate that hemocyanin actually occurs in a remipede species, which is in addition the first unambiguous report of such respiratory proteins in a non-malacostracan crustacean. Remipedia dwell in a high-saline and oxygen-poor environment (usually <1 mg/ml O 2 ; (Koenemann, Schram, and Iliffe 2006) below the halocline interface between the seawater and the overlying well-oxygenated freshwater that is typical for anchialine cave systems (Pohlmann, Iliffe, and Cifuentes 1997). Remipedia have adapted to this hypoxic environment, and a 10
246 respiratory protein that augments the delivery of oxygen within the circulatory system is certainly advantageous. Hemocyanin has been identified in Onychophora and thus was present in the last common ancestor of Arthropoda (Burmester 2002; Kusche, Ruhberg, and Burmester 2002). It is extremely unlikely that hemocyanin was re-invented in Remipedia. It must be assumed that this respiratory protein was present in the last common ancestor of Malacostraca and Remipedia, and was the principal oxygen carrier of stemline crustaceans. Thus, the occurrence of hemocyanin is a plesiomorphic character of Crustacea. As mentioned above, most non-malacostracan crustaceans use hemoglobin not hemocyanin for oxygen transport (Mangum 1985). However, this hemoglobin is a secondary invention (apomorphic character), which most likely derived from an intracellular globin of unknown function. It is currently uncertain whether hemoglobin emerged only once in the Crustacea, which would provide evidence that at least part of the "Entomostraca" sensu Walossek (1999), i.e. Branchiopoda and "Maxillopoda", may represent a monophylum. Hexapod affinities of remipede hemocyanins Surprisingly, BLAST searches and pairwise sequence comparisons revealed that the hemocyanin subunits of S. tulumensis display the highest sequence identity with insect hemocyanin subunits. For example, StuHc1 and StuHc3 share 60.4% and 53.4%, respectively, of the amino acids with the hemocyanin 1 of the firebrat Thermobia domestica, whereas StuHc2 and the hemocyanin 2 of the cockroach Blaptica dubia are 57.1% identical. At least 10% lower identity scores were observed when the S. tulumensis hemocyanins were compared to those of malacostracan crustaceans or other arthropod hemocyanins. This evidence is a first rough indicator of a close relationship of hexapod and remipede hemocyanins. The amino acid sequences of Remipedia hemocyanins were included in an alignment of arthropod hemocyanins and related proteins (Burmester and Scheller 1996; Burmester 2002; Hagner-Holler et al. 2004; Pick, Schneuer, and Burmester 2009) (Supplementary Fig. 2). 11
247 Phylogenetic analyses employing maximum likelihood and Bayesian methods resulted in essentially identical trees (Fig. 3; Supplementary Figs. 3 and 4). S. tulumensis hemocyanins and hexapod proteins form a monophyletic clade that excludes other crustacean (malacostracan) sequences (ML bootstrap support: 48%; Bayesian posterior probability: 0.96). The other crustacean hemocyanins and pseudohemocyanins were monophyletic (100%; 1.0), but in none of the trees did the hemocyanins of the Remipedia join this clade. The relative position of the myriapod hemocyanins remains uncertain and received poor support. These proteins were either associated with the chelicerate hemocyanins (thereby supporting the "Paradoxopoda" hypothesis; Mallatt, Garey, and Shultz 2004) or are in sister-group position to the crustacean plus hexapod proteins (supporting the traditional "Mandibulata"). In none of the trees did the myriapod hemocyanins join hexapod hemocyanins and hexamerins. S. tulumensis hemocyanin subunits 1 and 3 (StuHc1 and StuHc3) form a common branch. This is reasonably well supported in Bayesian analyses (0.95) but only in 46% of the ML bootstrapped trees (Fig. 3). A common clade of StuHc1 and StuHc3 and hexapod hemocyanin type 1 subunits plus hexamerins was recovered with 1.00 posterior probability in the Bayesian tree and supported by an ML bootstrap value of only 54%. The association of StuHc2 with the hexapod hemocyanin subunits 2 receives high support throughout (97%; 1.00) and is further corroborated by a unique and conserved insertion of nine amino acids in beta-sheet 3A (amino acid position in StuHc2; Fig. 1). Such insertion is not present in any other hemocyanin. Tree topologies were further evaluated by hypothesis testing (Table 1). The multiple ratio tests recovered the tree topology presented in Fig. 3 as best result and significantly reject StuHc1, StuHc2 and StuHc3 from the clade of other crustacean (malacostracan) hemocyanins. Hence, there is substantial molecular phylogenetic and structural evidence that the remipede hemocyanin subunits are orthologs of hexapod subunits. Thus, the lineage leading to the remipede and hexapod hemocyanins split into two distinct subunit types before these taxa diverged. 12
248 Are Remipedia and Hexapoda sister-groups? The origin of Hexapoda is notoriously disputed. Based on a large number of morphological characters it has long been assumed that Hexapoda evolved from a myriapod-like ancestor, and that these taxa form the subphylum "Tracheata" or "Atelocerata" (e.g., Brusca and Brusca 2003). However, this view has been challenged by molecular phylogenetic approaches that have provided evidence that Hexapoda are somehow, in fact, allied with Crustacea (Friedrich and Tautz 1995; Boore, Lavrov, and Brown 1998; Hwang et al. 2001; Kusche and Burmester 2001; Mallatt, Garey, and Shultz 2004). Such topology was recovered in our analyses as well (Fig. 3). A relationship of Hexapoda and Crustacea also received support in some comparative morphological and developmental biology studies (Giribet and Ribera 2000; Richter 2002), and thus Hexapoda and Crustacea have been joined in a common taxon named either "Tetraconata" (Richter 2002) or "Pancrustacea" (Zrzavý and Štys 1997). In many analyses, Crustacea form a paraphyletic assemblage with respect to Hexapoda, but it has remained uncertain which crustacean taxon is the sister-group of the Hexapoda. In most studies only two crustacean classes were considered: Malacostraca and Branchiopoda. Analyses employing mitochondrial genomes suggest a close relationship of Malacostraca and Hexapoda with exclusion of Branchiopoda (Garcia-Machado et al. 1999; Wilson et al. 2000; Hwang et al. 2001). Such topology is also supported by some morphological evidence such as brain structure (Harzsch 2002), and by comparative studies of embryonic development (Averof and Akam 1995). On the other hand, a clade consisting of Branchipoda and Hexapoda tends to be supported by rrna genes and multigene analyses (Regier et al. 2005, 2008; Mallatt and Giribet 2006; Roeding 2007; Dunn et al. 2008). 13
249 Here we provide molecular evidence that actually the Remipedia may be the closest living relatives of the Hexapoda. This relationship is suggested in our study 1) by the presence of both hexapod-type hemocyanin subunits in Remipedia (but absence of any other subunit type), 2) by a unique sequence motif insertion that is shared StuHc2 and hexapod type 2 subunits, and 3) by the orthology of remipede and hexapod hemocyanin subunits (Fig. 3), which is also supported by statistical tests of alternative tree topologies. A sister-group relationship of Remipedia and Hexapoda was tentatively retrieved in another molecular tree using elongation factor 2 sequences (Regier and Shultz 2001) and was also suggested by Telford et al. (2008) on the basis of unpublished material. In a large-scale phylogenomic study by Regier et al. (2008), a clade consisting of Remipedia and Hexapoda was consistently recovered, which in that study also included the Cephalocarida (which are not considered here). Interestingly, a recent morphological study supports a close relationship of Remipedia and Hexapoda: Based on the structure of the arthropod brain, Fanenbruck and co-workers (Fanenbruck, Harzsch, and Wagele 2004) proposed a common clade of Malacostraca, Remipedia and Hexapoda (although they did not include Myriapoda in their analyses) with the exclusion of Branchiopoda and "Maxillopoda". It was noted that the arrangement of nerves, axonal tracts, neuropil compartments and cell clusters in the brains of these taxa are similar, but distinct from that of any other crustacean class. This hypothesis is now reinforced by the fact that all three taxa employ hemocyanin as respiratory protein, whereas other crustacean taxa use hemoglobins (Mangum 1985; Markl and Decker 1992; Burmester 2002). Therefore, Pancrustacea may be divided into two clades consisting of the possibly monophyletic Entomostraca (which have lost hemocyanins) on one hand (Walossek 1999), and Malacostraca, Remipedia and Hexapoda (taxon N.N.) on the other (Fanenbruck, Harzsch, and Wagele 2004). However, it should be noted that we cannot reject the hypothesis of multiple independent losses of hemocyanin and independent evolution of hemoglobin in various "entomostracan" lineages. If this is the case and the cited morphological evidence is ignored, the minimal topology recovered in our analyses is 14
250 (Malacostraca, (Remipedia, Hexapoda)). Then an "entomostracan", possibly branchiopod, ancestor of Hexapoda cannot be excluded (Regier et al. 2005; Mallatt and Giribet 2006; Roeding et al. 2007; Dunn et al. 2008). Conclusions: Remipedia-like ancestor of Hexapoda? Although recent hypotheses focused on a branchiopod-like crustacean as possible ancestor of hexapods (Glenner et al. 2006), our findings suggest that alternatively a remipede ancestor could be proposed. Extant and fossil Remipedia may provide evidence for the Bauplan of the hexapod stem-lineage. The oldest known hexapod fossil is the collembolan Rhyniella praecursor from the Devonian Rhynie Lagerstätte in Scotland. This species harbors various derived features, thus offering little information on early morphology of Hexapoda. Interestingly, Haas, Waloszek, and Hartenberger (2003) noted that Tesnusocaris goldichi, a remipedian fossil from the Carboniferous (Emerson and Schram 1991) may be a stem-lineage hexapod. This proposal was based on the unbranched structure of the first antenna and the long and filiform caudal appendages. It may be further speculated that the enigmatic fossil Devonohexapodus bocksbergensis (Haas, Waloszek, and Hartenberger 2003), which was described as a marine hexapod from the lower Devonian, may represent a transitional form between Remipedia and Hexapoda. Hexapod-like structures include leg-like palps of maxillae, absence of a second pair of antennae, and three pairs of longer uniramous thoracopods with six podomeres, but the homonomous trunk with its 38 trunk segments and the abdominal leglets actually provide an overall Remipedia-like appearance. In summary, it is possible that both fossil and living Remipedia occupy a key position for unraveling the evolution of Pancrustacea and thus for the understanding of morphological and functional innovations eventually resulting in the emergence of Hexapoda. However, additional molecular and morphological studies are required to unravel the position of Remipedia and to stably resolve their relationship to Hexapoda. 15
251 Supplementary Material Supplementary Table 1. List of sequences used for phylogenetic analysis. Supplementary Fig. 1. Nucleotide and amino acid sequences of S. tulumensis hemocyanin subunits. Supplementary Fig. 2. Multiple sequence alignment of selected arthropod hemocyanins, crustacean pseudo-hemocyanins and insect hexamerins. Supplementary Fig. 3. Maximum likelihood tree. Supplementary Fig. 4. Bayesian phylogenetic tree. Acknowledgements We wish to thank Christian Pick for providing arthropod hemocyanin sequences and advice. We are grateful to Tom Iliffe, Brett Gonzalez and Jesse Henson for their help with collecting the S. tulumensis specimens. This work is supported by the Deutsche Forschungsgemeinschaft (Bu956/8, Bu956/9, Mi649/6, Wa530/34) within the priority project 1174 "Deep Metazoan Phylogeny". 16
252 Literature Cited Abascal, F., R. Zardoya, and D. Posada ProtTest: selection of best-fit models of protein evolution. Bioinformatics 21: Averof, M., and M. Akam Hox genes and the diversification of insect and crustacean body plans. Nature 376: Boore, J. L., D. V. Lavrov, and W. M. Brown Gene translocation links insects and crustaceans. Nature 392: Brusca, R. C., and G. J. Brusca Invertebrates. Sinauer Associates, Sunderland Mass. Burmester, T Molecular evolution of the arthropod hemocyanin superfamily. Mol. Biol. Evol. 18: Burmester, T Origin and evolution of arthropod hemocyanins and related proteins. J. Comp. Physiol. [B] 172: Burmester, T., and K. Scheller Common origin of arthropod tyrosinase, arthropod hemocyanin, insect hexamerin, and dipteran arylphorin receptor. J. Mol. Evol. 42: Carapelli, A., P. Lio, F. Nardi, E. van der Wath, and F. Frati Phylogenetic analysis of mitochondrial protein coding genes confirms the reciprocal paraphyly of Hexapoda and Crustacea. BMC Evol. Biol. 7 Suppl 2:S8. Dunn, C. W., A. Hejnol, D. Q. Matus, K. Pang, W. E. Browne, S. A. Smith, E. Seaver, G. W. Rouse, M. Obst, G. D. Edgecombe, M. V. Sorensen, S. H. D. Haddock, A. Schmidt-Rhaesa, A. Okusu, R. M. Kristensen, W. C. Wheeler, M. Q. Martindale, and G. Giribet Broad phylogenomic sampling improves resolution of the animal tree of life. Nature 452: Emerson, M. J., and F. R. Schram Remipedia, part 2: paleontology. Proc. San Diego Soc. Nat. Hist. 7:1-52. Fanenbruck, M., and S. Harzsch A brain atlas of Godzilliognomus frondosus Yager, 1989 (Remipedia, Godzilliidae) and comparison with the brain of Speleonectes tulumensis Yager, 17
253 1987 (Remipedia, Speleonectidae): implications for arthropod relationships. Arthropod Struc. Dev Fanenbruck, M., S. Harzsch, and J. W. Wagele The brain of the Remipedia (Crustacea) and an alternative hypothesis on their phylogenetic relationships. Proc. Natl. Acad. Sci. U S A 101: Friedrich, M., and D. Tautz Ribosomal DNA phylogeny of the major extant arthropod classes and the evolution of myriapods. Nature 376: Garcia-Machado, E., M. Pempera, N. Dennebouy, M. Oliva-Suarez, J. C. Mounolou, and M. Monnerot Mitochondrial genes collectively suggest the paraphyly of Crustacea with respect to Insecta. J. Mol. Evol. 49: Gaykema, W. P. J., W. G. J. Hol, J. M. Vereijken, N. M. Soeter, H. J. Bak, and J. J. Beintema Å structure of the copper-containing, oxygen-carrying protein Panulirus interruptus haemocyanin. Nature 309: Giribet, G., G. D. Edgecombe, and W. C. Wheeler Arthropod phylogeny based on eight molecular loci and morphology. Nature 413: Giribet, G., and C. Ribera A review of arthropod phylogeny: New data based on ribosomal DNA sequences and direct character optimization. Cladistics 16: Glenner, H., P. F. Thomsen, M. B. Hebsgaard, M. V. Sorensen, and E. Willerslev The origin of insects. Science 314: Goldman, N., J. P. Anderson, and A. G. Rodrigo Likelihood-based tests of topologies in phylogenetics. Syst. Biol. 49: Haas, F., D. Waloszek, and R. Hartenberger Devonohexapodus bocksbergensis, a new marine hexapod from the Lower Devonian Hunsrück Slates, and the origin of Atelocerata and Hexapoda Org. Divers. Evol. 3: Hagner-Holler, S., A. Schoen, W. Erker, J. H. Marden, R. Rupprecht, H. Decker, and T. Burmester A respiratory hemocyanin from an insect. Proc. Natl. Acad. Sci. U S A 101:
254 Harzsch, S The phylogenetic significance of crustacean optic neuropils and chiasmata: a re-examination. J Comp Neurol 453: Hassanin, A Phylogeny of Arthropoda inferred from mitochondrial sequences: strategies for limiting the misleading effects of multiple changes in pattern and rates of substitution. Mol. Phylogenet. Evol. 38: Hazes, B., K. A. Magnus, C. Bonaventura, J. Bonaventura, Z. Dauter, K. H. Kalk, and W. G. Hol Crystal structure of deoxygenated Limulus polyphemus subunit II hemocyanin at 2.18 A resolution: clues for a mechanism for allosteric regulation. Protein Sci. 2: Herberts, C., and J. de Frescheville Occurrence of hemocyanin in. the rhizocephalan crustacea Sacculina carcini Thompson. Comp. Biochem. Physiol. B 70: Huelsenbeck, J. P., and F. Ronquist MRBAYES: Bayesian inference of phylogenetic trees. Bioinformatics 17: Hwang, U. W., M. Friedrich, D. Tautz, C. J. Park, and W. Kim Mitochondrial protein phylogeny joins myriapods with chelicerates. Nature 413: Ito, T Origin of the basis in copepod limbs, with reference to remipedian and cephalocarid limbs. J. Crust. Biol. 9: Jaenicke, E., H. Decker, W. Gebauer, J. Markl, and T. Burmester Identification, structure, and properties of hemocyanins from diplopod Myriapoda. J. Biol. Chem. 274: Katoh, K., K. Kuma, H. Toh, and T. Miyata MAFFT version 5: improvement in accuracy of multiple sequence alignment. Nucleic Acids Res. 33: Kishino, H., and M. Hasegawa Evaluation of the maximum likelihood estimate of the evolutionary tree topologies from DNA sequence data, and the branching order in hominoidea. J. Mol. Evol. 29: Koenemann, S., J. Olesen, F. Alwes, T. M. Iliffe, M. Hoenemann, P. Ungerer, C. Wolff, and G. Scholtz The post-embryonic development of Remipedia (Crustacea) - additional results and new insights. Dev. Genes Evol. 219:
255 Koenemann, S., F. R. Schram, A. Bloechl, T. M. Iliffe, M. Hoenemann, and C. Held. 2007a. Post-embryonic development of remipede crustaceans. Evol. Dev. 9: Koenemann, S., F. R. Schram, M. Hönemann, and T. M. Iliffe. 2007b. Phylogenetic analysis of Remipedia (Crustacea). Org. Divers. Evol. 7: Koenemann, S., F. R. Schram, and T. M. Iliffe Trunk segmentation in Remipedia. Crustaceana Koenemann, S., F. R. Schram, T. M. Iliffe, L. M. Hinderstein, and A. Bloechl. 2007c. The behavior of Remipedia (Crustacea), with supporting field observations. J. Crust. Biol. 27: Kusche, K., and T. Burmester Diplopod hemocyanin sequence and the phylogenetic position of the Myriapoda. Mol. Biol. Evol. 18: Kusche, K., A. Hembach, S. Hagner-Holler, W. Gebauer, and T. Burmester Complete subunit sequences, structure and evolution of the 6 x 6-mer hemocyanin from the common house centipede, Scutigera coleoptrata. Eur. J. Biochem. 270: Kusche, K., H. Ruhberg, and T. Burmester A hemocyanin from the Onychophora and the emergence of respiratory proteins. Proc. Natl. Acad. Sci. U S A 99: Lavrov, D. V., W. M. Brown, and J. L. Boore Phylogenetic position of the Pentastomida and (pan)crustacean relationships. Proc. Biol. Sci. 271: Lim, J. T., and U. W. Hwang The complete mitochondrial genome of Pollicipes mitella (Crustacea, Maxillopoda, Cirripedia): non-monophylies of Maxillopoda and Crustacea. Mol. Cells 22: Mallatt, J. M., J. R. Garey, and J. W. Shultz Ecdysozoan phylogeny and Bayesian inference: first use of nearly complete 28S and 18S rrna gene sequences to classify the arthropods and their kin. Mol. Phylogenet. Evol. 31: Mallatt, J. M., and G. Giribet Further use of nearly complete 28S and 18S rrna genes to classify Ecdysozoa: 37 more arthropods and a kinorhynch. Mol. Phylogenet. Evol. 40:
256 Mangum, C. P Oxygen transport in invertebrates. Am. J. Physiol. 248: Markl, J., and H. Decker Molecular structure of the arthropod hemocyanins. Adv. Comp. Environm. Physiol. 13: Nicholas, K. B., and H. B. J. Nicholas GeneDoc: Analysis and Visualization of Genetic Variation. Nielsen, H., J. Engelbrecht, S. Brunak, and G. von Heijne A neural network method for identification of prokaryotic and eukaryotic signal peptides and prediction of their cleavage sites. Int. J. Neural Syst. 8: Pick, C., S. Hagner-Holler, and T. Burmester Molecular characterization of hemocyanin and hexamerin from the firebrat Thermobia domestica (Zygentoma). Insect Biochem. Mol. Biol. 38: Pick, C., M. Schneuer, and T. Burmester The occurrence of hemocyanin in Hexapoda. FEBS J. 276: Pohlmann, J. W., T. M. Iliffe, and L. A. Cifuentes A stable isotope study of organic cycling and the ecology of an anchialine cave ecosystem. Marine Ecology Progress Series Regier, J. C., and J. W. Shultz Elongation factor-2: a useful gene for arthropod phylogenetics. Mol. Phylogenet. Evol. 20: Regier, J. C., J. W. Shultz, and R. E. Kambic Pancrustacean phylogeny: hexapods are terrestrial crustaceans and maxillopods are not monophyletic. Proc. Biol. Sci. 272: Regier, J. C., J. W. Shultz, A. R. Ganley, A. Hussey, D. Shi, B. Ball, A. Zwick, J. E. Stajich, M. P. Cummings, J. W. Martin, and C. W. Cunningham Resolving arthropod phylogeny: exploring phylogenetic signal within 41 kb of protein-coding nuclear gene sequence. Syst. Biol. 57: Richter, S The Tetraconata concept: hexapod-crustacean relationships and the phylogeny of Crustacea. Organ. Divers. Evol. 2:
257 Roeding, F., Hagner-Holler, S., Ruhberg, H., Ebersberger, I., von Haeseler, A., Kube, M., Reinhardt, R., Burmester, T EST sequencing of Onychophora and phylogenomic analysis of Metazoa. Mol. Phylogenet. Evol. 45: Schmidt, H. A., K. Strimmer, M. Vingron, and A. von Haeseler TREE-PUZZLE: maximum likelihood phylogenetic analysis using quartets and parallel computing. Bioinformatics 18: Schram, F. R Crustacea. Oxford University Press, Oxford, New York. Schram, F. R., and C. A. Lewis Functional morphology of feeding in Nectiopoda. Pp in B. E. Felgenhauer, L. Watling, and A. B. Thistle, eds. Crustacean Issues 6: Functional Morphology of Feeding and Grooming in Crustacea. A. A. Balkema Press, Rotterdam. Shimodaira, H., and M. Hasegawa Multiple comparisons of log-likelihoods with applications to phylogenetic inference. Mol. Biol. Evol. 16: Spears, T., and L. G. Abele Crustacean phylogeny inferred from 18S rdna. Pp in R. A. Fortey, and R. H. Thomas, eds. Arthropod Relationships. Chapman and Hall, London. Strimmer, K., and A. Rambaut Inferring confidence sets of possibly misspecified gene trees. Proc. Biol. Sci. 269: Telford, M. J., S. J. Bourlat, A. Economou, D. Papillon, and O. Rota-Stabelli The evolution of the Ecdysozoa. Philos. Trans. R. Soc. Lond. B Biol. Sci. 363: van der Ham, J. L., and B. E. Felgenhauer The functional morphology of the putative injecting apparatus of Speleonectes tanumekes (Remipedia). J. Crust. Biol. 27:1 9. van der Ham, J. L., and B. E. Felgenhauer Ultrastructure and functional morphology of glandular setae and distal claws of cephalic appendages of Speleonectes tanumekes (Crustacea: Remipedia). Arthropod Struct. Dev. 37: van Holde, K. E., and K. I. Miller Hemocyanins. Adv. Protein Chem. 47:
258 von Reumont, B. M., K. Meusemann, N. U. Szucsich, E. Dell' Ampio, V. Gowri-Shankar, D. Bartel, S. Simon, H. O. Letsch, R. R. Stocsits, Y. X. Luan, J. W. Waegele, G. Pass, H. Hadrys, and B. Misof Can comprehensive background knowledge be incorporated into substitution models to improve phylogenetic analyses? A case study on major arthropod relationships. BMC Evol. Biol. 9:119. Walossek, D On the Cambrian diversity of Crustacea. Pp in F. R. Schram, and J. C. von Vaupel Klein, eds. Crustaceans and the Biodiversity Crisis, Proceedings of the Fourth International Crustacean Congress. Brill, Leiden. Whelan, S., and N. Goldman A general empirical model of protein evolution derived from multiple protein families using a maximum-likelihood approach. Mol. Biol. Evol. 18: Wills, M A phylogeny of recent and fossil Crustacea derived from morphological characters. Pp in R. A. Fortey, and R. H. Thomas, eds. Arthropod Relationships. Chapman & Hall, London. Wilson, K., V. Cahill, E. Ballment, and J. Benzie The complete sequence of the mitochondrial genome of the crustacean Penaeus monodon: are malacostracan crustaceans more closely related to insects than to branchiopods? Mol. Biol. Evol. 17: Yager, J Remipedia, a new class of Crustacea from a marine cave in the Bahamas. J. Crust. Biol. 1: Yager, J The Remipedia (Crustacea): Recent investigations of their biology and phylogeny. Verh. Dtsch. Zool. Ges. 84: Zrzavý, J., and P. Štys The basic body plan of arthropods: insights from evolutionary morphology and developmental biology. J. Evol. Biol. 10:
259 TABLE 1. Statistical hypothesis tests. Tree 1 log L difference S.E. SH 2 1sKH 2 2sKH 2 ELW best best Tree #1: Optimal tree as presented in Fig. 3: StuHc1 and 3 associated with type 1 hexapod hemocyanins, and StuHc2 associated with type 2 hexapod hemocyanins. Tree #2: StuHc1, 2, and 3 in sister-group position to the other crustacean (malacostracan) hemocyanins. Tree #3: StuHc1 and 3 in sister-group position to the other crustacean (malacostracan) hemocyanins. Tree #4: StuHc2 in sister-group position to the other crustacean (malacostracan) hemocyanins. 2 Test methods: SH, Shimodaira-Hasegawa test; 2sKH, two sided Kishino-Hasegawa test; 1sKH, one sided KH test based on pairwise SH tests; ELW, Expected Likelihood Weight test. Plus signs (+) denote the confidence sets, minus signs (-) denote rejection of a tree. All tests used 5% significance level. 24
260 Figure Legends FIG. 1. Comparison of Remipedia (S. tulumensis) hemocyanin subunits (StuHc1-3) with the sequences of the hemocyanin subunits of the stonefly P. marginata (PmaHc1, PmaHc2) and the hemocyanin subunit a from the spiny lobster Panulirus interruptus (PinHcA). The copperbinding histidines are shaded in black, other conserved residues in light grey. The asterisks in the upper row denote the phenylananines that stabilize the O 2 -binding. In the lower row, the secondary structure of PinHcA is given (Gaykema et al. 1984). The conserved insertion of nine amino acids in beta-sheet 3A of StuHc2 and hexapod hemocyanin subunit 2 are shaded in dark grey. FIG. 2. Identification of hemocyanin protein in S. tulumensis. About 20 µg of total protein extract from S. tulumensis were applied per lane and separated by SDS-PAGE. Hemocyanin subunits were detected by polyclonal antibodies raised against various insect and crustacean hemocyanins, as indicated in the upper row. The antibodies were: -HamHc, anti-homarus americanus hemocyanin; -PalHc, anti-panulirus interruptus hemocyanin; -CpaHc, anti- Cancer pagurus hemocyanin; -TdoHc1, anti-thermobia domestica hemocyanin 1; -TdoHc2, anti-thermobia domestica hemocyanin 2. The positions of the molecular mass standards are given on the left side. FIG. 3. Simplified Bayesian phylogenetic tree of arthropod hemocyanins and hexamerins. The numbers at the nodes show maximum likelihood non-parametric bootstrap support (above) and Bayesian posterior probabilities (below). The complete trees are shown in Supplementary Figs. 3 and 4. 25
261 * StuHc1 MKSFIFLLVVGVAWAGTLSDQMVGDSPVFIPGDADFLQKQSKILKLFNKIHEHNR--YNDQVDIATSFNPLDHLG-DFKHRDCVLKLVKKYKAHRLLPRGHVFNLFRPRDREEMVMFFEALFYAKTWDTFYKIACWARDKI 138 StuHc2 MRSLAVLLLLLVAASAA DEVFLKRQRDILLLLLRLHQPNA--IPEQKSISESYDPLMHLS-HFKKPELVQELVDEITHGTTLPRGEIFNLFNTEHRTSMIHVFEVLFFAKDFDTFFKTAVYARDRV 123 StuHc3 MKFLLVLLVAGFAAA IHREVIDADKGFLKRQKDVLTLLNHVFSHFQ--DAAHQEDGRTYEPLNHLT-SYQDPTPVKKLVRMYKMGDCLKQSEIFCLFTDHHRHEMILLFEALYYAKDWGTFMKMARWARVHL 129 PmaHc1 MKWLLTLGLVMVLASLAQA----KLTRGSVPADQDFLTRQRDVIRLCMKVHEHNH--YQEQVDLVKDYDPS--VAGKFKDVTPIKRLMKYYNAKTLLPRGDIFSLFHKEHREEMILLFESFLFAQDWDTFFKTAVWARDRI 133 PmaHc2 MKFALVLIGLCALAAA DTVDDTFYKHQTQVLHLVEHIYEPISSHYEDLTTIKKTYDPLQHLD-NFKDGDHVKHFVHDVTHGKYLAHDEIFNIFHPHHRRQMVYLFEILYGAKDFDSFFNMAVWARDHM 127 PinHcA DALGTGNAQKQQDINHLLDKIYEPTK--YPDLKEIAENFNPLGDTSIYNDHGAAVETLMKELNDHRLLEQRHWYSLFNTRQRKEALMLFAVLNQCKEWYCFRSNAAYFRERM 110 aaaaa1.1aaaaa aa1.2aa aaaaaa1.3aaaaa aaaaaaa1.4aaaaaa aaa1.5aaaaaa * StuHc1 NENQFLYAMYVAVHHRHDCKGVLLPPQYEIYPQLFVNNDVIQEAYSAKMKQVPATIKMHWTGTIRNPEQHVAYFGEDLGLNSHHSHWHMDFPFWWK-KAYGTEKDRKGELFFYSHHELTTRYDLQRLSNNLPIVGPLAWDK 278 StuHc2 NEFLFYYAFSVAAVRRSDCEGLQLPPPYEIFPHFFVTSDVIRSAYKAKMMHTPTIIDMHWTGSIHNPEQRVAYYGEDVGLNSHHSHWHKDFPFWWK-PEYGIELDRKGELFFYNHHQMTSRFDLERLSNDLTISKPLAWYR 263 StuHc3 NGALFVYSVKVALLHRQDTYGIRLTPAYELNPHMFVTNDAITKAYSAKMRNKDAVVRVEFTGTIHNPEQHVAYYGEDIGMNSHHSHWHMDFPFWWK-KDYPTQMDRKGELFWYAHHQLTTRFDLERLSNNLDVVKPLAWDK 269 PmaHc1 NEGQFVYALSVAVLHREDCKGIILPPAYEIYPHMFVNSEVINSAYKAKMTQTPAIIHMNFTGTIRNPDQWIAYLGEDVGLNSHHAHWHMDFPFWWKAAEYGIEKDRKGELFYYMHHQMIARYDFERLSNWLHFVEPISFED 274 PmaHc2 SPRMFLYAFSVAVLHRTDCKGITLPPAYEITPDMFLTTDVMRKAYQAKMTATKTVIPMKFTGSIKNPEQRVAYFGEDIGVNSHHSHWHMDFPFWWK-RSYDVTKDRRGELFFYMHHQMVNRFDAERLSNWLPQVEPLNWHH 267 PinHcA NEGEFVYALYVSVIHSKLGDGIVLPPLYEITPHMFTNSEVIDKAYSAKMTQKQGTFNVSFTGTKKNREQRVAYFGEDIGMNIHHVTWHMDFPFWWE-DSYGYHLDRKGELFFWVHHQLTARFDFERLSNWLDPVDELHWDR 250 aaaa1.6aaaa bbb1abbbb aaaaa1.7aaaaa bbb1bbbb aaaaaa2.1aaaaaa aaaaaaaaaa2.2aaaaaaaaaa bb2abb * StuHc1 PIHNGFYPQAAYRNGHEFPARPDDVKFTDLDKDGFHIKVSQMKEYERRIRDAIAMKAVYGKDGHAISLNNTHGINTLAEIIEASAFSVNPDFYGSIHNMAHIMLGELDDPQGKYGTPPGVMEHFETATRDPSFFRLHKYID 419 StuHc2 PVVEGFSPDAIYKHGFQFPMRPDNTKFHDLST----VTVNHMRAYESRIHESIDFGHVYSTNGTEVSLNDEHGINILGEIVEASEHSINPDYYGSLHNLAHVMLGRITDPEGKFDAPPGVMEHFETATRDPSFFRLHKYID 400 StuHc3 PIEHGFSPETVYRTGDEFPVRPDDMMFHDIHG---IVSVTDMKAMEYRILHTIDANLYVAENGTFPKLEVDTGINTLGEIIEASEHSVNPGFYKSIHTLSHVMLGKITDPEHKYGMPPGVMEHFETSTRDPAFFRLHKYID 407 PmaHc1 EIEHGFYPQTTYRVGGEFPARPDNFHFHDLEH----IKIKDMLDYTRRIKEAISKQKVRSKNGEKIPLDAVHGIDILGDLMEPSVESPHEDYYGSLHNDAHVLLGQITDPLGKFDLPPGVMEHFETATRDPAFFRLHKHID 411 PmaHc2 EIEEGFAPAAMYFNGQEFPMRPDGIHFHDLPW----FTVKDTEDYEDRIRNVIAKGYVKASDGHTIFLNGTEGINILGLVVESLDHDYNRHYFGKLHSNAHVLLSKVTDPEQKFGTPPGVMEHFETATRDPAFFRLHKHID 404 PinHcA IIREGFAPLTSYKYGGEFPVRPDNIHFEDVDG---VAHVHDLEITESRIHEAIDHGYITDSDGHTIDIRQPKGIELLGDIIESSKYSSNVQYYGSLHNTAHVMLGRQGDPHGKFNLPPGVMEHFETATRDPSFFRLHKYMD 388 bbbbb2bbbbb bbbbb2cbbbbb aaaaaaa2.3aaaaaabb2db bb2eb aaa2.4aa aaaaa2.5aaaaa aaaa2.6aaa StuHc1 SFFKEHKDSLPPYTTDELDFHGVEIVDVEVDK LMTFFDDFEIDLTMALDDTPELADVPIKAISHRLNHAPFTYLLKMKS--DASHVATVRIFLGPKYNSYGEELSLDTKRWMMVEMDKFVVHLHSGNSEILR 549 StuHc2 NIFKSHKDHLTPYTHKELEFPGVTVTAAKVVGLSHASTPNMLITHFNNFYIDLHNALDTTTTLGDVDIKARIGRMAHEPFKYTINVNS--ERPVTATVRIFLAPAYNWYGEEIHLDEGRWLAVELDKFAVKLHEGENVITR 539 StuHc3 NLFRTYKEHLPPYTKEELAVDGLKVNDVEVTE LKTFFEDFEFDLTQGMELTGTGDDAHIKAVMARINHKPFHYTIKVNS--DVKRTGMVRIFLAPKYDWYGEEIDITHNAWQTVELDKFLVPLDPGENVIVR 537 PmaHc1 NLFKMYKDLLPPYTKAELEFPGVKVLDWEIGN LVTYFEDFDIDMLNALDDTADLPDVDVKARVQRLNHEPFTWALHMES--DKEVTAAFRVFLGPKKDWYESDFTINEVRPYLIEIDKFVTKVVAGKSVIHR 541 PmaHc2 NLFKQHKDMLTPYTKEELDFPGVTVDAVKVVGKSEDSTANQIVTFFDESHINLGNMWVHTPE--KVGIEVTMKRLNHEAFKYVITATA--EKETEGIVRIFLSPTYNWFGQEITLQDGHWGAIEMDRFPVKLTAGENVITR 541 PinHcA NIFKKHTDSFPPYTHDNLEFSGMVVNGVAIDG ELITFFDEFQYSLINAVDSGENIEDVEINARVHRLNHKEFTYKITMSNNNDGERLATFRIFLCPIEDNNGITLTLDEARWFCIELDKFFQKVPKGPETIER 521 aaa2.7aa aa3.1a bbbbbbbb3ab bbbbb b3bb bbb3cbbb bbbbbbb3dbbbbbb bbbbbb3ebbbbbb 3Fb aa3.2aa bbbb3gbbbb bbbb3hbb StuHc1 KSTESSVTIPDPKGYKGMVEAVKSAIAGDSEFKVNKEHRHCGIPDRLLLPKGSKEGTPFTLFVMVTDFDDDNANTDVES-THDYGGSISYCGTLTEGQKYPDKKPMGFPFDRHIEDVHDFKTKNMIVKDVVVTHKSDH StuHc2 LSKDSTITIPDMKSHKDMIREVESALAGELEYHIDEHHRHCGFSQGLLIPKGSEAGTHFKVFIMLTDWDKDHANADAHP-EDDYGGSIGYCGALWA--KYPDKKPMGFPFDRHIQDEEDFFTENMKLIDVVIKNIK StuHc3 KSDESTVTIPDPPSYAQLVKEVEDALSGTSVLKVHKFHRHCGIPDRMLLPKGKVGGMEFMLLVVVTDGGADKGVTIHDD--HIYGGSTSLCGIRGE--KYPDKRALGFPFDRYIHSVEDFVTPNMFCKDVVITHVPHA PmaHc1 KSSESSVTIPDRETTKVLLEKVEHALEGKETLNVNKDERHCGYPDRLLLPKGRNTGMPVQIYVIVTDFEKEKVNDLPYD--YDYGGSLSYCGVVGG-HKYPDTKAMGFPFDRRIYSREDFFTDNMYTKDVTITFKENHHH- 678 PmaHc2 SGKKSVVTIDEP----MSFAEIHKAVADKDATHFHKEFRHCGFPHRLLVPKGRPEGMHYKLMVVITDYHKDVVVPDMDVEHMDKLQSVGYCGVMEG--KIPDGKPMGYPFDRRISCEESFITKNMKFVDITVKTRV PinHcA SSKDSSVTVPDMPSFQSLKEQADNAVNGGHDLDLSAYERSCGIPDRMLLPKSKPEGMEFNLYVAVTDGDKDTEGHNGGH---DYGGTHAQCGVHGE--AYPDNRPLGYPLERRIPDERVIDGVSNIKHVVVKIVHHLEHHD 657 bb bbb3ibbbaaaaa3.3aaaa aa3.4aa bbbbb3jbbbbb a3.5a bb b3kbbb aaa3.6aa bbbbbb3lbbbbbb Fig. 1
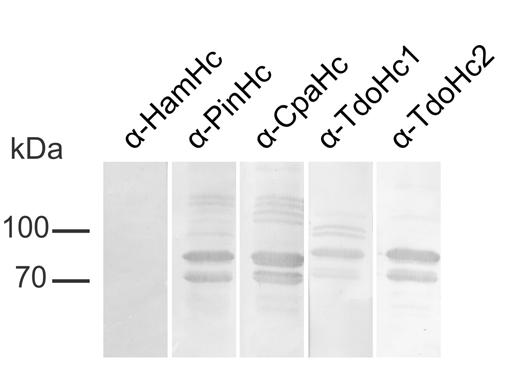
262 Fig. 2
Arthropods (Arthropoda)
") Arthropods (Arthropoda) Davide Pisani Laboratory of Evolutionary Biology, Department of Biology, The National University of Ireland, Maynooth, Co. Kildare, Ireland (davide. pisani@nuim.ie) Abstract Living
Arthropods (Arthropoda) Davide Pisani Laboratory of Evolutionary Biology, Department of Biology, The National University of Ireland, Maynooth, Co. Kildare, Ireland (davide. pisani@nuim.ie) Abstract Living
Remipedia and the Evolution of Hexapods
 and the Evolution of Hexapods Björn M von Reumont, Zoologisches Forschungsmuseum Alexander Koenig, Adenauerallee, Bonn, Germany Thorsten Burmester, Biozentrum Grindel und Zoologisches Museum, Universität
Arthropod Structure & Development
 Arthropod Structure & Development 39 (2010) 88 110 Contents lists available at ScienceDirect Arthropod Structure & Development journal homepage: www.elsevier.com/locate/asd Arthropod phylogeny revisited,
Pancrustacean phylogeny in the light of new phylogenomic. data: support for Remipedia as the possible sister group of
 MBE Advance Access published November 1, 2011 Pancrustacean phylogeny in the light of new phylogenomic data: support for Remipedia as the possible sister group of Hexapoda Research Article Bjoern M von
8/23/2014. Phylogeny and the Tree of Life
 Phylogeny and the Tree of Life Chapter 26 Objectives Explain the following characteristics of the Linnaean system of classification: a. binomial nomenclature b. hierarchical classification List the major
Advances in Crustacean Phylogenetics *
 Arthropod Systematics & Phylogeny 275 67 (2) 275 286 Museum für Tierkunde Dresden, eissn 1864-8312, 25.8.2009 Advances in Crustacean Phylogenetics * STEFAN RICHTER, OLE S. MØLLER & CHRISTIAN S. WIRKNER
Amira A. AL-Hosary PhD of infectious diseases Department of Animal Medicine (Infectious Diseases) Faculty of Veterinary Medicine Assiut
 Faculty of Veterinary Medicine Assiut") Amira A. AL-Hosary PhD of infectious diseases Department of Animal Medicine (Infectious Diseases) Faculty of Veterinary Medicine Assiut University-Egypt Phylogenetic analysis Phylogenetic Basics: Biological
Amira A. AL-Hosary PhD of infectious diseases Department of Animal Medicine (Infectious Diseases) Faculty of Veterinary Medicine Assiut University-Egypt Phylogenetic analysis Phylogenetic Basics: Biological
Hexapoda Origins: Monophyletic, Paraphyletic or Polyphyletic? Rob King and Matt Kretz
 Hexapoda Origins: Monophyletic, Paraphyletic or Polyphyletic? Rob King and Matt Kretz Outline Review Hexapod Origins Response to Hexapod Origins How the same data = different trees Arthropod Origins The
Dr. Amira A. AL-Hosary
 Phylogenetic analysis Amira A. AL-Hosary PhD of infectious diseases Department of Animal Medicine (Infectious Diseases) Faculty of Veterinary Medicine Assiut University-Egypt Phylogenetic Basics: Biological
UoN, CAS, DBSC BIOL102 lecture notes by: Dr. Mustafa A. Mansi. The Phylogenetic Systematics (Phylogeny and Systematics)
") - Phylogeny? - Systematics? The Phylogenetic Systematics (Phylogeny and Systematics) - Phylogenetic systematics? Connection between phylogeny and classification. - Phylogenetic systematics informs the
- Phylogeny? - Systematics? The Phylogenetic Systematics (Phylogeny and Systematics) - Phylogenetic systematics? Connection between phylogeny and classification. - Phylogenetic systematics informs the
Phylogenetic Analysis
 Phylogenetic Analysis Aristotle Through classification, one might discover the essence and purpose of species. Nelson & Platnick (1981) Systematics and Biogeography Carl Linnaeus Swedish botanist (1700s)
Phylogenetic Analysis
 Phylogenetic Analysis Aristotle Through classification, one might discover the essence and purpose of species. Nelson & Platnick (1981) Systematics and Biogeography Carl Linnaeus Swedish botanist (1700s)
Phylogenetic Analysis
 Phylogenetic Analysis Aristotle Through classification, one might discover the essence and purpose of species. Nelson & Platnick (1981) Systematics and Biogeography Carl Linnaeus Swedish botanist (1700s)
PHYLOGENY & THE TREE OF LIFE
 PHYLOGENY & THE TREE OF LIFE PREFACE In this powerpoint we learn how biologists distinguish and categorize the millions of species on earth. Early we looked at the process of evolution here we look at
Reconstructing the history of lineages
 Reconstructing the history of lineages Class outline Systematics Phylogenetic systematics Phylogenetic trees and maps Class outline Definitions Systematics Phylogenetic systematics/cladistics Systematics
ELECTRONIC APPENDIX. This is the Electronic Appendix to the article
 ELECTRONIC APPENDIX This is the Electronic Appendix to the article Mitochondrial genomes suggest that hexapods and crustaceans are mutually paraphyletic by Charles E. Cook, Qiaoyun Yue, Michael Akam Proc.
Integrative Biology 200 "PRINCIPLES OF PHYLOGENETICS" Spring 2018 University of California, Berkeley
 Integrative Biology 200 "PRINCIPLES OF PHYLOGENETICS" Spring 2018 University of California, Berkeley B.D. Mishler Feb. 14, 2018. Phylogenetic trees VI: Dating in the 21st century: clocks, & calibrations;
Elongation Factor-2: A Useful Gene for Arthropod Phylogenetics
 Molecular Phylogenetics and Evolution Vol. 20, No. 1, July, pp. 136 148, 2001 doi:10.1006/mpev.2001.0956, available online at http://www.idealibrary.com on Elongation Factor-2: A Useful Gene for Arthropod
PHYLOGENY AND SYSTEMATICS
 AP BIOLOGY EVOLUTION/HEREDITY UNIT Unit 1 Part 11 Chapter 26 Activity #15 NAME DATE PERIOD PHYLOGENY AND SYSTEMATICS PHYLOGENY Evolutionary history of species or group of related species SYSTEMATICS Study
Lecture 11 Friday, October 21, 2011
 Lecture 11 Friday, October 21, 2011 Phylogenetic tree (phylogeny) Darwin and classification: In the Origin, Darwin said that descent from a common ancestral species could explain why the Linnaean system
Hexapods Resurrected
 Hexapods Resurrected (Technical comment on: "Hexapod Origins: Monophyletic or Paraphyletic?") Frédéric Delsuc, Matthew J. Phillips and David Penny The Allan Wilson Centre for Molecular Ecology and Evolution
Ecdysozoan phylogeny and Bayesian inference: first use of nearly complete 28S and 18S rrna gene sequences to classify the arthropods and their kin q
 Molecular Phylogenetics and Evolution 31 (2004) 178 191 MOLECULAR PHYLOGENETICS AND EVOLUTION www.elsevier.com/locate/ympev Ecdysozoan phylogeny and Bayesian inference: first use of nearly complete 28S
Integrating Fossils into Phylogenies. Throughout the 20th century, the relationship between paleontology and evolutionary biology has been strained.
 IB 200B Principals of Phylogenetic Systematics Spring 2011 Integrating Fossils into Phylogenies Throughout the 20th century, the relationship between paleontology and evolutionary biology has been strained.
Lecture V Phylogeny and Systematics Dr. Kopeny
 Delivered 1/30 and 2/1 Lecture V Phylogeny and Systematics Dr. Kopeny Lecture V How to Determine Evolutionary Relationships: Concepts in Phylogeny and Systematics Textbook Reading: pp 425-433, 435-437
Chapter 26: Phylogeny and the Tree of Life Phylogenies Show Evolutionary Relationships
 Chapter 26: Phylogeny and the Tree of Life You Must Know The taxonomic categories and how they indicate relatedness. How systematics is used to develop phylogenetic trees. How to construct a phylogenetic
ESS 345 Ichthyology. Systematic Ichthyology Part II Not in Book
 ESS 345 Ichthyology Systematic Ichthyology Part II Not in Book Thought for today: Now, here, you see, it takes all the running you can do, to keep in the same place. If you want to get somewhere else,
Chapter 26 Phylogeny and the Tree of Life
 Chapter 26 Phylogeny and the Tree of Life Chapter focus Shifting from the process of how evolution works to the pattern evolution produces over time. Phylogeny Phylon = tribe, geny = genesis or origin
Using Trees for Classifications. Introduction
 Using Trees for Classifications The Phylogenetic Cibele Caio Principles and Practice of Phylogenetic Systematics, Spring 2009 Introduction The impusle to characterize and classify species Ancient Aristoteles
The origin and evolution of arthropods
 INSIGHT REVIEW doi:10.1038/nature07890 The origin and evolution of arthropods Graham E. Budd 1 & Maximilian J. Telford 2 The past two decades have witnessed profound changes in our understanding of the
Classification and Phylogeny
 Classification and Phylogeny The diversity of life is great. To communicate about it, there must be a scheme for organization. There are many species that would be difficult to organize without a scheme
Macroevolution Part I: Phylogenies
 Macroevolution Part I: Phylogenies Taxonomy Classification originated with Carolus Linnaeus in the 18 th century. Based on structural (outward and inward) similarities Hierarchal scheme, the largest most
ABASCAL, F. (2005). ProtTest: selection of best-fit models of protein evolution. Bioinformatics 21,
. ProtTest: selection of best-fit models of protein evolution. Bioinformatics 21,") 5. REFERENCES ABASCAL, F. (2005). ProtTest: selection of best-fit models of protein evolution. Bioinformatics 21, 2104-2105. ABELE, L. G., KIM, W. & FELGENHAUER, B. E. (1989). Molecular evidence for inclusion
5. REFERENCES ABASCAL, F. (2005). ProtTest: selection of best-fit models of protein evolution. Bioinformatics 21, 2104-2105. ABELE, L. G., KIM, W. & FELGENHAUER, B. E. (1989). Molecular evidence for inclusion
Chapter 26 Phylogeny and the Tree of Life
 Chapter 26 Phylogeny and the Tree of Life Biologists estimate that there are about 5 to 100 million species of organisms living on Earth today. Evidence from morphological, biochemical, and gene sequence
Classification and Phylogeny
 Classification and Phylogeny The diversity it of life is great. To communicate about it, there must be a scheme for organization. There are many species that would be difficult to organize without a scheme
Modern Evolutionary Classification. Section 18-2 pgs
 Modern Evolutionary Classification Section 18-2 pgs 451-455 Modern Evolutionary Classification In a sense, organisms determine who belongs to their species by choosing with whom they will mate. Taxonomic
CHAPTERS 24-25: Evidence for Evolution and Phylogeny
 CHAPTERS 24-25: Evidence for Evolution and Phylogeny 1. For each of the following, indicate how it is used as evidence of evolution by natural selection or shown as an evolutionary trend: a. Paleontology
C3020 Molecular Evolution. Exercises #3: Phylogenetics
 C3020 Molecular Evolution Exercises #3: Phylogenetics Consider the following sequences for five taxa 1-5 and the known outgroup O, which has the ancestral states (note that sequence 3 has changed from
PhyQuart-A new algorithm to avoid systematic bias & phylogenetic incongruence
 PhyQuart-A new algorithm to avoid systematic bias & phylogenetic incongruence Are directed quartets the key for more reliable supertrees? Patrick Kück Department of Life Science, Vertebrates Division,
Consensus methods. Strict consensus methods
 Consensus methods A consensus tree is a summary of the agreement among a set of fundamental trees There are many consensus methods that differ in: 1. the kind of agreement 2. the level of agreement Consensus
Integrative Biology 200A "PRINCIPLES OF PHYLOGENETICS" Spring 2012 University of California, Berkeley
 Integrative Biology 200A "PRINCIPLES OF PHYLOGENETICS" Spring 2012 University of California, Berkeley B.D. Mishler Feb. 7, 2012. Morphological data IV -- ontogeny & structure of plants The last frontier
Classification, Phylogeny yand Evolutionary History
 Classification, Phylogeny yand Evolutionary History The diversity of life is great. To communicate about it, there must be a scheme for organization. There are many species that would be difficult to organize
D-optimally Lack-of-Fit-Test-efficient Designs and Related Simple Designs
 AUSTRIAN JOURNAL OF STATISTICS Volume 37 (2008), Number 3&4, 245 253 D-optimally Lack-of-Fit-Test-efficient Designs and Related Simple Designs Wolfgang Bischoff Catholic University ichstätt-ingolstadt,
Phylogeny and systematics. Why are these disciplines important in evolutionary biology and how are they related to each other?
 Phylogeny and systematics Why are these disciplines important in evolutionary biology and how are they related to each other? Phylogeny and systematics Phylogeny: the evolutionary history of a species
Report. Molecular Timetrees Reveal a Cambrian Colonization of Land and a New Scenario for Ecdysozoan Evolution
 Current Biology 23, 392 398, March 4, 2013 ª2013 Elsevier Ltd All rights reserved http://dx.doi.org/10.1016/j.cub.2013126 Molecular Timetrees Reveal a Cambrian Colonization of Land and a New Scenario for
Biology 211 (2) Week 1 KEY!
 Week 1 KEY!") Biology 211 (2) Week 1 KEY Chapter 1 KEY FIGURES: 1.2, 1.3, 1.4, 1.5, 1.6, 1.7 VOCABULARY: Adaptation: a trait that increases the fitness Cells: a developed, system bound with a thin outer layer made of
Biology 211 (2) Week 1 KEY Chapter 1 KEY FIGURES: 1.2, 1.3, 1.4, 1.5, 1.6, 1.7 VOCABULARY: Adaptation: a trait that increases the fitness Cells: a developed, system bound with a thin outer layer made of
Post-embryonic development of remipede crustaceans
 EVOLUTION & DEVELOPMENT 9:2, 117 121 (2007) Post-embryonic development of remipede crustaceans Stefan Koenemann, a, Frederick R. Schram, b Armin Bloechl, a Thomas M. Iliffe, c Mario Hoenemann, a and Christoph
BINF6201/8201. Molecular phylogenetic methods
 BINF60/80 Molecular phylogenetic methods 0-7-06 Phylogenetics Ø According to the evolutionary theory, all life forms on this planet are related to one another by descent. Ø Traditionally, phylogenetics
SCIENTIFIC EVIDENCE TO SUPPORT THE THEORY OF EVOLUTION. Using Anatomy, Embryology, Biochemistry, and Paleontology
 SCIENTIFIC EVIDENCE TO SUPPORT THE THEORY OF EVOLUTION Using Anatomy, Embryology, Biochemistry, and Paleontology Scientific Fields Different fields of science have contributed evidence for the theory of
Algorithmic Methods Well-defined methodology Tree reconstruction those that are well-defined enough to be carried out by a computer. Felsenstein 2004,
 Tracing the Evolution of Numerical Phylogenetics: History, Philosophy, and Significance Adam W. Ferguson Phylogenetic Systematics 26 January 2009 Inferring Phylogenies Historical endeavor Darwin- 1837
Using phylogenetics to estimate species divergence times... Basics and basic issues for Bayesian inference of divergence times (plus some digression)
") Using phylogenetics to estimate species divergence times... More accurately... Basics and basic issues for Bayesian inference of divergence times (plus some digression) "A comparison of the structures
Using phylogenetics to estimate species divergence times... More accurately... Basics and basic issues for Bayesian inference of divergence times (plus some digression) "A comparison of the structures
Organizing Life s Diversity
 17 Organizing Life s Diversity section 2 Modern Classification Classification systems have changed over time as information has increased. What You ll Learn species concepts methods to reveal phylogeny
Phylogeny is the evolutionary history of a group of organisms. Based on the idea that organisms are related by evolution
 Bio 1M: Phylogeny and the history of life 1 Phylogeny S25.1; Bioskill 11 (2ndEd S27.1; Bioskills 3) Bioskills are in the back of your book Phylogeny is the evolutionary history of a group of organisms
How should we organize the diversity of animal life?
 How should we organize the diversity of animal life? The difference between Taxonomy Linneaus, and Cladistics Darwin What are phylogenies? How do we read them? How do we estimate them? Classification (Taxonomy)
Microbial Taxonomy. Microbes usually have few distinguishing properties that relate them, so a hierarchical taxonomy mainly has not been possible.
 Microbial Taxonomy Traditional taxonomy or the classification through identification and nomenclature of microbes, both "prokaryote" and eukaryote, has been in a mess we were stuck with it for traditional
Chapter 1:IntroductionThemes in the Study of Life. Wilkie South Fort Myers High School
 Chapter 1:IntroductionThemes in the Study of Life Wilkie South Fort Myers High School 2015-2016 Properties of Living Things (figure 1.3) All living things must meet seven criteria to be considered a living
Outline. Classification of Living Things
 Outline Classification of Living Things Chapter 20 Mader: Biology 8th Ed. Taxonomy Binomial System Species Identification Classification Categories Phylogenetic Trees Tracing Phylogeny Cladistic Systematics
Power. Wintersemester 2016/17. Jerome Olsen
 Power Wintersemester 2016/17 Jerome Olsen Power True result H0 ist wahr H0 ist falsch Test result H0 Annahme (kein sig. Ergebnis) H0 Verwerfung (sig. Ergebnis) 1-α β 95% 20% α 1-β 5% 80% Type-II error
Cover picture: A reconstruction of Kootenichela deppi Legg 2013, from the middle Cambrian Stephen Formation of British Columbia (Canada).
.") Cover picture: A reconstruction of Kootenichela deppi Legg 2013, from the middle Cambrian Stephen Formation of British Columbia (Canada). Abstract The arthropods are the most diverse, abundant and ubiquitous
Cover picture: A reconstruction of Kootenichela deppi Legg 2013, from the middle Cambrian Stephen Formation of British Columbia (Canada). Abstract The arthropods are the most diverse, abundant and ubiquitous
AP Biology. Cladistics
 Cladistics Kingdom Summary Review slide Review slide Classification Old 5 Kingdom system Eukaryote Monera, Protists, Plants, Fungi, Animals New 3 Domain system reflects a greater understanding of evolution
Philosophiekolloquium FB Philosophie KGW
 Prof. Jürgen Mittelstrass: Was ist ein philosophisches Problem? Philosophische Probleme treten in der Regel innerhalb philosophischer Konzeptionen auf und werden dann auch mit den Mitteln dieser Konzeptionen
POPULATION GENETICS Winter 2005 Lecture 17 Molecular phylogenetics
 POPULATION GENETICS Winter 2005 Lecture 17 Molecular phylogenetics - in deriving a phylogeny our goal is simply to reconstruct the historical relationships between a group of taxa. - before we review the
Ordinals and Cardinals: Basic set-theoretic techniques in logic
 Ordinals and Cardinals: Basic set-theoretic techniques in logic Benedikt Löwe Universiteit van Amsterdam Grzegorz Plebanek Uniwersytet Wroc lawski ESSLLI 2011, Ljubljana, Slovenia This course is a foundational
5/31/17. Week 10; Monday MEMORIAL DAY NO CLASS. Page 88
 Week 10; Monday MEMORIAL DAY NO CLASS Page 88 Week 10; Wednesday Announcements: Family ID final in lab Today Final exam next Tuesday at 8:30 am here Lecture: Species concepts & Speciation. What are species?
Origins of Life. Fundamental Properties of Life. Conditions on Early Earth. Evolution of Cells. The Tree of Life
 The Tree of Life Chapter 26 Origins of Life The Earth formed as a hot mass of molten rock about 4.5 billion years ago (BYA) -As it cooled, chemically-rich oceans were formed from water condensation Life
Lecture 6 Phylogenetic Inference
 Lecture 6 Phylogenetic Inference From Darwin s notebook in 1837 Charles Darwin Willi Hennig From The Origin in 1859 Cladistics Phylogenetic inference Willi Hennig, Cladistics 1. Clade, Monophyletic group,
Integrative Biology 200A "PRINCIPLES OF PHYLOGENETICS" Spring 2008
 Integrative Biology 200A "PRINCIPLES OF PHYLOGENETICS" Spring 2008 University of California, Berkeley B.D. Mishler March 18, 2008. Phylogenetic Trees I: Reconstruction; Models, Algorithms & Assumptions
Name. Ecology & Evolutionary Biology 2245/2245W Exam 2 1 March 2014
 Name 1 Ecology & Evolutionary Biology 2245/2245W Exam 2 1 March 2014 1. Use the following matrix of nucleotide sequence data and the corresponding tree to answer questions a. through h. below. (16 points)
Introduction to characters and parsimony analysis
 Introduction to characters and parsimony analysis Genetic Relationships Genetic relationships exist between individuals within populations These include ancestordescendent relationships and more indirect
A. Incorrect! In the binomial naming convention the Kingdom is not part of the name.
 Microbiology Problem Drill 08: Classification of Microorganisms No. 1 of 10 1. In the binomial system of naming which term is always written in lowercase? (A) Kingdom (B) Domain (C) Genus (D) Specific
What is Phylogenetics
 What is Phylogenetics Phylogenetics is the area of research concerned with finding the genetic connections and relationships between species. The basic idea is to compare specific characters (features)
"PRINCIPLES OF PHYLOGENETICS: ECOLOGY AND EVOLUTION" Integrative Biology 200B Spring 2009 University of California, Berkeley
 "PRINCIPLES OF PHYLOGENETICS: ECOLOGY AND EVOLUTION" Integrative Biology 200B Spring 2009 University of California, Berkeley B.D. Mishler Jan. 22, 2009. Trees I. Summary of previous lecture: Hennigian
Chapter 16: Reconstructing and Using Phylogenies
 Chapter Review 1. Use the phylogenetic tree shown at the right to complete the following. a. Explain how many clades are indicated: Three: (1) chimpanzee/human, (2) chimpanzee/ human/gorilla, and (3)chimpanzee/human/
Introduction to Biosystematics - Zool 575
 Introduction to Biosystematics Lecture 10 - Introduction to Phylogenetics 1. Pre Lamarck, Pre Darwin Classification without phylogeny 2. Lamarck & Darwin to Hennig (et al.) Classification with phylogeny
Chapter Chemical Uniqueness 1/23/2009. The Uses of Principles. Zoology: the Study of Animal Life. Fig. 1.1
 Fig. 1.1 Chapter 1 Life: Biological Principles and the Science of Zoology BIO 2402 General Zoology Copyright The McGraw Hill Companies, Inc. Permission required for reproduction or display. The Uses of
CHAPTER 26 PHYLOGENY AND THE TREE OF LIFE Connecting Classification to Phylogeny
 CHAPTER 26 PHYLOGENY AND THE TREE OF LIFE Connecting Classification to Phylogeny To trace phylogeny or the evolutionary history of life, biologists use evidence from paleontology, molecular data, comparative
Example questions. Z:\summer_10_teaching\bioinfo\Beispiel_frage_bioinformatik.doc [1 / 5]
![Example questions. Z:\summer_10_teaching\bioinfo\Beispiel_frage_bioinformatik.doc [1 / 5]](/thumbs/71/65611963.jpg "Example questions. Z:\summer_10_teaching\bioinfo\Beispiel_frage_bioinformatik.doc [1 / 5]") Example questions for Bioinformatics, first semester half Sommersemester 00 ote The schriftliche Klausur wurde auf deutsch geschrieben The questions will be based on material from the Übungen and the Lectures.
Example questions for Bioinformatics, first semester half Sommersemester 00 ote The schriftliche Klausur wurde auf deutsch geschrieben The questions will be based on material from the Übungen and the Lectures.
--Therefore, congruence among all postulated homologies provides a test of any single character in question [the central epistemological advance].
![--Therefore, congruence among all postulated homologies provides a test of any single character in question [the central epistemological advance].](/thumbs/86/93197257.jpg "--Therefore, congruence among all postulated homologies provides a test of any single character in question [the central epistemological advance].") Integrative Biology 200A "PRINCIPLES OF PHYLOGENETICS" Spring 2008 University of California, Berkeley B.D. Mishler Jan. 29, 2008. The Hennig Principle: Homology, Synapomorphy, Rooting issues The fundamental
Integrative Biology 200A "PRINCIPLES OF PHYLOGENETICS" Spring 2008 University of California, Berkeley B.D. Mishler Jan. 29, 2008. The Hennig Principle: Homology, Synapomorphy, Rooting issues The fundamental
Systematics - BIO 615
 A Knyght ther was, and that a worthy man, A Knyght ther was, and he was a worthy man, A Knyght ther was, and that a worthy man, A Knyght ther was, and he was a worthy man, A Knyght ther was, and he wasn
Workshop: Biosystematics
 Workshop: Biosystematics by Julian Lee (revised by D. Krempels) Biosystematics (sometimes called simply "systematics") is that biological sub-discipline that is concerned with the theory and practice of
The practice of naming and classifying organisms is called taxonomy.
 Chapter 18 Key Idea: Biologists use taxonomic systems to organize their knowledge of organisms. These systems attempt to provide consistent ways to name and categorize organisms. The practice of naming
, $9000 9/1/99 8/30/2004 PI
 Results from Prior NSF Support (Regier and Shultz, last 5 years) Regier, J.C., Friedlander, T.P., Mitter, C., and Peigler, R.S. "Multiple Nuclear Genes for Lepidopteran Phylogenetics," DEB-9509174. 9/1/95-2/28/97.
C.DARWIN ( )
") C.DARWIN (1809-1882) LAMARCK Each evolutionary lineage has evolved, transforming itself, from a ancestor appeared by spontaneous generation DARWIN All organisms are historically interconnected. Their relationships
C.DARWIN (1809-1882) LAMARCK Each evolutionary lineage has evolved, transforming itself, from a ancestor appeared by spontaneous generation DARWIN All organisms are historically interconnected. Their relationships
1/27/2010. Systematics and Phylogenetics of the. An Introduction. Taxonomy and Systematics
 Systematics and Phylogenetics of the Amphibia: An Introduction Taxonomy and Systematics Taxonomy, the science of describing biodiversity, mainly naming unnamed species, and arranging the diversity into
Systematics - Bio 615
 Bayesian Phylogenetic Inference 1. Introduction, history 2. Advantages over ML 3. Bayes Rule 4. The Priors 5. Marginal vs Joint estimation 6. MCMC Derek S. Sikes University of Alaska 7. Posteriors vs Bootstrap
SPECIATION. REPRODUCTIVE BARRIERS PREZYGOTIC: Barriers that prevent fertilization. Habitat isolation Populations can t get together
 SPECIATION Origin of new species=speciation -Process by which one species splits into two or more species, accounts for both the unity and diversity of life SPECIES BIOLOGICAL CONCEPT Population or groups
How to read and make phylogenetic trees Zuzana Starostová
 How to read and make phylogenetic trees Zuzana Starostová How to make phylogenetic trees? Workflow: obtain DNA sequence quality check sequence alignment calculating genetic distances phylogeny estimation
Patterns of Evolution
 Patterns of Evolution A tree that represents an estimate (hypothesis) of evolutionary relatedness is a phylogeny Classifications can be based on groupings within a phylogeny Groupings can be categorized
Phylogeny 9/8/2014. Evolutionary Relationships. Data Supporting Phylogeny. Chapter 26
 Phylogeny Chapter 26 Taxonomy Taxonomy: ordered division of organisms into categories based on a set of characteristics used to assess similarities and differences Carolus Linnaeus developed binomial nomenclature,
METHODS FOR DETERMINING PHYLOGENY. In Chapter 11, we discovered that classifying organisms into groups was, and still is, a difficult task.
 Chapter 12 (Strikberger) Molecular Phylogenies and Evolution METHODS FOR DETERMINING PHYLOGENY In Chapter 11, we discovered that classifying organisms into groups was, and still is, a difficult task. Modern
In a way, organisms determine who belongs to their species by choosing with whom they will! MODERN EVOLUTIONARY CLASSIFICATION 18-2 MATE
 MODERN EVOLUTIONARY CLASSIFICATION 18-2 In a way, organisms determine who belongs to their species by choosing with whom they will! MATE Taxonomic groups are invented by scientists to group organisms with
OpenStax-CNX module: m Animal Phylogeny * OpenStax. Abstract. 1 Constructing an Animal Phylogenetic Tree
 OpenStax-CNX module: m44658 1 Animal Phylogeny * OpenStax This work is produced by OpenStax-CNX and licensed under the Creative Commons Attribution License 3.0 By the end of this section, you will be able
Classifications can be based on groupings g within a phylogeny
 Patterns of Evolution A tree that represents an estimate (hypothesis) of evolutionary relatedness is a phylogeny Classifications can be based on groupings g within a phylogeny y Groupings can be categorized
Systematics Lecture 3 Characters: Homology, Morphology
 Systematics Lecture 3 Characters: Homology, Morphology I. Introduction Nearly all methods of phylogenetic analysis rely on characters as the source of data. A. Character variation is coded into a character-by-taxon
Estimating Evolutionary Trees. Phylogenetic Methods
 Estimating Evolutionary Trees v if the data are consistent with infinite sites then all methods should yield the same tree v it gets more complicated when there is homoplasy, i.e., parallel or convergent
The Life System and Environmental & Evolutionary Biology II
 The Life System and Environmental & Evolutionary Biology II EESC V2300y / ENVB W2002y Laboratory 1 (01/28/03) Systematics and Taxonomy 1 SYNOPSIS In this lab we will give an overview of the methodology
Crustacean classification: on-going controversies and unresolved problems*
 Zootaxa 1668: 313 325 (2007) www.mapress.com/zootaxa/ Copyright 2007 Magnolia Press ISSN 1175-5326 (print edition) ZOOTAXA ISSN 1175-5334 (online edition) Crustacean classification: on-going controversies
Nomenclature and classification
 Class entry quiz results year biology background major biology freshman college advanced environmental sophomore sciences college introductory landscape architecture junior highschool undeclared senior
BIOL 1010 Introduction to Biology: The Evolution and Diversity of Life. Spring 2011 Sections A & B
 BIOL 1010 Introduction to Biology: The Evolution and Diversity of Life. Spring 2011 Sections A & B Steve Thompson: stthompson@valdosta.edu http://www.bioinfo4u.net 1 ʻTree of Life,ʼ ʻprimitive,ʼ ʻprogressʼ
Biology 1B Evolution Lecture 2 (February 26, 2010) Natural Selection, Phylogenies
 Natural Selection, Phylogenies") 1 Natural Selection (Darwin-Wallace): There are three conditions for natural selection: 1. Variation: Individuals within a population have different characteristics/traits (or phenotypes). 2. Inheritance:
1 Natural Selection (Darwin-Wallace): There are three conditions for natural selection: 1. Variation: Individuals within a population have different characteristics/traits (or phenotypes). 2. Inheritance:
(Stevens 1991) 1. morphological characters should be assumed to be quantitative unless demonstrated otherwise
 1. morphological characters should be assumed to be quantitative unless demonstrated otherwise") Bot 421/521 PHYLOGENETIC ANALYSIS I. Origins A. Hennig 1950 (German edition) Phylogenetic Systematics 1966 B. Zimmerman (Germany, 1930 s) C. Wagner (Michigan, 1920-2000) II. Characters and character states
Bot 421/521 PHYLOGENETIC ANALYSIS I. Origins A. Hennig 1950 (German edition) Phylogenetic Systematics 1966 B. Zimmerman (Germany, 1930 s) C. Wagner (Michigan, 1920-2000) II. Characters and character states