Epithelial organisation revealed by a network of cellular contacts
|
|
|
- Rosamund Mathews
- 5 years ago
- Views:
Transcription
1 Epithelial organisation revealed by a network of cellular contacts Luis M. Escudero 1,+,*, Luciano da F. Costa 2, Anna Kicheva 3, James Briscoe 3, Matthew Freeman 1 and M. Madan Babu 1,* 1MRC Laboratory of Molecular Biology, Hills Road, Cambridge CB2 0QH, United Kingdom 2Instituto de Física de São Carlos, Universidade de São Paulo, São Carlos, SP, Brazil 3Developmental Neurobiology, National Institute for Medical Research, London, UK +Current address: Instituto Biomedicina Sevilla (IBiS), Universidad de Sevilla/ CSIC/ Hospital Virgen del Rocío. Seville, Spain. *To whom correspondence should be addressed. s: MMB (madanm@mrc-lmb.cam.ac.uk) or LME (lmescudero-ibis@us.es)
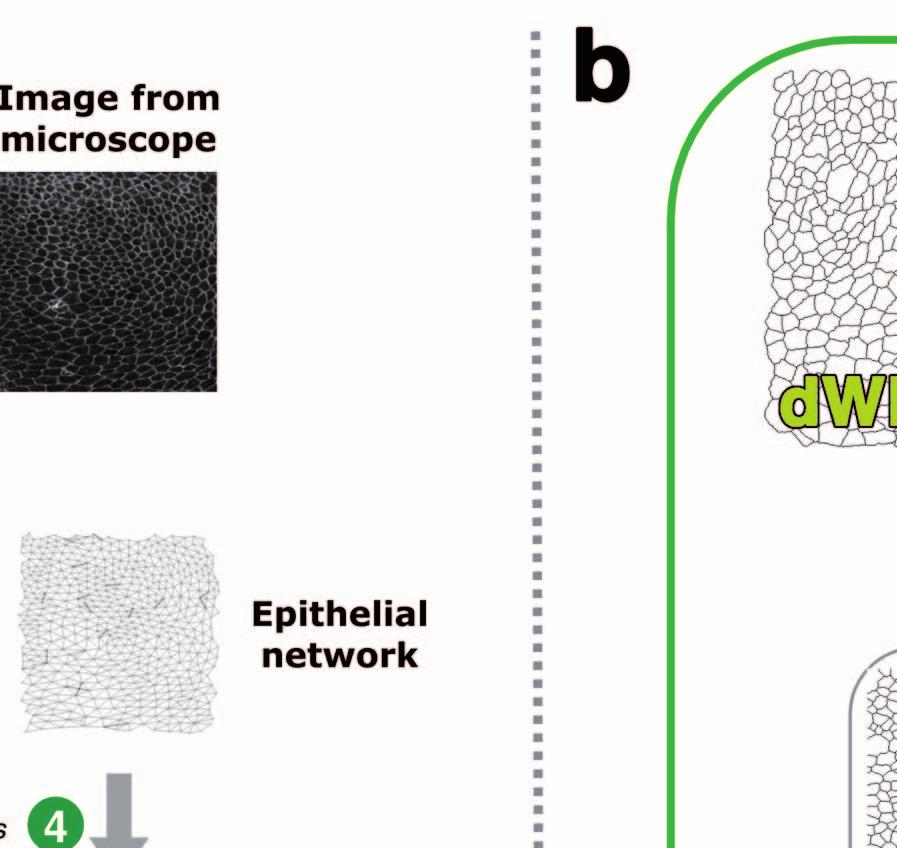
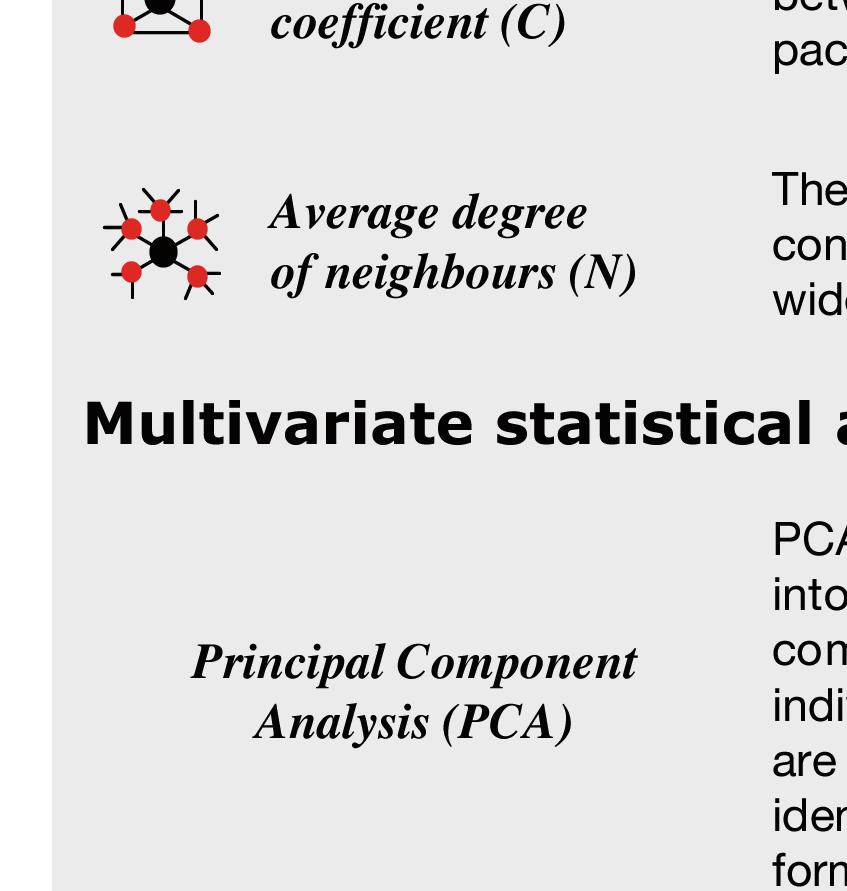
2 Abstract The emergence of differences in arrangement of cells is the first step towards establishment of many organs. Understanding this process is limited by the lack of systematic characterization of epithelial organisation. Here we apply network theory at the scale of individual cells to uncover patterns in cell-to-cell contacts that govern epithelial organisation. We provide an objective characterization of epithelia using network representation where cells are nodes and cell contacts are links. The features of individual cells, together with attributes of the cellular network produce a defining signature that distinguishes epithelia from different organs, species, developmental stages and genetic conditions. The approach permits characterization, quantification and classification of normal and perturbed epithelia and establishes a framework for understanding molecular mechanisms that underpin the architecture of complex tissues. Introduction Investigating the interactions between components as a network provides a common platform to uncover signatures of complex systems 1-5. While this approach has been recently exploited to investigate biological systems of different scales, ranging from interactions between molecules to interactions between species, application of network theory at the level of individual cells has been rather limited. In this study, we present a network based approach to understand general principles in the organisation of cells in an organism (i.e., epithelia). Early in animal development, cells in an epithelia begin to divide and alter their position, shape and size in stereotypical ways Despite being a highly dynamic process, this results in ordered, robust structure that ultimately leads to the formation of mature organs with cellular organisation suited to their specialised functions. Though we have an understanding of the contribution of genetic mechanisms (e.g., external signals and the associated gene regulatory pathways 6, 14 ) and cellular mechanics (e.g., intrinsic patterns arising due to the rate of cell division 8, 9, 11, 15 or cell re-arrangement due to anisotropy of cortical forces within individual cells 6, ) to the development of epithelial architecture in various model systems, we lack the means to objectively characterise and quantify the similarities and differences in the organisation of epithelia. Previous studies have offered insights into epithelial organisation by focusing primarily on geometric characteristics of individual cells such as the cell area and the number of contacts 8, 9, 18, 21 and have led to the formulation of empirical relationships such as Aboav-Weaire s law and Lewis law 22, 23. This has largely emphasized the similarity between different epithelia. However, a more comprehensive view of epithelial organisation can be achieved if one considers the higher order organisation of cells such as the patterns in the network of interactions between cells that typically characterises an epithelium. The ability to do this would provide a way to describe objectively an epithelium, facilitate the investigation of fundamental questions about its organisation and dynamics, and establish an objective basis for comparative studies of epithelia from different sources. Importantly, the network characteristics of epithelial organisation (as opposed to geometric features) are not readily assessed by eye. This implies that higher-order organisation may not be accounted for in our current understanding of epithelial architecture. In this work we present an approach, we term GNEO (Geometric and Network representation of Epithelial Organisation) which, by combining network and geometric measures of epithelial organisation, addresses these issues. We show that our approach is able to capture a defining signature that distinguishes epithelia from different organs, species, developmental stages and genetic conditions. In this way, GNEO permits characterization, quantification and classification of normal and perturbed epithelia in an objective manner. Results The GNEO method for characterising epithelial organisation. In order to capture information about the spatial organisation of cells and the global features of an epithelium, we generated network representations of confocal images of epithelia based on the cell-cell contacts. This allows principles from graph theory and complex networks 2, 3, 5, 24 to be used to investigate short- and long-range patterns in epithelial organisation. In such a network, the centre of each cell is treated as a node and two nodes are linked if the two cells are neighbors (i.e., physically contact each other) in the epithelium (see Methods; Fig. 1a and Supplementary Fig. S1). For each image, we generated a feature vector consisting of eight features (see Fig. 2): the means and standard deviations of the cell area, degree (i.e., number of neighbors), clustering coefficient (the amount of interconnectedness among a cell s immediate neighbors) and average degree of neighbors (the average number of neighbors of a cell s neighbor). Thus, the mean values of the features in the feature vector represent information about the cell shape (area and degree) and the pattern of cell-to-cell contacts (degree, clustering coefficient and average degree of neighbors). While the degree 1
3 is informative of the short-range pattern of contacts (the immediate neighbors of cell), the clustering coefficient and average degree of the neighbors represents the cell s context and surrounding, thus reflecting higher order organization. In turn, the standard deviation values are indicative of the cell-to-cell variability (i.e., heterogeneity) of a feature in an epithelium. For each type of epithelium, we collected a set of images from several different individuals and extracted the feature vectors in each case (Supplementary Table S1). This allows us to compare epithelia, for example from different developmental stages, tissues and species (Fig. 1b and Supplementary Fig. S2-S3), and the natural variation (i.e., individual-to-individual variability) in epithelial organisation. To compare different epithelia, we used multivariate statistical methods to identify the contribution of the different feature in the feature vector that best separate different epithelial types. We took advantage of an unsupervised and a 4, 24, 25 supervised method, namely Principal Component Analysis (PCA) and Discriminant Analysis (DA) (see Fig. 2 and Methods). Both these methods provide information about the relative contribution of the features that distinguish different epithelia, termed "feature weights" (Fig. 3a and Supplementary Table S2). The statistical significance of the separation of the different epithelia was assessed using the MANOVA test (see Methods). Comparison of epithelia from different organisms. To validate the approach, we first used the feature vector to compare visually distinct epithelia. For this we took advantage of the neural tube (samples cnt1 to cnt12) and embryonic ectoderm (cee1 to cee14) from chicken embryos, and the Drosophila wing imaginal disc from the prepupal stage (dwp1 to dwp16). Discriminant Analysis and PCA revealed that the epithelia from the two different organisms could be clustered into two distinct groups (Fig. 3b; cnt and dwp; DA; p=9.17x10⁻¹⁸ ; Supplementary Fig. S4; cee and dwp; DA; p=2.41x10⁻²¹, Supplementary Fig. S5) demonstrating the efficacy of the method. The greater importance of the average degree of the neighbours (N) and the standard deviation of the degree (D) in the dwp-cnt separation (Fig. 3a,b and Supplementary Table S1) suggests that these two network features capture a certain defining signature that is independent of the cell area (which is comparable for these epithelial types). Comparison of different epithelial types. To verify whether we could discriminate between different types of epithelia from the same organism, we compared the columnar neuroepithelium (cnt) of the chick to the squamous embryonic ectoderm (cee). PCA and Discriminant Analysis of the feature vectors of these two epithelia revealed that they form two distinct groups (Fig. 3c; DA; p=4.49x10⁻¹⁶ ; Supplementary Fig. S6; PCA; p=4.27x10⁻¹⁰ ). In this case, the cee dataset was more spread out, reflecting the greater heterogeneity among these samples. However, each sample was clearly separated from cnt epithelia. In addition, the method separated the Drosophila wing pouch (dwp), the chick neuroepithelium (cnt) and embryonic ectoderm (cee) epithelia into three groups (Fig. 3d), demonstrating that it is sensitive to different types of epithelial organization. Multiple features contributed to the separation of these epithelia, suggesting that it was the combination of features that allowed the discrimination (Fig. 3a). This underscores the importance of global structure of the network. In particular, we found that the standard deviation of the non-geometric (i.e., network) features were more important in separating the different epithelial types, suggesting that, in this case, GNEO is able to capture patterns in epithelial organisation which are not visually apparent and are independent of cell area. Comparison of epithelia from different developmental stages. We next compared more closely related epithelia. Discriminant Analysis on the feature vectors of the wildtype (WT) epithelia of the wing pouch (which develops into the adult wing blade; dwp1 to dwp16) and the notum (which develops into the adult thorax; dnp1 to dnp12) of the wing imaginal disc from the prepupal stage showed that these samples were only partially separable. This indicates a similarity in the overall organisation of both epithelia at this stage during development (Fig. 3e; DA; p=0.001), consistent with these regions comprising different areas of the same epithelial sheet. Moreover, a comparison of the prepupal wing pouch (dwp1 to dwp16) with the third instar larva wing pouch (dwl1 to dwl15) produced a discriminant graph with two groups, which also overlapped but were better separated (Fig. 3f; DA; p=3.45x10⁻⁵ ). Together these data suggest that the global organization of the wing epithelia change gradually during development and across an epithelial sheet. The GNEO approach provides a way to assess the relatedness of different epithelia through approaches that calculate distances between data points using standard approaches such as hierarchical clustering. Consistent with our observation, a comparison of four epithelial types (Discriminant Analysis and PCA of the Drosophila dwp and dnp and the chick cee and cnt) showed that dwp and dnp forms an overlapping cluster whereas the cee and cnt form separate clusters (Fig. 3g). These observations confirm that the epithelial organisation of the prepupal notum and 2
4 wing are similar whereas the neural tube and embryonic ectoderm are not. Comparison of epithelia from different tissues. While the wing pouch and the notum are closely related, we tested if our approach can separate distantly related epithelia in Drosophila, by comparing the third instar larval wing disc epithelia (dwl) with the eye epithelia (del1 to del5). Unlike the wing disc epithelium, the third instar eye disc contains a gradient of apical constriction induced by myosin II activation 26, 27, leading to apparently different cell shapes and sizes across the epithelial sheet. Discriminant Analysis of the feature vectors clearly demonstrated that the eye and wing disc epithelia are significantly different and that most of the features, except the average clustering coefficient, contribute to this separation (Supplementary Fig. S8; DA; p=1.11x10⁻⁵ ). Natural variation in epithelial organisation. The observation that the network features of the feature vectors were important in discriminating different types of epithelial tissues raised the possibility that local cell packing (resulting from cell shape and distribution) gives rise to the characteristic long-range patterns of an epithelium. In this view, the global organization is a property of the epithelium that emerges from the collective behaviour of the cells. Consistent with this idea, the individual-to-individual variation (measured as coefficient of variation (C.V.), see Fig. 3h and Methods) of mean values of the network features between the different individuals is several fold smaller than that of cell area (Fig. 3h). In addition, the individual-to-individual variation (C.V.) of the mean network features was much smaller than the C.V. of the cell-to-cell variability (i.e., the standard deviation of the features in the feature vector) across individuals. These observations suggest that there is a reproducible long-range epithelial structure, which is, to a large extent, independent of variations in cell size. Comparison of wild-type and genetically perturbed epithelia. What regulates this reproducible long-range organization of epithelia? Several factors have been implicated in controlling the behaviour of individual cells and consequently epithelial architecture 6, 8, 9, 11, However, how global epithelial structure is determined by, for example the effect of the cytoskeleton of the cells within the epithelium is not understood. Therefore, we applied GNEO to quantify objectively the effect in the wing disc of removing myosin II heavy chain using RNAi 28, 29, a genetic manipulation that robustly and uniformly disrupts the cytoskeletal organization and epithelial architecture (see Methods). Both PCA and DA were clearly able to separate wildtype (WT) discs from those in which myosin II had been reduced (Fig. 4a and Supplementary Fig. S9a). Interestingly, while all WT wings formed one distinct tight cluster, the mutant wings were more broadly spread over the graph (Fig. 3a; PCA; p=4.27x10⁻¹⁰ ). This is consistent with a visual inspection of the data, which showed that reducing the levels of myosin II by RNAi knockdown disrupted epithelial organisation to different extents in different wing discs. In order to provide an objective score for the severity of the mutant phenotype, we calculated the Euclidean distance between each mutant wing and the center of mass of the WT wings (Supplementary Table S3). The coefficient of variation of the distances was ~26%, which most likely reflects the variability of the RNAi efficiency among the individuals. Individual mutant samples were between 15 and 35 times further from the center of mass than the average of the distances of the dwp samples (Supplementary Table S3). We then investigated how the inclusion of other epithelia during the comparison affected our analysis of myosin II reduction. Addition of the prepupal notum (dnp) showed that both wildtype epithelia cluster together whereas the mutant wing pouch epithelia were still scattered (Fig. 4b; PCA; p=1.57x10⁻¹³ and Supplementary Fig. S9b; DA; p=1.89x10⁻¹⁸ ). Thus GNEO can objectively recognise that the Drosophila WT samples are similar to each other but distinct from the mutant ones. A PCA that includes the chick embryonic ectoderm and the neural tube, either together or alone, revealed that each group forms distinct clusters (PCA: Fig. 4c; p=2.98x10⁻³¹ ; Fig. 4d; p=3.40x10⁻²² and DA: Supplementary Fig. S9c; p=2.03x10-44 ; Supplementary Fig. S9d; p=1.36x10⁻³⁴ ). This suggests that the Drosophila mutant epithelia are clearly distinct from the WT Drosophila and chick epithelia. Discriminant Analysis indicated that the area, the degree, the degree of neighbours and the standard deviation of the degree are the most important features (Fig. 3a) for obtaining this separation (Supplementary Fig. S9a-d). This is consistent with an effect of myosin II on regulating cell shape 26, 27, 30, 31, whose levels when altered affects cell area, the number of neighbours and the "regularity" of the pattern of cell contacts. The increased variability of the network features when myosin II is knocked down demonstrates an important biological conclusion of this work: long-range constancy of epithelial packing is regulated by cytoskeletal organisation within individual cells. This is also reflected by the higher variation between discs from different individuals in the myosin II knock-down compared to WT discs (Fig. 3h). Together, these data suggest that the long range organization of an epithelium is determined, at least in part, by the cytoskeleton of the cells comprising the tissue affecting 3
5 interactions across the field of cells. Discussion The network-based approach, GNEO, introduced here, captures epithelial organisation by accounting for patterns of cell-contacts which cannot be quantified either by visual inspection or by using geometric features that describe individual cells alone. In particular, GNEO can objectively quantify differences between epithelia from different tissues and organisms, even when the size and shape of the cells comprising these epithelial appear visually indistinguishable. First, we show that epithelia from different organs and species have distinct, reproducible and quantifiable differences in their structure. Second, a surprising result is that differences in cell area play a relatively minor role in distinguishing wing disc and neural tube epithelia two epithelia that come from different species which produce very different tissues. This indicates that there is unexpected consistency in both the average size and range of sizes of cells across epithelia from different species. Third, we provide evidence that the non-geometric features of the epithelia are most informative in distinguishing them. This shows that the topological organization of the epithelium differs strongly between tissues and between species. Together with the finding that the structure of the same epithelia from different individuals is highly reproducible, our analysis indicates an unexpected level of genetic control over the long range organization of epithelia. To the best of our knowledge this has not been previously reported. Lewis s and Aboav-Weaire s laws 23 define relationships between area, degree and neighbour degree, and place the emphasis on the universal connection between these features. By contrast our work examines how measurements of these features across a population of cells can be used to build a quantitative and objective description of an epithelium. The experiment in which we disrupt myosin II provides an indication of the mechanism by which population level features of an epithelium emerge from the collective behaviour of individual cells. Moreover, we provide evidence that GNEO can operate as a reliable classifier to differentiate mutant and WT epithelia, and to quantify precisely the severity of mutant phenotypes. While there are other ways of constructing networks from images of epithelia, this representation of cell-to-cell contacts offers a simple and readily applicable method to analyze epithelia objectively. Representing epithelia as feature vectors opens up the possibility of applying artificial intelligence (e.g., pattern recognition) algorithms to classify them in an objective manner and can be extended to include more sophisticated network features. Since the method is automatable, adaptations of this approach can be used in high-throughput experiments aimed at identifying pathways and quantifying the effects of mutations in functional genomics screens. Of particular value, GNEO allows characterisation of subtle phenotypes undetectable by visual inspection. This approach can also be adapted to other biological samples such as nerve-cell connections, muscle cells attachments, and tumours. Methods Genetic strains and confocal imaging of the epithelia. Flies were grown by employing standard culture techniques. The following lines were used: Arm-GFP (WT), C765-Gal4 ( and U-zip-RNAi (Vienna Drosophila RNAi Center collection). Imaginal discs from the prepupa and third instar larvae were dissected in PBS and fixed with 4% paraformaldehyde in PBS for 35 min. The samples were washed six times for 10 min with PBT (PBS, 0.3% triton) and 3 times for 5 min with PBS. Imaginal discs were mounted using Fluoromount-G (Southern Biotech). Images were taken with a BioRad Radiance 2100 laser scanning confocal microscope. All the images were captured using 63x immersions objective with 3 times zoom and exported as a 1024 x 1024 pixel TIFF file. The area of 1 pixel is 3.78x10⁻³ μm 2. The regions of the imaginal discs that appear in the images were selected with the following criteria: For the prepupal and larval wing disc, images from dorsal compartments (leaving out the D/V boundary region) of the wing pouch region were obtained. The notum images were taken from the anterior part of the disc (see Supplementary Fig. S2). For the eye disc, the images were taken locating the morphogenetic furrow at the side with an additional margin of three to five rows of cells (to include the first and second rows of clusters of photoreceptors). For the chicken images, Hamburger and Hamilton (HH) 32 stage 10 and 17 chick embryos (see Supplementary Fig. S3), were fixed for 1 hour in 4% paraformaldehyde. HH st. 17 embryos were subsequently transferred to methanol then rehydrated. Immunostaining was performed with a ZO1 antibdoy (Zymed labs) and embryos were flat mounted. Images of neural tube epithelium, at intermediate dorsoventral positions, were obtained at the level of somite 5 of HH st. 17 embryos. Embryonic ectoderm was imaged adjacent to the most recently formed somite of HH st. 10 embryos. Imaging conditions were as for imaginal discs, image orientation: anterior, left; dorsal, up. 4
6 Image processing and generation of the epithelial network. The acquired images were converted into their respective 2- pixel BMP files. First, the confocal images were imported using Adobe Photoshop CS2. Colours were inverted to obtain a dark signal over a light background. Epithelial cells were identified from the processed images by using a semi-automated framework. The images first had their illumination corrected through polynomial fitting followed by thresholding, and were then manually checked and edited to remove artefactual connections between cells. The cells and their boundaries were defined using a foreground tracking program 4. Adjacent cells were identified by transforming their images into an epithelial network where the centroid of each cell is represented by a node and the neighborhood relations are mapped into weighted edges (see Supplementary Fig. S1). The methodology involves the following steps: (a) all cells have their borders detected 4, (b) for each pixel p of the border of each cell i, all border pixels belonging to other cells and falling within the circle of radius r centered at p are identified and counted (we use r=6) (c) the node corresponding to this cell is connected to other cells by edges whose weights, w, correspond to the total number of neighboring pixels found during step (b). We established empirically that if the weight is greater than 40% of the minimum equivalent radius of the areas of each adjacent pair of cells, those cells can be considered to be neighbours. The equivalent radius of a cell with area A is defined as corresponding to A / π. We selected an area within every image in order to have all the networks presented with similar boundary conditions. The squares were drawn to obtain the maximum possible surface without including the centroids of the cells in the border of the images. The features of the cells falling within this area were calculated. The cells outside were only used in order to provide neighbors to the cells analyzed in the network. Calculation of geometric and network features. The area was measured by counting the number of pixels inside each cell 4. Each epithelial image was represented as a network where each node corresponds to one of the cells and the links between nodes reflect the spatial adjacency between the epithelial cells (Fig. 1a). Several measurements can be estimated from these networks 24 in order to provide useful characterisation and respective biological interpretations. Let the graph be represented in terms of its adjacency matrix K, such that the presence of a connection between nodes i and j, with 1 i, j N, implies K(i,j) = K(j,i) = 1, with K(i,j) = K(j,i) = 0 being enforced otherwise. In this work, we employed the following topological characteristics: (a) Degree of a node i, which corresponds to the number of edges attached to it, i.e., () N k i = K ( v, i ). (b) Clustering coefficient of a node i, which is obtained by dividing the number of edges between the neighbours of i, represented as n(i), by the maximum possible number of connections between those nodes. This measurement can be calculated as n () () i c i = 2. Therefore, the k( i) ( k( i) 1) clustering coefficient varies from 0 (no interconnections between the neighbours of i) to 1 (the neighbours are fully interconnected). (c) Average degree of the neighbours of a node, calculated as the average of the number of edges that are attached to the neighbours of node i. This measurement can be calculated as () 1 ( ). For every feature, both the b i = () k v k i v= neighbors of i average and standard deviation values across all cells in an epithelium were estimated and were used to characterise epithelial organisation. Cell elongation was initially considered as an independent parameter but was found not to contribute further to the classification and separation. We believe that this is because variations in the elongation tend to affect the degree, clustering coefficient and average degree of neighbours, therefore becoming correlated with those measurements. Feature vector and multivariate statistical analysis. The geometric and network analyses of epithelial images yield a large number of features or measurements (Supplementary Table S1). More precisely, a total of 8 features, corresponding to the mean and standard deviation of the area of cells, as well as the degree, clustering coefficient and average degree of a node are obtained. Thus, for every image of an epithelium, a feature vector of eight dimensions was obtained. We apply an unsupervised and 4, 24, 25 supervised multivariate statistical method, namely Principal Component Analysis (PCA) and Discriminant Analysis (DA) (see Supplementary Methods for explanation). Standardisation 4 of the measurements is performed in order to eliminate the effect of the magnitude of the measurements on the respective separation between categories. More specifically, the average and standard deviation for every feature across all individuals in each of the epithelial type was calculated. For every feature in a feature vector representing an individual epithelium, the calculated average value was subtracted and divided by the standard deviation. Thus, the components of the eigenvectors associated to the largest eigenvalues provide a quantification of the degree of 5 v= 1
7 contribution of each original measurement in maximising the dispersion of the projection (in the case of PCA) and optimising the separation between the categories (in the case of discriminant analysis). Since both these methods output a weighted linear combination of all the features in the feature vector to obtain the final projection (the new axes), the loading values associated to each feature provide a direct measure of the contribution of that particular feature towards the projection onto the smallerdimensional space. For our analysis, the maximum between the magnitudes of the values of the components of each feature (i.e., measurement) of the first two eigenvector (i.e., the loadings associated with the first two component axes) was defined as the weight of that respective measurement. Estimation of statistical significance. The MANOVA (multivariate analysis of variance) test, which is a reference statistical test for probing the hypotheses that two or more populations, characterized in terms of two or more dependent variables, are or not distinct, was used to assess the statistical significance of the obtained separation. The tested (null) hypothesis H0 is that the two samples come from the same population, with H1 indicating different populations. The p-values are calculated in the standard way 33, 34, after PCA or DA. Both PCA and DA provide new random variables that are linear combinations of the previous ones. In the case of PCA, the new variables are completely uncorrelated. In the case of the DA, the method does take into account the known categories of the cells and therefore enhances the separation between the categories. In this case, our interest was focused on the contribution of the measurements on the separation, not on the separation itself. The p-values in this case reflect the effect of the informed cell categories and should be treated as such. The assumptions required for MANOVA were verified even though after application of PCA and DA, as the respective clusters remained largely normal and with similar variances. References 1. Barabasi, A. L. & Oltvai, Z. N. Network biology: understanding the cell's functional organization. Nat Rev Genet 5, (2004). 2. Albert, R. & Barabasi, A.-L. Statistical mechanics of complex networks. Reviews of Modern Physics 74, (2002). 3. Amaral, L. A. N. & Ottino, J. M. Augmenting the framework for the study of complex systems. The European Physical Journal B 38, (2004). 4. Costa, L. D. & Cesar, R. M. J. Shape Analysis and Classification: Theory and Practice (CRC Press, 2000, 2009). 5. Strogatz, S. H. Exploring complex networks. Nature 410, (2001). 6. Lecuit, T. & Le Goff, L. Orchestrating size and shape during morphogenesis. Nature 450, (2007). 7. Axelrod, J. D. Cell shape in proliferating epithelia: a multifaceted problem. Cell 126, (2006). 8. Farhadifar, R., Roper, J. C., Aigouy, B., Eaton, S. & Julicher, F. The influence of cell mechanics, cell-cell interactions, and proliferation on epithelial packing. Curr Biol 17, (2007). 9. Gibson, M. C., Patel, A. B., Nagpal, R. & Perrimon, N. The emergence of geometric order in proliferating metazoan epithelia. Nature 442, (2006). 10. Hayashi, T. & Carthew, R. W. Surface mechanics mediate pattern formation in the developing retina. Nature 431, (2004). 11. Rolland-Lagan, A. G., Bangham, J. A. & Coen, E. Growth dynamics underlying petal shape and asymmetry. Nature 422, (2003). 12. Gho, M., Bellaiche, Y. & Schweisguth, F. Revisiting the Drosophila microchaete lineage: a novel intrinsically asymmetric cell division generates a glial cell. Development 126, (1999). 13. Classen, A. K., Anderson, K. I., Marois, E. & Eaton, S. Hexagonal packing of Drosophila wing epithelial cells by the planar cell polarity pathway. Dev Cell 9, (2005). 14. Martinez-Arias, M. & Stewart, A. Molecular Principles of Animal Development (OUP Oxford, 2002). 15. Patel, A. B., Gibson, W. T., Gibson, M. C. & Nagpal, R. Modeling and inferring cleavage patterns in proliferating epithelia. PLoS Comput Biol 5, e (2009). 16. Cavey, M., Rauzi, M., Lenne, P. F. & Lecuit, T. A two-tiered mechanism for stabilization and immobilization of E- cadherin. Nature 453, (2008). 17. Lecuit, T. & Lenne, P. F. Cell surface mechanics and the control of cell shape, tissue patterns and morphogenesis. Nat Rev Mol Cell Biol 8, (2007). 18. Rauzi, M., Verant, P., Lecuit, T. & Lenne, P. F. Nature and anisotropy of cortical forces orienting Drosophila tissue morphogenesis. Nat Cell Biol 10, (2008). 19. Martin, A. C., Gelbart, M., Fernandez-Gonzalez, R., Kaschube, M. & Wieschaus, E. F. Integration of contractile forces during tissue invagination. J Cell Biol 188, (2010). 20. Martin, A. C., Kaschube, M. & Wieschaus, E. F. Pulsed contractions of an actin-myosin network drive apical constriction. Nature 457, (2009). 21. Ma, D. et al. Cell packing influences planar cell polarity signaling. Proc Natl Acad Sci U S A 105, (2008). 22. Mombach, J. C., de Almeida, R. M. & Iglesias, J. R. Two-cell correlations in biological tissues. Phys Rev E Stat Phys 6
8 Plasmas Fluids Relat Interdiscip Topics 47, (1993). 23. Chiu, S. N. Aboav-Weaire's and Lewis' laws A review. Materials Characterization 34, (1995). 24. Costa, L. D., Rodrigues, F. A., Travieso, G. & Boas, P. R. V. Characterization of complex networks: a survey of measurements. Advances in Physics 56, (2007). 25. Pincus, Z. & Theriot, J. A. Comparison of quantitative methods for cell-shape analysis. J Microsc 227, (2007). 26. Corrigall, D., Walther, R. F., Rodriguez, L., Fichelson, P. & Pichaud, F. Hedgehog signaling is a principal inducer of Myosin-II-driven cell ingression in Drosophila epithelia. Dev Cell 13, (2007). 27. Escudero, L. M., Bischoff, M. & Freeman, M. Myosin II regulates complex cellular arrangement and epithelial architecture in Drosophila. Dev Cell 13, (2007). 28. Brand, A. H. & Perrimon, N. Targeted gene expression as a means of altering cell fates and generating dominant phenotypes. Development 118, (1993). 29. Sharp, P. A. RNA interference Genes Dev 15, (2001). 30. Bertet, C., Sulak, L. & Lecuit, T. Myosin-dependent junction remodelling controls planar cell intercalation and axis elongation. Nature 429, (2004). 31. Pilot, F. & Lecuit, T. Compartmentalized morphogenesis in epithelia: from cell to tissue shape. Dev Dyn 232, (2005). 32. Hamburger, V. & Hamilton., H. L. A series of normal stages in the development of the chick embryo. J. Morphol 88, (1951). 33. Izenman, A. J. Modern Multivariate Statistical Techniques: Regression, Classification, and Manifold Learning (Springer, 2008). 34. Jolliffe, I. T. Principal Component Analysis (Springer, 2010). Acknowledgements The authors acknowledge the MRC for funding and would like to thank A Baonza, A Wuster, A Pombo, C Chothia, E Levy, F Velazquez, G Chalancon, J Casanova, J Gsponer, J Modolell, P Cicuta, S Balaji, S Munro, S Teichmann and T Lecuit for providing helpful comments on this work. MMB acknowledges Darwin College, EMBO YIP and Schlumberger Ltd for support. LME is funded by the Marie Curie and the EMBO fellowships. LdFC is grateful to FAPESP (05/ ), CNPq (301303/06-1) for financial support. Part of this work was performed during a Visiting Scholarship to LDFC from St. Catharine s College, University of Cambridge. JB is supported by the MRC (UK) and AK by a FEBS fellowship. Author contributions MMB and LME designed the study with help from LdFC and MF. LME and AK obtained the fly and chicken images, respectively. LME processed the images. LdFC wrote the software, generated the epithelial network and performed all the comparisons and statistical analysis. All authors participated in the interpretation of results, discussions and the development of the project. LME and MB wrote the manuscript with input from all authors. Additional Information Supplementary Information: The entire pipeline of the steps involved is shown in the Supplementary Fig. S10. Computer programs and source code of the implementation of the algorithms in Scilab are enclosed in the Supplementary Software S1-S5 files. The entire dataset used in our analysis is enclosed as Supplementary Datasets S1-S7. Competing financial interests: The authors declare no competing financial interests. 7
9 Figure Legends Figure 1. GNEO approach and epithelial comparisons performed. (a) Geometric and Network representation of Epithelial Organisation (GNEO) approach to characterise epithelial organisation. (1) Images from the confocal microscope are processed to get a light background with dark cell contours. (2) The processed image is the source for defining individual cells, as well as for determining the number of neighbours for every cell. (3) This information is used to produce an epithelial network where each cell is represented as a node and two nodes are connected if the two cells are neighbours in the epithelium. (4) A region of interest (ROI; shown in a green box) is selected for further analysis and the cells that border the ROI are excluded. (5) The average and standard deviation of area and three network features over all cells in an epithelium are calculated. (6) This information is represented as a feature vector, which is an 8-dimensional vector that characterises each epithelium. Each of the four features considered in this work is abbreviated by the symbols shown in this figure. (b) Schematic representation of the comparisons of epithelia from different sources performed in this study. Images of representative epithelial samples (2-pixel wide cell contour) from Drosophila (different tones of green labels, fly) and chicken (different tones of brown labels) are shown. The reference prepupal wing pouch epithelium is shown within a gray box. The text in gray denotes the relationship between epithelia from the different sources that were compared. space: spatially separated epithelia from the same organism; time: temporally separated epithelia from different stages of development; type: different type of epithelia (e.g., squamous and columnar); species: epithelia from different organisms (vertebrate (chick) and invertebrate (Drosophila)) and mutation: mutant epithelia. Figure 2. Description of features and statistical approaches. Qualitative definition of the geometric and network features and the statistical approaches used (see Methods for more details). Figure 3. Discriminant Analysis of the different epithelia. (a) Colour coded matrix representation of the weights of the features contributing to the observed projection in the Discriminant Analysis of the different comparisons. A higher value (darker color) represents a relatively higher contribution of the feature to the separation. (b-g) Discriminant Analysis graphs of the comparisons of epithelia from different sources. (b) dwp-cnt. (c) cnt-cee. (d) dwp-cnt-cee. (e) dwp-dnp. (f) dwp-dwl. (g) dwp-dnpcnt-cee. Table 1. Coefficient of Variation for the different features. Coefficient of Variation values describing the individual-toindividual variation for the different features in the feature vector. dwp: Wing prepupa, dnp: Notum prepupa, dmwp: mutant Wing prepupa, dwl: Wing larva, cnt: chicken Neural Tube, cee: chicken Embryonic Ectoderm. Figure 4. PCA graphs of the wildtype and mutant epithelia. (a) dwp-dmwp. (b) dwp-dnp-dmwp. (c) dwp-dmwp-cee. (d) dwp-dmwp-cee-cnt. dwp: Wing prepupa, cnt: chicken Neural Tube, cee: chicken Embryonic Ectoderm, dmwp: mutant Wing prepupa. 8


10


11


12
13


14
15 Coefficient of Variation x100 av_a av_d av_c av_n st_a st_d st_c st_n dwp n= dnp n= dwl n= dmwp n= cnt n= cee n=
purpose of this Chapter is to highlight some problems that will likely provide new
 119 Chapter 6 Future Directions Besides our contributions discussed in previous chapters to the problem of developmental pattern formation, this work has also brought new questions that remain unanswered.
Supplementary Materials for
 www.sciencesignaling.org/cgi/content/full/6/301/ra98/dc1 Supplementary Materials for Regulation of Epithelial Morphogenesis by the G Protein Coupled Receptor Mist and Its Ligand Fog Alyssa J. Manning,
Cell biology: Death drags down the neighbourhood
 Cell biology: Death drags down the neighbourhood The MIT Faculty has made this article openly available. Please share how this access benefits you. Your story matters. Citation As Published Publisher Vasquez,
SUPPLEMENTARY INFORMATION
 DOI: 10.1038/ncb3267 Supplementary Figure 1 A group of genes required for formation or orientation of annular F-actin bundles and aecm ridges: RNAi phenotypes and their validation by standard mutations.
Developmental genetics: finding the genes that regulate development
 Developmental Biology BY1101 P. Murphy Lecture 9 Developmental genetics: finding the genes that regulate development Introduction The application of genetic analysis and DNA technology to the study of
Drosophila melanogaster- Morphogen Gradient
 NPTEL Biotechnology - Systems Biology Drosophila melanogaster- Morphogen Gradient Dr. M. Vijayalakshmi School of Chemical and Biotechnology SASTRA University Joint Initiative of IITs and IISc Funded by
Modeling and Inferring Cleavage Patterns in Proliferating Epithelia
 Modeling and Inferring Cleavage Patterns in Proliferating Epithelia The Harvard community has made this article openly available. Please share how this access benefits you. Your story matters Citation
SUPPLEMENTARY INFORMATION
 med!1,2 Wild-type (N2) end!3 elt!2 5 1 15 Time (minutes) 5 1 15 Time (minutes) med!1,2 end!3 5 1 15 Time (minutes) elt!2 5 1 15 Time (minutes) Supplementary Figure 1: Number of med-1,2, end-3, end-1 and
Segment boundary formation in Drosophila embryos
 Segment boundary formation in Drosophila embryos Development 130, August 2003 Camilla W. Larsen, Elizabeth Hirst, Cyrille Alexandre and Jean Paul Vincent 1. Introduction: - Segment boundary formation:
Axis Specification in Drosophila
 Developmental Biology Biology 4361 Axis Specification in Drosophila November 2, 2006 Axis Specification in Drosophila Fertilization Superficial cleavage Gastrulation Drosophila body plan Oocyte formation
Cell biology traditionally identifies proteins based on their individual actions as catalysts, signaling
 Lethality and centrality in protein networks Cell biology traditionally identifies proteins based on their individual actions as catalysts, signaling molecules, or building blocks of cells and microorganisms.
Axis Specification in Drosophila
 Developmental Biology Biology 4361 Axis Specification in Drosophila July 9, 2008 Drosophila Development Overview Fertilization Cleavage Gastrulation Drosophila body plan Oocyte formation Genetic control
Early Development in Invertebrates
 Developmental Biology Biology 4361 Early Development in Invertebrates October 25, 2006 Early Development Overview Cleavage rapid cell divisions divisions of fertilized egg into many cells Gastrulation
Chapter 4 Evaluating a potential interaction between deltex and git in Drosophila: genetic interaction, gene overexpression and cell biology assays.
 Evaluating a potential interaction between deltex and git in Drosophila: genetic interaction, gene overexpression and cell biology assays. The data described in chapter 3 presented evidence that endogenous
178 Part 3.2 SUMMARY INTRODUCTION
 178 Part 3.2 Chapter # DYNAMIC FILTRATION OF VARIABILITY WITHIN EXPRESSION PATTERNS OF ZYGOTIC SEGMENTATION GENES IN DROSOPHILA Surkova S.Yu. *, Samsonova M.G. St. Petersburg State Polytechnical University,
Unicellular: Cells change function in response to a temporal plan, such as the cell cycle.
 Spatial organization is a key difference between unicellular organisms and metazoans Unicellular: Cells change function in response to a temporal plan, such as the cell cycle. Cells differentiate as a
Dual role of myosin II during Drosophila imaginal disc metamorphosis
 Received 13 Jul 2012 Accepted 18 Mar 2013 Published 23 Apr 2013 Dual role of myosin II during Drosophila imaginal disc metamorphosis Silvia Aldaz 1, *, Luis M. Escudero 1, *,w & Matthew Freeman 1,w DOI:
Principal Component Analysis, A Powerful Scoring Technique
 Principal Component Analysis, A Powerful Scoring Technique George C. J. Fernandez, University of Nevada - Reno, Reno NV 89557 ABSTRACT Data mining is a collection of analytical techniques to uncover new
Discriminative Direction for Kernel Classifiers
 Discriminative Direction for Kernel Classifiers Polina Golland Artificial Intelligence Lab Massachusetts Institute of Technology Cambridge, MA 02139 polina@ai.mit.edu Abstract In many scientific and engineering
998 Biophysical Journal Volume 107 August
 998 Biophysical Journal Volume 107 August 2014 998 1010 Article Passive Mechanical Forces Control Cell-Shape Change during Drosophila Ventral Furrow Formation Oleg Polyakov, 1, * Bing He, 2 Michael Swan,
Chapter 18 Lecture. Concepts of Genetics. Tenth Edition. Developmental Genetics
 Chapter 18 Lecture Concepts of Genetics Tenth Edition Developmental Genetics Chapter Contents 18.1 Differentiated States Develop from Coordinated Programs of Gene Expression 18.2 Evolutionary Conservation
Auto-correlation of retinal ganglion cell mosaics shows hexagonal structure
 Supplementary Discussion Auto-correlation of retinal ganglion cell mosaics shows hexagonal structure Wässle and colleagues first observed that the local structure of cell mosaics was approximately hexagonal
Chapter 11. Development: Differentiation and Determination
 KAP Biology Dept Kenyon College Differential gene expression and development Mechanisms of cellular determination Induction Pattern formation Chapter 11. Development: Differentiation and Determination
REQUIREMENTS FOR THE BIOCHEMISTRY MAJOR
 REQUIREMENTS FOR THE BIOCHEMISTRY MAJOR Grade Requirement: All courses required for the Biochemistry major (CH, MATH, PHYS, BI courses) must be graded and passed with a grade of C- or better. Core Chemistry
An introduction to SYSTEMS BIOLOGY
 An introduction to SYSTEMS BIOLOGY Paolo Tieri CNR Consiglio Nazionale delle Ricerche, Rome, Italy 10 February 2015 Universidade Federal de Minas Gerais, Belo Horizonte, Brasil Course outline Day 1: intro
Axis Specification in Drosophila
 Developmental Biology Biology 4361 Axis Specification in Drosophila November 6, 2007 Axis Specification in Drosophila Fertilization Superficial cleavage Gastrulation Drosophila body plan Oocyte formation
On the Mechanism of Wing Size Determination in Fly Development
 On the Mechanism of Wing Size Determination in Fly Development PNAS Paper Authors: Lars Hufnagel, Aurelio A. Teleman, Herve Rouault, Stephen M. Cohen, and Boris I. Shraiman Group Members: Rebekah Starks,
Cells to Tissues. Peter Takizawa Department of Cell Biology
 Cells to Tissues Peter Takizawa Department of Cell Biology From one cell to ensembles of cells. Multicellular organisms require individual cells to work together in functional groups. This means cells
Computational Biology Course Descriptions 12-14
 Computational Biology Course Descriptions 12-14 Course Number and Title INTRODUCTORY COURSES BIO 311C: Introductory Biology I BIO 311D: Introductory Biology II BIO 325: Genetics CH 301: Principles of Chemistry
Conclusions. The experimental studies presented in this thesis provide the first molecular insights
 C h a p t e r 5 Conclusions 5.1 Summary The experimental studies presented in this thesis provide the first molecular insights into the cellular processes of assembly, and aggregation of neural crest and
SUPPLEMENTARY INFORMATION
 Supplementary Discussion Rationale for using maternal ythdf2 -/- mutants as study subject To study the genetic basis of the embryonic developmental delay that we observed, we crossed fish with different
Networks as vectors of their motif frequencies and 2-norm distance as a measure of similarity
 Networks as vectors of their motif frequencies and 2-norm distance as a measure of similarity CS322 Project Writeup Semih Salihoglu Stanford University 353 Serra Street Stanford, CA semih@stanford.edu
REQUIREMENTS FOR THE BIOCHEMISTRY MAJOR
 REQUIREMENTS FOR THE BIOCHEMISTRY MAJOR Grade Requirement: All courses required for the Biochemistry major (CH, MATH, PHYS, BI courses) must be graded and passed with a grade of C- or better. Core Chemistry
hsnim: Hyper Scalable Network Inference Machine for Scale-Free Protein-Protein Interaction Networks Inference
 CS 229 Project Report (TR# MSB2010) Submitted 12/10/2010 hsnim: Hyper Scalable Network Inference Machine for Scale-Free Protein-Protein Interaction Networks Inference Muhammad Shoaib Sehgal Computer Science
The subdivision of proliferating
 EXTRA VIEW Fly 4:3, 241-245; July/August/September 2010; 2010 Landes Bioscience EXTRA VIEW Compartment boundaries Sorting cells with tension Daiki Umetsu and Christian Dahmann* Max Planck Institute of
PRACTICE EXAM. 20 pts: 1. With the aid of a diagram, indicate how initial dorsal-ventral polarity is created in fruit fly and frog embryos.
 PRACTICE EXAM 20 pts: 1. With the aid of a diagram, indicate how initial dorsal-ventral polarity is created in fruit fly and frog embryos. No Low [] Fly Embryo Embryo Non-neural Genes Neuroectoderm Genes
EECS490: Digital Image Processing. Lecture #26
 Lecture #26 Moments; invariant moments Eigenvector, principal component analysis Boundary coding Image primitives Image representation: trees, graphs Object recognition and classes Minimum distance classifiers
Unsupervised Learning Methods
 Structural Health Monitoring Using Statistical Pattern Recognition Unsupervised Learning Methods Keith Worden and Graeme Manson Presented by Keith Worden The Structural Health Monitoring Process 1. Operational
STATISTICS 407 METHODS OF MULTIVARIATE ANALYSIS TOPICS
 STATISTICS 407 METHODS OF MULTIVARIATE ANALYSIS TOPICS Principal Component Analysis (PCA): Reduce the, summarize the sources of variation in the data, transform the data into a new data set where the variables
Midterm 1. Average score: 74.4 Median score: 77
 Midterm 1 Average score: 74.4 Median score: 77 NAME: TA (circle one) Jody Westbrook or Jessica Piel Section (circle one) Tue Wed Thur MCB 141 First Midterm Feb. 21, 2008 Only answer 4 of these 5 problems.
Lecture 8: Organization of Epithelial Tissue
 Computational Biology Group (CoBi), D-BSSE, ETHZ Lecture 8: Organization of Epithelial Tissue Prof Dagmar Iber, PhD DPhil MSc Computational Biology 2015/16 9. November 2018 2 / 103 Contents 1 Organization
arxiv: v1 [cond-mat.stat-mech] 23 Mar 2008
![arxiv: v1 [cond-mat.stat-mech] 23 Mar 2008](/thumbs/90/104455104.jpg "arxiv: v1 [cond-mat.stat-mech] 23 Mar 2008") Entropy Moments Characterization of Statistical Distributions Luciano da Fontoura Costa nstitute of Physics at São Carlos, University of São Paulo, P.O. Box 369, São Carlos, São Paulo, 13560-970 Brazil
Entropy Moments Characterization of Statistical Distributions Luciano da Fontoura Costa nstitute of Physics at São Carlos, University of São Paulo, P.O. Box 369, São Carlos, São Paulo, 13560-970 Brazil
- Class participation (25%) includes attendance for labs, lectures and demos, not falling asleep too much in lectures, and final lab clean-up.!
 includes attendance for labs, lectures and demos, not falling asleep too much in lectures, and final lab clean-up.!") BI 322: Spring 2016 Cell Biology at OIMB: Cell Physiology in the Marine Realm Instructor: George von Dassow Meeting Thursdays 9 5 in the McConnaughey Lab This course covers fundamental topics of cell biology
BI 322: Spring 2016 Cell Biology at OIMB: Cell Physiology in the Marine Realm Instructor: George von Dassow Meeting Thursdays 9 5 in the McConnaughey Lab This course covers fundamental topics of cell biology
Supplementary Materials for
 advances.sciencemag.org/cgi/content/full/2/1/e1500989/dc1 Supplementary Materials for An epidermis-driven mechanism positions and scales stem cell niches in plants Jérémy Gruel, Benoit Landrein, Paul Tarr,
Neural development its all connected
 Neural development its all connected How do you build a complex nervous system? How do you build a complex nervous system? 1. Learn how tissue is instructed to become nervous system. Neural induction 2.
Types of biological networks. I. Intra-cellurar networks
 Types of biological networks I. Intra-cellurar networks 1 Some intra-cellular networks: 1. Metabolic networks 2. Transcriptional regulation networks 3. Cell signalling networks 4. Protein-protein interaction
Bioinformatics 2. Yeast two hybrid. Proteomics. Proteomics
 GENOME Bioinformatics 2 Proteomics protein-gene PROTEOME protein-protein METABOLISM Slide from http://www.nd.edu/~networks/ Citrate Cycle Bio-chemical reactions What is it? Proteomics Reveal protein Protein
7.013 Problem Set
 7.013 Problem Set 5-2013 Question 1 During a summer hike you suddenly spot a huge grizzly bear. This emergency situation triggers a fight or flight response through a signaling pathway as shown below.
Enduring understanding 1.A: Change in the genetic makeup of a population over time is evolution.
 The AP Biology course is designed to enable you to develop advanced inquiry and reasoning skills, such as designing a plan for collecting data, analyzing data, applying mathematical routines, and connecting
Establishing positional information through gradient dynamics
 Extra view Fly 4:4, 273-277; October/November/December 2010; 2010 Landes Bioscience Extra view Establishing positional information through gradient dynamics A lesson from the Hedgehog signaling pathway
Big Idea 1: The process of evolution drives the diversity and unity of life.
 Big Idea 1: The process of evolution drives the diversity and unity of life. understanding 1.A: Change in the genetic makeup of a population over time is evolution. 1.A.1: Natural selection is a major
Evolution of Genotype-Phenotype mapping in a von Neumann Self-reproduction within the Platform of Tierra
 Evolution of Genotype-Phenotype mapping in a von Neumann Self-reproduction within the Platform of Tierra Declan Baugh and Barry Mc Mullin The Rince Institute, Dublin City University, Ireland declan.baugh2@mail.dcu.ie,
Network Biology: Understanding the cell s functional organization. Albert-László Barabási Zoltán N. Oltvai
 Network Biology: Understanding the cell s functional organization Albert-László Barabási Zoltán N. Oltvai Outline: Evolutionary origin of scale-free networks Motifs, modules and hierarchical networks Network
Supplementary Figure 1. Real time in vivo imaging of SG secretion. (a) SGs from Drosophila third instar larvae that express Sgs3-GFP (green) and
 SGs from Drosophila third instar larvae that express Sgs3-GFP (green) and") Supplementary Figure 1. Real time in vivo imaging of SG secretion. (a) SGs from Drosophila third instar larvae that express Sgs3-GFP (green) and Lifeact-Ruby (red) were imaged in vivo to visualize secretion
Supplementary Figure 1. Real time in vivo imaging of SG secretion. (a) SGs from Drosophila third instar larvae that express Sgs3-GFP (green) and Lifeact-Ruby (red) were imaged in vivo to visualize secretion
Drosophila Life Cycle
 Drosophila Life Cycle 1 Early Drosophila Cleavage Nuclei migrate to periphery after 10 nuclear divisions. Cellularization occurs when plasma membrane folds in to divide nuclei into cells. Drosophila Superficial
AP Curriculum Framework with Learning Objectives
 Big Ideas Big Idea 1: The process of evolution drives the diversity and unity of life. AP Curriculum Framework with Learning Objectives Understanding 1.A: Change in the genetic makeup of a population over
9/4/2015 INDUCTION CHAPTER 1. Neurons are similar across phyla Thus, many different model systems are used in developmental neurobiology. Fig 1.
 INDUCTION CHAPTER 1 Neurons are similar across phyla Thus, many different model systems are used in developmental neurobiology Fig 1.1 1 EVOLUTION OF METAZOAN BRAINS GASTRULATION MAKING THE 3 RD GERM LAYER
18.4 Embryonic development involves cell division, cell differentiation, and morphogenesis
 18.4 Embryonic development involves cell division, cell differentiation, and morphogenesis An organism arises from a fertilized egg cell as the result of three interrelated processes: cell division, cell
A A A A B B1
 LEARNING OBJECTIVES FOR EACH BIG IDEA WITH ASSOCIATED SCIENCE PRACTICES AND ESSENTIAL KNOWLEDGE Learning Objectives will be the target for AP Biology exam questions Learning Objectives Sci Prac Es Knowl
EXAM PRACTICE. 12 questions * 4 categories: Statistics Background Multivariate Statistics Interpret True / False
 EXAM PRACTICE 12 questions * 4 categories: Statistics Background Multivariate Statistics Interpret True / False Stats 1: What is a Hypothesis? A testable assertion about how the world works Hypothesis
MULTIVARIATE PATTERN RECOGNITION FOR CHEMOMETRICS. Richard Brereton
 MULTIVARIATE PATTERN RECOGNITION FOR CHEMOMETRICS Richard Brereton r.g.brereton@bris.ac.uk Pattern Recognition Book Chemometrics for Pattern Recognition, Wiley, 2009 Pattern Recognition Pattern Recognition
Introduction. Spatial Multi-Agent Systems. The Need for a Theory
 Introduction Spatial Multi-Agent Systems A spatial multi-agent system is a decentralized system composed of numerous identically programmed agents that either form or are embedded in a geometric space.
DEGseq: an R package for identifying differentially expressed genes from RNA-seq data
 DEGseq: an R package for identifying differentially expressed genes from RNA-seq data Likun Wang Zhixing Feng i Wang iaowo Wang * and uegong Zhang * MOE Key Laboratory of Bioinformatics and Bioinformatics
Focus was on solving matrix inversion problems Now we look at other properties of matrices Useful when A represents a transformations.
 Previously Focus was on solving matrix inversion problems Now we look at other properties of matrices Useful when A represents a transformations y = Ax Or A simply represents data Notion of eigenvectors,
Subcellular Localisation of Proteins in Living Cells Using a Genetic Algorithm and an Incremental Neural Network
 Subcellular Localisation of Proteins in Living Cells Using a Genetic Algorithm and an Incremental Neural Network Marko Tscherepanow and Franz Kummert Applied Computer Science, Faculty of Technology, Bielefeld
Analysis of Interest Rate Curves Clustering Using Self-Organising Maps
 Analysis of Interest Rate Curves Clustering Using Self-Organising Maps M. Kanevski (1), V. Timonin (1), A. Pozdnoukhov(1), M. Maignan (1,2) (1) Institute of Geomatics and Analysis of Risk (IGAR), University
10/2/2015. Chapter 4. Determination and Differentiation. Neuroanatomical Diversity
 Chapter 4 Determination and Differentiation Neuroanatomical Diversity 1 Neurochemical diversity: another important aspect of neuronal fate Neurotransmitters and their receptors Excitatory Glutamate Acetylcholine
Proteomics. Yeast two hybrid. Proteomics - PAGE techniques. Data obtained. What is it?
 Proteomics What is it? Reveal protein interactions Protein profiling in a sample Yeast two hybrid screening High throughput 2D PAGE Automatic analysis of 2D Page Yeast two hybrid Use two mating strains
Supplementary Materials for
 www.sciencemag.org/cgi/content/full/science.1244624/dc1 Supplementary Materials for Cytoneme-Mediated Contact-Dependent Transport of the Drosophila Decapentaplegic Signaling Protein Sougata Roy, Hai Huang,
Statistical Pattern Recognition
 Statistical Pattern Recognition Feature Extraction Hamid R. Rabiee Jafar Muhammadi, Alireza Ghasemi, Payam Siyari Spring 2014 http://ce.sharif.edu/courses/92-93/2/ce725-2/ Agenda Dimensionality Reduction
MOLECULAR CONTROL OF EMBRYONIC PATTERN FORMATION
 MOLECULAR CONTROL OF EMBRYONIC PATTERN FORMATION Drosophila is the best understood of all developmental systems, especially at the genetic level, and although it is an invertebrate it has had an enormous
SPOTTED cdna MICROARRAYS
 SPOTTED cdna MICROARRAYS Spot size: 50um - 150um SPOTTED cdna MICROARRAYS Compare the genetic expression in two samples of cells PRINT cdna from one gene on each spot SAMPLES cdna labelled red/green e.g.
Why Flies? stages of embryogenesis. The Fly in History
 The Fly in History 1859 Darwin 1866 Mendel c. 1890 Driesch, Roux (experimental embryology) 1900 rediscovery of Mendel (birth of genetics) 1910 first mutant (white) (Morgan) 1913 first genetic map (Sturtevant
Table of Contents. Multivariate methods. Introduction II. Introduction I
 Table of Contents Introduction Antti Penttilä Department of Physics University of Helsinki Exactum summer school, 04 Construction of multinormal distribution Test of multinormality with 3 Interpretation
Evidence for dynamically organized modularity in the yeast protein-protein interaction network
 Evidence for dynamically organized modularity in the yeast protein-protein interaction network Sari Bombino Helsinki 27.3.2007 UNIVERSITY OF HELSINKI Department of Computer Science Seminar on Computational
Principal Component Analysis vs. Independent Component Analysis for Damage Detection
 6th European Workshop on Structural Health Monitoring - Fr..D.4 Principal Component Analysis vs. Independent Component Analysis for Damage Detection D. A. TIBADUIZA, L. E. MUJICA, M. ANAYA, J. RODELLAR
SUPPLEMENTARY INFORMATION
 SUPPLEMENTARY INFORMATION doi:10.1038/nature12791 Supplementary Figure 1 (1/3) WWW.NATURE.COM/NATURE 1 RESEARCH SUPPLEMENTARY INFORMATION Supplementary Figure 1 (2/3) 2 WWW.NATURE.COM/NATURE SUPPLEMENTARY
Data Mining. Dimensionality reduction. Hamid Beigy. Sharif University of Technology. Fall 1395
 Data Mining Dimensionality reduction Hamid Beigy Sharif University of Technology Fall 1395 Hamid Beigy (Sharif University of Technology) Data Mining Fall 1395 1 / 42 Outline 1 Introduction 2 Feature selection
The Imperatives of Context and Contour for Morphogen Dispersion
 2252 Biophysical Journal Volume 103 December 2012 2252 2256 The Imperatives of Context and Contour for Morphogen Dispersion Thomas B. Kornberg* Cardiovascular Research Institute, University of California,
GEOG 4110/5100 Advanced Remote Sensing Lecture 12. Classification (Supervised and Unsupervised) Richards: 6.1, ,
 Richards: 6.1, ,") GEOG 4110/5100 Advanced Remote Sensing Lecture 12 Classification (Supervised and Unsupervised) Richards: 6.1, 8.1-8.8.2, 9.1-9.34 GEOG 4110/5100 1 Fourier Transforms Transformations in the Frequency Domain
GEOG 4110/5100 Advanced Remote Sensing Lecture 12 Classification (Supervised and Unsupervised) Richards: 6.1, 8.1-8.8.2, 9.1-9.34 GEOG 4110/5100 1 Fourier Transforms Transformations in the Frequency Domain
Single-Trial Neural Correlates. of Arm Movement Preparation. Neuron, Volume 71. Supplemental Information
 Neuron, Volume 71 Supplemental Information Single-Trial Neural Correlates of Arm Movement Preparation Afsheen Afshar, Gopal Santhanam, Byron M. Yu, Stephen I. Ryu, Maneesh Sahani, and K rishna V. Shenoy
Graph Alignment and Biological Networks
 Graph Alignment and Biological Networks Johannes Berg http://www.uni-koeln.de/ berg Institute for Theoretical Physics University of Cologne Germany p.1/12 Networks in molecular biology New large-scale
Course plan Academic Year Qualification MSc on Bioinformatics for Health Sciences. Subject name: Computational Systems Biology Code: 30180
 Course plan 201-201 Academic Year Qualification MSc on Bioinformatics for Health Sciences 1. Description of the subject Subject name: Code: 30180 Total credits: 5 Workload: 125 hours Year: 1st Term: 3
Network diffusion-based analysis of high-throughput data for the detection of differentially enriched modules
 Network diffusion-based analysis of high-throughput data for the detection of differentially enriched modules Matteo Bersanelli 1+, Ettore Mosca 2+, Daniel Remondini 1, Gastone Castellani 1 and Luciano
THE ROLE OF COMPUTER BASED TECHNOLOGY IN DEVELOPING UNDERSTANDING OF THE CONCEPT OF SAMPLING DISTRIBUTION
 THE ROLE OF COMPUTER BASED TECHNOLOGY IN DEVELOPING UNDERSTANDING OF THE CONCEPT OF SAMPLING DISTRIBUTION Kay Lipson Swinburne University of Technology Australia Traditionally, the concept of sampling
Non-independence in Statistical Tests for Discrete Cross-species Data
 J. theor. Biol. (1997) 188, 507514 Non-independence in Statistical Tests for Discrete Cross-species Data ALAN GRAFEN* AND MARK RIDLEY * St. John s College, Oxford OX1 3JP, and the Department of Zoology,
Use of Agilent Feature Extraction Software (v8.1) QC Report to Evaluate Microarray Performance
 QC Report to Evaluate Microarray Performance") Use of Agilent Feature Extraction Software (v8.1) QC Report to Evaluate Microarray Performance Anthea Dokidis Glenda Delenstarr Abstract The performance of the Agilent microarray system can now be evaluated
Use of Agilent Feature Extraction Software (v8.1) QC Report to Evaluate Microarray Performance Anthea Dokidis Glenda Delenstarr Abstract The performance of the Agilent microarray system can now be evaluated
Developmental Biology 3230 Midterm Exam 1 March 2006
 Name Developmental Biology 3230 Midterm Exam 1 March 2006 1. (20pts) Regeneration occurs to some degree to most metazoans. When you remove the head of a hydra a new one regenerates. Graph the inhibitor
MINISYMPOSIUM LOGICAL MODELLING OF (MULTI)CELLULAR NETWORKS
CELLULAR NETWORKS") Friday, July 27th, 11:00 MINISYMPOSIUM LOGICAL MODELLING OF (MULTI)CELLULAR NETWORKS Organizer Pedro T. Monteiro INESC-ID/IST - Univ. de Lisboa 1000-029 Lisboa, PT Pedro.Tiago.Monteiro@tecnico.ulisboa.pt
Friday, July 27th, 11:00 MINISYMPOSIUM LOGICAL MODELLING OF (MULTI)CELLULAR NETWORKS Organizer Pedro T. Monteiro INESC-ID/IST - Univ. de Lisboa 1000-029 Lisboa, PT Pedro.Tiago.Monteiro@tecnico.ulisboa.pt
Interplay between the Dividing Cell and Its Neighbors Regulates Adherens Junction Formation during Cytokinesis in Epithelial Tissue
 Article Interplay between the Dividing Cell and Its Neighbors Regulates Adherens Junction Formation during Cytokinesis in Epithelial Tissue Sophie Herszterg, 1 Andrea Leibfried, 1,2 Floris Bosveld, 1 Charlotte
STA 414/2104: Lecture 8
 STA 414/2104: Lecture 8 6-7 March 2017: Continuous Latent Variable Models, Neural networks With thanks to Russ Salakhutdinov, Jimmy Ba and others Outline Continuous latent variable models Background PCA
Myoelectrical signal classification based on S transform and two-directional 2DPCA
 Myoelectrical signal classification based on S transform and two-directional 2DPCA Hong-Bo Xie1 * and Hui Liu2 1 ARC Centre of Excellence for Mathematical and Statistical Frontiers Queensland University
Comparing transcription factor regulatory networks of human cell types. The Protein Network Workshop June 8 12, 2015
 Comparing transcription factor regulatory networks of human cell types The Protein Network Workshop June 8 12, 2015 KWOK-PUI CHOI Dept of Statistics & Applied Probability, Dept of Mathematics, NUS OUTLINE
Developmental processes Differential gene expression Introduction to determination The model organisms used to study developmental processes
 Date Title Topic(s) Learning Outcomes: Sept 28 Oct 3 1. What is developmental biology and why should we care? 2. What is so special about stem cells and gametes? Developmental processes Differential gene
arxiv: v1 [q-bio.to] 16 Jul 2012
![arxiv: v1 [q-bio.to] 16 Jul 2012](/thumbs/78/78275400.jpg "arxiv: v1 [q-bio.to] 16 Jul 2012") How to Grow an Organism Inside-Out: Evolution of an internal skeleton from an external skeleton in bilateral organisms arxiv:1207.3624v1 [q-bio.to] 16 Jul 2012 Eric Werner University of Oxford Department
How to Grow an Organism Inside-Out: Evolution of an internal skeleton from an external skeleton in bilateral organisms arxiv:1207.3624v1 [q-bio.to] 16 Jul 2012 Eric Werner University of Oxford Department
Computational Genomics. Systems biology. Putting it together: Data integration using graphical models
 02-710 Computational Genomics Systems biology Putting it together: Data integration using graphical models High throughput data So far in this class we discussed several different types of high throughput
Dimensionality Reduction Using PCA/LDA. Hongyu Li School of Software Engineering TongJi University Fall, 2014
 Dimensionality Reduction Using PCA/LDA Hongyu Li School of Software Engineering TongJi University Fall, 2014 Dimensionality Reduction One approach to deal with high dimensional data is by reducing their
Lecture 7. Development of the Fruit Fly Drosophila
 BIOLOGY 205/SECTION 7 DEVELOPMENT- LILJEGREN Lecture 7 Development of the Fruit Fly Drosophila 1. The fruit fly- a highly successful, specialized organism a. Quick life cycle includes three larval stages
Introduction to differentiation waves Part 2. The evo-devo of epigenetic landscapes as differentiation trees
 Introduction to differentiation waves Part 2. The evo-devo of epigenetic landscapes as differentiation trees Richard Gordon, Theoretical Biologist Embryogenesis Center Gulf Specimen Marine Laboratory 222
Glossary. The ISI glossary of statistical terms provides definitions in a number of different languages:
 Glossary The ISI glossary of statistical terms provides definitions in a number of different languages: http://isi.cbs.nl/glossary/index.htm Adjusted r 2 Adjusted R squared measures the proportion of the