Supplementary data published online for the paper entitled:
|
|
|
- Luke Sullivan
- 5 years ago
- Views:
Transcription
1 Supplementary data published online for the paper entitled: Responses of Future Air Quality to Emission Controls over North Carolina, Part I: Model Evaluation for Current-Year Simulations Xiao-Huan Liu 1, 2, Yang Zhang 1,*, Kristen M. Olsen 1, Wen-Xing Wang 2, Bebhinn A. Do 3, and George M. Bridgers 3 1 Department of Marine, Earth, and Atmospheric Sciences, North Carolina State University, Raleigh, NC 27695, USA 2 Environment Research Institute, Shandong University, 27 Shanda Nanlu, Jinan, Shandong Province, P.R China Division of Air Quality, North Carolina Department of Environment and Natural Resources, Raleigh, NC 27699, USA 1. Description of actual and typical emissions used in model simulations The 2002 actual emission inventories were developed base on the U.S. EPA s 1999 National Emission Inventory (NEI), Version 2 Final (NEI99V2) and recent updates from VISTAS/ASIP states. The 2002 typical emission inventories were developed to avoid anomalies in emissions due to variability in economic, meteorology, and outage factors in The differences between 2002 actual and typical emission inventories are the fire and EGUs emissions. While actual emission scenarios used 2002 day-specific fire emissions and continuous emissions monitoring data for EGUs, the 2002 typical EGUs and fire emissions were based on the average to avoid atypical EGU outages and fire activities in 2002 (Morris et al., 2007; Barnard and Sabo, 2008). Projected emissions were generated for each source category to account for control scenarios under the promulgated and proposed control programs at the national, state, and local levels. In 2009 and 2018, the projected emission reductions from their levels in 2002 in NC are 19.7% and 32.6% for carbon monoxide (CO), 35.4% and 56.2% for nitrogen oxide (NO x ), 46.3% and 68.0% for sulfur dioxide (SO 2 ), and 24.8% and 35.1% for volatile organic compounds (VOCs), respectively. 2. Locations and names of observational sites within the modeling domain Figures S-1 to S-4 show the locations of sites for meteorological, O 3, PM 2.5, and wet deposition measurements within the modeling domain. Tables S-1 to S-4 provide the full names and coordinates of these sites. Figure S-5 shows the three physiographic regions in North Carolina. * Corresponding author. Yang Zhang, Tel: ; fax: address: yang_zhang@ncsu.edu 1
2 Figure S-1. The locations of meteorological measurement sites in the networks of CASTNET (top) and SCO (bottom). See the full names of all sites in Table S-1. Figure S-2. The locations of O 3 measurement sites in the networks of CASTNET and AIRS- AQS. See the full names of all sites in Table S-2. 2
 are also the sites for visibility measurements. See the full names of all sites in Table S-3. Figure S-4.")
3 Figure S-3. The locations of sites for PM 2.5 and its component measurements in the networks of AIRS-AQS, CASTNET, and IMPROVE. Note that the STN sites are included as part of the AIRS-AQS. Note that the four IMPROVE sites (GRSM1, LIGO1, SHRO1, SWAN1) are also the sites for visibility measurements. See the full names of all sites in Table S-3. Figure S-4. The locations of wet deposition measurement sites in the NADP network. See the full names of all sites in Table S-4. Figure S-5. The three physiographic regions in North Carolina. 3
4 Table S-1. The meteorological measurement sites from CASTNET and SCO. CASTNET Meteorological Sites No. Site Code Full Name Site Coordinate 1 PNF126 Cranberry ( , ) 2 BFT142 Beaufort ( , ) 3 COW137 Coweeta ( , ) 4 SPD111 Speedwell (36.47, ) 5 VPI120 Horton Station ( , ) 6 GRS420 Great Smoky NP Look Rock (35.631, ) 7 CND125 Candor ( , ) SCO Meteorological Sites No. Site Code Full Name Site Coordinate 1 KAKH Gastonia Municipal Airport (35.2, ) 2 KAVL Asheville Regional Airport ( , ) 3 KBCB Blacksburg (37.22, ) 4 KCLT Douglas International Airport ( , ) 5 KDPL Duplin County (35, ) 6 KEQY Monroe ( , ) 7 KEWN Mount Mitchell State Park ( , ) 8 KEXX Davidson County (35.78, -80.3) 9 KFAY Fayetteville (35, ) 10 KFBG Simmons Army Airfield (35, ) 11 KFQD Rutherford County (35.43, ) 12 KGSB Seymour Johnson ( , ) 13 KGSO Greensboro ( , ) 14 KGWW Goldsboro-Wayne Municipal (33.5, ) 15 KHBI Asheboro Municipal (35.66, -79.9) 16 KHFF Mackall U.S. Army Airfield ( , ) 17 KHKY Hickory (35.75, ) 18 KHRJ Harnett County (35.38, ) 19 KIGX Chapel Hill-Williams (35.935, ) 20 KINT Smith Reynolds ( , ) 21 KIPJ Lincoln County (35.48, ) 22 KISO Stallings AFB ( , ) 23 KJNX Johnston County (35.54, ) 24 KJQF Sampson County (35.38, ) 25 KLBT Lumberton Municipal (34.6, ) 26 KMEB Laurinburg-Maxton ( , ) 27 KMRH Beaufort Smith Field ( , KMRN Morganton / Lenoir (35.82, ) 29 KMWK Surry County (36.46, ) 30 KNKT Cherry Point MCAS (34.85, ) 31 KOAJ Albert Ellis ( , ) 32 KOQT Memphis International Ap (36.02, ) 33 KPGV Pitt / Greenville (35.63, -77.4) 34 KPOB Pope AFB (40.92, ) 35 KPSK Dublin/New River Valley (37.13, ) 36 KRDU Raleigh-Durham ( , ) 37 KRHP Andrews-Murphy ( , ) 38 KSOP Moore County (35.23, -79.4) 39 KSVH Statesville Municipal (35.76, ) 40 KTNB Boone-Watauga Hospital (36.2, ) 41 KTYS Hatteras Weather Service Office ( , ) 42 KUZA Rock Hill-York County (34.98, ) 43 KVUJ Stanly County Airport (35.42, ) 4
5 Table S-2. The O 3 measurement sites from CASTNET and AIRS-AQS. CASTNET O 3 Sites No. Site Code Full Name Site Coordinate 1 PNF126 Cranberry ( , ) 2 BFT142 Beaufort ( , ) 3 COW137 Coweeta ( , ) 4 SPD111 Speedwell (36.47, ) 5 VPI120 Horton Station ( , ) 6 GRS420 Great Smoky NP Look Rock (35.631, ) 7 CND125 Candor ( , ) AIRS-AQS O 3 Sites No. Short Site Code * Full Site Code * Site Coordinate 1 A (34.785, ) 2 A ( , ) 3 A ( , ) 4 A ( , ) 5 A ( , ) 6 A ( , ) 7 A ( , ) 8 A (35.5,-82.6) 9 A ( , ) 10 A ( , ) 11 A (36.307, ) 12 A ( , ) 13 A ( , ) 14 A ( , ) 15 A ( , ) 16 A ( , ) 17 A ( , ) 18 A ( , ) 19 A ( , ) 20 A ( , ) 21 A ( , ) 22 A ( , ) 23 A ( , ) 24 A ( , ) 25 A ( , ) 26 A ( , ) 27 A ( , ) 28 A ( , ) 29 A (35.59, ) 30 A ( , ) 31 A ( , ) 32 A ( , ) 33 A ( , ) 34 A ( , ) 35 A ( , ) 36 A ( , ) 37 A (36.307, ) 38 A ( ,-77.62) 39 A ( , ) 40 A ( , ) 5
6 AIRS-AQS O 3 Sites (continued) No. Short Site Code * Full Site Code * Site Coordinate 41 A ( , ) 42 A ( , ) 43 A ( , ) 44 A ( , ) 45 A ( , ) 46 A ( , ) 47 A ( , ) 48 A (35.79, ) 49 A ( , ) 50 A ( , ) 51 A (34.775, ) 52 A ( , ) 53 A ( , ) 54 A ( , ) 55 A (34.805, ) 56 A ( , ) 57 A ( , ) 58 A ( , ) 59 A (35.965, ) 60 A ( , ) 61 A ( , ) 62 A ( , ) 63 A ( ,-85.17) 64 A ( , ) 65 A ( , ) 66 A ( , ) 67 A ( , ) 68 A ( , ) 69 A ( , ) 70 A ( , ) 71 A ( , ) 72 A ( , ) 73 A ( , ) * The O 3 sites in the AIRS-AQS network are given as 9-digit site codes such as No full site names are provided. The short site codes such as A1 are used in the map, as the full site codes are too long to be included in the site map. Table S-3. The sites for PM 2.5 and its component measurements from AIRS-AQS, CASTNET, and IMPROVE. AIRS-AQS PM 2.5 Sites No. Short Site Code * Full Site Code * Site Coordinate 1 AA (35.041, ) 2 AA (36.111, ) 3 AA (36.109, ) 4 AA (34.364, ) 5 AA (35.436, ) 6 AA (35.856, ) 7 AA (35.981, ) 8 AA (35.631, ) * The PM 2.5 sites in the AIRS-AQS network are given as 9-digit site codes such as No full site names are provided. The short site codes such as AA1 are used in the map to be consistent with the AIRS-AQS site map for O 3. 6
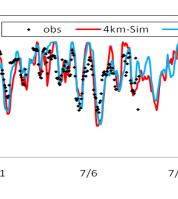
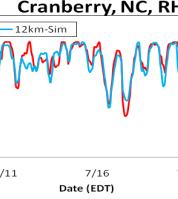
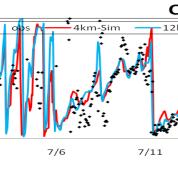
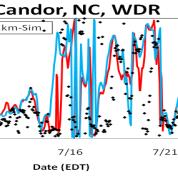
7 CASTNET Speciated PM 2.5 Sites * No. Site Code Full Name Site Coordinate 1 PNF126 Cranberry ( , ) 2 BFT142 Beaufort ( , ) 3 COW137 Coweeta ( , ) 4 SPD111 Speedwell (36.47, ) 5 VPI120 Horton Station ( , ) 6 GRS420 Great Smoky NP Look Rock (35.631, ) 7 CND125 Candor ( , ) * CASTNET speciated PM 2.5 include sulfate, nitrate, and ammonium. IMPROVE PM 2.5 and Visibility Sites No. Site Code Full Name Site Coordinate 1 GRSM1 Great Smoky Mountains ( , ) 2 LIGO1 Linville Gorge ( , ) 3 SHRO1 Shining Rock WA ( , ) 4 SWAN1 Swanquarter ( , ) Table S-4. The locations of wet deposition measurement sites in the NADP network. No. Site Code Full Name Site Coordinate 1 KY22 Lilley Cornett Woods ( , ) 2 NC03 Lewiston ( , ) 3 NC06 Beaufort ( , ) 4 NC25 Coweeta ( , ) 5 NC29 Hofmann Forest ( , ) 6 NC34 Piedmont Research Station (35.697, ) 7 NC35 Clinton Crops Research Station ( , ) 8 NC36 Jordan Creek ( , ) 9 NC41 Finley Farm ( , ) 10 NC45 Mt. Mitchell ( , ) 11 TN00 Walker Branch Watershed ( , ) 12 TN04 Speedwell ( , ) 13 TN11 Great Smoky Mountains ( , ) National Park-ElkmonT 14 VA13 Horton's Station ( , ) 3. Evaluation of meteorological predictions Figures S-6 and S-7 in the supplementary data show spatial distributions of simulated monthly-mean T1.5, RH1.5, WSP10, and WDR10, and hourly precipitation with observations overlaid in January and July, respectively, The analysis of these figures is provided in the main text of the paper. Figure S-8 shows temporal variations of simulated T1.5, RH1.5, WSP10, and WDR10 from 4-km and 12-km simulations and the observations at one SCO site (i.e., the Raleigh-Durham 7
8 Airport site) and four CASTNET sites (i.e., Cranberry, Beaufort, Speedwell, and Candor). Beaufort is a coastal site, Cranberry is a mountain site with an elevation of 1219 m, Speedwell is a rural site located at the west side of Appalachian Mountains, and Candor and Raleigh-Durham Airport are located in the Piedmont area, representing urban and rural areas, respectively. MM5 at 12-km captures the temporal variations and magnitudes of T1.5 on most days in both months, although cold biases mostly occur during daytime. The heavy snow that occurred in NC during 2-4 January started to melt on 5 January and completely disappeared after 9 January. While the simulated temporal variations of T1.5 at 4-km are consistent with those at 12-km at all sites except for Candor and Raleigh, it gives a snow cover persistently presented during 8-12 January over the central NC, resulting in significantly lower T1.5 values than those observed and from the 12-km simulations at Candor and Raleigh. This may indicate some limitations of the snow melting treatment in the MM5/PX-LSM that gives a slower snow melt, resulting in higher snow cover and lower temperature and precipitation over this particular region at 4-km. As indicated in Gilliam et al. (2007), due to limited snow and surface energy balance representation, PX-LSM does not perform as well as other LSMs over snow surfaces such as the NOAH LSM, with the latter still having some limitations such as a faster snow melt, as compared with other LSMs with more sophisticated snow physics. Such a limitation at 4-km also indicates a need for more sophisticated snow representations with a more realistic snow pack evolution, sub-grid scale variability, vegetation interactions, and blowing snow to improve current model capability in simulating snow. At the two mountain sites (i.e., Cranberry and Speedwell), the 4-km simulation gives better agreement with observed T1.5 than the 12-km simulation during 8-12 January, indicating less accurate the snow melt/pack treatments over the mountain regions at 12-km. MM5 generally captures RH1.5 variations with similar temporal variation trends at 4- and 12-km (except for 8-12 January at Candor and Raleigh due to abnormal T1.5 predictions). Some underpredictions occur at both grid 8
9 resolutions at most sites during some days in January and most days in July. WSP10 is overpredicted on most days at most sites in both months, especially in the coastal plain and mountain areas. The 12-km simulation gives slightly better results than 4-km at Cranberry in both months. The time variations of WDR10 are captured during most time periods at most sites. Large discrepancies exist at Speedwell where WDR10 may be affected by the orographic weather in the Appalachian Mountains, which is difficult to simulate. The seemingly large discrepancies between simulated and observed WDR10 at Cranberry on some days (e.g., 4, 6-10, 11, 13, 15, 17, 21, 25 January) indicate the limitation of time series plots in representing a vector WDR10, as they are indeed much smaller in magnitude in the wind rose plots. Simulated WDR10 values at 4- and 12-km at the five sites are fairly consistent in January. Slightly large differences exist in July, especially at Cranberry during 1-6 July. 4. Evaluation of chemical predictions Figures S-9 and S-10 show the simulated monthly-mean 24-h average concentrations of PM 2.5 composition in January and July The detailed analysis is provided in the main text. Figure S-11 compares dry deposition amounts of SO 2, HNO 3, NH + 4, SO , and NO 3 simulated by CMAQ with those estimated by MLM in July 2002 at two sites: Beaufort (BFT) and Coweeta (COW), NC. While both models give comparable dry deposition amounts of HNO 3 and SO 2 at the coastal site BFT where the terrain is flat and agriculture is the primary land use, large differences exist at COW where the terrain is complex and forest is the dominant land use, indicating the challenges and uncertainties in simulated dry deposition over complex terrain. Such large differences are mainly due to differences in V d used in both models, e.g., the V d values used in MLM are 2-3 orders of magnitude lower for SO 2 and 2-4 orders of magnitude lower for HNO 3 than those used in CMAQ (figures not shown), consistent with the differences in the dry deposition amounts. MLM gives higher dry deposition amounts than CMAQ at both sites, with the largest 9
10 differences (by up to 7 orders of magnitudes) in that of NO - 3, indicating a large variability in the V d of NO - 3 used by both models. Some differences exist between simulated dry deposition amounts by CMAQ at the 12- and 4-km, due to their sensitivity to model inputs (e.g., land cover/use) and meteorological and chemical predictions that are different at different horizontal grid resolutions. 10
 monthly-mean temperature at 1.5 m (T1.")
, wind speed at 10 m (WSP10), wind direction at 10 m (WDR10), and")
11 12 km 4 km T1.5 RH1.5 WSP10 WDR10 Precip Figure S-6. Simulated vs. observed (diamond symbols) monthly-mean temperature at 1.5 m (T1.5), relative humidity at 1.5 m (RH1.5), wind speed at 10 m (WSP10), wind direction at 10 m (WDR10), and hourly precipitation (Precip) in January,


 monthly-mean")


, wind direction")
12 12 km 4 km T1.5 RH1.5 WSP10 WDR10 Precip Figure S-7. Simulated vs. observed (diamond symbols) monthly-mean temperature at 1.5 m (T1.5), relative humidity at 1.5 m (RH1.5), wind speed at 10 m (WSP10), wind direction at 10 m (WDR10), and hourly precipitation (Precip) in July,


13 (1) T (2) RH Figure S-8. Simulated vs. observed teemporal variaations of tempperature at 1.55 m (T), relattive humidity at 1.5 m (RH), wind speed at 10 m (WSP10), and wind direction at 10 m (WDR10) in January annd Jul.,


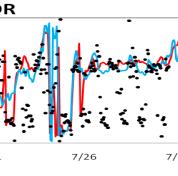


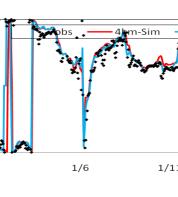


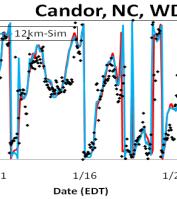


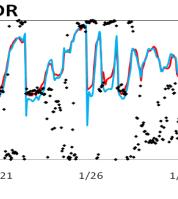


14 (3) WSSP10 (4) WD DR Figuree S 8. Continued. 14


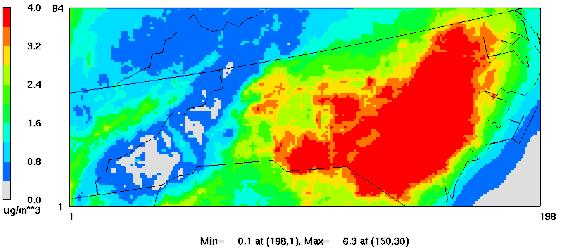


15 NH 4 + SO 4 2 NO 3 EC OM Figure S-9. Simulated monthly-mean 24-h average concentrations of PM 2.5 composition in January


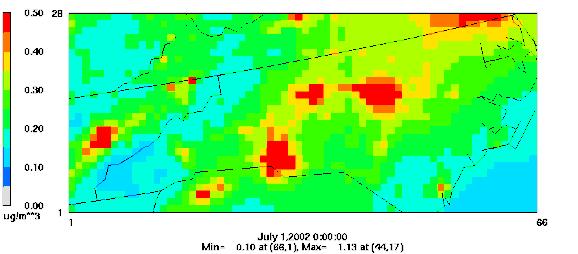


16 12 km 4 km NH 4 + SO 4 2 NO 3 EC OM Figure S-10. Simulated monthly-mean 24-h average concentrations of PM 2.5 composition in July


17 Figure S-11. The dry deposition fluxes of gaseous and PM species simulated by CMAQ 4- and 12-km simulations vs. estimated by the Multi-Layer Model (MLM) based on meteorological and chemical concentration measurements from CASTNET at 2 sites in NC in July
Atmospheric Environment
 Atmospheric Environment 44 (2010) 2443e2456 Contents lists available at ScienceDirect Atmospheric Environment journal homepage: www.elsevier.com/locate/atmosenv Responses of future air quality to emission
Source apportionment of fine particulate matter over the Eastern U.S. Part I. Source sensitivity simulations using CMAQ with the Brute Force method
 S1 SUPPORTING MATERIAL Source apportionment of fine particulate matter over the Eastern U.S. Part I. Source sensitivity simulations using CMAQ with the Brute Force method Michael Burr and Yang Zhang Department
Modeling atmospheric transport and fate of ammonia in North Carolina Part I: Evaluation of meteorological and chemical predictions
 ARTICLE IN PRESS Atmospheric Environment 42 (8) 3419 3436 www.elsevier.com/locate/atmosenv Modeling atmospheric transport and fate of ammonia in North Carolina Part I: Evaluation of meteorological and
SUPPLEMENTARY MATERIAL
 SUPPLEMENTARY MATERIAL Impacts of Air-Sea Interactions on Regional Air Quality Predictions Using a Coupled Atmosphere-Ocean Model in Southeastern U.S. Jian He, Ruoying He, and Yang Zhang * Department of
1.7 APPLICATION AND EVALUATION OF MM5 FOR NORTH CAROLINA WITH A 4-KM HORIZONTAL GRID SPACING
 .7 APPLICATION AND EVALUATION OF MM5 FOR NORTH CAROLINA WITH A 4-KM HORIZONTAL GRID SPACING Srinath Krishnan, Shiang-Yuh Wu 2, Danny Hamilton, Yang Zhang, and Viney P. Aneja Department of Marine, Earth
ratio indicates that the regions of high NH 3 emissions in the eastern NC and northeastern GA are NH 3 -rich and reductions of NH 3 alone would do
 ABSTRACT OLSEN, KRISTEN M. Fine Scale Modeling of Agricultural Air Quality over the Southeastern United States: Application and Evaluation of Two Air Quality Models. (Under the direction of Dr. Yang Zhang).
The Importance of Ammonia in Modeling Atmospheric Transport and Deposition of Air Pollution. Organization of Talk:
 The Importance of Ammonia in Modeling Atmospheric Transport and Deposition of Air Pollution Organization of Talk: What is modeled Importance of NH 3 emissions to deposition Status of NH 3 emissions (model-based)
Climates of NYS. Definitions. Climate Regions of NYS. Storm Tracks. Climate Controls 10/13/2011. Characteristics of NYS s Climates
 Definitions Climates of NYS Prof. Anthony Grande 2011 Weather and Climate Weather the state of the atmosphere at one point in time. The elements of weather are temperature, air pressure, wind and moisture.
AIRQUEST Annual Report and State of the Model
 AIRQUEST Annual Report and State of the Model Brian Lamb 1, Serena Chung 1, Farren Herron-Thorpe 2 and Joseph Vaughan 1 1 Laboratory for Atmospheric Research, Washington State University, Pullman, W, USA
Grade 7-13 Dropout Counts and Rates
 010 01B 01C 01D 020 030 040 050 060 06A 06B 070 080 090 09A 100 110 111 120 130 132 Alamance- Burlington Schools 362 3.43 324 3.08 268 2.56 318 2.98 233 2.18 232 2.15 River Mill Academy 0 0.00 2 0.77 0
ROLE OF CLOUD RADIATION INTERACTION IN THE DIURNAL VARIATION OF PRECIPITATION
 ROLE OF CLOUD RADIATION INTERACTION IN THE DIURNAL VARIATION OF PRECIPITATION SETHU RAMAN AND ADRIENNE WOOTTEN DEPARTMENT OF MARINE, EARTH AND ATMOSPHERIC SCIENCES NORTH CAROLINA STATE UNIVERSITY, RALEIGH,
EVALUATION OF PEANUT DISEASE DEVELOPMENT FORECASTING. North Carolina State University, Raleigh, North Carolina
 P244 EVALUATION OF PEANUT DISEASE DEVELOPMENT FORECASTING John A. McGuire* 1, Mark S. Brooks 1, Aaron P. Sims 1, Barbara Shew 2, and Ryan Boyles 1 1 State Climate Office of North Carolina, 2 Department
Kiwanis International
 Page 1 of 10 Carolinas 01 Division 1 K00154 Asheville NC 31 32 3.23 +1 701 Black Mountain-Swannanoa NC 68 69 1.47 +1 K11350 Franklin, Macon County NC CSD 0.00 K459 McDowell County NC 26 26 0.00 K14075
Kiwanis International
 Page 1 of 10 Carolinas 01 Division 1 K00154 Asheville NC 34 34 34 34 34 34 0.00 701 Black Mountain-Swannanoa NC 77 83 83 83 86 87 12.99 +10 K11350 Franklin, Macon County NC 25 21 21 21 25 24-4.00-1 K00956
North Carolina Climate January 2012
 North Carolina Climate January 2012 Online: http://www.nc-climate.ncsu.edu/office/newsletters North Carolina Climate, the monthly newsletter of the State Climate Office of NC, covers information on experimental
Definitions Weather and Climate Climates of NYS Weather Climate 2012 Characteristics of Climate Regions of NYS NYS s Climates 1.
 Definitions Climates of NYS Prof. Anthony Grande 2012 Weather and Climate Weather the state of the atmosphere at one point in time. The elements of weather are temperature, t air pressure, wind and moisture.
Grade 7-13 Dropout Counts and Rates
 01A 01B 010 01B NC Connections Academy - - - - - - - - 1 0.15 4 0.40 NC Virtual Academy - - - - - - - - 1 0.19 15 2.11 Alamance- Burlington Schools 318 2.98 233 2.18 232 2.15 259 2.37 295 2.70 261 2.42
North Carolina Climate December 2011
 North Carolina Climate December 2011 Online: http://www.nc-climate.ncsu.edu/office/newsletters North Carolina Climate, the monthly newsletter of the State Climate Office of NC, covers information on a
HIGH RESOLUTION CMAQ APPLICATION FOR THE REGIONAL MUNICIPALITY OF PEEL, ONTARIO, CANADA
 HIGH RESOLUTION CMAQ APPLICATION FOR THE REGIONAL MUNICIPALITY OF PEEL, ONTARIO, CANADA Jeff Lundgren*, Wayne Boulton, Greg Conley, Martin Gauthier, Akhila Wolfe, Carol McClellan RWDI, Guelph, Ontario,
Arizona Climate Summary April 2013
 Arizona Climate Summary April 2013 Summary of conditions for March 2013 March 2013 Temperature and Precipitation Summary March 1 st 16 th : March began as a ridge of high pressure progressed across the
Arizona Climate Summary March 2013
 Arizona Climate Summary March 2013 Summary of conditions for February 2013 February 2013 Temperature and Precipitation Summary February 1 st 16 th : February began with a ridge of high pressure over the
North Carolina Climate July 2011
 North Carolina Climate July 2011 Online: http://www.nc-climate.ncsu.edu/office/newsletters North Carolina Climate, the monthly newsletter of the State Climate Office of NC, covers a monthly climate summary
AERMOD Sensitivity to AERSURFACE Moisture Conditions and Temporal Resolution. Paper No Prepared By:
 AERMOD Sensitivity to AERSURFACE Moisture Conditions and Temporal Resolution Paper No. 33252 Prepared By: Anthony J Schroeder, CCM Managing Consultant TRINITY CONSULTANTS 7330 Woodland Drive Suite 225
Locations of Monitoring Stations in the Mercury Trends Network
 Locations of Monitoring Stations in the Mercury Trends Network Three sets of geographic criteria were used to determine the locations for the regionally representative MTN monitoring stations: ecoregion,
STATION If relative humidity is 60% and saturation vapor pressure is 35 mb, what is the actual vapor pressure?
 STATION 1 Vapor pressure is a measure of relative humidity and saturation vapor pressure. Using this information and the information given in the problem, answer the following question. 1. If relative
Dispersion Modeling Protocol for the Cliffside Steam Station Class I Area Impacts
 July 21, 2005 Dispersion Modeling Protocol for the Cliffside Steam Station Class I Area Impacts For: Cliffside Unit 6 & 7 Project Rutherford County, North Carolina Submitted to: North Carolina Division
Ammonia Emissions and Nitrogen Deposition in the United States and China
 Ammonia Emissions and Nitrogen Deposition in the United States and China Presenter: Lin Zhang Department of Atmospheric and Oceanic Sciences, School of Physics, Peking University Acknowledge: Daniel J.
Comparing the Relationships Between Heat Stress Indices and Mortality in North Carolina
 Comparing the Relationships Between Heat Stress Indices and Mortality in North Carolina Jordan Clark PhD Student CISA Research Assistant Department of Geography UNC-Chapel Hill 10/30/2018 Overview Background
Climate. Annual Temperature (Last 30 Years) January Temperature. July Temperature. Average Precipitation (Last 30 Years)
 January Temperature. July Temperature. Average Precipitation (Last 30 Years)") Climate Annual Temperature (Last 30 Years) Average Annual High Temp. (F)70, (C)21 Average Annual Low Temp. (F)43, (C)6 January Temperature Average January High Temp. (F)48, (C)9 Average January Low Temp.
Climate Annual Temperature (Last 30 Years) Average Annual High Temp. (F)70, (C)21 Average Annual Low Temp. (F)43, (C)6 January Temperature Average January High Temp. (F)48, (C)9 Average January Low Temp.
The climate change penalty on US air quality: New perspectives from statistical models
 The climate change penalty on US air quality: New perspectives from statistical models Charles River Path, Boston, July 2010 Salt Lake City, January 2013 Loretta J. Mickley, Lu Shen, Xu Yue Harvard University
Ongoing EPA efforts to evaluate modeled NO y budgets. Heather Simon, Barron Henderson, Deborah Luecken, Kristen Foley
 Ongoing EPA efforts to evaluate modeled NO y budgets Heather Simon, Barron Henderson, Deborah Luecken, Kristen Foley Literature consistent regarding reported high bias Mobile NO x over (2x) Mobile NO x
Implementation and Testing of EQUISOLV II in the CMAQ Modeling System
 Implementation and Testing of EQULV II in the CMAQ Modeling System Yang Zhang North Carolina State University Mark Z. Jacobson Stanford University, Stanford, CA CMAQ, September 26-29, 25 Acknowledgments
Different types of maps and how to read them.
 Different types of maps and how to read them. A map is a picture or representation of the Earth's surface, showing how things are related to each other by distance, direction, and size. Maps have been
GUIDED READING CHAPTER 1: THE LAY OF THE LAND (Page 1)
") CHAPTER 1: THE LAY OF THE LAND (Page 1) Section 1 The Tidewater Region Directions: Use the information from pages 6-11 to complete the following statements. 1. In the southern part of the coast, the Tidewater
CHAPTER 1: THE LAY OF THE LAND (Page 1) Section 1 The Tidewater Region Directions: Use the information from pages 6-11 to complete the following statements. 1. In the southern part of the coast, the Tidewater
North Carolina Climate Variations
 North Carolina Climate Variations Sethu Raman Professor of Atmospheric and Marine Sciences and State Climatologist State Climate Office of North Carolina North Carolina State University Latest Drought
Incorporating Space-borne Observations to Improve Biogenic Emission Estimates in Texas (Project )
") Incorporating Space-borne Observations to Improve Biogenic Emission Estimates in Texas (Project 14-017) Arastoo Pour Biazar, Richard T. McNider, Andrew White University of Alabama in Huntsville Daniel
Incorporating Space-borne Observations to Improve Biogenic Emission Estimates in Texas (Project 14-017) Arastoo Pour Biazar, Richard T. McNider, Andrew White University of Alabama in Huntsville Daniel
2007 Area Source Emissions Inventory Methodology 670 RANGE IMPROVEMENT
 San Joaquin Valley AIR POLLUTION CONTROL DISTRICT 2007 Area Source Emissions Inventory Methodology 670 RANGE IMPROVEMENT I. Purpose This document describes the Area Source Methodology used to estimate
Current and Future Impacts of Wildfires on PM 2.5, Health, and Policy in the Rocky Mountains
 Current and Future Impacts of Wildfires on PM 2.5, Health, and Policy in the Rocky Mountains Yang Liu, Ph.D. STAR Grants Kick-off Meeting Research Triangle Park, NC April 5, 2017 Motivation The Rocky Mountains
Accepted Manuscript. Yuepeng Pan, Wen Xu, Gregory R. Wentworth, Shili Tian
 Accepted Manuscript Discussion of Atmospheric deposition as an important nitrogen load to a typical agroecosystem in the Huang-Huai-Hai Plain by Huang et al. (2016) Yuepeng Pan, Wen Xu, Gregory R. Wentworth,
Fall 2006 Language Enrollments in North Carolina, by Institution
 Fall 2006 Language Enrollments in, by Institution Level University Language 2yr Alamance Comm C Graduate French 7 0 7 0 7 Spanish 344 0 344 0 344 Summary for Alamance Comm C 351 0 351 0 351 Asheville-Buncombe
Know and Respond AQ Alert Service. Paul Willis SCOTTISH AIR QUALITY DATABASE AND WEBSITE ANNUAL SEMINAR Stirling 30 th March 2011
 Know and Respond AQ Alert Service Paul Willis SCOTTISH AIR QUALITY DATABASE AND WEBSITE ANNUAL SEMINAR Stirling 30 th March 2011 Outline: Know and Respond AQ Alert Service Introduction. The Website. How
CALIOPE EU: Air Quality
 CALIOPE EU: Air Quality CALIOPE EU air quality forecast application User Guide caliope@bsc.es Version 30/09/2015 TABLE OF CONTENTS 1. Description... 1 2. Installation... 1 3. User Guide... 2 3.1 Air quality
Lake Tahoe Watershed Model. Lessons Learned through the Model Development Process
 Lake Tahoe Watershed Model Lessons Learned through the Model Development Process Presentation Outline Discussion of Project Objectives Model Configuration/Special Considerations Data and Research Integration
Air quality and atmospheric deposition in the eastern US: 20 years of change
 doi:10.5194/acp-15-173-2015 Author(s) 2015. CC Attribution 3.0 License. Air quality and atmospheric deposition in the eastern US: 20 years of change J. E. Sickles II 1 and D. S. Shadwick 2, 1 Landscape
YUKON SNOW SURVEY BULLETIN & WATER SUPPLY FORECAST May 1, Prepared and issued by: Water Resources Branch Environment Yukon
 YUKON SNOW SURVEY BULLETIN & WATER SUPPLY FORECAST 1, 215 Prepared and issued by: Water Resources Branch Environment Yukon PREFACE The Yukon Snow Survey Bulletin and Water Supply Forecast is prepared and
Land Surface Processes and Their Impact in Weather Forecasting
 Land Surface Processes and Their Impact in Weather Forecasting Andrea Hahmann NCAR/RAL with thanks to P. Dirmeyer (COLA) and R. Koster (NASA/GSFC) Forecasters Conference Summer 2005 Andrea Hahmann ATEC
Colorado CoCoRaHS. Colorado CoCoRaHS. Because Every Drop Counts! November 2014 Volume 2, Issue 11
 U.S. PRECIPITATION (% OF AVERAGE) LOOKING BACK AT OCTOBER 2014 October was a fairly dry month for much of the nation with the exception of the Pacific Northwest, portions of New England and the Tennessee
Modelling atmospheric transport and deposition of ammonia and ammonium. Willem A.H. Asman Danish Institute of Agricultural Sciences
 Modelling atmospheric transport and deposition of ammonia and ammonium Willem A.H. Asman Danish Institute of Agricultural Sciences Contents Processes Model results Conclusions Definitions NH 3 (ammonia)
Page 1. Name: 4) State the actual air pressure, in millibars, shown at Miami, Florida on the given weather map.
 State the actual air pressure, in millibars, shown at Miami, Florida on the given weather map.") Name: Questions 1 and 2 refer to the following: A partial station model and meteorological conditions table, as reported by the weather bureau in the city of Oswego, New York, are shown below. 1) Using
Name: Questions 1 and 2 refer to the following: A partial station model and meteorological conditions table, as reported by the weather bureau in the city of Oswego, New York, are shown below. 1) Using
Arizona Climate Summary May 2012
 Arizona Climate Summary May 2012 Summary of conditions for April 2012 April 2012 Temperature and Precipitation Summary April 1 st 16 th : Although April began with another low pressure system sweeping
Continuous measurement of airborne particles and gases
 Continuous measurement of airborne particles and gases Jeff Collett and Taehyoung Lee Atmospheric Science Department Colorado State University Funding: USDA/AES and NPS Outline Why measure particles and
Urban Forest Effects-Dry Deposition (UFORE D) Model Enhancements. Satoshi Hirabayashi
 Model Enhancements. Satoshi Hirabayashi") Urban Forest Effects-Dry Deposition (UFORE D) Model Enhancements Satoshi Hirabayashi The Davey Institute, The Davey Tree Expert Company, Syracuse, New York 13210, USA Surface Weather Data NOAA Integrated
Urban Forest Effects-Dry Deposition (UFORE D) Model Enhancements Satoshi Hirabayashi The Davey Institute, The Davey Tree Expert Company, Syracuse, New York 13210, USA Surface Weather Data NOAA Integrated
8-km Historical Datasets for FPA
 Program for Climate, Ecosystem and Fire Applications 8-km Historical Datasets for FPA Project Report John T. Abatzoglou Timothy J. Brown Division of Atmospheric Sciences. CEFA Report 09-04 June 2009 8-km
5B.1 DEVELOPING A REFERENCE CROP EVAPOTRANSPIRATION CLIMATOLOGY FOR THE SOUTHEASTERN UNITED STATES USING THE FAO PENMAN-MONTEITH ESTIMATION TECHNIQUE
 DEVELOPING A REFERENCE CROP EVAPOTRANSPIRATION CLIMATOLOGY FOR THE SOUTHEASTERN UNITED STATES USING THE FAO PENMAN-MONTEITH ESTIMATION TECHNIQUE Heather A. Dinon*, Ryan P. Boyles, and Gail G. Wilkerson
GEOGRAPHY OF THE UNITED STATES & CANADA. By Brett Lucas
 GEOGRAPHY OF THE UNITED STATES & CANADA By Brett Lucas THE APPALACHIANS & THE OZARKS Setting the Boundaries What states and provinces are part of the region? Eastern TN, western NC, eastern KY, western
Inconsistency of ammonium-sulfate aerosol ratios with thermodynamic models in the eastern US: a possible role of organic aerosol
 Inconsistency of ammonium-sulfate aerosol ratios with thermodynamic models in the eastern US: a possible role of organic aerosol Rachel Silvern AGU Fall Meeting December 15, 2016 with Daniel Jacob 1, Patrick
Arizona Climate Summary May 2013
 Arizona Climate Summary May 2013 Summary of conditions for April 2013 April 2013 Temperature and Precipitation Summary April 1 st 16 th : The first week of April featured a ridge of high pressure over
Responsibilities of Harvard Atmospheric Chemistry Modeling Group
 Responsibilities of Harvard Atmospheric Chemistry Modeling Group Loretta Mickley, Lu Shen, Daniel Jacob, and Rachel Silvern 2.1 Objective 1: Compile comprehensive air pollution, weather, emissions, and
Reactive Nitrogen Monitoring
 Reactive Nitrogen Monitoring Some definitions NOy NO + NO 2 + NO 3 + 2xN2 2 O 5 + HNO 3 + HONO + HO 2 NO 2 + RONO 2 (organic nitrates such as PAN and alkyl nitrates) + RONO (organic nitrites) + NO 3 -
Wen Xu* Alberta Environment and Sustainable Resource Development, Edmonton, Alberta, Canada
 Air Quality and Acid Deposition Simulation of South Athabasca Oil Sands Area Applying WRF, CMAQ and CALPUFF Models, and Model Performance Evaluations of WRF and CMAQ Models Wen Xu* Alberta Environment
Description DESCRIPTION
 DESCRIPTION The location of the Upper James Watershed is located in northeastern South Dakota as well as southeastern North Dakota. It includes the following counties located in North Dakota Barnes, Dickey,
The Canadian ADAGIO Project for Mapping Total Atmospheric Deposition
 The Canadian ADAGIO Project for Mapping Total Atmospheric Deposition Amanda S. Cole Environment & Climate Change Canada (ECCC) MMF-GTAD Workshop Geneva, Switzerland February 28, 2017 ADAGIO team Amanda
Table C5. Total Number of Acts for Each LEA ACTS
 PER 1000 LEA AR AW AP BT BS D K PA PS PF PW R RW SA SO IM ALAMANCE-BURLINGTON 2 4 5 0 0 0 0 12 110 1 86 0 0 12 1 0 233 22,141 10.523 ALEXANDER COUNTY 0 0 7 0 0 0 0 7 27 1 14 0 0 0 0 0 56 5,367 10.434 ALLEGHANY
New Hampshire State Climate Office Dr. Mary D. Stampone, State Climatologist
 New Hampshire State Climate Office Dr. Mary D. Stampone, State Climatologist University of New Hampshire c/o Department of Geography 73 Main Street Durham, NH 03824 Phone: 603-862-3136 Fax: 603-862-4362
Comprehensive Analysis of Annual 2005/2008 Simulation of WRF/CMAQ over Southeast of England
 Comprehensive Analysis of Annual 2005/2008 Simulation of WRF/CMAQ over Southeast of England The 13 th International Conference on Harmonization within Atmospheric Dispersion Modelling for Regulatory Purposes
Creating Meteorology for CMAQ
 Creating Meteorology for CMAQ Tanya L. Otte* Atmospheric Sciences Modeling Division NOAA Air Resources Laboratory Research Triangle Park, NC * On assignment to the National Exposure Research Laboratory,
Who is polluting the Columbia River Gorge?
 Who is polluting the Columbia River Gorge? Final report to the Yakima Nation Prepared by: Dan Jaffe, Ph.D Northwest Air Quality, Inc. 7746 Ravenna Avenue NE Seattle WA 98115 NW_airquality@hotmail.com December
CSO Climate Data Rescue Project Formal Statistics Liaison Group June 12th, 2018
 CSO Climate Data Rescue Project Formal Statistics Liaison Group June 12th, 2018 Dimitri Cernize and Paul McElvaney Environment Statistics and Accounts Presentation Structure Background to Data Rescue Project
THE INFLUENCE OF THE GREAT LAKES ON NORTHWEST SNOWFALL IN THE SOUTHERN APPALACHIANS
 P2.18 THE INFLUENCE OF THE GREAT LAKES ON NORTHWEST SNOWFALL IN THE SOUTHERN APPALACHIANS Robbie Munroe* and Doug K. Miller University of North Carolina at Asheville, Asheville, North Carolina B. Holloway
Analyzing spatial and temporal variation of water balance components in La Vi catchment, Binh Dinh province, Vietnam
 Analyzing spatial and temporal variation of water balance components in La Vi catchment, Binh Dinh province, Vietnam Nguyen Duy Liem, Vo Ngoc Quynh Tram, Nguyen Le Tan Dat, Nguyen Kim Loi Nong Lam University-
Direct radiative forcing due to aerosols in Asia during March 2002
 Direct radiative forcing due to aerosols in Asia during March 2002 Soon-Ung Park, Jae-In Jeong* Center for Atmospheric and Environmental Modeling *School of Earth and Environmental Sciences, Seoul National
NIDIS Intermountain West Drought Early Warning System February 12, 2019
 NIDIS Intermountain West Drought Early Warning System February 12, 2019 Precipitation The images above use daily precipitation statistics from NWS COOP, CoCoRaHS, and CoAgMet stations. From top to bottom,
Exploration of Nitrogen Total Deposition Budget Uncertainty at the Regional Scale
 Exploration of Nitrogen Total Deposition Budget Uncertainty at the Regional Scale Robin L. Dennis, Donna Schwede, Jesse Bash and Jon Pleim Atmospheric Modeling and Analysis Division NERL, EPA NADP Annual
Air quality impacts of oil and gas development in the Bakken formation region
 Air quality impacts of oil and gas development in the Bakken formation region J. L. Collett, Jr. 1, A. Evanoski Cole 1, A. Prenni 2, D. Day 2, A. Sullivan 1, Y. Li 1, B. Sive 2, Y. Zhou 1, A. Hecobian
NIDIS Intermountain West Drought Early Warning System May 23, 2017
 NIDIS Drought and Water Assessment NIDIS Intermountain West Drought Early Warning System May 23, 2017 Precipitation The images above use daily precipitation statistics from NWS COOP, CoCoRaHS, and CoAgMet
The 2015 NWS Spring and Summer Weather Update
 http://weather.gov The 2015 NWS Spring and Summer Weather Update Western North Carolina severe weather climatology Tony Sturey, WCM Greenville/Spartanburg, SC North Carolina Spring and Summer Outlooks
The Integration of WRF Model Forecasts for Mesoscale Convective Systems Interacting with the Mountains of Western North Carolina
 Proceedings of The National Conference On Undergraduate Research (NCUR) 2006 The University of North Carolina at Asheville Asheville, North Carolina April 6-8, 2006 The Integration of WRF Model Forecasts
138 ANALYSIS OF FREEZING RAIN PATTERNS IN THE SOUTH CENTRAL UNITED STATES: Jessica Blunden* STG, Inc., Asheville, North Carolina
 138 ANALYSIS OF FREEZING RAIN PATTERNS IN THE SOUTH CENTRAL UNITED STATES: 1979 2009 Jessica Blunden* STG, Inc., Asheville, North Carolina Derek S. Arndt NOAA National Climatic Data Center, Asheville,
APPENDIX G-7 METEROLOGICAL DATA
 APPENDIX G-7 METEROLOGICAL DATA METEOROLOGICAL DATA FOR AIR AND NOISE SAMPLING DAYS AT MMR Monthly Normals and Extremes for Honolulu International Airport Table G7-1 MMR RAWS Station Hourly Data Tables
Table C5. Total Number of Acts for Each LEA
 ALAMANCE-BURLINGTON 1 0 0 1 0 0 0 14 81 2 56 0 0 0 4 2 0 161 22,037 7.306 ALEXANDER COUNTY 0 0 4 0 0 0 0 8 13 0 13 0 0 0 0 0 0 38 5,492 6.919 ALLEGHANY COUNTY 0 0 0 0 0 0 0 6 10 0 5 0 0 0 0 1 0 22 1,484
Science EOG Review: Landforms
 Mathematician Science EOG Review: Landforms Vocabulary Definition Term canyon deep, large, V- shaped valley formed by a river over millions of years of erosion; sometimes called gorges (example: Linville
Measurement of Ammonia Concentrations and Fluxes: Recent Examples Using Denuder and Chemiluminescence Technologies
 Measurement of Ammonia Concentrations and Fluxes: Recent Examples Using Denuder and Chemiluminescence Technologies John Walker U.S. Environmental Protection Agency National Risk Management Research Laboratory
P1.34 MULTISEASONALVALIDATION OF GOES-BASED INSOLATION ESTIMATES. Jason A. Otkin*, Martha C. Anderson*, and John R. Mecikalski #
 P1.34 MULTISEASONALVALIDATION OF GOES-BASED INSOLATION ESTIMATES Jason A. Otkin*, Martha C. Anderson*, and John R. Mecikalski # *Cooperative Institute for Meteorological Satellite Studies, University of
LOCAL CLIMATOLOGICAL DATA Monthly Summary July 2013
 Deg. Days Precip Ty Precip Wind Solar Hu- Adj. to Sea Level mid- ity Avg Res Res Peak Minute 1 fog 2 hvy fog 3 thunder 4 ice plt 5 hail 6 glaze 7 duststm 8 smk, hz 9 blw snw 1 2 3 4A 4B 5 6 7 8 9 12 14
AREP GAW. AQ Forecasting
 AQ Forecasting What Are We Forecasting Averaging Time (3 of 3) PM10 Daily Maximum Values, 2001 Santiago, Chile (MACAM stations) 300 Level 2 Pre-Emergency Level 1 Alert 200 Air Quality Standard 150 100
PRELIMINARY. 9:30 am
 E 1 E New Bern 14-2-1 E 16 ME Hoke County 8-11-3 E 8 ME East Chapel Hill 12-5-3 E 9 E West Johnston 14-6-0 E 5 E D.H. Conley 13-3-2 E 12 ME Seventy-First 9-6-1 E 4 ME Jordan 13-6-1 E 13 E E.A. Laney 11-8-2
Arizona Climate Summary November 2018 Summary of conditions for October 2018
 Arizona Climate Summary November 2018 Summary of conditions for October 2018 October 2018 Temperature and Precipitation Summary October 1 st 15 th : The 2018 water year ending September 30 th was exceptionally
Arizona Climate Summary February 2012
 Arizona Climate Summary February 2012 Summary of conditions for January 2012 January 2012 Temperature and Precipitation Summary January 1 st 20 th : The New Year has started on a very dry note. The La
Flooding in Western North Carolina: Some Spatial, Hydrologic, and Seasonal Characteristics CAUTION!! Outline. Basic Flood Facts.
 Flooding in Western North Carolina: Some Spatial, Hydrologic, and Seasonal Characteristics J. Greg Dobson CAUTION!! National Environmental Modeling and Analysis Center RENCI at UNC-Asheville Engagement
The National Operational Hydrologic Remote Sensing Center Operational Snow Analysis
 The National Operational Hydrologic Remote Sensing Center Operational Snow Analysis World Meteorological Organization Global Cryosphere Watch Snow-Watch Workshop Session 3: Snow Analysis Products Andrew
The aerosol distribution in Europe derived with CMAQ: comparison to near surface in situ and sunphotometer t measurements
 Volker Matthias, GKSS Research Center, Geesthacht, Germany The aerosol distribution in Europe derived with CMAQ: comparison to near surface in situ and sunphotometer t measurements PAGE Page1 1 Outline
Climate.tgt, Version: 1 1
 Name: Key Concepts Choose the letter of the best answer. (5 points each) 1. 2. 3. 4. 5. 6. 7. 8. 9. 10. Date: A city located in the middle of North America experiences extreme temperature changes during
NIDIS Intermountain West Drought Early Warning System April 18, 2017
 1 of 11 4/18/2017 3:42 PM Precipitation NIDIS Intermountain West Drought Early Warning System April 18, 2017 The images above use daily precipitation statistics from NWS COOP, CoCoRaHS, and CoAgMet stations.
Appendix A 2011 Air Monitoring Sites
 Appendix A 2011 Air Monitoring Sites New Jersey Department of Environmental Protection Appendix A 1 www.njaqinow.net FIGURE 1 NORTHERN NEW JERSEY AIR MONITORING SITES Appendix A 2 www.njaqinow.net County
NIDIS Intermountain West Drought Early Warning System January 16, 2018
 NIDIS Drought and Water Assessment NIDIS Intermountain West Drought Early Warning System January 16, 2018 Precipitation The images above use daily precipitation statistics from NWS COOP, CoCoRaHS, and
Item 1: Edits to Select Appendix S Class I Air Dispersion Modeling Report text
 2016 Class I Errata Poly Met Mining, Inc. NorthMet Project December 23, 2016 The following provides revisions and corrections to the Class I air dispersion modeling submitted with the permit application
Unit 4 Review Guide: Weather
 Unit 4 Review Guide: Weather Weather: The condition of the atmosphere at a specific time and place. Freezing: To become hardened into ice or into a solid body Deposition: The change in state of matter
IWT Scenario 1 Integrated Warning Team Workshop National Weather Service Albany, NY October 31, 2014
 Integrated Warning Team Workshop National Weather Service Albany, NY October 31, 2014 23 24 25 26 27 Scenario 1 Timeline November 23-27 Sun Mon Tue Wed Thu Thanksgiving Day Sunday, Nov. 23 @ 430 pm NWS
Coupling of Diurnal Climate to Clouds, Land-use and Snow
 Coupling of Diurnal Climate to Clouds, Land-use and Snow Alan K. Betts akbetts@aol.com http://alanbetts.com Co-authors: Ray Desjardins, Devon Worth, Darrel Cerkowniak Agriculture and Agri-Food Canada Shusen
Land Data Assimilation at NCEP NLDAS Project Overview, ECMWF HEPEX 2004
 Dag.Lohmann@noaa.gov, Land Data Assimilation at NCEP NLDAS Project Overview, ECMWF HEPEX 2004 Land Data Assimilation at NCEP: Strategic Lessons Learned from the North American Land Data Assimilation System