CALIOPE EU: Air Quality
|
|
|
- Esther Lynch
- 5 years ago
- Views:
Transcription


1 CALIOPE EU: Air Quality CALIOPE EU air quality forecast application User Guide Version 30/09/2015
2 TABLE OF CONTENTS 1. Description Installation User Guide Air quality level Stations Map Information CALIOPE Air Quality Forecast System Overview Troubleshooting... 9


3 1. Description The CALIOPE EU air quality forecast application has been developed by the Earth Sciences Department of the Barcelona Supercomputing Center and funded by the European Commission in the context of the MYGEOSS EU project. The data displayed in the mobile application is based on the CALIOPE system ( The application provides 48-hour air quality forecast for rural and suburban background stations spread all over Europe and also makes use of the user s device GPS system to find the position and show the forecast air quality level from the nearest air quality station. Thus, the air quality forecast level is shown in five categories: good, acceptable, poor, bad and very bad. Furthermore, CALIOPE EU app shows the hourly maps concentrations of the major pollutants: ozone, nitrogen dioxide, sulfur dioxide and particulate matter dissolved in the atmosphere. More information about the CALIOPE system is available in chapter Installation In order to install the CALIOPE EU app, on your smartphone or tablet device running Android 4.0 or higher, go to Google Play store, select applications, and search for CALIOPE Europe. Figure 1. Google play store and CALIOPE searching Once the results are shown, you only have to press on CALIOPE EU, and once inside the application download screen, press on Install in order to begin with the installation. 1
 will be used by the application in order to find the nearest air quality station according to your position. Figure 2.")
4 In the installation process you will be asked to allow the app to use your device s location service and get information from your Wi-Fi connection. The location service (including the Wi-FI information) will be used by the application in order to find the nearest air quality station according to your position. Figure 2. CALIOPE EU installation display 3. User Guide In the CALIOPE Europe application main page, you will see four options: Air Quality Level, Stations, Map and Information. They will give you access to the different app functionalities that are described below. 2
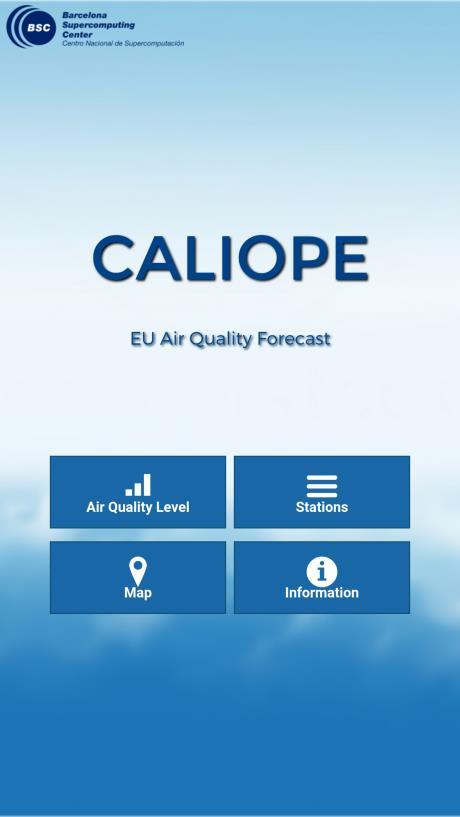
5 Figure 3. Main menu of the CALIOPE EU application 3.1 Air quality level This section shows the air quality levels for the nearest station to your location, which is obtained through your device s geolocation. In the upper part of this screen, you will see the name of the air quality station and the country where it is located, while in the upper-right corner, the date and the timestamp for the displayed forecast are shown. You can move the horizontal slider to see the forecast for the next hour up to 48 hours ahead. The air quality levels are shown for the following pollutants: ozone (O 3 ), nitrogen dioxide (NO 2 ), sulfur dioxide (SO 2 ) and particulate matter (PM10 and PM2.5). Each one is represented by a color bar and its name from these five categories: good, acceptable, poor, bad and very bad, as it is shown in the table. A description for each one is displayed in the information section of the app. Good Moderate Poor Bad Very bad 3


6 Figure 4. CALIOPE EU app. Air quality level display 3.2 Stations These view shows a list of the nearest stations to your position. The user can choose any of them to see the air quality levels or using the Search button, to find the station by country. Pressing Search button will displaya list of the European countries sorted alphabetically. From this list, you can select a country and a new list of the stations for this country will appear. Then you can select a station and see the forecast predicted for its location. Figure 5. CALIOPE EU app. Nearest station list and searching option by country 4


7 3.3 Map The map option by default shows a map centered on your location containing the nearest air quality stations. For each station, the color of the worst category for the next hour is shown. You can select in the upper-right corner of the window the option layers and select on the popping up menu the desired pollutant, to overlay its correspondent concentration map. Your location Air quality stations Figure 6. CALIOPE EU app. Display of the maps option: air quality station location and layers maps The concentration air quality maps are shown for the pollutants O 3, NO 2, SO 2, PM10 and PM2.5 on an hourly basis. The figure 7 shows an example of the O 3 concentration map. Play button Figure 7. CALIOPE EU app. Display of the maps option: air quality station location and layers maps 5
8 By default, the forecast for the current hour is shown but you can use the play button to activate the animation of the hourly evolution of the forecast. The animation can be stopped at any time. Changing the pollutant will maintain the forecasted hour until you press the play button again or select another option in the menu. 3.4 Information By tapping on the information option, the user can find further explanation about the air quality levels provided by the application (with a description of the concentration ranges by pollutant). It also informs about the main characteristics of the air quality pollutants shown in the app and its effects on human health. The limit values for the protection of the human health, according to the Directive 2008/50/CE are also displayed in each pollutant s section 6


9 Figure 8. CALIOPE EU app. Air quality pollution information section 7
 resolution. The models used by CALIOPE are: WRF-ARW v3.5.")
10 4. CALIOPE Air Quality Forecast System Overview The CALIOPE Air Quality Forecast System (AQFS) is operated by the Earth Sciences Department of the Barcelona Supercomputing Center (BSC). This system provides an operational air quality forecast for Europe and Spain at high spatial and temporal (1h) resolution. The models used by CALIOPE are: WRF-ARW v3.5.1 meteorological model, CMAQ v5.0.2 chemical transport model (CMAS, 2015), HERMES v2 emission model and BSC-DREAM8bv2 dust model (Figure 9). The system includes a post-process step based on the Kalman filter (KF) bias-correction technique which improves the results over the air quality stations. The KF adjusted results are the basis to generate an air quality index according to five categories. Figure 9. Main elements of the CALIOPE system The main forecast results, available at can be grouped in three categories of information and products: Information categories: Meteorological forecast: temperature, precipitation, humidity, pressure, cloud cover, wind direction and speed, among others. Emission forecast: nitrogen oxides (NO and NO 2 ), volatile organic compounds (VOCs), carbon monoxide (CO), sulfur dioxide (SO 2 ) and particulate matter (PM). Air quality forecast: Ozone (O 3 ), NO 2, CO, SO 2, particulate matter (PM10, less than 10µ and PM2.5, less than 2.5µ) and benzene (C 6 H 6 ). 8
11 Products categories: Concentration maps: o Hourly and daily maximum concentration for 24 h and 48 h forecast. o Corrected air quality forecast based on measurements. Air quality levels o Forecasted air quality index maps. o Forecasted air quality index at measurement locations. o Tables of maximum values of air quality, planned for 24 h and 48h. Forecast evaluation o o o Near real-time evaluation at measuring stations (Autonomous Communities, municipalities, AEMET, EIONET). Summary sheets of the annual forecast (statistical and graphics). Satellite Images. Air Quality Weather 5. Troubleshooting If the app on your device is crashing, won't open or respond, or isn't working properly, one of the troubleshooting solutions below may fix the issue. After each recommended solution, check to see if your issue has been fixed. Problem The application shows the message Determining user s location for a long time or you see a message alerting that is not possible to determine your location. The application shows a pop up with the message: There was an error when connecting to the server Recommended solution, This message is displayed as long as your device s location service is trying to determine your position. Wait for a while or review your location configuration in your Android options. You are having trouble connecting to the CALIOPE server. Ensure you have a working Internet access. 9
Know and Respond AQ Alert Service. Paul Willis SCOTTISH AIR QUALITY DATABASE AND WEBSITE ANNUAL SEMINAR Stirling 30 th March 2011
 Know and Respond AQ Alert Service Paul Willis SCOTTISH AIR QUALITY DATABASE AND WEBSITE ANNUAL SEMINAR Stirling 30 th March 2011 Outline: Know and Respond AQ Alert Service Introduction. The Website. How
CALIOPE forecasts evaluated by DELTA
 www.bsc.es CALIOPE forecasts evaluated by DELTA Mª Teresa Pay, José Mª Baldasano, Gustavo Arévalo, Valentina Sicardi, Kim Serradell, and CALIOPE team WG1 Assessment CCA: Forecast FAIRMODE Technical Meeting.
MDSS Functional Prototype Display System Preview April 2002
 MDSS Functional Prototype Display System Preview April 2002 Bill Mahoney National Center for Atmospheric Research Images shown are valid as of 15 April 2002 NCAR MDSS Display System - Overview The MDSS
Regional services and best use for boundary conditions
 Regional services and best use for boundary conditions MACC-III User Workshop Roma, 11 May 2015 Virginie Marécal (Météo-France) Laurence Rouïl (INERIS) and the MACC regional consortium Regional services
personal weather station
 personal weather station Master your own climate measurements on your smartphone TRAINING BOOK Pitch The Netatmo Personal Weather Station helps you master your own climate measurements on your smartphone.
NOAA-EPA s s U.S. National Air Quality Forecast Capability
 NOAA-EPA s s U.S. National Air Quality Forecast Capability May 10, 2006 Paula M. Davidson 1, Nelson Seaman 1, Jeff McQueen 1, Rohit Mathur 1,2, Chet Wayland 2 1 National Oceanic and Atmospheric Administration
Guide to Hydrologic Information on the Web
 NOAA s National Weather Service Guide to Hydrologic Information on the Web Colorado River at Lees Ferry Photo: courtesy Tim Helble Your gateway to web resources provided through NOAA s Advanced Hydrologic
Air Quality Modelling for Health Impacts Studies
 Air Quality Modelling for Health Impacts Studies Paul Agnew RSS Conference September 2014 Met Office Air Quality and Composition team Paul Agnew Lucy Davis Carlos Ordonez Nick Savage Marie Tilbee April
OpenWeatherMap Module
 OpenWeatherMap Module Installation and Usage Guide Revision: Date: Author(s): 1.0 Friday, October 13, 2017 Richard Mullins Contents Overview 2 Installation 3 Import the TCM in to accelerator 3 Add the
PAPILA WP5: Model evaluation
 PAPILA WP5: Model evaluation Regional modelling: MPG (WRF-Chem), CNRS (WRF-CHIMERE), FMI (SILAM) Local downscaling: UCL (WRF-CHIMERE), UNAM (SILAM) and USP (SILAM) Laurent MENUT Laboratoire de Météorologie
Modeling the impact of Dust on Air Quality at BSC: From R&D to operations
 Modeling the impact of Dust on Air Quality at BSC: From R&D to operations Sara Basart (sara.basart@bsc.es) Atmospheric Composition Group, Earth Sciences Department Barcelona Supercomputing Center (BSC)
WeatherHawk Weather Station Protocol
 WeatherHawk Weather Station Protocol Purpose To log atmosphere data using a WeatherHawk TM weather station Overview A weather station is setup to measure and record atmospheric measurements at 15 minute
Speedwell High Resolution WRF Forecasts. Application
 Speedwell High Resolution WRF Forecasts Speedwell weather are providers of high quality weather data and forecasts for many markets. Historically we have provided forecasts which use a statistical bias
Introduction to Weather Analytics & User Guide to ProWxAlerts. August 2017 Prepared for:
 Introduction to Weather Analytics & User Guide to ProWxAlerts August 2017 Prepared for: Weather Analytics is a leading data and analytics company based in Washington, DC and Dover, New Hampshire that offers
HOW TO GUIDE. Loading climate data from online database
 HOW TO GUIDE Loading climate data from online database Copyright and publisher: EMD International A/S Niels Jernes vej 10 9220 Aalborg Ø Denmark Phone: +45 9635 44444 e-mail: emd@emd.dk web: www.emd.dk
TECDIS and TELchart ECS Weather Overlay Guide
 1 of 24 TECDIS and TELchart ECS provides a very advanced weather overlay feature, using top quality commercial maritime weather forecast data available as a subscription service from Jeppesen Marine. The
The Kentucky Mesonet: Entering a New Phase
 The Kentucky Mesonet: Entering a New Phase Stuart A. Foster State Climatologist Kentucky Climate Center Western Kentucky University KCJEA Winter Conference Lexington, Kentucky February 9, 2017 Kentucky
Using Smoke Modeling Tools for Prescribed Fire Planning and Implementation A Quick Set of Instructions (Revised October 2015)
") Using Smoke Modeling Tools for Prescribed Fire Planning and Implementation A Quick Set of Instructions (Revised October 2015) Fire Management Officers (FMOs) in Region 8 are using smoke modeling more often
Using Smoke Modeling Tools for Prescribed Fire Planning and Implementation A Quick Set of Instructions (Revised October 2015) Fire Management Officers (FMOs) in Region 8 are using smoke modeling more often
McIDAS-V Tutorial Displaying Point Observations from ADDE Datasets updated July 2016 (software version 1.6)
") McIDAS-V Tutorial Displaying Point Observations from ADDE Datasets updated July 2016 (software version 1.6) McIDAS-V is a free, open source, visualization and data analysis software package that is the
McIDAS-V Tutorial Displaying Point Observations from ADDE Datasets updated July 2016 (software version 1.6) McIDAS-V is a free, open source, visualization and data analysis software package that is the
User Guide Version 1.2 Paul Kimmens July 2017
 User Guide Version 1.2 Paul Kimmens July 2017 SCSC Windguru User GuideV1_2 Page 1 Introduction The club installed a WindguruStation 2 in July 2017 to provide real time information on wind speed, direction,
1 INTRODUCTION 2 DESCRIPTION OF THE MODELS. In 1989, two models were able to make smog forecasts; the MPA-model and
 The national smog warning system in The Netherlands; a combination of measuring and modelling H. Noordijk Laboratory of Air Research, National Institute of Public Health and Environmental Protection (WFM;,
Air Quality Forecasting Systems: Needs of Computational Resources and Database
 www.bsc.es Air Quality Forecasting Systems: Needs of Computational Resources and Database Dr. José Mª Baldasano, Kim Serradell 253 K deaths in Europe Episodic pollution PM10 Chronic pollution PM2.5 PM1
Gridded Ambient Air Pollutant Concentrations for Southern California, User Notes authored by Beau MacDonald, 11/28/2017
 Gridded Ambient Air Pollutant Concentrations for Southern California, 1995-2014 User Notes authored by Beau, 11/28/2017 METADATA: Each raster file contains data for one pollutant (NO2, O3, PM2.5, and PM10)
AREP GAW. AQ Forecasting
 AQ Forecasting What Are We Forecasting Averaging Time (3 of 3) PM10 Daily Maximum Values, 2001 Santiago, Chile (MACAM stations) 300 Level 2 Pre-Emergency Level 1 Alert 200 Air Quality Standard 150 100
 Contributors: Arlene Fiore 1, Lee Murray 1, Luke Valin 1, Olivia Clifton 1, Jean Guo 1 Author: Melissa Seto 1 Analysis of Wisconsin 2007 High-Ozone event Section 1A: Can satellite NO 2 columns inform us
Orange Visualization Tool (OVT) Manual
 Manual") Orange Visualization Tool (OVT) Manual This manual describes the features of the tool and how to use it. 1. Contents of the OVT Once the OVT is open (the first time it may take some seconds), it should
Orange Visualization Tool (OVT) Manual This manual describes the features of the tool and how to use it. 1. Contents of the OVT Once the OVT is open (the first time it may take some seconds), it should
WindNinja Tutorial 3: Point Initialization
 WindNinja Tutorial 3: Point Initialization 6/27/2018 Introduction Welcome to WindNinja Tutorial 3: Point Initialization. This tutorial will step you through the process of downloading weather station data
Comprehensive Analysis of Annual 2005/2008 Simulation of WRF/CMAQ over Southeast of England
 Comprehensive Analysis of Annual 2005/2008 Simulation of WRF/CMAQ over Southeast of England The 13 th International Conference on Harmonization within Atmospheric Dispersion Modelling for Regulatory Purposes
08-Nov METARs and TAFs are shown in coded and decoded text format under the Airfield information where weather data is available.
 EasyWeather provides a direct weather interface from SA Weather Services to EasyPlan as overlays on your EasyPlan map. This service is available in South Africa only, at this stage. By using your internet
Regional modelling and assessment of atmospheric particulate matter concentrations at rural background locations in Europe
 Regional modelling and assessment of atmospheric particulate matter concentrations at rural background locations in Europe Goran Gašparac 1, Amela Jeričević 2 Prashant Kumar 3 1 Geophysical and Ecological
ECMWF COPERNICUS REPORT. CAMS95e_CERC airtext Air Quality Forecasting Service for Riga
 ECMWF COPERNICUS REPORT Copernicus Atmosphere Monitoring Service Public Final Report CAMS95e_CERC airtext Air Quality Forecasting Service for Riga Issued by: CERC / Amy Stidworthy Date: 02/02/2018 Ref:
Complete Weather Intelligence for Public Safety from DTN
 Complete Weather Intelligence for Public Safety from DTN September 2017 White Paper www.dtn.com / 1.800.610.0777 From flooding to tornados to severe winter storms, the threats to public safety from weather-related
Forecast.io Driver. Installation and Usage Guide. Revision: 1.0 Date: Tuesday, May 20, 2014 Authors: Alan Chow
 Forecast.io Driver Installation and Usage Guide Revision: 1.0 Date: Tuesday, May 20, 2014 Authors: Alan Chow Contents Overview... 2 Features... 3 Usage Scenarios... 4 Change Log... 4 Disclaimer... 4 Driver
Introduction to the College of DuPage NEXLAB Website
 Introduction to the College of DuPage NEXLAB Website The purpose of this lab is to familiarize yourself with our website so that you will have an easier time following along in class and will be able to
Over the course of this unit, you have learned about different
 70 People and Weather TA L K I N G I T O V E R Over the course of this unit, you have learned about different aspects of earth s weather and atmosphere. Atmospheric scientists, climatologists, hydrologists,
CustomWeather Statistical Forecasting (MOS)
") CustomWeather Statistical Forecasting (MOS) Improve ROI with Breakthrough High-Resolution Forecasting Technology Geoff Flint Founder & CEO CustomWeather, Inc. INTRODUCTION Economists believe that 70% of
CustomWeather Statistical Forecasting (MOS) Improve ROI with Breakthrough High-Resolution Forecasting Technology Geoff Flint Founder & CEO CustomWeather, Inc. INTRODUCTION Economists believe that 70% of
Air quality real-time operational forecasting system for Europe: an application of the MM5-CMAQ-EMIMO modelling system
 Air Pollution XIV 75 Air quality real-time operational forecasting system for Europe: an application of the MM5-CMAQ-EMIMO modelling system R. San José 1, J. L. Pérez 1 & R. M. González 2 1 Environmental
Labdisc Activity A Walk in the Park
 Labdisc Activity A Walk in the Park Supporting Labdisc Data Logger, GlobiWorld and GlobiLab Software For Elementary School Science A Walk in the Park Introduction We can find green parks in almost every
Monitoring Extreme Weather Events. February 8, 2010
 Monitoring Extreme Weather Events February 8, 2010 Extensive network of over 800 stations across the Prairies Good coverage across entire agriculture production region Network of networks strategy includes
CMAQ Modeling of Atmospheric Mercury
 CMAQ Modeling of Atmospheric Mercury CMAQ Model Peer Review December 17, 2003 O. Russell Bullock, Jr.* Atmospheric Sciences Modeling Division NOAA - Air Resources Laboratory * On assignment to the National
Solar Resource Mapping in South Africa
 Solar Resource Mapping in South Africa Tom Fluri Stellenbosch, 27 March 2009 Outline The Sun and Solar Radiation Datasets for various technologies Tools for Solar Resource Mapping Maps for South Africa
Central Ohio Air Quality End of Season Report. 111 Liberty Street, Suite 100 Columbus, OH Mid-Ohio Regional Planning Commission
 217 218 Central Ohio Air Quality End of Season Report 111 Liberty Street, Suite 1 9189-2834 1 Highest AQI Days 122 Nov. 217 Oct. 218 July 13 Columbus- Maple Canyon Dr. 11 July 14 London 11 May 25 New Albany
FireFamilyPlus Version 5.0
 FireFamilyPlus Version 5.0 Working with the new 2016 NFDRS model Objectives During this presentation, we will discuss Changes to FireFamilyPlus Data requirements for NFDRS2016 Quality control for data
Numerical simulation of relationship between climatic factors and ground ozone concentration over Kanto area using the MM5/CMAQ Model
 251 Numerical simulation of relationship between climatic factors and ground ozone concentration over Kanto area using the MM5/CMAQ Model Mai Van KHIEM, Ryozo OOKA, Hong HUANG and Hiroshi HAYAMI In recent
AN INTERNATIONAL SOLAR IRRADIANCE DATA INGEST SYSTEM FOR FORECASTING SOLAR POWER AND AGRICULTURAL CROP YIELDS
 AN INTERNATIONAL SOLAR IRRADIANCE DATA INGEST SYSTEM FOR FORECASTING SOLAR POWER AND AGRICULTURAL CROP YIELDS James Hall JHTech PO Box 877 Divide, CO 80814 Email: jameshall@jhtech.com Jeffrey Hall JHTech
Bloomsburg University Weather Viewer Quick Start Guide. Software Version 1.2 Date 4/7/2014
 Bloomsburg University Weather Viewer Quick Start Guide Software Version 1.2 Date 4/7/2014 Program Background / Objectives: The Bloomsburg Weather Viewer is a weather visualization program that is designed
WWRP Implementation Plan Reporting
 WWRP Implementation Plan Reporting This report will form the basis of the WWRP report to the upcoming session of the WMO Commission for Atmospheric Sciences. As you respond to this request please think
AMPS Update June 2016
 AMPS Update June 2016 Kevin W. Manning Jordan G. Powers Mesoscale and Microscale Meteorology Laboratory National Center for Atmospheric Research Boulder, CO 11 th Antarctic Meteorological Observation,
JOINT WMO TECHNICAL PROGRESS REPORT ON THE GLOBAL DATA PROCESSING AND FORECASTING SYSTEM AND NUMERICAL WEATHER PREDICTION RESEARCH ACTIVITIES FOR 2016
 JOINT WMO TECHNICAL PROGRESS REPORT ON THE GLOBAL DATA PROCESSING AND FORECASTING SYSTEM AND NUMERICAL WEATHER PREDICTION RESEARCH ACTIVITIES FOR 2016 New Zealand / Meteorological Service of New Zealand
The Air Quality Model Evaluation International Initiative (AQMEII)
") The Air Quality Model Evaluation International Initiative (AQMEII) Christian Hogrefe 1, Stefano Galmarini 2, Efisio Solazzo 2, Ulas Im 3, Marta Garcia Vivanco 4,5, Augustin Colette 4, and AQMEII modeling
The Air Quality Model Evaluation International Initiative (AQMEII) Christian Hogrefe 1, Stefano Galmarini 2, Efisio Solazzo 2, Ulas Im 3, Marta Garcia Vivanco 4,5, Augustin Colette 4, and AQMEII modeling
14.4 NUMERICAL SIMULATION OF AIR POLLUTION OVER KANTO AREA IN JAPAN USING THE MM5/CMAQ MODEL
 . NUMERICAL SIMULATION OF AIR POLLUTION OVER KANTO AREA IN JAPAN USING THE MM/CMAQ MODEL - COMPARISON OF AIR POLLUTION CONCENTRATION BETWEEN TWO DIFFERENT CLIMATIC DAYS - Hong HUANG*,a, Ryozo OOKA a, Mai
Air Quality Modelling under a Future Climate
 Air Quality Modelling under a Future Climate Rachel McInnes Met Office Hadley Centre Quantifying the impact of air pollution on health - Fri 12th Sep 2014 Crown copyright Met Office Rachel.McInnes@metoffice.gov.uk
CAMS. Vincent-Henri Peuch (ECMWF) Atmosphere Monitoring. Copernicus EU.
 Atmosphere Monitoring. Copernicus EU.") CAMS COPERNICUS ATMOSPHERE M O NITO RING SERVICE Vincent-Henri Peuch (ECMWF) Copernicus EU Copernicus EU Copernicus EU www.copernicus.eu W H A T I S C O P E R N I C U S? Copernicus Copernicus is a flagship
CAMS COPERNICUS ATMOSPHERE M O NITO RING SERVICE Vincent-Henri Peuch (ECMWF) Copernicus EU Copernicus EU Copernicus EU www.copernicus.eu W H A T I S C O P E R N I C U S? Copernicus Copernicus is a flagship
Trends Forecasting. Overview: Objectives: GLEs Addressed: Materials: Activity Procedure:
 Trends Forecasting Overview: How do meteorologists forecast weather? Students learn one of 5 main methods for forecasting weather, use it to create a forecast, and analyze results. Objectives: The student
End of Ozone Season Report
 End of Ozone Season Report Central Ohio: April 1 through October 31, 2016 The Mid-Ohio Regional Planning Commission (MORPC) is part of a network of agencies across the country that issues daily air quality
Supplement of Photochemical grid model implementation and application of VOC, NO x, and O 3 source apportionment
 Supplement of Geosci. Model Dev., 8, 99 114, 2015 http://www.geosci-model-dev.net/8/99/2015/ doi:10.5194/gmd-8-99-2015-supplement Author(s) 2015. CC Attribution 3.0 License. Supplement of Photochemical
New Instruments from GRIMM
 New Instruments from GRIMM Markus Pesch Symposium at Stockholm, 01.11.2016 1 Outline Motivation for new Aerosol measurement devices Objectives for measurements of particle number and sizes GRIMM EDM 665
baltrad Mass media Overview
 48 Mass media Overview Weather information disseminated through mass media, like press, TV, and Internet is intended for its recipients, not for the media themselves. Therefore the addressees of the media
Module 11: Meteorology Topic 5 Content: Weather Maps Notes
 Introduction A variety of weather maps are produced by the National Weather Service and National Oceanographic Atmospheric Administration. These maps are used to help meteorologists accurately predict
Weather Station Data Quality Assessment
 Weather Station Data Quality Assessment Satoshi Hirabayashi Version 1.3 August 17, 2017 The Davey Tree Expert Company, 5 Moon Library, State University of New York, Syracuse, New York 13210, United States
: : User Manual: : - 10 December
 : : User Manual: : - 0 December 06 - : : User Manual: : Table of Contents. Map Control. How to move a map. How to zoom in and out a map 4. How to inquire Ocean Currents. How to inquire predicted current
INVESTIGATION OF SAHARAN DUST TRANSPORT ON THE BASIS OF AEROLOGICAL MEASUREMENTS
 INVESTIGATION OF SAHARAN DUST TRANSPORT ON THE BASIS OF AEROLOGICAL MEASUREMENTS R. TÓTH 1, L. NYITRAI 1 ABSTRACT. Investigation of Saharan dust transport on the basis of aerological measurements. The
Menzel/Matarrese/Puca/Cimini/De Pasquale/Antonelli Lab 2 Ocean Properties inferred from MODIS data June 2006
 Menzel/Matarrese/Puca/Cimini/De Pasquale/Antonelli Lab 2 Ocean Properties inferred from MODIS data June 2006 Table: MODIS Channel Number, Wavelength (µm), and Primary Application Reflective Bands Emissive
Dust prediction models
 Dust prediction models Sara Basart 1 (sara.basart@bsc.es), E. Terradellas 2, E. Cuevas 3, O. Jorba 1, J.M. Baldasano 1 and F. Benincasa 1 1 Earth Sciences Department, BSC, Barcelona, Spain 2 AEMET, Barcelona,
WAFS_Word. 2. Menu. 2.1 Untitled Slide
 WAFS_Word 2. Menu 2.1 Untitled Slide Published by Articulate Storyline 1. Introduction 1.1 Introduction Notes: As you will probably be aware, the traditional significant weather forecasts, usually seen
Remote sensing data assimilation in WRF-UCM mesoscale model: Madrid case study
 Air Pollution XVIII 15 Remote sensing data assimilation in WRF-UCM mesoscale model: case study R. San José 1, J. L. Pérez 1, J. L. Morant 1 & R. M. González 2 1 Environmental Software and Modelling Group,
Incorporating Space-borne Observations to Improve Biogenic Emission Estimates in Texas (Project )
") Incorporating Space-borne Observations to Improve Biogenic Emission Estimates in Texas (Project 14-017) Arastoo Pour Biazar, Richard T. McNider, Andrew White University of Alabama in Huntsville Daniel
Incorporating Space-borne Observations to Improve Biogenic Emission Estimates in Texas (Project 14-017) Arastoo Pour Biazar, Richard T. McNider, Andrew White University of Alabama in Huntsville Daniel
WeatherWatcher ACP. Astronomers Control Panel (V4 or >) Ambient Virtual Weather Station (Pro or Internet editions) ASCOM platform v4.
 Ambient Virtual Weather Station (Pro or Internet editions) ASCOM platform v4.") WeatherWatcher ACP Software This is a minimum equipment list: Astronomers Control Panel (V4 or >) Ambient Virtual Weather Station (Pro or Internet editions) ASCOM platform v4.1 or higher Hardware Weather
WeatherWatcher ACP Software This is a minimum equipment list: Astronomers Control Panel (V4 or >) Ambient Virtual Weather Station (Pro or Internet editions) ASCOM platform v4.1 or higher Hardware Weather
GPS Worldwide Laboratory: a community of knowledge-seekers spanning the globe
 Laboratory B: (predicting and verifying satellite visibility) Lab Date: 1 November 2014 1 day depending on your time zone). YOU MUST DO THIS PARTICULAR LAB ON THE SPECIFIED DAY. Lab Goals: Predict when
Assessment of Kalman filter bias-adjustment technique to improve the simulation of ground-level Ozone over Spain
 Assessment of Kalman filter bias-adjustment technique to improve the simulation of ground-level Ozone over Spain V. Sicardi *, J. Ortiz, A. Rincón, O. Jorba, M.T. Pay, S. Gassó,, J.M. Baldasano, [] {Barcelona
Department of Meteorology University of Nairobi. Laboratory Manual. Micrometeorology and Air pollution SMR 407. Prof. Nzioka John Muthama
 Department of Meteorology University of Nairobi Laboratory Manual Micrometeorology and Air pollution SMR 407 Prof. Nioka John Muthama Signature Date December 04 Version Lab : Introduction to the operations
Responsibilities of Harvard Atmospheric Chemistry Modeling Group
 Responsibilities of Harvard Atmospheric Chemistry Modeling Group Loretta Mickley, Lu Shen, Daniel Jacob, and Rachel Silvern 2.1 Objective 1: Compile comprehensive air pollution, weather, emissions, and
Short term PM 10 forecasting: a survey of possible input variables
 Short term PM 10 forecasting: a survey of possible input variables J. Hooyberghs 1, C. Mensink 1, G. Dumont 2, F. Fierens 2 & O. Brasseur 3 1 Flemish Institute for Technological Research (VITO), Belgium
A new quantitative smoke forecasting system for Victoria
 A new quantitative smoke forecasting system for Victoria Non-peer reviewed research proceedings from the Bushfire and Natural Hazards CRC & AFAC conference Sydney, 4 6 September 2017 Monica Long 1, Alan
The Atmosphere and Atmospheric Energy Chapter 3 and 4
 The Atmosphere and Atmospheric Energy Chapter 3 and 4 Size of the Earth s Atmosphere Atmosphere produced over 4.6 billion years of development Protects us from radiation Completely surrounds the earth
STORM Team Mission Day Instructions
 Mission Day Instructions Overview Solar weather impacts the space station in much the same way as our weather impacts the earth. The difference is that solar weather can include X- Rays and protons from
AIRQUEST Annual Report and State of the Model
 AIRQUEST Annual Report and State of the Model Brian Lamb 1, Serena Chung 1, Farren Herron-Thorpe 2 and Joseph Vaughan 1 1 Laboratory for Atmospheric Research, Washington State University, Pullman, W, USA
Areas of the World with high Insolation
 Areas of the World with high Insolation 22 /43 Africa Annual Average Global Horizontal Solar Radiation Map 19 Jul 2006 A map depicting model estimates of monthly average daily total radiation using inputs
Using the FCMQ`s snowmobile trail interactive map
 Using the FCMQ`s snowmobile trail interactive map Recommended browsers: Google Chrome, Mozilla Firefox or Internet Explorer 10 or newer. The interactive map is compatible with any type of mobile device
Utilization of Geostationary Satellite Observations for Air Quality Modeling During 2013 Discover-AQ Texas Campaign
 Utilization of Geostationary Satellite Observations for Air Quality Modeling During 2013 Discover-AQ Texas Campaign Arastoo Pour Biazar 1, Andrew White 1, Daniel Cohan 2, Rui Zhang 2, Maudood Khan 1, Bright
OECD QSAR Toolbox v.4.1. Step-by-step example for predicting skin sensitization accounting for abiotic activation of chemicals
 OECD QSAR Toolbox v.4.1 Step-by-step example for predicting skin sensitization accounting for abiotic activation of chemicals Background Outlook Objectives The exercise Workflow 2 Background This is a
The WMO Global Basic Observing Network (GBON)
") The WMO Global Basic Observing Network (GBON) A WIGOS approach to securing observational data for critical global weather and climate applications Robert Varley and Lars Peter Riishojgaard, WMO Secretariat,
The WMO Global Basic Observing Network (GBON) A WIGOS approach to securing observational data for critical global weather and climate applications Robert Varley and Lars Peter Riishojgaard, WMO Secretariat,
inaturalist Training AOP inaturalist Training May 21, 2016 Slide 1
 inaturalist Training AOP inaturalist Training May 21, 2016 Slide 1 What is inaturalist? inaturalist is a free tool that allows people to record, share, and discuss their observations inaturalist is designed
Quick Reference Manual. Ver. 1.3
 Quick Reference Manual Ver. 1.3 1 EXASITE Voyage EXSITE Voyage is a web-based communication tool designed to support the following users; Ship operators who utilize Optimum Ship Routing (OSR) service in
Account Setup. STEP 1: Create Enhanced View Account
 SpyMeSatGov Access Guide - Android DigitalGlobe Imagery Enhanced View How to setup, search and download imagery from DigitalGlobe utilizing NGA s Enhanced View license Account Setup SpyMeSatGov uses a
Setting a Straight Course RCA Weather Protocol
 Setting a Straight Course Saturday, February 25, 2006 Presenter: Andrew Cartwright, Rowing Canada Umpire Facilitator: Wayne Van Osterhout 1 2 3 WIND WAVES WEATHER & WOWING 4 written by Rob Millikin approved
Regional Production, Quarterly report on the daily analyses and forecasts activities, and verification of the CHIMERE performances
 ECMWF COPERNICUS REPORT Copernicus Atmosphere Monitoring Service Regional Production, Quarterly report on the daily analyses and forecasts activities, and verification of the CHIMERE performances September
RSMC WASHINGTON USER'S INTERPRETATION GUIDELINES ATMOSPHERIC TRANSPORT MODEL OUTPUTS
 RSMC WASHINGTON USER'S INTERPRETATION GUIDELINES ATMOSPHERIC TRANSPORT MODEL OUTPUTS -Version 2.0- (January 2007) 1. Introduction In the context of current agreements between the National Oceanic and Atmospheric
Let's Make Our Cities Breathable BECAUSE CLEAN AIR BELONGS TO EVERYONE.
 Let's Make Our Cities Breathable BECAUSE CLEAN AIR BELONGS TO EVERYONE. Clean Air is a Human Right that Everyone Should be Entitled to Making cities more breathable starts by measuring, analyzing and understanding
K D A A M P L I F I E R S F I R M W A R E U S E R G U I D E
 K D A A M P L I F I E R S F I R M W A R E U S E R G U I D E T A B L E O F C O N T E N T S S E C T I O N 1 : P R E PA R I N G Y O U R F I L E S Via Network Router 3 S E C T I O N 2 : A C C E S S I N G T
Better Decisions for Your Business Drive your company forward with ultra-precise weather forecasts
 Better Decisions for Your Business Drive your company forward with ultra-precise weather forecasts Problem: Inaccurate Forecasts, Especially over Mountainous Regions Which weather data are you using? What
ADVANCED WEATHER STATION ARCHIVE
 03 March, 2018 ADVANCED WEATHER STATION ARCHIVE Document Filetype: PDF 320.04 KB 0 ADVANCED WEATHER STATION ARCHIVE These sales have gotten sweeter. Sold by My Quick Buy. $83.28 $66.62. Get the perfect
Urban Integrated Services and Multi-Hazard Early Warning Systems
 WMO for UN New Urban Agenda Urban Integrated Services and Multi-Hazard Early Warning Systems Gregory R. Carmichael WMO WMO Priority: Urbanization - Research and services for megacities and large urban
The Colorado Agricultural no Meteorological Network (CoAgMet) and Crop ET Reports
 and Crop ET Reports") C R O P S E R I E S Irrigation Quick Facts The Colorado Agricultural no. 4.723 Meteorological Network (CoAgMet) and Crop ET Reports A.A. Andales, T. A. Bauder and N. J. Doesken 1 (10/09) CoAgMet is a network
C R O P S E R I E S Irrigation Quick Facts The Colorado Agricultural no. 4.723 Meteorological Network (CoAgMet) and Crop ET Reports A.A. Andales, T. A. Bauder and N. J. Doesken 1 (10/09) CoAgMet is a network
12/07/2017. Flash Flood Warning Service, an advanced approach towards flood resilient cities Floodplain Management Association Conference, Newcastle
 12/07/2017 Worldwide problem: Flash Floods Flash Floods are a Global Problem Flash Flood Warning Service, an advanced approach towards flood resilient cities Floodplain Management Association Conference,
Introducing AOPA FlyQ EFB
 Hi, just a reminder that you're receiving this email because you activated AOPA FlyQ EFB. Don't forget to add FlyQEFBSupport@seattleavionics.com to your address book so we'll be sure to land in your inbox!
Store User Guide - Forecasting. Jimmy John s
 Store User Guide - Forecasting Jimmy John s All rights reserved. This publication contains proprietary information of HotSchedules. No part of this publication may be reproduced, stored in a retrieval
OECD QSAR Toolbox v.4.1. Tutorial illustrating new options for grouping with metabolism
 OECD QSAR Toolbox v.4.1 Tutorial illustrating new options for grouping with metabolism Outlook Background Objectives Specific Aims The exercise Workflow 2 Background Grouping with metabolism is a procedure
Assembly and Operation Manual. April 2016
 Assembly and Operation Manual April 2016 Table of Contents What is in the OurWeather Box? 3 Step by Step Assembly 13 Building the Weather Sensors 18 Testing the OurWeather Weather Station 28 Power Up OurWeather