Indicator Trends for Canadian Climate Changes during the Last 60 to 140 Years
|
|
|
- Lilian Watkins
- 5 years ago
- Views:
Transcription
1 Indicator Trends for Canadian Climate Changes during the Last 60 to 140 Years Presented to CPANS, Edmonton Luncheon Forum by Kurt Hansen, P. Eng. President, Green Inc., Calgary, Alberta 6 March 2015
2 Acknowledgements My sincere thanks to Dr. Stanley Hall and Klym Bolechowsky for suggestions and assistance This presentation is dedicated to Marie & Edith both diligent weather-observing Danish farmers (from 1890 to 1974), who inspired me about weather conditions 2
3 Overview Stations & periods of records (POR) Climate change (CC) indicators Temperature related indicator findings Precipitation related indicator findings Conclusions from findings 3

4 Weather Station Locations 4
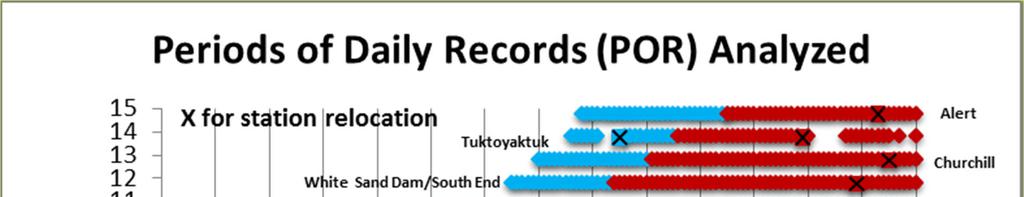
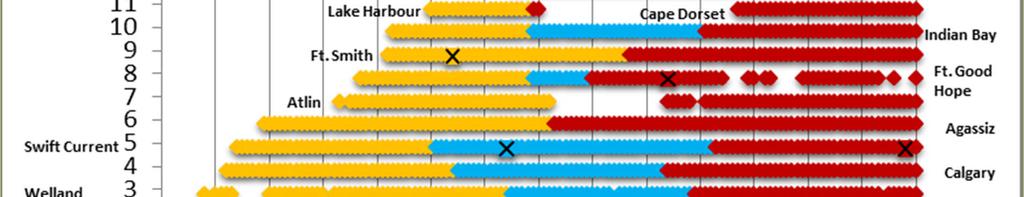

5 Periods of Temperature Records (POR) (enginering daily data) 5
6 Climate Change Indicators Temperature related trends: Extreme temperatures (indicators for deep freezes & heat waves) Mean annual & seasonal temperatures Days between absolute min and max of cumulative degree days, with carry-over into next year (relative to 0 C) Precipitation related trends: Average annual precipitation (total & snow) Extreme drought & drench (D&D) rain to temperature ratio indicators 6
7 Indicator Trend Metrics Years for increasing (+) or decreasing (-) trend change of: 1 C (and the related variable: Cdays relative to 0 C) 1 day duration, between absolute plus to minus seasonal temperature changes (cumulative min and max Cday values) 10 mm rain (and equivalent 10 cm snow) APR-SEP growing period: rain to temperature ratio (increment unit of mm Cday 10% average summer pan evaporation) 7
8 TRENDS IN TEMPERATURE RELATED INDICATORS EXAMPLES & SUMMARIES 8

9 Approach: Extreme Min Temperature Indicator 9


10 Example: Extreme Annual Temperatures (engineering daily data) 10


11 Summary: Extreme Annual Temperatures (engineering daily data) 11
 and Autumn & Winter (AW)")
12 Approach: Indicators for Seasonal Mean Temperatures (Spring & Summer (SS) and Autumn & Winter (AW) periods) 12


13 Calgary IAP Example: Mean SS, Annual & AW Temperatures (linear and 3rd power polynomial trends) 13
14 Other Examples: Mean SS, Annual & AW Temperatures (3rd power polynomial trends) 14
 (3rd power polynomial")
15 Summary: Warming Trends (ER & RR) (3rd power polynomial trends) 15
16 Summary: Recent versus Early Warming Trends (3rd power polynomial trends) 16

17 Summary: Recent versus Early SS & AW Period Trends 17
18 Example: Engineering Daily versus Homogenized Monthly Data (mean annual temperature trends) 18
19 Summary: Recent versus Early Warming Trends (Original (ORG) vs homogenized (HOM) data) 19
20 TRENDS IN PRECIPITATION RELATED INDICATORS EXAMPLES & SUMMARIES 20

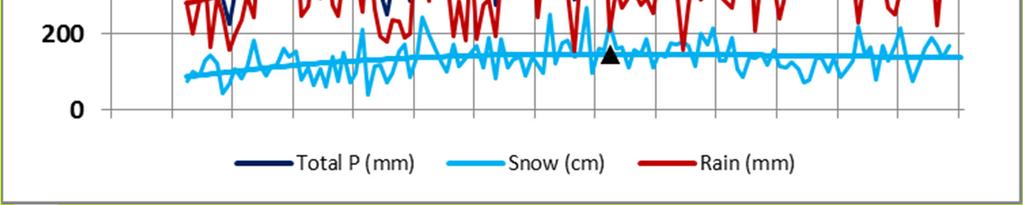
21 Example: Annual Total Precipitation & Snow 21

22 Summary: Annual Total Precipitation & Snow (homogenized data) 22
")
23 Approach: APR-SEP Precipitation Event Indicators (15 to 45 annual events event percentiles for each year) 23

24 Example: Consecutive Dry Days 24
")
25 Summary: Consecutive Dry Days (90th Percentile) 25
 Event")
 & homogenized")
26 Example: Rain to Temperature (D&D) Event Ratio Trends (original (percentiles) & homogenized (average) data) 26
27 Summary: Rain to Temperature (D&D) Event Ratio Trends (years for 0.025mm/Cday change) th Percentiles Agassiz 75th Percentiles St. John's years Charlottetown mm/cday mm/cday Swift Current 1903 Churchill White Sand Dam Ft. Smith Ft. Good Hope years 1873 Charlottetown Swift Current Ft. Smith St. -6 years years th Percentiles th Percentiles Agassiz White Sand +51 years mm/cday mm/cday Indian Bay Welland years Calgary Indian +13 years years Ft. Good Hope
28 Conclusions 1. Past trend has been longer, warmer spring & summer periods versus shorter, warmer autumn and winter periods 2. Moderate cooling periods of years duration occurred from 1913 to Otherwise more than moderate warming periods 3. Recent decades of annual rates of warming range from 10 to 65 years for a 1 Celcius increase in annual mean temperature (versus 18 to 92 years for early decades of the records) 4. Overall trend at two-thirds of the stations is toward more Total Annual Precipitation (7 to 26 years for a 10 mm increase) 6. Recent trend in the spring & summer rain precipitation to temperature event ratio is toward drought at two-thirds of the stations (versus 50/50 trend toward drench ) - however at slower trend decreases than during earlier record periods 28
29 Thank you for your attention Questions are much welcomed 29
CLIMATE OVERVIEW. Thunder Bay Climate Overview Page 1 of 5
 CLIMATE OVERVIEW The climate in the Thunder Bay area is typical of a mid-latitude inland location with a Great Lake Moderating influence. The moderating effect of Lake Superior results in cooler summer
A summary of the weather year based on data from the Zumwalt weather station
 ZUMWALT PRAIRIE WEATHER 2016 A summary of the weather year based on data from the Zumwalt weather station Figure 1. An unusual summer storm on July 10, 2016 brought the second-largest precipitation day
Drought Characterization. Examination of Extreme Precipitation Events
 Drought Characterization Examination of Extreme Precipitation Events Extreme Precipitation Events During the Drought For the drought years (1999-2005) daily precipitation data was analyzed to find extreme
September 2018 Weather Summary West Central Research and Outreach Center Morris, MN
 September 2018 Weather Summary The mean temperature for September was 60.6 F, which is 1.5 F above the average of 59.1 F (1886-2017). The high temperature for the month was 94 F on September 16 th. The
CLIMATE RESILIENCE FOR ALBERTA MUNICIPALITIES CLIMATE PROJECTIONS NORTHERN ALBERTA. Dr. Mel Reasoner Reasoner Environmental Consulting
 CLIMATE RESILIENCE FOR ALBERTA MUNICIPALITIES CLIMATE PROJECTIONS NORTHERN ALBERTA Dr. Mel Reasoner Reasoner Environmental Consulting Probability of occurrence Increase in Mean Temperature & Variance Less
November 2018 Weather Summary West Central Research and Outreach Center Morris, MN
 November 2018 Weather Summary Lower than normal temperatures occurred for the second month. The mean temperature for November was 22.7 F, which is 7.2 F below the average of 29.9 F (1886-2017). This November
CLIMATE RESILIENCE FOR ALBERTA MUNICIPALITIES CLIMATE PROJECTIONS SOUTHERN ALBERTA. Dr. Mel Reasoner Reasoner Environmental Consulting
 CLIMATE RESILIENCE FOR ALBERTA MUNICIPALITIES CLIMATE PROJECTIONS SOUTHERN ALBERTA Dr. Mel Reasoner Reasoner Environmental Consulting Probability of occurrence Increase in Mean Temperature & Variance Less
Climate Dataset: Aitik Closure Project. November 28 th & 29 th, 2018
 1 Climate Dataset: Aitik Closure Project November 28 th & 29 th, 2018 Climate Dataset: Aitik Closure Project 2 Early in the Closure Project, consensus was reached to assemble a long-term daily climate
Climate of Columbus. Aaron Wilson. Byrd Polar & Climate Research Center State Climate Office of Ohio.
 Climate of Columbus Aaron Wilson Byrd Polar & Climate Research Center http://bpcrc.osu.edu/greenteam Overview Historical Climatology Climate Change & Impacts Projected Changes Summary 2 Historical Climatology
Extremes Events in Climate Change Projections Jana Sillmann
 Extremes Events in Climate Change Projections Jana Sillmann Max Planck Institute for Meteorology International Max Planck Research School on Earth System Modeling Temperature distribution IPCC (2001) Outline
Minnesota s Climatic Conditions, Outlook, and Impacts on Agriculture. Today. 1. The weather and climate of 2017 to date
 Minnesota s Climatic Conditions, Outlook, and Impacts on Agriculture Kenny Blumenfeld, State Climatology Office Crop Insurance Conference, Sep 13, 2017 Today 1. The weather and climate of 2017 to date
2016 Irrigated Crop Production Update
 2016 Irrigated Crop Production Update Mapping Climate Trends and Weather Extremes Across Alberta for the Period 1950-2010 Stefan W. Kienzle Department of Geography University of Lethbridge, Alberta, Canada
Champaign-Urbana 2000 Annual Weather Summary
 Champaign-Urbana 2000 Annual Weather Summary ILLINOIS STATE WATER SURVEY 2204 Griffith Dr. Champaign, IL 61820 wxobsrvr@sws.uiuc.edu Maria Peters, Weather Observer January: January started on a mild note,
Will a warmer world change Queensland s rainfall?
 Will a warmer world change Queensland s rainfall? Nicholas P. Klingaman National Centre for Atmospheric Science-Climate Walker Institute for Climate System Research University of Reading The Walker-QCCCE
Sierra Weather and Climate Update
 Sierra Weather and Climate Update 2014-15 Kelly Redmond Western Regional Climate Center Desert Research Institute Reno Nevada Yosemite Hydroclimate Workshop Yosemite Valley, 2015 October 8-9 Percent of
Impacts of Changes in Extreme Weather and Climate on Wild Plants and Animals. Camille Parmesan Integrative Biology University of Texas at Austin
 Impacts of Changes in Extreme Weather and Climate on Wild Plants and Animals Camille Parmesan Integrative Biology University of Texas at Austin Species Level: Climate extremes determine species distributions
2003 Moisture Outlook
 2003 Moisture Outlook Nolan Doesken and Roger Pielke, Sr. Colorado Climate Center Prepared by Tara Green and Odie Bliss http://climate.atmos.colostate.edu Through 1999 Through 1999 Fort Collins Total Water
Storm and Runoff Calculation Standard Review Snowmelt and Climate Change
 Storm and Runoff Calculation Standard Review Snowmelt and Climate Change Presented by Don Moss, M.Eng., P.Eng. and Jim Hartman, P.Eng. Greenland International Consulting Ltd. Map from Google Maps TOBM
A Simplified Model to Predict Frost Penetration for Manitoba Soils
 A Simplified Model to Predict Frost Penetration for Manitoba Soils Haithem Soliman, M.Sc. PHD Student Department of Civil Engineering University of Manitoba Email: umsolimh@cc.umanitoba.ca Said Kass, P.Eng.
Chiang Rai Province CC Threat overview AAS1109 Mekong ARCC
 Chiang Rai Province CC Threat overview AAS1109 Mekong ARCC This threat overview relies on projections of future climate change in the Mekong Basin for the period 2045-2069 compared to a baseline of 1980-2005.
Colorado s 2003 Moisture Outlook
 Colorado s 2003 Moisture Outlook Nolan Doesken and Roger Pielke, Sr. Colorado Climate Center Prepared by Tara Green and Odie Bliss http://climate.atmos.colostate.edu How we got into this drought! Fort
Chapter outline. Reference 12/13/2016
 Chapter 2. observation CC EST 5103 Climate Change Science Rezaul Karim Environmental Science & Technology Jessore University of science & Technology Chapter outline Temperature in the instrumental record
Colorado State University, Fort Collins, CO Weather Station Monthly Summary Report
 Colorado State University, Fort Collins, CO Weather Station Monthly Summary Report Month: January Year: 2019 Temperature: Mean T max was 47.2 F which is 3.0 above the 1981-2010 normal for the month. This
Climate change projections for Ontario: an updated synthesis for policymakers and planners
 Ministry of Natural Resources and Forestry Climate change projections for Ontario: an updated synthesis for policymakers and planners Shannon Fera and Adam Hogg Ontario Ministry of Natural Resources and
Local Climate Change Impacts for Central Illinois
 Local Climate Change Impacts for Central Illinois Molly Woloszyn Extension Climatologist Midwestern Regional Climate Center & Illinois-Indiana Sea Grant Urbana Sustainability Advisory Commission February
Drought in Southeast Colorado
 Drought in Southeast Colorado Nolan Doesken and Roger Pielke, Sr. Colorado Climate Center Prepared by Tara Green and Odie Bliss http://climate.atmos.colostate.edu 1 Historical Perspective on Drought Tourism
The Colorado Drought of 2002 in Perspective
 The Colorado Drought of 2002 in Perspective Colorado Climate Center Nolan Doesken and Roger Pielke, Sr. Prepared by Tara Green and Odie Bliss http://climate.atmos.colostate.edu Known Characteristics of
Average Weather In March For Fukuoka, Japan
 Average Weather In March For Fukuoka, Japan Location This report describes the typical weather at the Fukuoka Airport (Fukuoka, Japan) weather station over the course of an average March. It is based on
The Climate of Oregon Climate Zone 5 High Plateau
 105 E55 Unbound issue i". 9 13oes not circulate CZe Special Report 917 May 1993 The Climate of Oregon Climate Zone 5 Property of OREGON STATE UNIVERSITY Library Serials Corvallis, OR 97331-4503 Agricultural
Climate Change or Climate Variability?
 Climate Change or Climate Variability? Key Concepts: Greenhouse Gas Climate Climate change Climate variability Climate zones Precipitation Temperature Water cycle Weather WHAT YOU WILL LEARN 1. You will
Fluid Circulation Review. Vocabulary. - Dark colored surfaces absorb more energy.
 Fluid Circulation Review Vocabulary Absorption - taking in energy as in radiation. For example, the ground will absorb the sun s radiation faster than the ocean water. Air pressure Albedo - Dark colored
Great Lakes Update. Volume 188: 2012 Annual Summary
 Great Lakes Update Volume 188: 2012 Annual Summary Background The U.S. Army Corps of Engineers (USACE) tracks the water levels of each of the Great Lakes. This report highlights hydrologic conditions of
- 1 - DROUGHT-LIMITED WATER SUPPLY AND DEMAND FOR ST. MARY LAKE AND LAKE MAXWELL, SALT SPRING ISLAND, BRITISH COLUMBIA by
 - 1 - DROUGHT-LIMITED WATER SUPPLY AND DEMAND FOR ST. MARY LAKE AND LAKE MAXWELL, SALT SPRING ISLAND, BRITISH COLUMBIA by Donald O. Hodgins, Ph.D.,P.Eng. January 218 Summary for Policymakers The maximum
Champaign-Urbana 1999 Annual Weather Summary
 Champaign-Urbana 1999 Annual Weather Summary ILLINOIS STATE WATER SURVEY 2204 Griffith Dr. Champaign, IL 61820 wxobsrvr@sws.uiuc.edu Maria Peters, Weather Observer A major snowstorm kicked off the new
Weather and Climate Summary and Forecast Winter
 Weather and Climate Summary and Forecast Winter 2016-17 Gregory V. Jones Southern Oregon University February 7, 2017 What a difference from last year at this time. Temperatures in January and February
Current Climate Trends and Implications
 Current Climate Trends and Implications Dr. Mark Seeley Professor emeritus Department of Soil, Water, and Climate University of Minnesota St Paul, MN 55108 Crop Insurance Conference September 12, 2018
Climate also has a large influence on how local ecosystems have evolved and how we interact with them.
 The Mississippi River in a Changing Climate By Paul Lehman, P.Eng., General Manager Mississippi Valley Conservation (This article originally appeared in the Mississippi Lakes Association s 212 Mississippi
Seasonal and Spatial Patterns of Rainfall Trends on the Canadian Prairie
 Seasonal and Spatial Patterns of Rainfall Trends on the Canadian Prairie H.W. Cutforth 1, O.O. Akinremi 2 and S.M. McGinn 3 1 SPARC, Box 1030, Swift Current, SK S9H 3X2 2 Department of Soil Science, University
Coupling Climate to Clouds, Precipitation and Snow
 Coupling Climate to Clouds, Precipitation and Snow Alan K. Betts akbetts@aol.com http://alanbetts.com Co-authors: Ray Desjardins, Devon Worth Agriculture and Agri-Food Canada Shusen Wang and Junhua Li
Three main areas of work:
 Task 2: Climate Information 1 Task 2: Climate Information Three main areas of work: Collect historical and projected weather and climate data Conduct storm surge and wave modeling, sea-level rise (SLR)
Arctic Climate Change. Glen Lesins Department of Physics and Atmospheric Science Dalhousie University Create Summer School, Alliston, July 2013
 Arctic Climate Change Glen Lesins Department of Physics and Atmospheric Science Dalhousie University Create Summer School, Alliston, July 2013 When was this published? Observational Evidence for Arctic
1.Introduction 2.Relocation Information 3.Tourism 4.Population & Demographics 5.Education 6.Employment & Income 7.City Fees & Taxes 8.
 1.Introduction 2.Relocation Information 3.Tourism 4.Population & Demographics 5.Education 6.Employment & Income 7.City Fees & Taxes 8.Recreation & Activities 9.Climate Data 10.Economic Development History
UPPLEMENT A COMPARISON OF THE EARLY TWENTY-FIRST CENTURY DROUGHT IN THE UNITED STATES TO THE 1930S AND 1950S DROUGHT EPISODES
 UPPLEMENT A COMPARISON OF THE EARLY TWENTY-FIRST CENTURY DROUGHT IN THE UNITED STATES TO THE 1930S AND 1950S DROUGHT EPISODES Richard R. Heim Jr. This document is a supplement to A Comparison of the Early
Minnesota s Changing Climate: Winter Impacts
 Minnesota s Changing Climate: Winter Impacts Dr. Mark Seeley Climatologist/Meteorologist Dept of Soil, Water, and Climate University of Minnesota 15 th Annual Road Salt Symposium Minnesota Landscape Arboretum
METEOROLOGICAL SERVICE JAMAICA CLIMATE BRANCH
 METEOROLOGICAL SERVICE JAMAICA CLIMATE BRANCH PRELIMINARY MONTHLY RAINFALL SUMMARY FOR JUNE 2016 Introduction This rainfall summary is prepared by the Climate Branch of the Meteorological Service, Jamaica.
SEASONAL AND DAILY TEMPERATURES
 1 2 3 4 5 6 7 8 9 10 11 12 SEASONAL AND DAILY TEMPERATURES Chapter 3 Earth revolves in elliptical path around sun every 365 days. Earth rotates counterclockwise or eastward every 24 hours. Earth closest
Climate Variability. Eric Salathé. Climate Impacts Group & Department of Atmospheric Sciences University of Washington. Thanks to Nathan Mantua
 Climate Variability Eric Salathé Climate Impacts Group & Department of Atmospheric Sciences University of Washington Thanks to Nathan Mantua Northwest Climate: the mean Factors that influence local/regional
Instructions for Running the FVS-WRENSS Water Yield Post-processor
 Instructions for Running the FVS-WRENSS Water Yield Post-processor Overview The FVS-WRENSS post processor uses the stand attributes and vegetative data from the Forest Vegetation Simulator (Dixon, 2002)
Foralps 2nd conference. Assessment of Lombardy's climate in the last century: data analysis, methodologies and indices
 Alessia Marchetti, Angela Sulis Assessment of Lombardy's climate in the last century: data Contents The dataset The daily indices analysis Some preliminary monthly data indices analysis Some key points
CLIMATE. UNIT TWO March 2019
 CLIMATE UNIT TWO March 2019 OUTCOME 9.2.1Demonstrate an understanding of the basic features of Canada s landscape and climate. identify and locate major climatic regions of Canada explain the characteristics
ZUMWALT WEATHER AND CLIMATE ANNUAL REPORT ( )
") ZUMWALT WEATHER AND CLIMATE ANNUAL REPORT (26-29) FINAL DRAFT (9 AUGUST 21) J.D. HANSEN 1, R.V. TAYLOR 2, AND V.S. JANSEN 3 INTRODUCTION The Zumwalt Prairie in northeastern Oregon is a unique grassland
ZUMWALT WEATHER AND CLIMATE ANNUAL REPORT (26-29) FINAL DRAFT (9 AUGUST 21) J.D. HANSEN 1, R.V. TAYLOR 2, AND V.S. JANSEN 3 INTRODUCTION The Zumwalt Prairie in northeastern Oregon is a unique grassland
Seasonal Climate Forecast August October 2013 Verification (Issued: November 17, 2013)
") Seasonal Climate Forecast August October 2013 Verification (Issued: November 17, 2013) Note: This product is published by the Oregon Department of Agriculture (ODA), in cooperation with the Oregon Department
Seasonal Climate Forecast August October 2013 Verification (Issued: November 17, 2013) Note: This product is published by the Oregon Department of Agriculture (ODA), in cooperation with the Oregon Department
Alaska Statewide Climate Summary June 2018
 Alaska Statewide Climate Summary June 2018 The following report provides an overview of temperature and precipitation for June 2018. The report is based on preliminary data from selected weather stations
Seasonal Climate Forecast May July 2013 Verification (Issued: August 15, 2013)
") Seasonal Climate Forecast May July 2013 Verification (Issued: August 15, 2013) Note: This product is published by the Oregon Department of Agriculture (ODA), in cooperation with the Oregon Department of
Seasonal Climate Forecast May July 2013 Verification (Issued: August 15, 2013) Note: This product is published by the Oregon Department of Agriculture (ODA), in cooperation with the Oregon Department of
Weather & Climate of Virginia
 Weather & Climate of Virginia Robert E. Davis Professor of Climatology Dept. of Environmental Sciences University of Virginia Email: red3u@virginia.edu Rivanna Master Naturalists March 14, 2017 Arctic
Trends in Frost Dates, Frost Free Duration and Seasonal Temperature on the Canadian Prairie
 1 Trends in Frost Dates, Frost Free Duration and Seasonal Temperature on the Canadian Prairie Herb Cutforth 1, Ted O Brien 2, Jason Tuchelt 2 and Rick Rickwood 2 1 SPARC, Agriculture and Agri-Food Canada,
The Climate of Oregon Climate Zone 4 Northern Cascades
 /05 E55 Unbound issue No. 9/ is Does not circulate Special Report 916 May 1993 The Climate of Oregon Climate Zone 4 Property of OREGON STATE UNIVERSITY Library Serials Corvallis, OR 97331-4503 Agricultural
Colorado State University, Fort Collins, CO Weather Station Monthly Summary Report
 Colorado State University, Fort Collins, CO Weather Station Monthly Summary Report Month: December Year: 2016 Temperature: Mean T max was 39.7 F which is 3.1 below the 1981-2010 normal for the month. This
Local Ctimatotogical Data Summary White Hall, Illinois
 SWS Miscellaneous Publication 98-5 STATE OF ILLINOIS DEPARTMENT OF ENERGY AND NATURAL RESOURCES Local Ctimatotogical Data Summary White Hall, Illinois 1901-1990 by Audrey A. Bryan and Wayne Armstrong Illinois
CLIMATE CHANGE IMPACTS ON ICE REGIME OF THE RIVERS IN MONGOLIA
 Ice in the Environment: Proceedings of the 16th IAHR International Symposium on Ice Dunedin, New Zealand, 2nd 6th December 2002 International Association of Hydraulic Engineering and Research CLIMATE CHANGE
Manitoba s Future Climate
 Climate Change Connection: Severe Weather in MB Workshop, 2 April 2013 Manitoba s Future Climate Danny Blair Associate Dean of Science, University of Winnipeg Professor of Geography Co-Chair, MB s Climate
Marche Region Climate Analysis by Danilo Tognetti 1
 Marche Region. 2016 Climate Analysis by Danilo Tognetti 1 With the contribution of eight consecutive high monthly temperature records set from January to August, and the remainder of the months ranking
Effect of El Niño Southern Oscillation (ENSO) on the number of leaching rain events in Florida and implications on nutrient management
 on the number of leaching rain events in Florida and implications on nutrient management") Effect of El Niño Southern Oscillation (ENSO) on the number of leaching rain events in Florida and implications on nutrient management C. Fraisse 1, Z. Hu 1, E. H. Simonne 2 May 21, 2008 Apopka, Florida
Effect of El Niño Southern Oscillation (ENSO) on the number of leaching rain events in Florida and implications on nutrient management C. Fraisse 1, Z. Hu 1, E. H. Simonne 2 May 21, 2008 Apopka, Florida
Trends of Drought in the Canadian Prairies
 Trends of Drought in the Canadian Prairies Kit Szeto 1, Eva Mekis 1, Seung-Ki Min 1, Walter Skinner 1, Lei Wen 2, Charles Lin 1 and Stefan De Young 1 1 Environment Canada 2 McGill University Motivations
Presentation Overview. Southwestern Climate: Past, present and future. Global Energy Balance. What is climate?
 Southwestern Climate: Past, present and future Mike Crimmins Climate Science Extension Specialist Dept. of Soil, Water, & Env. Science & Arizona Cooperative Extension The University of Arizona Presentation
Average Weather For Coeur d'alene, Idaho, USA
 Average Weather For Coeur d'alene, Idaho, USA Information courtesy of weatherspark.com Location This report describes the typical weather at the Coeur d'alene Air Terminal (Coeur d'alene, Idaho, United
Champaign-Urbana 2001 Annual Weather Summary
 Champaign-Urbana 2001 Annual Weather Summary ILLINOIS STATE WATER SURVEY 2204 Griffith Dr. Champaign, IL 61820 wxobsrvr@sws.uiuc.edu Maria Peters, Weather Observer January: After a cold and snowy December,
What Determines the Amount of Precipitation During Wet and Dry Years Over California?
 NOAA Research Earth System Research Laboratory Physical Sciences Division What Determines the Amount of Precipitation During Wet and Dry Years Over California? Andy Hoell NOAA/Earth System Research Laboratory
Grade 9 Geography Chapter 11 - Climate Connections
 Grade 9 Geography Chapter 11 - Climate Connections 1. Define: Weather. 2. In what way has weather affected your activities in the last two weeks? 3. Define: Climate. 4. Canada s climate is a function of
Extreme Weather and Climate Change: the big picture Alan K. Betts Atmospheric Research Pittsford, VT NESC, Saratoga, NY
 Extreme Weather and Climate Change: the big picture Alan K. Betts Atmospheric Research Pittsford, VT http://alanbetts.com NESC, Saratoga, NY March 10, 2018 Increases in Extreme Weather Last decade: lack
WHAT CAN MAPS TELL US ABOUT THE GEOGRAPHY OF ANCIENT GREECE? MAP TYPE 1: CLIMATE MAPS
 WHAT CAN MAPS TELL US ABOUT THE GEOGRAPHY OF ANCIENT GREECE? MAP TYPE 1: CLIMATE MAPS MAP TYPE 2: PHYSICAL AND/OR TOPOGRAPHICAL MAPS MAP TYPE 3: POLITICAL MAPS TYPE 4: RESOURCE & TRADE MAPS Descriptions
Historical and Projected Future Climatic Trends in the Great Lakes Region
 Historical and Projected Future Climatic Trends in the Great Lakes Region Jeffrey A. Andresen Dept. of Geography, Environment, and Spatial Sciences Michigan State University Flooding along I-696 Warren,
DROUGHT, HEAVY PRECIPITATION AND CLIMATE. Ronald Stewart University of Manitoba
 DROUGHT, HEAVY PRECIPITATION AND CLIMATE Ronald Stewart University of Manitoba 2000-2009 TOP WEATHER STORIES 1.Vanishing Arctic ice in 2007. 2. B.C.'s year of disastrous weather -- fires, floods and freezes
Regional Climate Change: Current Impacts and Perspectives Greater Lake Nipissing Stewardship Council Annual Meeting Wednesday April 16, 2014
 Regional Climate Change: Current Impacts and Perspectives Greater Lake Nipissing Stewardship Council Annual Meeting Wednesday April 16, 2014 Speaker: Peter Bullock, Stantec Consulting Information Source:
Water Supply Conditions and Outlook October 1, 2018
 Water Supply Conditions and Outlook October 1, 2018 Flow Forecasting & Operations Planning Water Security Agency Overview Water supply conditions across Saskatchewan remain near normal, with most reservoirs
Constructing a typical meteorological year -TMY for Voinesti fruit trees region and the effects of global warming on the orchard ecosystem
 Constructing a typical meteorological year -TMY for Voinesti fruit trees region and the effects of global warming on the orchard ecosystem ARMEANU ILEANA*, STĂNICĂ FLORIN**, PETREHUS VIOREL*** *University
Great Lakes Update. Volume 191: 2014 January through June Summary. Vol. 191 Great Lakes Update August 2014
 Great Lakes Update Volume 191: 2014 January through June Summary The U.S. Army Corps of Engineers (USACE) monitors the water levels of each of the Great Lakes. This report provides a summary of the Great
Climate Change Impact on Air Temperature, Daily Temperature Range, Growing Degree Days, and Spring and Fall Frost Dates In Nebraska
 EXTENSION Know how. Know now. Climate Change Impact on Air Temperature, Daily Temperature Range, Growing Degree Days, and Spring and Fall Frost Dates In Nebraska EC715 Kari E. Skaggs, Research Associate
Colorado State University, Fort Collins, CO Weather Station Monthly Summary Report
 Colorado State University, Fort Collins, CO Weather Station Monthly Summary Report Month: December Year: 2017 Temperature: Mean T max was 47.2 F which is 4.4 above the 1981-2010 normal for the month. This
Susanna Glaze, Bobby Creel, and Christopher Brown New Mexico State University AWRA Spring Specialty Conference 4-6 May 2009 Anchorage, Alaska
 Susanna Glaze, Bobby Creel, and Christopher Brown New Mexico State University 2009 AWRA Spring Specialty Conference 4-6 May 2009 Anchorage, Alaska Outline Introduction to general water resources issues
Climate Change Impact on Drought Risk and Uncertainty in the Willamette River Basin
 Portland State University PDXScholar Geography Faculty Publications and Presentations Geography 5-24-2011 Climate Change Impact on Drought Risk and Uncertainty in the Willamette River Basin Heejun Chang
Climatography of the United States No
 Climate Division: AK 5 NWS Call Sign: ANC Month (1) Min (2) Month(1) Extremes Lowest (2) Temperature ( F) Lowest Month(1) Degree s (1) Base Temp 65 Heating Cooling 90 Number of s (3) Jan 22.2 9.3 15.8
OVERVIEW OF IMPROVED USE OF RS INDICATORS AT INAM. Domingos Mosquito Patricio
 OVERVIEW OF IMPROVED USE OF RS INDICATORS AT INAM Domingos Mosquito Patricio domingos.mosquito@gmail.com Introduction to Mozambique /INAM Introduction to AGRICAB/SPIRITS Objectives Material & Methods Results
Historical and Projected Future Climate Changes in the Great Lakes Region
 Historical and Projected Future Climate Changes in the Great Lakes Region B.J. Baule Great Lakes Integrates Sciences + Assessments University of Michigan Jeffrey A. Andresen Dept. of Geography Michigan
7. The weather instrument below can be used to determine relative humidity.
 1. What is the dewpoint temperature when the dry-bulb temperature is 12 C and the wet-bulb temperature is 7 C? A) 1 C B) -2 C C) -5 C D) 4 C 2. A parcel of air has a dry-bulb temperature reading of 16
Richard W. Dixon and Todd Moore Department of Geography Texas State University San Marcos May 2009
 Richard W. Dixon and Todd Moore Department of Geography Texas State University San Marcos May 2009 Study Area Texas occupies about 7% of the area of the US. Second largest state at 692,000 sq. km. Lat
Annex I to Target Area Assessments
 Baltic Challenges and Chances for local and regional development generated by Climate Change Annex I to Target Area Assessments Climate Change Support Material (Climate Change Scenarios) SWEDEN September
Why the Earth has seasons. Why the Earth has seasons 1/20/11
 Chapter 3 Earth revolves in elliptical path around sun every 365 days. Earth rotates counterclockwise or eastward every 24 hours. Earth closest to Sun (147 million km) in January, farthest from Sun (152
MEMORANDUM. Jerry Conrow, Ojai Basin Groundwater Management Agency
 MEMORANDUM TO: FROM: Jerry Conrow, Ojai Basin Groundwater Management Agency Gregory Schnaar, PhD, Stephen J. Cullen, PhD, PG, DATE: August 6, 2014, 2014 SUBJECT: Ojai Basin Groundwater Model - Extended
DROUGHT IN MAINLAND PORTUGAL
 DROUGHT IN MAINLAND Ministério da Ciência, Tecnologia e Ensino Superior Instituto de Meteorologia, I. P. Rua C Aeroporto de Lisboa Tel.: (351) 21 844 7000 e-mail:informacoes@meteo.pt 1749-077 Lisboa Portugal
APPENDIX 6.5-B Knight Piésold Kitsault Mine Climate Change Assessment Letter KITSAULT MINE PROJECT ENVIRONMENTAL ASSESSMENT APPENDICES
 ENVIRONMENTAL ASSESSMENT APPENDICES APPENDIX 6.5-B Knight Piésold Kitsault Mine Climate Change Assessment Letter VE51988 Appendices File No.:VA11-343/9-A.1 Cont. No.:VA11-175 Suite 14-75 West Pender Street
Weather and Climate Summary and Forecast March 2018 Report
 Weather and Climate Summary and Forecast March 2018 Report Gregory V. Jones Linfield College March 7, 2018 Summary: The ridge pattern that brought drier and warmer conditions from December through most
RECENT CLIMATE CHANGE TRENDS
 3RD INTERNATIONAL CONFERENCE ON ECOHYDROLOGY, SOIL AND CLIMATE CHANGE, ECOHCC'14 RECENT CLIMATE CHANGE TRENDS OF EXTREME PRECIPITATION IN THE IBERIAN PENINSULA SOFIA BARTOLOMEU, MARIA JOÃO CARVALHO, MARTINHO
Weather in Saskatchewan. John Paul Cragg Warning Preparedness Meteorologist Environment and Climate Change Canada
 Weather in Saskatchewan John Paul Cragg Warning Preparedness Meteorologist Environment and Climate Change Canada The Climate of Saskatchewan -35 Average January Low Temperature -30-25 -20-15 -10-5 0 5
PREDICTING OVERHEATING RISK IN HOMES
 PREDICTING OVERHEATING RISK IN HOMES Susie Diamond Inkling Anastasia Mylona CIBSE Simulation for Health and Wellbeing 27th June 2016 - CIBSE About Inkling Building Physics Consultancy Susie Diamond Claire
Examining Changes to the Temporal Distribution of Seasonal-to-Annual Precipitation across the Mid-Atlantic Region,
 Examining Changes to the Temporal Distribution of Seasonal-to-Annual Precipitation across the Mid-Atlantic Region, 1982-2016 Michael Marston PhD Student, Virginia Tech Precipitation (mm) Precipitation
Colorado State University, Fort Collins, CO Weather Station Monthly Summary Report
 Colorado State University, Fort Collins, CO Weather Station Monthly Summary Report Month: February Year: 2017 Webcam catching a hawk watching over the station. Temperature: Mean T max was 54.4 F which
Study of Changes in Climate Parameters at Regional Level: Indian Scenarios
 Study of Changes in Climate Parameters at Regional Level: Indian Scenarios S K Dash Centre for Atmospheric Sciences Indian Institute of Technology Delhi Climate Change and Animal Populations - The golden
Fire Season Prediction for Canada, Kerry Anderson Canadian Forest Service
 Fire Season Prediction for Canada, 2014 Kerry Anderson Canadian Forest Service 1 Introduction The Canadian Forest Service is now presenting monthly and seasonal forecast maps through the Canadian Wildland
CLIMATE CHANGE AND REGIONAL HYDROLOGY ACROSS THE NORTHEAST US: Evidence of Changes, Model Projections, and Remote Sensing Approaches
 CLIMATE CHANGE AND REGIONAL HYDROLOGY ACROSS THE NORTHEAST US: Evidence of Changes, Model Projections, and Remote Sensing Approaches Michael A. Rawlins Dept of Geosciences University of Massachusetts OUTLINE