2016 Irrigated Crop Production Update
|
|
|
- Griffin Floyd
- 5 years ago
- Views:
Transcription

1 2016 Irrigated Crop Production Update Mapping Climate Trends and Weather Extremes Across Alberta for the Period Stefan W. Kienzle Department of Geography University of Lethbridge, Alberta, Canada
2 Contributors Tim Anderson Colin Langhorn Charmaine Bonifacio Marcus Mueller Christine Clark
3 Searching for Answers How has the climate changed over the past 60 years? How does the future of water supply look like?
4 What is the difference between weather and climate? Weather is the short-term condition of the atmosphere (hot-cold, wet-dry, windy-calm, etc.) Climate is the average weather of many years, typically 30 years
5 Climate and Extreme Weather Climate change is described using: average changes in temperature average changes in precipitation. Most social and economic costs associated with climate change will result from a shift in: Frequency of extreme weather events Severity of extreme weather events.
6
 Canada Climate Service (data) Natural")
 Published by the National Land and Water Information")
7 Daily Climate Data at 10 km spatial resolution Collaborative between: Environment Canada (data) Canada Climate Service (data) Natural Resources Canada (interpolation) Australian National University (interpolation) Published by the National Land and Water Information Service (NLWIS).


8 22,280 daily layers for Precipitation Minimum temperature Maximum temperature 10 km Climate Grids

9 Daily Time Series for 1950 to 2010 Example: Grid cell at Beaver Mines, Alberta, for 1971
10 Lethbridge Climate Trends Mean Annual Temperature Mean Winter Temperature Number of Days Tmin < -20 C
11 Change in Mean Annual Temperature: ( C)

12 Change in Mean Winter Temperature: ( C)

13 Change in Mean Spring Temperature: ( C)

14 Change in Mean Summer Temperature: ( C)

15 Change in Mean Fall Temperature: ( C)


16 Growing season length: 1950 to 2010 [change in days]


17 Change in Number of Annual Frost Days: (in days)
18 Trend in Number of at least 5 consecutive days with temperatures above 5 C over normal Near Pincher Creek: Near Taber: from 20 to 39 days from 19 to 32 days Near Picture Butte: from 21 to 39 days Heat Waves
19 Lethbridge Climate Trends Growing Season Beginning of Growing Season Growing Degree Days > 5 C End of Growing Season
20 Change in Annual Potential Evapotranspiration: (in mm) (Penman-Monteith method)
21 Variable Description Units Tmax >= threshold temperature Annual count when the daily maximum temperature >= chosen Days threshold temperature, e.g. 25 C Tmax <= threshold temperature Annual count when the daily maximum temperature <= chosen Days threshold temperature, e.g. 2 C Tmin >= threshold temperature Annual count when the daily minimum temperature >= chosen Days threshold temperature, e.g. 5 C Tmin <= threshold temperature Annual count when the daily minimum temperature <= chosen Days threshold temperature, e.g. 0 C Frost days Annual count when daily minimum temperature < 0 C Days Growing season Length Annual count between first span of at least 6 days with Tmean Days >5 C and first span after July of 6 days with TMean < 5 C Heat wave days Count of days in a year that are 5 C higher than during the period Days Ice days Annual count when daily maximum temperature <0 C Days Max Tmax Monthly maximum value of daily maximum temp C Max Tmin Monthly maximum value of daily minimum temp C Min Tmax Monthly minimum value of daily maximum temp C Min Tmin Monthly minimum value of daily minimum temp C Cool nights Percentage of days when TN<10th percentile % Cool days Percentage of days when TX<10th percentile % Warm nights Percentage of days when TN>90th percentile % Warm days Percentage of days when TX>90th percentile % Consecutive dry days Maximum number of consecutive days with RR<1mm Days
22 End day of growing season Last day of span of at least 6 days with Tmean <5 C C Variable Description Units Accumulated precipitation over 5 days Simple precipitation intensity index Annual maximum sum of 5-day precipitation Annual fraction of annual precipitation sum divided by the number of precipitation days Mm > 1mm Very wet years Annual total precipitation when above the period 95 th percentile Years Annual precipitation Annual sums of daily precipitation mm Warm spell duration indicator Annual count of days with at least 6 consecutive days when TX>90th percentile Days Cold spell duration indicator Annual count of days with at least 6 consecutive days when TN<10th percentile Days Diurnal temperature range Monthly mean difference between TX and TN C Max 1-day precipitation amount Monthly maximum 1-day precipitation mm Max 5-day precipitation amount Monthly maximum consecutive 5-day precipitation mm Simple daily intensity index Annual total precipitation divided by the number of wet days (defined as precipitation >= 1.0mm) in the year Number of heavy precipitation days Annual count of days when daily precipitation >=10mm Days Number of very heavy precipitation days Annual count of days when daily precipitation >=20mm Days Number of days above nn mm Annual count of days when daily precipitation >= nn mm, nn is user defined threshold Days Consecutive wet days Maximum number of consecutive days with precipitation >= 1mm mm Very wet days Annual total PRCP when RR>95 th percentile mm Extremely wet days Annual total PRCP when RR>99 th percentile mm Annual total wet-day precipitation Annual total PRCP in wet days (RR>=1mm) mm Growing degree days >=0 C Annual sum of daily temperatures >= 0 C C Growing degree days >=5 C Annual sum of daily temperatures >= 5 C C Growing degree days >=10 C Annual sum of daily temperatures >= 10 C C Beginning day of growing season First day of span of at least 6 days with Tmean >5 C C Mm mm/day
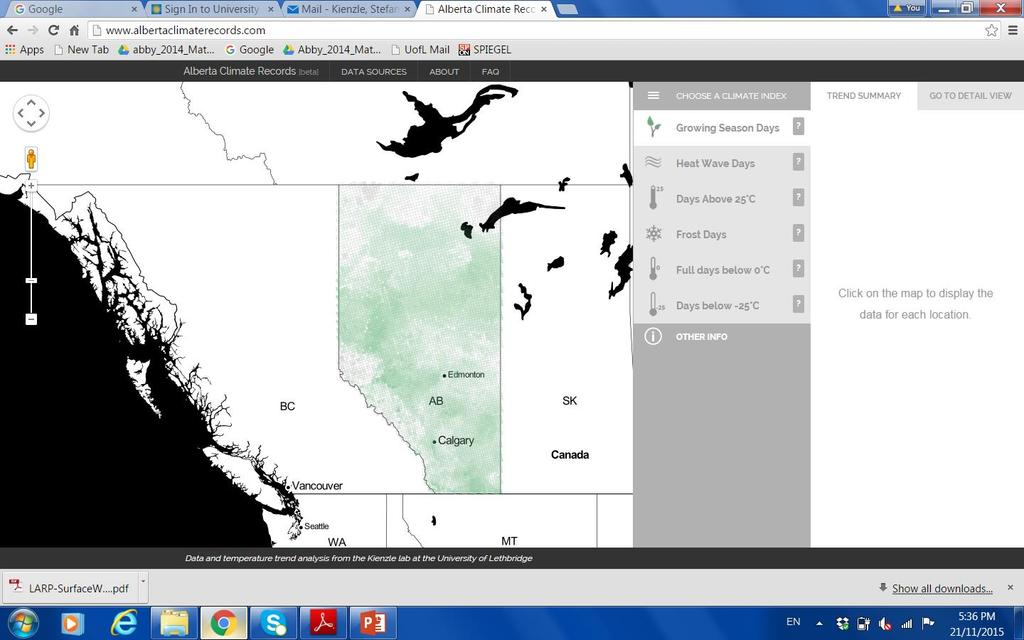
23 First Screen

24 Zoomed in and selected a grid cell

25 Zoomed in and selected a grid cell: DETAIL VIEW
 Castle River")
26 Change in Maximum Snow Pack: (in mm) Castle River Watershed

27 Castle River Watershed: Precipitation
28 Castle River Watershed: Change in Mean Annual Streamflow
29 This project was made possible through funding provided by: NSERC Alberta Innovates - EES
30 Questions?
Foralps 2nd conference. Assessment of Lombardy's climate in the last century: data analysis, methodologies and indices
 Alessia Marchetti, Angela Sulis Assessment of Lombardy's climate in the last century: data Contents The dataset The daily indices analysis Some preliminary monthly data indices analysis Some key points
Climate Change Indices By: I Putu Santikayasa
 Climate Change Indices By: I Putu Santikayasa Climate Change and Water Resources CE74.9002 Water Engineering and Management (WEM) School of Engineering and Technology (SET) Asian institute of Technology
CLIMATE RESILIENCE FOR ALBERTA MUNICIPALITIES CLIMATE PROJECTIONS SOUTHERN ALBERTA. Dr. Mel Reasoner Reasoner Environmental Consulting
 CLIMATE RESILIENCE FOR ALBERTA MUNICIPALITIES CLIMATE PROJECTIONS SOUTHERN ALBERTA Dr. Mel Reasoner Reasoner Environmental Consulting Probability of occurrence Increase in Mean Temperature & Variance Less
Extremes Events in Climate Change Projections Jana Sillmann
 Extremes Events in Climate Change Projections Jana Sillmann Max Planck Institute for Meteorology International Max Planck Research School on Earth System Modeling Temperature distribution IPCC (2001) Outline
Drought and Climate Extremes Indices for the North American Drought Monitor and North America Climate Extremes Monitoring System. Richard R. Heim Jr.
 Drought and Climate Extremes Indices for the North American Drought Monitor and North America Climate Extremes Monitoring System Richard R. Heim Jr. NOAA/NESDIS/National Climatic Data Center Asheville,
Indices of Daily Temperature and Precipitation Extremes
 Indices of Daily Temperature and Precipitation Extremes TEMPERATURE INDICES A B C D E F G H I J K L N M O 2 ID or TXice Ice days or days without defrost No. days TX < 0 C Day count; fixed 3 FD or TNFD
Impacts of Changes in Extreme Weather and Climate on Wild Plants and Animals. Camille Parmesan Integrative Biology University of Texas at Austin
 Impacts of Changes in Extreme Weather and Climate on Wild Plants and Animals Camille Parmesan Integrative Biology University of Texas at Austin Species Level: Climate extremes determine species distributions
TRENDS AND CHANGE IN CLIMATE OVER THE VOLTA RIVER BASIN
 TRENDS AND CHANGE IN CLIMATE OVER THE VOLTA RIVER BASIN VOLTRES PROJECT WORK PACKAGE 1a: CLIMATE KEY RESULTS E. Obuobie, H.E. Andersen, C. Asante-Sasu, M. Osei-owusu 11/9/217 OBJECTIVES Analyse long term
CLIMATE RESILIENCE FOR ALBERTA MUNICIPALITIES CLIMATE PROJECTIONS NORTHERN ALBERTA. Dr. Mel Reasoner Reasoner Environmental Consulting
 CLIMATE RESILIENCE FOR ALBERTA MUNICIPALITIES CLIMATE PROJECTIONS NORTHERN ALBERTA Dr. Mel Reasoner Reasoner Environmental Consulting Probability of occurrence Increase in Mean Temperature & Variance Less
CLIMATE CHANGE DETECTION WITH EXTREME WEATHER FACTORS CONCERNING ALGERIA
 European Scientific Journal June 15 edition vol.11, No.17 ISSN: 1857 7881 (Print) e - ISSN 1857-7431 CLIMATE CHANGE DETECTION WITH EXTREME WEATHER FACTORS CONCERNING ALGERIA L. Benaïchata K. Mederbal Ibn
FUTURE CHANGES IN EXTREME TEMPERATURE INDICES IN CLUJ-NAPOCA, ROMANIA
 FUTURE CHANGES IN EXTREME TEMPERATURE INDICES IN CLUJ-NAPOCA, ROMANIA A.F. CIUPERTEA, A. PITICAR, V. DJURDJEVIC, Adina-Eliza CROITORU, Blanka BARTOK ABSTRACT. Future changes in extreme temperature indices
Extremes analysis: the. ETCCDI twopronged
 Manola Brunet University Rovira i Virgili, Tarragona, Catalonia Extremes analysis: the Title ETCCDI twopronged approach 5 December 2017 Fourth Session of the ETCCDI, Victoria, Feb 2011 The role of the
Seasonal prediction of extreme events
 Seasonal prediction of extreme events C. Prodhomme, F. Doblas-Reyes MedCOF training, 29 October 2015, Madrid Climate Forecasting Unit Outline: Why focusing on extreme events? Extremeness metric Soil influence
Internationally Coordinated Extremes Indices
 Internationally Coordinated Extremes Indices Thomas C. Peterson National Climatic Data Center/NESDIS/NOAA Asheville, NC USA July 2005 (With help from Albert Klein Tank The Netherlands) In the beginning...
State of the Climate for the Central Great Plains. Johannes Feddema Department of Geography University of Kansas
 State of the Climate for the Central Great Plains Johannes Feddema Department of Geography University of Kansas Adapting to a Changing Climate on the Central Great Plains Conference Kansas State University,
MONITORING AND THE RESEARCH ON METEOROLOGICAL DROUGHT IN CROATIA
 MONITORING AND THE RESEARCH ON METEOROLOGICAL DROUGHT IN CROATIA K. Cindrić Kalin, I. Güttler, L. Kalin, D. Mihajlović, T. Stilinović Meteorological and Hydrological Service cindric@cirus.dhz.hr 1 overview
RClimDex (1.0) User Manual. Xuebin Zhang and Feng Yang. Climate Research Branch Environment Canada Downsview, Ontario Canada. September 10, 2004
 User Manual. Xuebin Zhang and Feng Yang. Climate Research Branch Environment Canada Downsview, Ontario Canada. September 10, 2004") RClimDex (1.0) User Manual By Xuebin Zhang and Feng Yang Climate Research Branch Environment Canada Downsview, Ontario Canada September 10, 2004 Acknowledgement The RClimDex is developed and maintained
RClimDex (1.0) User Manual By Xuebin Zhang and Feng Yang Climate Research Branch Environment Canada Downsview, Ontario Canada September 10, 2004 Acknowledgement The RClimDex is developed and maintained
UPPLEMENT A COMPARISON OF THE EARLY TWENTY-FIRST CENTURY DROUGHT IN THE UNITED STATES TO THE 1930S AND 1950S DROUGHT EPISODES
 UPPLEMENT A COMPARISON OF THE EARLY TWENTY-FIRST CENTURY DROUGHT IN THE UNITED STATES TO THE 1930S AND 1950S DROUGHT EPISODES Richard R. Heim Jr. This document is a supplement to A Comparison of the Early
Analysis of Agrometeorological Indices in the Context of Climate Extremes on the Canadian Prairies
 Analysis of Agrometeorological Indices in the Context of Climate Extremes on the Canadian Prairies Asn Chipanshi, Patrick Cherneski, Yinsuo Zhang, Nathaniel Newlands & Dongzhi Qi Science & Technology Branch,
CLIMATE. UNIT TWO March 2019
 CLIMATE UNIT TWO March 2019 OUTCOME 9.2.1Demonstrate an understanding of the basic features of Canada s landscape and climate. identify and locate major climatic regions of Canada explain the characteristics
NIDIS Intermountain West Drought Early Warning System October 17, 2017
 NIDIS Drought and Water Assessment NIDIS Intermountain West Drought Early Warning System October 17, 2017 Precipitation The images above use daily precipitation statistics from NWS COOP, CoCoRaHS, and
Historical and Projected Future Climate Changes in the Great Lakes Region
 Historical and Projected Future Climate Changes in the Great Lakes Region B.J. Baule Great Lakes Integrates Sciences + Assessments University of Michigan Jeffrey A. Andresen Dept. of Geography Michigan
Indicator Trends for Canadian Climate Changes during the Last 60 to 140 Years
 Indicator Trends for Canadian Climate Changes during the Last 60 to 140 Years Presented to CPANS, Edmonton Luncheon Forum by Kurt Hansen, P. Eng. President, Green Inc., Calgary, Alberta greeninc@telus.net
Zambia. General Climate. Recent Climate Trends. UNDP Climate Change Country Profiles. Temperature. C. McSweeney 1, M. New 1,2 and G.
 UNDP Climate Change Country Profiles Zambia C. McSweeney 1, M. New 1,2 and G. Lizcano 1 1. School of Geography and Environment, University of Oxford. 2. Tyndall Centre for Climate Change Research http://country-profiles.geog.ox.ac.uk
Water Information Portal User Guide. Updated July 2014
 Water Information Portal User Guide Updated July 2014 1. ENTER THE WATER INFORMATION PORTAL Launch the Water Information Portal in your internet browser via http://www.bcogc.ca/public-zone/water-information
Climate Dataset: Aitik Closure Project. November 28 th & 29 th, 2018
 1 Climate Dataset: Aitik Closure Project November 28 th & 29 th, 2018 Climate Dataset: Aitik Closure Project 2 Early in the Closure Project, consensus was reached to assemble a long-term daily climate
September 2018 Weather Summary West Central Research and Outreach Center Morris, MN
 September 2018 Weather Summary The mean temperature for September was 60.6 F, which is 1.5 F above the average of 59.1 F (1886-2017). The high temperature for the month was 94 F on September 16 th. The
RECENT CLIMATE CHANGE TRENDS
 3RD INTERNATIONAL CONFERENCE ON ECOHYDROLOGY, SOIL AND CLIMATE CHANGE, ECOHCC'14 RECENT CLIMATE CHANGE TRENDS OF EXTREME PRECIPITATION IN THE IBERIAN PENINSULA SOFIA BARTOLOMEU, MARIA JOÃO CARVALHO, MARTINHO
Examples of using gridded observed climate datasets at the Finnish Environment Institute
 Examples of using gridded observed climate datasets at the Finnish Environment Institute Stefan Fronzek, Timothy Carter, Nina Pirttioja Finnish Environment Institute (SYKE) Workshop New gridded climate
WMO technical conference on climate services building on clips legacy
 WMO technical conference on climate services building on clips legacy conjunction with the Sixteenth Session of WMO Commission for Climatology (CCl-16) and the 35 th Meeting of the Joint Scientific Committee
The western Canada high resolution WRF simulation
 The western Canada high resolution WRF simulation Yanping Li S. Kurkute E. Asong L. Chen University of Saskatchewan CCRN SOAP Yanping Li, S. Kurkute, E. Asong, L. Chen High Resolution WRF-RCM October 3,
Mozambique. General Climate. UNDP Climate Change Country Profiles. C. McSweeney 1, M. New 1,2 and G. Lizcano 1
 UNDP Climate Change Country Profiles Mozambique C. McSweeney 1, M. New 1,2 and G. Lizcano 1 1. School of Geography and Environment, University of Oxford. 2.Tyndall Centre for Climate Change Research http://country-profiles.geog.ox.ac.uk
DROUGHT, HEAVY PRECIPITATION AND CLIMATE. Ronald Stewart University of Manitoba
 DROUGHT, HEAVY PRECIPITATION AND CLIMATE Ronald Stewart University of Manitoba 2000-2009 TOP WEATHER STORIES 1.Vanishing Arctic ice in 2007. 2. B.C.'s year of disastrous weather -- fires, floods and freezes
November 2018 Weather Summary West Central Research and Outreach Center Morris, MN
 November 2018 Weather Summary Lower than normal temperatures occurred for the second month. The mean temperature for November was 22.7 F, which is 7.2 F below the average of 29.9 F (1886-2017). This November
Study of Changes in Climate Parameters at Regional Level: Indian Scenarios
 Study of Changes in Climate Parameters at Regional Level: Indian Scenarios S K Dash Centre for Atmospheric Sciences Indian Institute of Technology Delhi Climate Change and Animal Populations - The golden
2015: A YEAR IN REVIEW F.S. ANSLOW
 2015: A YEAR IN REVIEW F.S. ANSLOW 1 INTRODUCTION Recently, three of the major centres for global climate monitoring determined with high confidence that 2015 was the warmest year on record, globally.
Storm and Runoff Calculation Standard Review Snowmelt and Climate Change
 Storm and Runoff Calculation Standard Review Snowmelt and Climate Change Presented by Don Moss, M.Eng., P.Eng. and Jim Hartman, P.Eng. Greenland International Consulting Ltd. Map from Google Maps TOBM
Climate also has a large influence on how local ecosystems have evolved and how we interact with them.
 The Mississippi River in a Changing Climate By Paul Lehman, P.Eng., General Manager Mississippi Valley Conservation (This article originally appeared in the Mississippi Lakes Association s 212 Mississippi
Coupling Climate to Clouds, Precipitation and Snow
 Coupling Climate to Clouds, Precipitation and Snow Alan K. Betts akbetts@aol.com http://alanbetts.com Co-authors: Ray Desjardins, Devon Worth Agriculture and Agri-Food Canada Shusen Wang and Junhua Li
Snow Melt with the Land Climate Boundary Condition
 Snow Melt with the Land Climate Boundary Condition GEO-SLOPE International Ltd. www.geo-slope.com 1200, 700-6th Ave SW, Calgary, AB, Canada T2P 0T8 Main: +1 403 269 2002 Fax: +1 888 463 2239 Introduction
Chapter outline. Reference 12/13/2016
 Chapter 2. observation CC EST 5103 Climate Change Science Rezaul Karim Environmental Science & Technology Jessore University of science & Technology Chapter outline Temperature in the instrumental record
Appendix 1: UK climate projections
 Appendix 1: UK climate projections The UK Climate Projections 2009 provide the most up-to-date estimates of how the climate may change over the next 100 years. They are an invaluable source of information
Climate Change Models: The Cyprus Case
 Climate Change Models: The Cyprus Case M. Petrakis, C. Giannakopoulos, G. Lemesios National Observatory of Athens AdaptToClimate 2014, Nicosia Cyprus Climate Research (1) Climate is one of the most challenging
but 2012 was dry Most farmers pulled in a crop
 After a winter that wasn t, conditions late in the year pointed to a return to normal snow and cold conditions Most farmers pulled in a crop but 2012 was dry b y M i k e Wr o b l e w s k i, w e a t h e
Malawi. General Climate. UNDP Climate Change Country Profiles. C. McSweeney 1, M. New 1,2 and G. Lizcano 1
 UNDP Climate Change Country Profiles Malawi C. McSweeney 1, M. New 1,2 and G. Lizcano 1 1. School of Geography and Environment, University of Oxford. 2. Tyndall Centre for Climate Change Research http://country-profiles.geog.ox.ac.uk
Climate of Columbus. Aaron Wilson. Byrd Polar & Climate Research Center State Climate Office of Ohio.
 Climate of Columbus Aaron Wilson Byrd Polar & Climate Research Center http://bpcrc.osu.edu/greenteam Overview Historical Climatology Climate Change & Impacts Projected Changes Summary 2 Historical Climatology
CLIMATE CHANGE DATA PROJECTIONS FOR ONTARIO AND THE GREAT LAKES BASIN
 CLIMATE CHANGE DATA PROJECTIONS FOR ONTARIO AND THE GREAT LAKES BASIN ECO Climate Data Roundtable, January 8, 2014 Richard Peltier, Physics, U Toronto Regional Data Sets of Climate Change Projections 2
Northern New England Climate: Past, Present, and Future. Basic Concepts
 Northern New England Climate: Past, Present, and Future Basic Concepts Weather instantaneous or synoptic measurements Climate time / space average Weather - the state of the air and atmosphere at a particular
Extreme Weather and Climate Change: the big picture Alan K. Betts Atmospheric Research Pittsford, VT NESC, Saratoga, NY
 Extreme Weather and Climate Change: the big picture Alan K. Betts Atmospheric Research Pittsford, VT http://alanbetts.com NESC, Saratoga, NY March 10, 2018 Increases in Extreme Weather Last decade: lack
RR#5 - Free Response
 Base your answers to questions 1 through 3 on the data table below and on your knowledge of Earth Science. The table shows the area, in million square kilometers, of the Arctic Ocean covered by ice from
NADM, NACEM, and Opportunities for Future Collaboration
 NADM, NACEM, and Opportunities for Future Collaboration Richard R. Heim Jr. NOAA/NESDIS/National Climatic Data Center Asheville, North Carolina, U.S.A. 4th Annual DRI Workshop 26-28 January 2009, Regina,
knowledge Generation of related to future climate: downscaling by the Meteorological Service of Catalonia
 knowledge Generation of related to future climate: downscaling by the Meteorological Service of Catalonia Jéssica Amaro, Antoni Barrera- Escoda, and Vicent Altava- Ortiz Servei Meteorològic de Catalunya
Drought Criteria. Richard J. Heggen Department of Civil Engineering University of New Mexico, USA Abstract
 Drought Criteria Richard J. Heggen Department of Civil Engineering University of New Mexico, USA rheggen@unm.edu Abstract Rainwater catchment is an anticipatory response to drought. Catchment design requires
Temporal validation Radan HUTH
 Temporal validation Radan HUTH Faculty of Science, Charles University, Prague, CZ Institute of Atmospheric Physics, Prague, CZ What is it? validation in the temporal domain validation of temporal behaviour
GEOGRAPHY EYA NOTES. Weather. atmosphere. Weather and climate
 GEOGRAPHY EYA NOTES Weather and climate Weather The condition of the atmosphere at a specific place over a relatively short period of time Climate The atmospheric conditions of a specific place over a
2012 Growing Season. Niagara Report. Wayne Heinen
 2012 Growing Season Niagara Report Wayne Heinen Overview The 2012 growing season was a phenomenal one for grapes. Vines entered bud break in good shape following a mild winter. The spring of 2012 was similar
Seasonal Hydrometeorological Ensemble Prediction System: Forecast of Irrigation Potentials in Denmark
 Seasonal Hydrometeorological Ensemble Prediction System: Forecast of Irrigation Potentials in Denmark Diana Lucatero 1*, Henrik Madsen 2, Karsten H. Jensen 1, Jens C. Refsgaard 3, Jacob Kidmose 3 1 University
Southern New England s Changing Climate. Raymond S. Bradley and Liang Ning Northeast Climate Science Center University of Massachusetts, Amherst
 Southern New England s Changing Climate Raymond S. Bradley and Liang Ning Northeast Climate Science Center University of Massachusetts, Amherst Historical perspective (instrumental data) IPCC scenarios
My Community vs. Nunavut Weather and Climate
 My Community vs. Nunavut Content Areas Social Studies, Science, Technology Objective Students will differentiate between weather and climate. For 1 month, they will collect and graph daily temperature
Projection of climate change in Cyprus using a selection of regional climate models
 Projection of climate change in Cyprus using a selection of regional climate models C. Giannakopoulos, G. Lemesios, M. Petrakis, Th. Kopania, N. Roukounakis National Observatory of Athens, Athens, Greece
Probability distributions of monthly-to-annual mean temperature and precipitation in a changing climate
 Probability distributions of monthly-to-annual mean temperature and precipitation in a changing climate Jouni Räisänen Department of Physics, University of Helsinki Climate probability distribution of
Physical Geography Lab Activity #16
 Physical Geography Lab Activity #16 Due date Name California Climate Classification COR Objective 6, SLO 3 16.1. Introduction One of the most important factors in the physical geography of a place is its
Precipitation. Standardized Precipitation Index. NIDIS Intermountain West Regional Drought Early Warning System January 3, 2017
 1/3/2017 NIDIS Drought and Water Assessment NIDIS Intermountain West Regional Drought Early Warning System January 3, 2017 Precipitation The images above use daily precipitation statistics from NWS COOP,
Climate Change Impact on Air Temperature, Daily Temperature Range, Growing Degree Days, and Spring and Fall Frost Dates In Nebraska
 EXTENSION Know how. Know now. Climate Change Impact on Air Temperature, Daily Temperature Range, Growing Degree Days, and Spring and Fall Frost Dates In Nebraska EC715 Kari E. Skaggs, Research Associate
Jennifer Francis Institute of Marine and Coastal Sciences Rutgers University In collaboration with Steve Vavrus, U. of Wisconsin
 Jennifer Francis Institute of Marine and Coastal Sciences Rutgers University In collaboration with Steve Vavrus, U. of Wisconsin Arctic Linkages Workshop National Academies of Sciences 12-13 September
Seasonal and Spatial Patterns of Rainfall Trends on the Canadian Prairie
 Seasonal and Spatial Patterns of Rainfall Trends on the Canadian Prairie H.W. Cutforth 1, O.O. Akinremi 2 and S.M. McGinn 3 1 SPARC, Box 1030, Swift Current, SK S9H 3X2 2 Department of Soil Science, University
An ENSO-Neutral Winter
 An ENSO-Neutral Winter This issue of the Blue Water Outlook newsletter is devoted towards my thoughts on the long range outlook for winter. You will see that I take a comprehensive approach to this outlook
Display and analysis of weather data from NCDC using ArcGIS
 Display and analysis of weather data from NCDC using ArcGIS Helen M. Cox Associate Professor Geography Department California State University, Northridge and Stephen Krug Graduate Student Geography Department
Impacts of snowpack accumulation and summer weather on alpine glacier hydrology
 Impacts of snowpack accumulation and summer weather on alpine glacier hydrology Caroline Aubry-Wake, Dhiraj Pradhananga, John W. Pomeroy GEWEX 8 th Open Science Meeting, Canmore AB, May 3-11 2018 Canadian
Historical and Projected Future Climatic Trends in the Great Lakes Region
 Historical and Projected Future Climatic Trends in the Great Lakes Region Jeffrey A. Andresen Dept. of Geography, Environment, and Spatial Sciences Michigan State University Flooding along I-696 Warren,
12 SWAT USER S MANUAL, VERSION 98.1
 12 SWAT USER S MANUAL, VERSION 98.1 CANOPY STORAGE. Canopy storage is the water intercepted by vegetative surfaces (the canopy) where it is held and made available for evaporation. When using the curve
PREDICTING DROUGHT VULNERABILITY IN THE MEDITERRANEAN
 J.7 PREDICTING DROUGHT VULNERABILITY IN THE MEDITERRANEAN J. P. Palutikof and T. Holt Climatic Research Unit, University of East Anglia, Norwich, UK. INTRODUCTION Mediterranean water resources are under
Changes in Daily Climate Extremes of Observed Temperature and Precipitation in China
 ATMOSPHERIC AND OCEANIC SCIENCE LETTERS, 2013, VOL. 6, NO. 5, 312 319 Changes in Daily Climate Extremes of Observed Temperature and Precipitation in China WANG Ai-Hui and FU Jian-Jian Nansen-Zhu International
Arizona Drought Monitoring Sensitivity and Verification Analyses Project Results and Future Directions
 Arizona Drought Monitoring Sensitivity and Verification Analyses Project Results and Future Directions A Water Sustainability Institute, Technology and Research Initiative Fund Project Christopher L. Castro,
Investigating Weather with Google Earth Student Guide
 Investigating Weather with Google Earth Student Guide In this activity, you will use Google Earth to explore some factors that affect weather. You will: 1. Determine how different factors affect a location
4th Grade Social Studies First Nine Weeks
 4th Grade Social Studies First Nine Weeks Multiple Choice Identify the choice that best completes the statement or answers the question. 1 Name the mountains that are located in the eastern United States.
Climate change projections for Ontario: an updated synthesis for policymakers and planners
 Ministry of Natural Resources and Forestry Climate change projections for Ontario: an updated synthesis for policymakers and planners Shannon Fera and Adam Hogg Ontario Ministry of Natural Resources and
Bell Work. REVIEW: Our Planet Earth Page 29 Document A & B Questions
 9.12.16 Bell Work REVIEW: Our Planet Earth Page 29 Document A & B Questions Intro to Climate & Weather https://www.youtube.com/watch?v=vhgyoa70q7y Weather vs. Climate Video Climate & Weather 3.1 Weather
NIDIS Intermountain West Drought Early Warning System January 16, 2018
 NIDIS Drought and Water Assessment NIDIS Intermountain West Drought Early Warning System January 16, 2018 Precipitation The images above use daily precipitation statistics from NWS COOP, CoCoRaHS, and
Precipitation. Standardized Precipitation Index. NIDIS Intermountain West Regional Drought Early Warning System December 6, 2016
 12/9/2016 NIDIS Drought and Water Assessment NIDIS Intermountain West Regional Drought Early Warning System December 6, 2016 Precipitation The images above use daily precipitation statistics from NWS COOP,
Eric Snodgrass Co-Founder and Senior Atmospheric Scientist of Agrible, Inc Director of Undergraduate Studies Department of Atmospheric Sciences
 Eric Snodgrass Co-Founder and Senior Atmospheric Scientist of Agrible, Inc Director of Undergraduate Studies Department of Atmospheric Sciences University Of Illinois Urbana-Champaign snodgrss@illinois.edu
Examining Changes to the Temporal Distribution of Seasonal-to-Annual Precipitation across the Mid-Atlantic Region,
 Examining Changes to the Temporal Distribution of Seasonal-to-Annual Precipitation across the Mid-Atlantic Region, 1982-2016 Michael Marston PhD Student, Virginia Tech Precipitation (mm) Precipitation
Manitoba s Future Climate
 Climate Change Connection: Severe Weather in MB Workshop, 2 April 2013 Manitoba s Future Climate Danny Blair Associate Dean of Science, University of Winnipeg Professor of Geography Co-Chair, MB s Climate
Operational Hydrologic Ensemble Forecasting. Rob Hartman Hydrologist in Charge NWS / California-Nevada River Forecast Center
 Operational Hydrologic Ensemble Forecasting Rob Hartman Hydrologist in Charge NWS / California-Nevada River Forecast Center Mission of NWS Hydrologic Services Program Provide river and flood forecasts
Meteorological alert system in NMS of Mongolia
 Meteorological alert system in NMS of Mongolia L.Oyunjargal, NAMEM Regional Workshop on Impact-based Forecasts in Asia Seoul, Korea, 07-09 NOV 2017 Weather related disasters 1. Strong wind and snow and
NIDIS Intermountain West Drought Early Warning System September 4, 2018
 NIDIS Drought and Water Assessment NIDIS Intermountain West Drought Early Warning System September 4, 2018 Precipitation The images above use daily precipitation statistics from NWS COOP, CoCoRaHS, and
Climate variability and the expected. Croatia
 Climate variability and the expected effects of climate change scenario in Croatia Krešo Pandžić Meteorological and Hydrological Service Croatia National roundtable Adaptation to climate change, Zagreb,
Climate predictability beyond traditional climate models
 Climate predictability beyond traditional climate models Rasmus E. Benestad & Abdelkader Mezghani Rasmus.benestad@met.no More heavy rain events? More heavy rain events? Heavy precipitation events with
INTENSE: INTElligent use of climate models for adaptation to non-stationary hydrological Extremes Dr Elizabeth Lewis
 INTENSE: INTElligent use of climate models for adaptation to non-stationary hydrological Extremes Dr Elizabeth Lewis (Elizabeth.lewis2@ncl.ac.uk) Prof Hayley Fowler, Dr Stephen Blenkinsop, Dr Renaud Barbero,
Will a warmer world change Queensland s rainfall?
 Will a warmer world change Queensland s rainfall? Nicholas P. Klingaman National Centre for Atmospheric Science-Climate Walker Institute for Climate System Research University of Reading The Walker-QCCCE
Ellen L. Mecray NOAA Regional Climate Services Director, Eastern Region Taunton, MA
 Ellen L. Mecray NOAA Regional Climate Services Director, Eastern Region Taunton, MA Regions of the US National Climate Assessment What we Observe: Climate changes and impacts Increasing temperature Increasingly
MAPS OF CURRENTLY USED INDICATORS
 MAPS OF CURRENTLY USED INDICATORS A structured network for integration of climate knowledge into policy and territorial planning DELIVERABLE INFORMATION WP: Activity: WP Leader: Activity leader: Participating
Global Challenges - Partnering with Service Providers. World Meteorological Organization. J. Lengoasa WMO Deputy Secretary-General
 WMO World Meteorological Organization Working together in weather, climate and water Global Challenges - Partnering with Service Providers J. Lengoasa WMO Deputy Secretary-General jlengoasa@wmo.int http://www.wmo.int/pages/gfcs/gfcs_en.html
Assessing the Climate-Scale Variability and Seasonal Predictability of Atmospheric Rivers Affecting the West Coast of North America
 Assessing the Climate-Scale Variability and Seasonal Predictability of Atmospheric Rivers Affecting the West Coast of North America Alexander Gershunov, Tamara Shulgina, Marty Ralph, David Lavers CW3E
Karonga Climate Profile: Full Technical Version
 Karonga Climate Profile: Full Technical Version Prepared by: University of Cape Town November 2017 For enquiries regarding this Climate Profile, please contact Lisa van Aardenne (lisa@csag.uct.ac.za) or
Historical and Projected Future Climatic Trends in the Great Lakes Region
 Historical and Projected Future Climatic Trends in the Great Lakes Region Jeffrey A. Andresen Dept. of Geography, Environment, and Spatial Sciences Michigan State University Outline Historical Trends Climatic
Statistically Downscaled Climate Projections of Temperature, Precipitation, and Snow for Wisconsin. Michael Notaro
 Statistically Downscaled Climate Projections of Temperature, Precipitation, and Snow for Wisconsin Michael Notaro Associate Scientist Center for Climatic Research University of Wisconsin-Madison mnotaro@wisc.edu
NOAA s Climate Normals. Pre-release Webcast presented by NOAA s National Climatic Data Center June 13, 2011
 NOAA s 1981-2010 Climate Normals Pre-release Webcast presented by NOAA s National Climatic Data Center June 13, 2011 Takeaway Messages Most Normals will be available July 1 via FTP NWS Normals to be loaded
What Determines the Amount of Precipitation During Wet and Dry Years Over California?
 NOAA Research Earth System Research Laboratory Physical Sciences Division What Determines the Amount of Precipitation During Wet and Dry Years Over California? Andy Hoell NOAA/Earth System Research Laboratory
Lake Tahoe Watershed Model. Lessons Learned through the Model Development Process
 Lake Tahoe Watershed Model Lessons Learned through the Model Development Process Presentation Outline Discussion of Project Objectives Model Configuration/Special Considerations Data and Research Integration