KENAI PENINSULA, BOROUGH OF ALASKA AND INCORPORATED AREAS. Federal Emergency Management Agency FLOOD INSURANCE STUDY NUMBER 02122CV000A
|
|
|
- Samantha Neal
- 5 years ago
- Views:
Transcription


1 KENAI PENINSULA BOROUGH, ALASKA AND INCORPORATED AREAS COMMUNITY NAME COMMUNITY NUMBER KACHEMAK, CITY OF KENAI, CITY OF KENAI PENINSULA, BOROUGH OF SELDOVIA, CITY OF SEWARD, CITY OF SOLDOTNA, CITY OF Kenai Peninsula Borough Federal Emergency Management Agency FLOOD INSURANCE STUDY NUMBER 02122CV000A
2 NOTICE TO FLOOD INSURANCE STUDY USERS Communities participating in the National Flood Insurance Program have established repositories of flood hazard data for floodplain management and flood insurance purposes. This Flood Insurance Study (FIS) report may not contain all data available within the Community Map Repository. Please contact the Community Map Repository for any additional data. The Federal Emergency Management Agency (FEMA) may revise and republish part or all of this FIS report at any time. In addition, FEMA may revise part of this FIS report by the Letter of Map Revision process, which does not involve republication or redistribution of the FIS report. Therefore, users should consult with community officials and check the Community Map Repository to obtain the most current FIS report components. This FIS report was revised on TBD. Users should refer to Section 10.0, Revisions Description, for further information. Section 10.0 is intended to present the most up-to-date information for specific portions of this FIS report. Therefore, users of this report should be aware that the information presented in Section 10.0 supersedes information in Sections 1.0 through 9.0 of this FIS report. Selected Flood Insurance Rate Map panels for this community contain information that was previously shown separately on the corresponding Flood Boundary and Floodway Map panels (e.g., floodways, cross sections). In addition, former flood hazard zone designations have been changed for the area in and bordering the city of Seward (Section 10.2) as follows: Old Zones Al through A30 V1 through V30 B C New Zones AE VE X X Effective Date: December 6, 1999 Revised Date: TBD
3 TABLE OF CONTENTS 1.0 INTRODUCTION Purpose of Study Authority and Acknowledgments Coordination AREA STUDIED Scope of Study Community Description Principal Flood Problems Flood Protection Measures ENGINEERING METHODS Hydrologic Analyses Hydraulic Analyses Wave Height Analysis Vertical Datum FLOODPLAIN MANAGEMENT APPLICATIONS Floodplain Boundaries Floodways Base Flood Elevations Velocity Zones INSURANCE APPLICATIONS FLOOD INSURANCE RATE MAP OTHER STUDIES LOCATION OF DATA BIBLIOGRAPHY AND REFERENCES REVISIONS DESCRIPTION First Revision (Revised December 6, 1999) Second Revision (Revised TBD) i
4 TABLE OF CONTENTS (Continued) FIGURES Figure 1 - Transect Schematic Figure 2 - Floodway Schematic TABLES Table 1 - Floods of Record on the Kenai Peninsula Table 2 - Summary of Discharges Table 3 - Summary of Stillwater Elevations Table 4 - Vertical Datum Conversion Table 5 - Floodway Data Table 6 - Community Map History EXHIBITS Exhibit 1 - Flood Profiles Bear Creek Grouse Creek Kasilof River Kenai River Kwechak River Resurrection River Salmon Creek Salmon Creek Overflow Salmon Creek/Resurrection River Split Salmon Creek Split Sawmill Creek Sawmill Creek Split Panel 01P 05P Panel 06P Panel 07P 10P Panel 11P 40P Panel 41P 47P Panel 48P 50P Panel 51P 63P Panel 64P 65P Panel 66P Panel 67P Panel 68P 71P Panel 72P Exhibit 2 - Flood Insurance Rate Map Index Flood Insurance Rate Map ii
5 FLOOD INSURANCE STUDY KENAI PENNISULA BOROUGH, ALASKA AND INCORPORATED AREAS 1.0 INTRODUCTION 1.1 Purpose of Study This Flood Insurance Study (FIS) revises and updates information on the existence and severity of flood hazards in the geographic area of Kenai Peninsula Borough, including the Cities of Kenai, Seward, Soldotna, and Seldovia; and the unincorporated areas of Port Graham, English Bay, Nikishka, Ninilchik, Anchor Point, Moose Pass, Cooper Landing, and Hope (referred to collectively herein as Kenai Peninsula Borough), and aids in the administration of the National Flood Insurance Act of 1968 and the Flood Disaster Protection Act of This study has developed flood-risk data for various areas of the community that will be used to establish actuarial flood insurance rates and to assist the community in its efforts to promote sound floodplain management. Minimum floodplain management requirements for participation in the National Flood Insurance Program (NFIP) are set forth in the Code of Federal Regulations at 44 CFR, Please note that the City of Homer, Alaska is geographically located in the Kenai Peninsula Borough. The City of Homer is not included in this FIS report. See the separately published FIS report and Flood Insurance Rate Map (FIRM) for floodhazard information. The Digital Flood Insurance Rate Map (DFIRM) and FIS report for portions of this countywide study have been produced in digital format. Flood hazard information was converted to meet the Federal Emergency Management Agency (FEMA) DFIRM database specifications and Geographic Information System (GIS) format requirements. The flood hazard information was created and is provided in a digital format so that it can be incorporated into a local GIS and be accessed more easily by the community. 1.2 Authority and Acknowledgments The sources of authority for this FIS are the National Flood Insurance Act of 1968 and the Flood Disaster Protection Act of Information on the authority and acknowledgements for each jurisdiction included in this countywide FIS, as compiled from their previously printed FIS reports, is shown below: 1
6 Kenai Peninsula Borough (Incorporated and Unincorporated Areas): The hydrologic and hydraulic analyses for the 1981 FIS report were performed by the U.S. Army Corps of Engineers, for FEMA, under Interagency Agreement Nos. IAA-H-7-76, Project Order No. 25, and IAA-H-10-77, Project Order No. 2. This work, which was completed in January 1978, covered all significant flooding sources affecting the Kenai Peninsula Borough. The hydrologic and hydraulic analyses for the Kenai River were updated for the 1999 FIS report. The restudy was performed by the U.S. Army Corps of Engineers, Alaska District, for FEMA under Interagency Agreement No. EMW-96-IA-0195, Project Order No. 9. This work was completed in December The hydrologic and hydraulic analyses for this 2010 FIS were performed by Northwest Hydraulic Consultants, Inc., for FEMA, under Contract No. EMS CO-0067, Project Order No. 28. This update included detailed studies of Bear Creek, Grouse Creek, Kwechak River, Resurrection River, Salmon Creek, Salmon Creek/Resurrection River Split, Salmon Creek Overflow and Salmon Creek Split within the City of Seward and surrounding Unincorporated Areas. The work was completed in December Base map information shown on the DFIRM was derived from the U.S. Geological Survey (USGS), the Kenai Peninsula Borough, and the Alaska Department of Natural Resources produced at a scale of between 1:2,400 to 1:63,360 depending on the data source, data dated 1989 or later. The projection used in the preparation of this map is Transverse Mercator, and the horizontal datum used is North American Datum of Coordination An initial meeting is held with representatives from FEMA, the community, and the study contractor to explain the nature and purpose of a FIS, and to identify the streams to be studied or restudied. A final meeting is held with representatives from FEMA, the community, and the study contractor to review the results of the study. The initial and final meeting dates for previous FIS reports for Kenai Peninsula Borough and its communities are listed in the following table: Community FIS Date Initial Meeting Final Meeting Kenai Peninsula Borough May 19, 1981 January 28 to 30, 1976 March 3 to 4, 1980 December 6, 1999 N/A December 2,
7 The initial meeting for this 2010 FIS update was held on May 2, 2007, and attended by representatives of FEMA, City of Seward, Kenai Peninsula Borough, Seward/Bear Creek Flood Service Area, Alaska Department of Commerce and Northwest Hydraulic Consultants, Inc. The results of the study were reviewed at the final meeting held on (to be determined), 2010, and attended by representatives of (to be determined). All problems raised at that meeting have been addressed. 2.0 AREA STUDIED 2.1 Scope of Study This FIS covers the geographic area of the Kenai Peninsula Borough, Alaska, including the incorporated communities listed in Section 1.1. The areas studied by detailed methods were selected with priority given to all known flood hazards and areas of projected development or proposed construction through The areas studied consisted of Kenai River Valley; Kasilof River Valley; Resurrection River Valley; North Kenai lakes area; the areas encompassing the cities of Kenai, Seward, Soldotna, and Seldovia; and the unincorporated areas of Port Graham, English Bay, Nikishka, Ninilchik, Anchor Point, Moose Pass, Cooper Landing, and Hope. Wind-driven-wave patterns in coastal areas adjacent to these areas were studied in order to delineate coastal flooding. Areas not studied consist of the Chugach National Forest, the Kenai National Moose Range, and areas with little or no development potential. The following streams are studied by detailed methods in this FIS report: Bear Creek Kwechak River Salmon Creek Overflow Grouse Creek Resurrection River Salmon Creek Split Kenai River Salmon Creek Sawmill Creek Kasilof River Salmon Creek/Resurrection River Split Cook Inlet, Katchemak Bay, and Resurrection Bay were also studied in detail. The watercourses and water bodies studied were chosen after giving consideration to existing and potential development along each of the streams and to the predicted floodflows and flood widths of each. These streams constitute the principal drainages, which have potential for flood damage, within the study area. The limits of detailed study are indicated on the Flood Profiles (Exhibit 1) and on the FIRM (Exhibit 2). Bear Creek, Grouse Creek, Resurrection River, Salmon Creek, Salmon Creek/Resurrection River Split, Salmon Creek Overflow, Salmon Creek Split, and Sawmill Creek are new or updated reaches for 2010 FIS revision. 3
8 Portions of Kenai River and Cook Inlet were studied by approximate methods. In addition, numerous streams and lakes were studied by approximate methods. Approximate analyses were used to study those areas having low development potential or minimal flood hazards. The effective approximate area boundaries for Clear Creek, Japp Creek, Lowell Creek and Marathon Creek were adjusted for the 2010 FIS revision based on updated topographic data. For this countywide FIS, the FIS report and FIRM were converted to countywide format, and the flooding information for the entire county, including both incorporated and unincorporated areas, is shown. Also, the vertical datum was converted from the National Geodetic Vertical Datum of 1929 (NGVD) to the North American Vertical Datum of 1988 (NAVD). In addition, the Transverse Mercator, State Plane coordinates, previously referenced to the North American Datum of 1927 (NAD27), are now referenced to the North American Datum of 1983 (NAD83). 2.2 Community Description Kenai Peninsula Borough, in the third Judicial District in south-central Alaska, governs an area of more than 25,600 square miles. Kenai Peninsula is surrounded by the Greater Anchorage Area Borough to the north, Cook Inlet to the west, and the Gulf of Alaska to the south and east. Kenai, Kasilof, and Resurrection Rivers and Sawmill Creek flow from the mountains into coastal waters. Bear, Grouse and Kwechak Creeks are tributaries to Salmon Creek. Salmon Creek is a tributary to the Resurrection River. The Salmon Creek/Resurrection River Split is a side channel connection between Salmon Creek and the Resurrection River. Salmon Creek Overflow and Salmon Creek Split are Salmon Creek side channels. The streams and detailed study areas are described in the following text. The source of Kenai River is Kenai Lake, which is formed from the runoff from glacial rivers and lakes in steep mountainous terrain. After emerging from the lake, the river flows westerly for approximately 75 miles through the Kenai National Moose Range and privately owned land (near the communities of Sterling and Soldotna) to its outlet in Cook Inlet at Kenai. The entire watershed of the river lies within the Kenai Peninsula Borough. Most of the area is wilderness under Federal control, in either the Chugach National Forest or the Kenai National Moose Range. The eastern portion of the watershed consists predominantly of steep mountain slopes and many glaciers and icefields. Elevations rise to more than 6,000 feet. From west of the mountains to Cook Inlet, the watershed consists of rolling land and numerous lakes and muskegs. Kenai River is also fed by Moose River, Killey River, Funny River, Soldotna Creek, Slikok Creek, and Beaver Creek. For this study, Kenai River was investigated for approximately 47 river miles, from the Kenai National Moose Range boundary near Skilak Lake to Cook Inlet. Some agricultural land lies 4
9 along the river, but the principal development is residential and recreational. There is also some commercial development near the mouth. The floodplain of Kenai River in the study area is, for the most part, very narrow, and development in the area is relatively insignificant. There is ample high ground on each side of the river to provide safe building sites; however, consideration must be given to potential erosion problems. The area is growing rapidly as a recreational area; therefore, greatly increased development can be expected. Kasilof River, which starts at Tustumena Lake, winds westerly through undeveloped wilderness and emerges at the village of Kasilof on Cook Inlet. The upper portion of the river flows through a narrow canyon and has several rapids due to the steep descent. The lower portion of the river has steep banks and flows through a narrow floodplain. The area is expected to grow rapidly as a recreational area, and the high valley banks and adjacent areas will provide ample ground for safe building sites. Resurrection River, which has a drainage area of approximately 170 square miles, has its origin near Upper Russian Lake in the Chugach Mountains. From its headwaters, the river flows southeasterly for 22 miles, through the Chugach National Forest and privately owned land, to its outlet in Resurrection Bay at Seward. Unlike Kenai and Kasilof Rivers, Resurrection River has a braided channel and a steep gradient (60 feet in 3 miles). It has a channel bottom of silt, sand, gravel, and boulders; and the overbank areas are heavily covered with timber and brush. The portion of Resurrection River included in this study is from the mouth to a point approximately 3 miles upstream. Salmon Creek, a tributary of Resurrection River, originates at the terminus of Bear Lake Glacier and flows adjacent to the Seward Highway for approximately 7 miles, generally southerly, to its confluence with Resurrection River. The creek is a glacier-fed stream which traverses a broad alluvial floodplain. Heavy debris and gravel bars cause numerous channel changes. The portion of Salmon Creek studied (approximately 6.5 miles of the stream) is from the mouth to a point just above its confluence with Lost Creek. Salmon Creek Overflow is a side channel of Salmon Creek. If flows on the west side of the river near the confluence with Kwechak Creek. Salmon Creek Split is an overflow of Salmon Creek and flows along the east side of the Alaska Railroad and rejoins Salmon Creek downstream. Development in the Resurrection River-Salmon Creek area has greatly increased, as the City of Seward can expand only in the direction of these streams because the mountains and Resurrection Bay surround the city on the other three sides. There is ample high ground on both sides of these streams to provide safe building sites. 5
10 Japp Creek, which was studied by approximate methods, flows into Resurrection River from the east. The creek is a flood threat to the housing development below it. The North Kenai lakes area, an area protruding into Cook Inlet just north of the City of Kenai, consists of approximately 100 square miles of lakes and lowlands. The area is surrounded by Cook Inlet to the north and west, Kenai to the south, and the Kenai National Moose Range to the east. It is rapidly being developed as a recreational and residential area. There are no major streams in the area, but interconnecting creeks between the numerous lakes constitute a possible flood threat. Seldovia is a fishing village 140 air miles southwest of Anchorage, near the southern end of the Kenai Peninsula, across Kachemak Bay from Homer. The storm-wave study encompasses most of the eastern shore of Seldovia Bay (including the lagoon), which constitutes the only flood threat to the city. No rivers or significant streams are within the corporate limits of Seldovia; therefore, riverine flooding is not a problem. Port Graham is a small village on Port Graham Inlet, an inlet off Cook Inlet 22 air miles southwest of Homer. The village is sheltered from the brunt of the storms on Cook Inlet, but it will receive storm-driven waves. The buildings have been constructed on higher ground in order to avoid this type of flooding. Small streams and drainage ditches are present, but they do not cause flood problems. English Bay, a small village near the tip of Kenai Peninsula, is exposed to Cook Inlet and its storm waves. Buildings were relocated to higher ground on the steep slopes of the mountain after earlier flooding. A runway on a spit below the village could be overtopped, but no flood damage should result from storm waves. A more serious threat is the danger of tsunami, since English Bay is directly across Cook Inlet from Mt. Augustine, an active volcano on Augustine Island. Nikishka is a fuel tanker terminal on Cook Inlet, 10 miles north of Kenai. Several docks are subject to severe storm waves. The refineries are on top of steep cliffs and are not in danger from flooding. Ninilchik, a village on Cook Inlet 38 air miles south of Kenai, is at the mouth of Ninilchik River, and therefore, it is subject to both coastal and river flooding. A narrow spit affords some protection against storm waves and also shelters a small boat basin. Anchor Point is a small fishing community and recreation area on Cook Inlet, at the mouth of Anchor River 20 miles south of Ninilchik and 15 miles northwest of Homer. It is subject to coastal and riverine flooding as is Ninilchik. Both Ninilchik and Anchor Rivers flow through narrow valleys with little or no 6
11 development except at their mouths. There is little flood danger except in the developed areas. Moose Pass, a small community 25 miles north of Seward, is subject to flooding due to its location on Trail Lake, which periodically floods. Numerous streams feed Trail Lake; therefore, the water surface can rise rapidly. In addition, Snow Lake, when blocked by ice, periodically releases a large volume of water which can enter Trail Lake from Moose and Trail Creeks. Wave action on Trail Lake also can cause erosion. Cooper Landing is a small community on the banks of Kenai River near the outlet of Kenai Lake 48 air miles east of Kenai. Kenai River periodically floods this area, due to both heavy runoff and Snow Lake dumping. Hope is a small village on the coast of Turnagain Arm, the north coast of the Kenai Peninsula. It is approximately 20 air miles southeast of Anchorage at the mouth of Resurrection Creek. It is, therefore, subject to coastal as well as riverine flooding. Portions of the Seward and Sterling Highways, primarily consisting of the portions on each side of Moose Pass and Cooper Landing, are included in the study where development is expected and streams cross the highways. The coastal areas adjacent to some of the cities consist of natural beaches ranging from gradually sloped sand or mud flats to natural rock revetments. Mean annual precipitation on the Kenai Peninsula varies from a low on the northwest side increasing towards the Gulf of Alaska. Most precipitation on the peninsula occurs during September and October. Snow begins to fall in October and stops in April or early May. The average annual temperatures, average annual total precipitation and average annual snowfall at Homer, Kasilof, Kenai, and Seward are listed below. Data reported are from the National Climatic Data Center (NCDC) Station , at the Homer Airport, for the period 1932 to 2009; NCDC Station in Kasilof, for the period 1931 to 1997; NCDC Station , at the Kenai Airport, for the period 1949 to 2009; and at NCDC Station , in Seward, for the period 1949 to These coastal climatological data stations are at an elevation of 100 feet or less. Average Annual Temperature (Fahrenheit) Average Annual Precipitation (inches) Average Annual Snowfall (inches) Station Homer Kasilof Kenai Seward
12 2.3 Principal Flood Problems Floods on the Kenai Peninsula can occur as a result of a combination of factors, which include heavy snowpack and snowmelt, high tides, and heavy precipitation. High winds when combined with high tide create storm surge and wave runup, which flood coastal areas. Spring floods on streams may result when an abovenormal snowfall during the winter is followed by an unusually warm spring and a rapid snowmelt. Summer and autumn floods usually result from intense precipitation. In addition, two other situations causing flooding can occur on Kenai River. The first, known as jokulhlaup, occurs when a glacier-dammed lake is suddenly released (Reference 1). When this happens during the winter, the sudden increase in flow raises the ice cover and attempts to move it downstream. Ice jams result and flooding to depths far greater than either the 100- or 500-year flood can occur. The second, ice jams, occurs during spring breakup, and it can also cause flooding to depths greater than either the 100- or 500-year flood. The severe nature of Alaskan winters lends itself to these unusual types of flooding. When there is a heavy ice cover on the river, untimely breakups (or jokulhlaups) can cause the ice to jam. Ice jams usually occur at natural restrictions or bends in the river and can cause water to back up and flood low areas. Floods resulting from the sudden release of glacier-dammed lakes have occurred on the Kenai River in past years. This type of flooding was first recorded in December 1911 and on numerous other occasions up to September These floods originate from lakes formed either by Snow Glacier, at the head of Snow River, or by Skilak Glacier. Future floods from most glacier-dammed lakes cannot be estimated reliably by using standard statistical procedures because the hydrologic characteristics of the drainage basin may change suddenly and discontinuously and glacier-dammed lakes which have no previous record of dumping may abruptly begin to do so. In addition, the flood sequence may change drastically, or the reservoir may cease filling due to changes in the glacier. Therefore, peak flows during a flood of this type have not been assigned a frequency nor have jokulhlaups been considered in the development of the maps and flood profiles in this study. As a means of comparison, however, the September 1974 jokulhlaup attained a peak discharge of 26,800 cubic feet per second (cfs) at Soldotna, and the 1-percent-annual-chance flood, as determined by means of conventional storm-runoff computations, would reach 37,500 cfs at the same location. Kenai Peninsula is in a zone which has a relatively high probability of strong earthquakes. The most heavily populated part of the coast is directly across Cook Inlet from Mt. Augustine, an active volcano on Augustine Island. Local tsunamis, where discussed in this study, are defined as locally generated waves resulting from massive earth or rock slides (either above or below water), ice falls, seiches, 8
13 and similar phenomena. Earthquakes may or may not be associated with this type of tsunami, and warning would not be possible. A teleseismic tsunami is defined as a tsunami resulting from an earthquake and is usually caused by displacement of the ocean floor. It generally occurs as a series of waves from the open sea. Local tsunami are an ever-present threat to many communities in Kenai Peninsula Borough. However, there is no way that a frequency can be assigned to an unpredictable event in Alaska due to the relatively short period of record. Tsunami are therefore, not included as elevation figures in this study. Local tsunami should always, however, be a consideration before beginning any construction in the coastal areas. The frequency of the 1964 teleseismic tsunami has been studied by the U.S. Army Corps of Engineers Waterways Experiment Station in Vicksburg, Mississippi, and has been determined to exceed the 500-year event. The Waterways Experiment Station determined the 100- and 500-year teleseismic tsunami waves for Seward, Homer, and Seldovia (Reference 2). The 500-year level of inundation by a teleseismic tsunami at all three locations was calculated to be below the 1- percent-annual-chance storm event. As is typical of most of Alaska, there is little information available concerning historical floods on the Kenai Peninsula. There is no record of a major flood with known discharge and documented water levels. Public agencies and longtime residents, however, can verify that floods have occurred. Information concerning historical floods was obtained primarily from interviews with residents in the area. Resurrection River and Salmon Creek have overflowed their banks several times and have caused flood damages to the developed areas near their mouths. Past floods and an analysis of conditions resulting from floods are shown in Table 1. Factors aggravating flooding are natural obstructions such as trees and vegetation along the banks; manmade obstructions such as bridges and boat docks; ice jams; the accumulation along and within the streambed of brush and debris which can be carried downstream by high water; and blocked bridge openings, inadequately sized culverts, or other constrictions. As mentioned previously, there are several catastrophic situations which can occur in Kenai Peninsula Borough. These include jokulhlaups, ice jams, and local tsunami. All of these problems can not readily be assigned a frequency in Alaska, and are, therefore, not site-specifically evaluated in this study. However, they are a threat and should always be considered when planning development in threatened areas. 9
14 Table 1 - Floods of Record on the Kenai Peninsula Year Location Flooding Conditions 1902 English Bay St. Augustine eruption caused waves 20 to 30 feet on low tide; minor damage (Reference 3) Resurrection River First recorded flood in vicinity of airport; 400 acres inundated Cooper Landing A few basements flooded; water over Sterling Highway in places Anchor Point November rains caused river to top banks, but there were no buildings at that time Salmon Creek Salmon Creek overflowed at approximately River Mile 4; flooded railroad and threatened railroad bridge; floodwaters surrounded Metcalf Country Store Resurrection River Floodwaters rose unexpectedly at night from heavy snowmelt in mountains due to warm weather; wells polluted by surface water; 5 feet of water in Clear Creek area Resurrection River River eroded easterly into Clear Creek drainage and headwater area; old car bodies were dumped in an attempt to halt the erosion Moose Pass Water reached the school and topped the railroad tracks, flooding railroad station Resurrection River River overflowed; heavy floodflows caused bank erosion along the east bank above the highway Salmon Creek and Resurrection River Flooded 8000 feet of highway on Nash Road; 500 feet of airport runway eroded; private homes damaged Resurrection River Heavy floodflows spread out over east side of floodplain; severe bank erosion above and below highway; washed out Airport Road bridge Seldovia 15-foot teleseismic tsunami wave (Reference 4) Homer 20-foot teleseismic tsunami wave; 4 feet over end of spit (Reference 4) Kenai River Ice-jam flooding caused five families to evacuate their homes on Ciechanski Road and Rebel Run (Reference 4) Seward 30- to 40-foot tsunami waves with runup to 49.3 feet (Reference 4) English Bay 30-foot tsunami wave (Reference 4) Port Graham 10- to 20-foot tsunami wave (Reference 4) Kenai River Ice-jam flooding caused 22 families (81 people) to evacuate their homes; docks, seaplanes, and many homes and businesses damaged; several trailer homes washed away Kenai River Winter jokulhlaup caused ice jams with extensive flooding and damage Kenai River Ice-jam flooding washed out docks and boats and flooded several homes; during autumn, jokulhlaup caused flooding and minor damage Salmon Creek Overbank flows and minor bank erosion; some minor property damage in vicinity of Nash Road crossing Cooper Landing Floodwaters reached top of dock at Post Office Port Graham Cannery flooded by coastal storm English Bay Airport runway partially flooded by coastal storm Moose Pass Water flooded sewer system, closing school Salmon Creek Overbank flows and minor bank erosion. Some minor property damage in vicinity of Nash Road crossing Kenai River Heavy snowmelt caused a 20-year flood in August; glacier lake dumping caused a 20-year flood in September; both resulted in moderate flooding in Salmon Run Acres. 10
15 Table 1 - Floods of Record on the Kenai Peninsula (Cont d) Year Location Flooding Conditions 1983 Anchor River Flooding washed out two portions of the Old Sterling Highway; erosion occurred along the south bank of the lower river, particularly along the Old Sterling Highway bridge and public campground Anchor River May/June-High water washed away bridge, flooded private property, and caused significant erosion at the Anchor River State Recreation Area Bradley Lake, Heavy peninsula-wide rains caused minor erosion damage to Homer, Ninilchik, Bradley Lake, Homer, and along the Anchor River. Other Anchor River damage included mud slides at the Ninilchik boat harbor Kenai River Heavy rains on October caused flooding damage to a culvert at Beaver Creek and the Spur Highway as well as major bank sloughing along the bluff in Kenai Seward Heavy rains on October caused severe damage to bridges, bridge approaches, railroad and highway embankments, and numerous homes and businesses Seward Heavy rains on August caused over $1 million in damage to homes, roads, bridges, etc. Other areas of the Peninsula reported flooding, but sustained less damage Kenai River September-Flooding observed along the South River Bank in the Riverside Lane area (River Mile 15.5). Some homes and trailers affected; up to 1 foot of water on the ground. A half dozen cabins inundated with 1 to 1.5 feet of water in the Castaway Cove Area (River Mile 14.5 and 14.7) Anchor River Flooding damage to one home was reported due to an ice jam on the North Fork of the Anchor River Seward Heavy rains on August 26 caused Salmon Creek, Clear Creek, and the Resurrection River to flood. Three homes and one business incurred damage. The railroad tracks at the upper end of Kenai Lake were damaged, and parts of Primrose Road were submerged Cooper Landing Jokulhlaup flooding occurred from the release of water from Snow River Glacial Lake. Yards and docks along the river were submerged Homer Storm undercut ½ mile of newly paved Homer Spit road Seldovia Storm damaged a park in Seldovia and wiped out the runway in Nanwalek Kenai Peninsula Borough Heavy rains from a continuous series of storms caused extensive flooding across South central Alaska. Borough-wide damage estimates exceeded $5 million. This included extensive damage to public facilities, commercial property and private residences Kenai River In November the lower portion of the Kenai River experienced a flood event that approximated the 1-percent-annual-chance flood discharge figure used in the 1980 Flood Insurance Study Seward Heavy rains associated with a series of storm fronts caused severe flooding in the Seward area. Area roads, bridges, the airport, harbor and many homes and businesses incurred serious flood damage. Road and utility repairs alone were estimated at $3.5 million Kenai Peninsula Borough 2006 Kenai Peninsula Borough Record-setting precipitation and unusually warm temperatures produced widespread flooding in the fall of Significant floods occurred in October and again in November. An October storm brought record-breaking precipitation and high winds over a widespread area. 11
16 2.4 Flood Protection Measures With the exception of Lowell Creek, near Seward, there are no flood-control structures on any of the streams in this study. In 1945, the U.S. Army Corps of Engineers diverted Lowell Creek (which formerly flowed through the center of Seward) via a tunnel through the mountains. The previous annual flooding has, therefore, been eliminated (Reference 5). In several of the coastal areas, rock revetments and breakwaters have been constructed to protect boat harbors. Most improvements along the coast are at higher elevations and are well above potential flooding. 3.0 ENGINEERING METHODS For the flooding sources studied by detailed methods in the community, standard hydrologic and hydraulic study methods were used to determine the flood hazard data required for this study. Flood events of a magnitude that are expected to be equaled or exceeded once on the average during any 10-, 50-, 100-, or 500-year period (recurrence interval) have been selected as having special significance for floodplain management and for flood insurance rates. These events, commonly termed the 10-, 50-, 100-, and 500-year floods, have a 10-, 2-, 1-, and 0.2-percent chance, respectively, of being equaled or exceeded during any year. Although the recurrence interval represents the long-term, average period between floods of a specific magnitude, rare floods could occur at short intervals or even within the same year. The risk of experiencing a rare flood increases when periods greater than 1 year are considered. For example, the risk of having a flood that equals or exceeds the 1-percent-annual-chance (100-year) flood in any 50-year period is approximately 40 percent (4 in 10); for any 90-year period, the risk increases to approximately 60 percent (6 in 10). The analyses reported herein reflect flooding potentials based on conditions existing in the community at the time of completion of this study. Maps and flood elevations will be amended periodically to reflect future changes. 3.1 Hydrologic Analyses Hydrologic analyses were carried out to establish peak discharge-frequency relationships for each flooding source studied by detailed methods affecting the community. The analyses included a review of all flood-frequency data for the area and the use of analytical techniques that were best suited to the specific stream data. Peak discharges were determined by use of the U.S. Geological Survey stream gaging records for Kenai River at Cooper Landing ( ), Kenai River at Soldotna ( ), and Kasilof River at Sterling Highway ( ). All of the streams were evaluated on a regional frequency basis; however, the final analysis of each gaged stream was made based on an annual series. Statistical analyses were conducted in accordance with the Water Resources Council guidelines for determining flood-flow using the Streamflow Synthesis and Reservoir Regulations computer program developed by the U.S. Army Corps of 12
17 Engineers (Reference 6). Log-Pearson Type III frequency distribution with a 0.7 recommended skew coefficient was used (Reference 7). Peak discharge quantiles were updated for several rivers and creeks in or near the City of Seward for this 2010 FIS update. The following watercourses were studied: Resurrection River, Salmon Creek, Kwechak Creek, Bear Creek, Grouse Creek, and Sawmill Creek. Discharge quantiles were initially estimated using regional regression equations developed by the USGS (Reference 8). These data were evaluated against observations of extreme peak discharges resulting from surge-release floods (i.e. debris dam failures) or other anomalous events and appropriate adjustments were then made to the peak flows (Reference 9). Peak discharge-drainage area relationships for each flooding source studied in detail are shown in Table Hydraulic Analyses Analyses of the hydraulic characteristics of flooding from the sources studied were carried out to provide estimates of the elevations of floods of the selected recurrence intervals along each stream studied in the borough. Users should be aware that flood elevations shown on the FIRM represent rounded whole-foot elevations and may not exactly reflect the elevations shown on the Flood Profiles or in the Floodway Data Table in the FIS report. Flood elevations shown on the FIRM are primarily intended for flood insurance rating purposes. For construction and/or floodplain management purposes, users are cautioned to use the flood elevation data presented in this FIS report in conjunction with the data shown on the FIRM. Water-surface elevations were computed for all streams studied by detailed methods by use of the HEC-2 or HEC-RAS computerized water-surface profile program (Reference 10 and Reference 11). These programs compute the watersurface profile for stream channels at any cross-section for subcritical, critical, or supercritical flow conditions and considers the effects of various structures such as bridges, culverts, weirs, and embankments. These programs apply Bernoulli s theorem for the local energy at each cross section and Manning s formula for the friction slope for a reach between two cross sections as determined in terms of the average of the conveyances at the two ends of the reach. Other losses are computed using one of several standard methods. Critical water-surface elevations, corresponding to the minimum specific energy, are computed using an iterative process. Locations of selected cross sections used in the hydraulic analyses are shown on the Flood Profiles (Exhibit 1). For stream segments for which a floodway was computed (Section 4.2), selected cross section locations are also shown on the FIRM (Exhibit 2). 13
18 Table 2 - Summary of Discharges Drainage Area (square miles) 10-Percent- Annual-Chance Peak Discharges (cubic feet per second) 2-Percent- Annual-Chance 1-Percent- Annual-Chance 0.2-Percent- Annual-Chance Flooding Source and Location Bear Creek 1 At upstream study limit Grouse Creek 1 At upstream study limit ,020 1,140 1,450 Kasilof River At Cross Section M ,810 13,700 15,035 18,200 Kenai River At mouth 2,162 28,000 37,300 38,300 47,000 At Soldotna gaging station 2 2,010 28,000 38,500 44,000 58,000 Below Funny River 1,905 26,600 33,800 36,800 45,300 Downstream of Moose River 1,748 25,600 32,700 35,900 44,300 Downstream of Killey River 1,484 23,800 30,600 33,700 43,700 At outlet of Skilak Lake 1,257 22,100 28,600 31,500 39,400 At Cooper Landing ,000 23,500 26,500 33,000 Kwechak Creek 1 At Salmon Creek confluence 6.9 1,190 2,140 2,780 5,160 Resurrection River 1 At upstream study limit ,700 22,720 25,280 31,670 Downstream of Box Canyon ,040 25,930 28,870 36,190 To Seward Highway ,230 26,190 29,160 36,570 Salmon Creek 1 Downstream of Grouse Cr ,370 2,910 4,250 11,480 Upstream of Bear Creek ,630 3,430 5,000 13,530 Upstream of Kwechak Cr ,860 4,310 6,340 15,900 Downstream of Kwechak Cr ,340 4,910 6,930 16,080 Upstream of Clear Creek ,530 4,950 6,790 14,970 Downstream of Clear Creek ,640 5,280 7,340 16,540 To Nash Road ,650 5,170 7,120 15,730 Sawmill Creek 1 At upstream study limit ,490 2,440 3,010 4,930 At Resurrection Bay ,460 2,350 2,860 4,590 1 New or updated data in 2007 (Reference 9) 2 Data based on additional gage records from 1980 through Sawmill Creek discharges decrease in a downstream direction due to floodplain storage 14
19 For the Kasilof and Kenai Rivers, cross section data were obtained from field survey notes, field reconnaissance, photographs, topographic maps (References 12 through 22), and previous reports (References 23 through 25). Roughness factors (Manning s n ) were generally assigned on the basis of field inspection of floodplain areas together with computer determination of n with normal flows and standard published factors for pipe and corrugated metal culverts. For Kenai River, roughness factors were taken from a previous report (Reference 23). For Kasilof River, the n value for the channel was determined by performing a backwater analysis with known elevations and flow rates at the Sterling Highway Bridge. The overbank n values were determined by observation of the area and comparison with similar areas for which the roughness factors are known. The Manning s n values for all detailed studied streams are listed in the following table: Manning's "n" Values Stream Channel n Overbank n Bear Creek Grouse Creek Kasilof River Kenai River Kwechak Creek Resurrection River Salmon Creek (incl. side channels) Sawmill Creek Starting water-surface elevations for the Kasilof and Kenai Rivers were based on a reasonable high tide which could occur during a month that flooding would be likely to occur. Kenai River, at an elevation of 190 feet at the upstream limit of the study drops to sea level in Cook Inlet 47 miles downstream. Two large lakes upstream from the study area regulate the flow. The overbank areas vary from mudflats to dense tree cover. As the mean tide range is nearly 20 feet on Cook Inlet, considerable backwater would be expected at the mouth of the river during a high tide. However, the Kenai River s mouth is more than 1 mile wide and can accommodate high tides. The 1-percent-annual-chance coastal storm would cause the water surface to reach a peak at the coast and gradually recede upstream to a level of less than the 1-percent-annual-chance tide. This tide would then control until the river flooding reached a higher level. This would occur at cross section W. The two bridges over Kenai River in the study area, are high enough to avoid overtopping. However, numerous docks and gravel pads, which extend out into the river, impede flow. Several rivers and creeks that flow into Kenai River were studied by approximate methods. Both the 1- and 0.2-percent-annual-chance floods would cause only moderate flooding. Beaver Creek enters Kenai River at River Station 53,000. It actually flows in a side channel of the river between this station and River Station 59,000, but the flow in this channel is minimal as compared with the main channel flow. 15
20 Therefore, the side channel was not considered in the backwater computations. Due to the broad floodplains in some overbank areas, shallow flooding results. Elevations for these areas of shallow flooding were computed by using fieldsurveyed cross sections and the HEC-2 computer program (Reference 10). Kasilof River, which drops from an elevation of 108 feet to sea level in 15 miles, winds through dense wilderness to Cook Inlet. Like the Kenai River mouth, the Kasilof River mouth is wide and accommodating to high tides. The 1-percentannual-chance coastal storm-water surface level is higher than stream flooding up to cross section K. Since the Kasilof River originates in Tustumena Lake, it is self-regulating, and there is little danger of ice-jam flooding. The Sterling Highway Bridge is the only bridge across the river, and it is high enough to avoid overtopping. However, some docks extend into the river and constrict flow. Two parallel bridges, Seward Highway and Alaska Railroad, cross Resurrection River near the mouth. Three openings through the bridge system divide the flow into thirds. Although the bridges greatly constrict the flow, the 0.2-percentannual-chance flood would not top them. Considerable backwater upstream causes moderate flooding and is a serious hazard to development near the river. There is little development, however, because of the frequent flooding. Coastal flooding governs up to cross section F on Resurrection River. Resurrection River is gradually changing its course by eroding easterly into the Clear Creek area. As the area s material can be easily eroded, a dangerous situation can develop. The river can readily change its course during flooding and cause new areas to be flooded. The primary factor contributing to flooding on Resurrection River is the heavy accumulation of brush and debris along and within the streambed. During floods, vegetation on the floodplain impedes flood flows, thereby creating backwater and increased flood heights. Trees and other debris may be washed away and carried downstream. Increased flooding and other damage results when this debris collects at bridge abutments or other obstructions. Since it was impossible to predict the amount of accumulation of debris, it was assumed that there would be no accumulation. Salmon Creek, a glacier-fed stream, traverses a broad alluvial flood plain where heavy debris and gravel bars cause frequent channel changes. A railroad embankment crosses the Salmon Creek drainage basin and acts as a levee. At high flow the creek divides into a side channel running along the eastern side of the railroad. Further information on the Resurrection River and Salmon Creek are provided in Section Updated detailed studies for these two rivers, along with new detailed studies of Bear, Grouse, Kwechak, and Sawmill Creeks, were completed in
21 The 1-percent-annual-chance flood levels for all streams studied by approximate methods were based on field examinations, historical information, map reconnaissance, and engineering judgment. Japp Creek, which was studied by approximate methods, was found to cause only moderate flooding. Calculations showed that the creek would remain within its banks at the critical point upstream above Forest Acres Subdivision. However, it would top its banks near the gravel pit and flood the alluvial fan, thereby causing damage to the few homes between the gravel pit and Resurrection River. The profile baselines depicted on the FIRM represent the hydraulic modeling baselines that match the flood profiles on this FIS report. As a result of improved topographic data, the profile baseline, in some cases, may deviate significantly from the channel centerline or appear outside the Special Flood Hazard Area. Profile baselines were used on along the Resurrection River and Salmon Creek due to the meandering nature of the stream channels. The hydraulic analyses for this study were based on unobstructed flow. The flood elevations shown on the Flood Profiles (Exhibit 1) are thus considered valid only if hydraulic structures remain unobstructed, operate properly, and do not fail. 3.3 Wave Height Analysis A detailed coastal study was performed so that an estimate of coastal flooding at specific sites could be made. Analyses of storm surge, wave setup, and wave runup were performed in accordance with the design criteria in the Shore Protection Manual of 1973, written by the U.S. Army Corps of Engineers Coastal Engineering Research Center (Reference 26). The under-water and above-water topography were determined by the use of maps, U.S. Coast and Geodetic Survey navigation charts (Reference 27), and by visual inspection. Wind data are sparse, but some data are available in the vicinity of each site. Therefore, wind data used for a specific site are representative of the general wind conditions. By use of the available wind data (Reference 28), wind frequency curves were derived for the specific sites. Tide frequency curves were derived by use of the frequency distribution functions developed by the U.S. Army Corps of Engineers Coastal Engineering Research Center for the tide reference stations in Alaska (Reference 29). The tide frequency curves and wind frequency curves were used in conjunction in order to determine the 1-percent-annual-chance event. These calculations yielded three tide/wind combinations; a 1-percent-annual-chance tide event with a low wind velocity, a 1-percent-annual-chance wind event with a lower high tide, and a tide/wind combination between the two events. The combination yielding the highest elevation was used as the 1-percent-annual-chance elevation. The 10- percent-annual-chance event was computed similarly. FEMA did not require that the 2- percent-annual-chance and 0.2- percent-annual-chance elevations be computed for the tidal areas. 17
22 Field reconnaissance and surveys were made of key structures. Significant ponding could cause overtopping and eventual failure of roads. However, ponding was not considered in this study because failure would normally reduce the predicted flood levels. All bridges were considered to have remained intact during flooding. Wave setup, runup, and surge were calculated for all three tide/wind combinations, and the maximum flood elevation was plotted. The computed surge is the result of wind setup only and does not take into account the surge caused by pressure differences on the open coast. Most locations in this study are substantially away from the open coast. Seward, however, is subject to the pressure-caused surges in the Gulf of Alaska as it is only separated from the gulf by the relatively small Resurrection Bay. The only way to predict these surges and their effect on Seward is through the use of hydrodynamic equations. The data for development of these equations are not available; therefore, the open-sea surge was not considered in this study. In order to determine the flood elevations, allowances were made for the irregularity of the coastline, the changes in beach slope, and the variation of beach materials. The calculated flood levels compared favorably with the observations of local residents and with previous high-water marks. Areas specified for approximate study were compared with areas of detailed study, and the approximate flood elevations were derived. Detailed coastal studies were made for Homer, Seward, Seldovia, Port Graham, English Bay, Kenai, and Nikishka. Port Graham, English Bay, Kenai, and Nikishka have had little flooding from coastal storms because the banks along their coasts are steep, and development has occurred at higher elevations. Stillwater elevations for the detailed coastal studies are shown in Table 3. All elevations are referenced to the National Geodetic Vertical Datum of 1929 (NGVD) except for Resurrection Bay which was converted to the North American Vertical Datum of 1988 (NAVD) as part of an update in 2009 (Section 10.2). The original survey work for Seldovia was referenced to mean lower low water level (MLLW), which is 9.3 feet below the NGVD. The original survey work for both English Bay and Port Graham was based on an assumed datum with the zero contour lines equal to 16.5 MLLW and 15.5 MLLW, respectively. Elevation reference marks used in the study are shown on the maps. Figure 1 is a profile for a hypothetical transect showing the effects of energy dissipation on a wave as it moves inland. This figure shows the wave elevations being decreased by obstructions, such as buildings, vegetation, and rising ground elevations and being increased by open, unobstructed wind fetches. Actual wave conditions may not necessarily include all of the situations shown in Figure 1. 18
23 Table 3 - Summary of Stillwater Elevations 10-Percent- Annual-Chance Water Surface Elevations (Feet) 2-Percent- Annual-Chance 1-Percent- Annual-Chance 0.2-Percent- Annual-Chance Flooding Source Cook Inlet 1 At Nikishka 15.4 n/a 17.1 n/a At Homer, West End 20.9 n/a 26.7 n/a At Homer, Fronting Beluga Lake 22.4 n/a 28.0 n/a At West Base of Homer Spit 22.1 n/a 27.9 n/a At Homer Spit 21.1 n/a 26.8 n/a At Seldovia, South of Gray Cliff 10.5 n/a 18.7 n/a At Seldovia, Northeast of Gray Cliff 15.1 n/a 24.4 n/a At Port Graham 28.1 n/a 31.1 n/a At Port Graham 28.8 n/a 32.7 n/a At Port Graham 27.8 n/a 31.1 n/a At Port Graham 28.0 n/a 30.5 n/a At Port Graham 28.0 n/a 30.9 n/a At English Bay, North 50.2 n/a 50.7 n/a At English Bay, South 56.5 n/a 57.2 n/a At Kasilof River 15.3 n/a 16.9 n/a At Kasilof River 14.4 n/a 16.0 n/a At Kasilof River 13.4 n/a 15.0 n/a At Kasilof River 11.9 n/a 13.5 n/a At Kasilof River 12.0 n/a 13.5 n/a Kachemak Bay 1 At East Base of Homer Spit 14.1 n/a 16.8 n/a At Homer, East End 12.7 n/a 14.3 n/a Resurrection Bay 2 At Seward 14.6 n/a 16.1 n/a At Seward 14.0 n/a 15.2 n/a At Seward 14.3 n/a 16.2 n/a At Seward 14.2 n/a 17.2 n/a 1 National Geodetic Vertical Datum of North American Vertical Datum of 1988 (converted from NGVD by adding 6.2 feet) Figure 1 - Transect Schematic 19
24 3.4 Vertical Datum All FIS reports and FIRMs are referenced to a specific vertical datum. The vertical datum provides a starting point against which flood, ground, and structure elevations can be referenced and compared. Until recently, the standard vertical datum in use for newly created or revised FIS reports and FIRMs was NGVD. With the finalization of NAVD, many FIS reports and FIRMs are being prepared using NAVD as the referenced vertical datum. All flood elevations shown in this FIS report and on the FIRM are referenced to NGVD except for the areas in and around the city of Seward which are referenced to NAVD. Stillwater elevations for Resurrection Bay were taken from the prior effective FIS and adjusted to NAVD. The average conversion factor that was used to convert these data were from National Geodetic Survey (NGS) benchmarks and computed from Kenai Peninsula Borough (KPB) benchmarks using the GEOID99 ellipsoid model (Reference 30). The data points used to determine the conversion are listed in Table 4. NGS or KPB Station Table 4 - Vertical Datum Conversion Location NGVD29 (feet) NAVD88 (feet) Conversion from NGVD29 to NAVD88 (feet) BM X-74 Seward Airport BM E-76 Mile 7 Seward Highway BM B-76 Mile 4 Seward Highway KPB BM-3 Nash Road & Seward Highway KPB BM-7 Bruno Road Average: 6.19 For additional information regarding conversion between NGVD and NAVD, visit the NGS website at or contact the NGS at the following address: Vertical Network Branch, N/CG13 National Geodetic Survey, NOAA Silver Spring Metro Center East-West Highway Silver Spring, Maryland (301) Temporary vertical monuments are often established during the preparation of a flood hazard analysis for the purpose of establishing local vertical control. Although these monuments are not shown on the FIRM, they may be found in the 20
25 Technical Support Data Notebook associated with the FIS report and FIRM for this community. Interested individuals may contact FEMA to access these data. To obtain current elevation, description, and/or location information for benchmarks shown on this map, please contact the Information Services Branch of the NGS at (301) , or visit their website at FLOODPLAIN MANAGEMENT APPLICATIONS The NFIP encourages State and local governments to adopt sound floodplain management programs. Therefore, each FIS provides 1-percent-annual-chance (100- year) flood elevations and delineations of the 1- and 0.2-percent-annual-chance (500- year) floodplain boundaries and 1-percent-annual-chance floodway to assist communities in developing floodplain management measures. This information is presented on the FIRM and in many components of the FIS report, including Flood Profiles, Floodway Data Table, and Summary of Stillwater Elevations Table. Users should reference the data presented in the FIS report as well as additional information that may be available at the local map repository before making flood elevation and/or floodplain boundary determinations. 4.1 Floodplain Boundaries To provide a national standard without regional discrimination, the 1-percentannual-chance flood has been adopted by FEMA as the base flood for floodplain management purposes. The 0.2-percent-annual-chance flood is employed to indicate additional areas of flood risk in the community. For each stream studied by detailed methods, the 1- and 0.2-percent-annualchance floodplain boundaries have been delineated using the flood elevations determined at each cross section. Between cross sections, the boundaries were interpolated using topographic maps at a scale of 1:2,400 with contour intervals of 5 and 10 feet (Reference 12); 1:2,400, with contour intervals of 2 and 10 feet (Reference 13); 1:2,400, with contour interval of 2 feet (Reference 14); 1:4,800, with contour intervals of 2 and 10 feet (Reference 15); 1:4,800, with contour interval of 5 feet (Reference 16); 1:12,000, with contour intervals of 10 feet (Reference 17); 1:4,800, with contour interval of 5 feet (Reference 18); 1:12,000, no contours available (Reference 19); 1:63,360, with contour interval of 100 feet (Reference 20); 1: 63,360, with contour intervals of 50 feet (Reference 21); and 1:2,400, with contour interval of 5 feet (Reference 22). For areas of coastal and showing flooding, boundaries for the 1-percent-annualchance flood were delineated on the maps reference previously by using the computed elevations. The 1- and 0.2-percent-annual-chance floodplain boundaries are shown on the FIRM (Exhibit 2). On this map, the 1-percent-annual-chance floodplain boundary 21
26 corresponds to the boundary of the areas of special flood hazards (Zones A, AE, AH, AO, A99, V, and VE), and the 0.2-percent-annual-chance floodplain boundary corresponds to the boundary of areas of moderate flood hazards. In cases where the 1- and 0.2-percent-annual-chance floodplain boundaries are close together, only the 1-percent-annual-chance floodplain boundary has been shown. Small areas within the floodplain boundaries may lie above the flood elevations but cannot be shown due to limitations of the map scale and/or lack of detailed topographic data. For stream studied by approximate methods, the 1-percent-annual-chance flood boundary was delineated on these same maps by using the estimated elevations and only the 1-percent-annual-chance floodplain boundary is shown on the FIRM (Exhibit 2). 4.2 Floodways Encroachment on floodplains, such as structures and fill, reduces flood-carrying capacity, increases flood heights and velocities, and increases flood hazards in areas beyond the encroachment itself. One aspect of floodplain management involves balancing the economic gain from floodplain development against the resulting increase in flood hazard. For purposes of the NFIP, a floodway is used as a tool to assist local communities in this aspect of floodplain management. Under this concept, the area of the 1-percent-annual-chance floodplain is divided into a floodway and a floodway fringe. The floodway is the channel of a stream, plus any adjacent floodplain areas, that must be kept free of encroachment so that the 1-percent-annual-chance flood can be carried without substantial increases in flood heights. Minimum Federal standards limit such increases to 1 foot, provided that hazardous velocities are not produced. The floodways in this study are presented to local agencies as minimum standards that can be adopted directly or that can be used as a basis for additional floodway studies. The floodways presented in this FIS report and on the FIRM were computed for certain stream segments on the basis of equal-conveyance reduction from each side of the floodplain. Floodway widths were computed at cross sections. Between cross sections, the floodway boundaries were interpolated. The results of the floodway computations have been tabulated for selected cross sections (Table 5). In cases where the floodway and 1-percent-annual-chance floodplain boundaries are either close together or collinear, only the floodway boundary has been shown. 22
27 Table 5 - Floodway Data FLOODING SOURCE CROSS SECTION DISTANCE 1 WIDTH (FEET) FLOODWAY SECTION AREA (SQUARE FEET) MEAN VELOCITY (FEET PER SECOND) REGULATORY (FEET NAVD) 1-PERCENT-ANNUAL-CHANCE FLOOD WATER SURFACE ELEVATION WITHOUT FLOODWAY (FEET NAVD) WITH FLOODWAY (FEET NAVD) INCREASE (FEET) Bear Creek A B C D E F G H I J K L M N O P Q R Feet Above Salmon Creek 2 Elevations Computed Without Consideration of Flooding Effects From Salmon Creek TABLE 5 FEDERAL EMERGENCY MANAGEMENT AGENCY KENAI PENINSULA BOROUGH, AK AND INCORPORATED AREAS FLOODWAY DATA BEAR CREEK 23
28 FLOODING SOURCE CROSS SECTION DISTANCE 1 WIDTH (FEET) FLOODWAY SECTION AREA (SQUARE FEET) MEAN VELOCITY (FEET PER SECOND) REGULATORY (FEET NGVD) 1-PERCENT-ANNUAL-CHANCE FLOOD WATER SURFACE ELEVATION WITHOUT FLOODWAY (FEET NGVD) WITH FLOODWAY (FEET NGVD) INCREASE (FEET) Kasilof River A , B 2, , C 6, , D 9, , E 13, , F 16, , G 19, , H 21, , I 23, , J 26, , K 28, , L 30, , M 34, , N 37, , O 39, , P 40, , Q 41, , R 43, , S 46, , T 49, , U 52, , V 56, , Feet Above Cross Section A 2 Width Affected by Tidal Influences 3 Elevations Computed Without Consideration of Backwater Effects From Cook Inlet TABLE 5 FEDERAL EMERGENCY MANAGEMENT AGENCY KENAI PENINSULA BOROUGH, AK AND INCORPORATED AREAS FLOODWAY DATA KASILOF RIVER 24
29 FLOODING SOURCE CROSS SECTION DISTANCE 1 WIDTH (FEET) FLOODWAY SECTION AREA (SQUARE FEET) MEAN VELOCITY (FEET PER SECOND) REGULATORY (FEET NGVD) 1-PERCENT-ANNUAL-CHANCE FLOOD WATER SURFACE ELEVATION WITHOUT FLOODWAY (FEET NGVD) WITH FLOODWAY (FEET NGVD) INCREASE (FEET) Kasilof River (continued) W 58, , X 60, , Y 62, , Z 64, , AA 66, , AB 68, , AC 71, , AD 75, , Feet Above Cross Section A 2 Width Affected by Tidal Influences 3 Elevations Computed Without Consideration of Backwater Effects From Cook Inlet TABLE 5 FEDERAL EMERGENCY MANAGEMENT AGENCY KENAI PENINSULA BOROUGH, AK AND INCORPORATED AREAS FLOODWAY DATA KASILOF RIVER 25
30 FLOODING SOURCE CROSS SECTION DISTANCE 1 WIDTH (FEET) FLOODWAY SECTION AREA (SQUARE FEET) MEAN VELOCITY (FEET PER SECOND) REGULATORY (FEET NGVD) 1-PERCENT-ANNUAL-CHANCE FLOOD WATER SURFACE ELEVATION WITHOUT FLOODWAY (FEET NGVD) WITH FLOODWAY (FEET NGVD) INCREASE (FEET) Kenai River A 0 1, , B 3,380 1, , C 6,440 1, , D 9,840 1, , E 13,030 1, , F 16,270 1, , G 19,460 1, , H 22,700 1, , I 25, , J 25, , K 29, , L 31, , M 33, , N 36, , O 38, , P 41, , Q 44, , R 46, , S 49,975 1, , T 52, , U 54, , V 55, , Feet Above Cross Section A 2 Width Affected by Tidal Influences 3 Elevations Computed Without Consideration of Backwater Effects From Cook Inlet TABLE 5 FEDERAL EMERGENCY MANAGEMENT AGENCY KENAI PENINSULA BOROUGH, AK AND INCORPORATED AREAS FLOODWAY DATA KENAI RIVER 26
31 FLOODING SOURCE CROSS SECTION DISTANCE 1 WIDTH (FEET) FLOODWAY SECTION AREA (SQUARE FEET) MEAN VELOCITY (FEET PER SECOND) REGULATORY (FEET NGVD) 1-PERCENT-ANNUAL-CHANCE FLOOD WATER SURFACE ELEVATION WITHOUT FLOODWAY (FEET NGVD) WITH FLOODWAY (FEET NGVD) INCREASE (FEET) Kenai River (continued) W 58,000 1,049 12, X 59,705 2,250 14, Y 62,640 1,210 6, Z 65, , AA 65, , AB 68, , AC 71, , AD 74, , AE 76,880 1,374 8, AF 78, , AG 81,310 1,612 12, AH 83,025 1,904 14, AI 84,915 2,004 14, AJ 87,540 1,651 9, AK 90,160 1,301 7, AL 93, , AM 95, , AN 96, , AO 99, , AP 101, , AQ 103, , AR 106, , Feet Above Cross Section A 2 Width Affected by Tidal Influences 3 Elevations Computed Without Consideration of Backwater Effects From Cook Inlet TABLE 5 FEDERAL EMERGENCY MANAGEMENT AGENCY KENAI PENINSULA BOROUGH, AK AND INCORPORATED AREAS FLOODWAY DATA KENAI RIVER 27
32 FLOODING SOURCE CROSS SECTION DISTANCE 1 WIDTH (FEET) FLOODWAY SECTION AREA (SQUARE FEET) MEAN VELOCITY (FEET PER SECOND) REGULATORY (FEET NGVD) 1-PERCENT-ANNUAL-CHANCE FLOOD WATER SURFACE ELEVATION WITHOUT FLOODWAY (FEET NGVD) WITH FLOODWAY (FEET NGVD) INCREASE (FEET) Kenai River (continued) AS 109, , AT 112, , AU 112, , AV 113, , AW 115, , AX 117, , AY 119, , AZ 122, , BA 125, , BB 127, , BC 130, , BD 132, , BE 139, , BF 148, , BG 150, , BH 151, , BI 154, , BJ 154, , BK 156, , BL 162, , BM 163, , BN 165, , Feet Above Cross Section A 2 Width Affected by Tidal Influences 3 Elevations Computed Without Consideration of Backwater Effects From Cook Inlet TABLE 5 FEDERAL EMERGENCY MANAGEMENT AGENCY KENAI PENINSULA BOROUGH, AK AND INCORPORATED AREAS FLOODWAY DATA KENAI RIVER 28
33 FLOODING SOURCE CROSS SECTION DISTANCE 1 WIDTH (FEET) FLOODWAY SECTION AREA (SQUARE FEET) MEAN VELOCITY (FEET PER SECOND) REGULATORY (FEET NGVD) 1-PERCENT-ANNUAL-CHANCE FLOOD WATER SURFACE ELEVATION WITHOUT FLOODWAY (FEET NGVD) WITH FLOODWAY (FEET NGVD) INCREASE (FEET) Kenai River (continued) BO 167, , BP 171, , BQ 172, , BR 174, , BS 176, , BT 180, , BU 181, , BV 184, , BW 189, , BX 193, , BY 194, , BZ 196, , CA 198, , CB 201, , CC 203, , CD 206, , CE 211, , CF 211, , CG 213, , CH 215, , CI 218, , CJ 220, , Feet Above Cross Section A 2 Width Affected by Tidal Influences 3 Elevations Computed Without Consideration of Backwater Effects From Cook Inlet TABLE 5 FEDERAL EMERGENCY MANAGEMENT AGENCY KENAI PENINSULA BOROUGH, AK AND INCORPORATED AREAS FLOODWAY DATA KENAI RIVER 29
34 FLOODING SOURCE CROSS SECTION DISTANCE 1 WIDTH (FEET) FLOODWAY SECTION AREA (SQUARE FEET) MEAN VELOCITY (FEET PER SECOND) REGULATORY (FEET NGVD) 1-PERCENT-ANNUAL-CHANCE FLOOD WATER SURFACE ELEVATION WITHOUT FLOODWAY (FEET NGVD) WITH FLOODWAY (FEET NGVD) INCREASE (FEET) Kenai River (continued) CK 224,220 1,212 9, CL 226,200 1,370 11, CM 229, , CN 235, , CO 235, , CP 239, , CQ 245, , CR 246, , CS 247, , Feet Above Cross Section A 2 Width Affected by Tidal Influences 3 Elevations Computed Without Consideration of Backwater Effects From Cook Inlet TABLE 5 FEDERAL EMERGENCY MANAGEMENT AGENCY KENAI PENINSULA BOROUGH, AK AND INCORPORATED AREAS FLOODWAY DATA KENAI RIVER 30
35 FLOODING SOURCE CROSS SECTION DISTANCE 1 WIDTH (FEET) FLOODWAY SECTION AREA (SQUARE FEET) MEAN VELOCITY (FEET PER SECOND) REGULATORY (FEET NAVD) 1-PERCENT-ANNUAL-CHANCE FLOOD WATER SURFACE ELEVATION WITHOUT FLOODWAY (FEET NAVD) WITH FLOODWAY (FEET NAVD) INCREASE (FEET) Kwechak Creek A B C D E F G H I J K L M N O P Q R S T Feet Above Salmon Creek 2 Shared Floodway with Salmon Creek TABLE 5 FEDERAL EMERGENCY MANAGEMENT AGENCY KENAI PENINSULA BOROUGH, AK AND INCORPORATED AREAS FLOODWAY DATA KWECHAK CREEK 31
36 FLOODING SOURCE CROSS SECTION DISTANCE 1 WIDTH (FEET) FLOODWAY SECTION AREA (SQUARE FEET) MEAN VELOCITY (FEET PER SECOND) REGULATORY (FEET NAVD) 1-PERCENT-ANNUAL-CHANCE FLOOD WATER SURFACE ELEVATION WITHOUT FLOODWAY (FEET NAVD) WITH FLOODWAY (FEET NAVD) INCREASE (FEET) Resurrection River A B C D E F G H I J K L M N O P Q R S T U V Feet Above Resurrection Bay 2 Elevations Computed Without Consideration of Coastal Flooding Effects From Resurrection Bay TABLE 5 FEDERAL EMERGENCY MANAGEMENT AGENCY KENAI PENINSULA BOROUGH, AK AND INCORPORATED AREAS FLOODWAY DATA RESURRECTION RIVER 32
37 FLOODING SOURCE CROSS SECTION DISTANCE 1 WIDTH (FEET) FLOODWAY SECTION AREA (SQUARE FEET) MEAN VELOCITY (FEET PER SECOND) REGULATORY (FEET NAVD) 1-PERCENT-ANNUAL-CHANCE FLOOD WATER SURFACE ELEVATION WITHOUT FLOODWAY (FEET NAVD) WITH FLOODWAY (FEET NAVD) INCREASE (FEET) Resurrection River (Continued) W X Y Z AA AB AC AD AE Feet Above Resurrection Bay TABLE 5 FEDERAL EMERGENCY MANAGEMENT AGENCY KENAI PENINSULA BOROUGH, AK AND INCORPORATED AREAS FLOODWAY DATA RESURRECTION RIVER 33
38 FLOODING SOURCE CROSS SECTION DISTANCE 1 WIDTH (FEET) FLOODWAY SECTION AREA (SQUARE FEET) MEAN VELOCITY (FEET PER SECOND) REGULATORY (FEET NAVD) 1-PERCENT-ANNUAL-CHANCE FLOOD WATER SURFACE ELEVATION WITHOUT FLOODWAY (FEET NAVD) WITH FLOODWAY (FEET NAVD) INCREASE (FEET) Salmon Creek A B C D E F G H I J K L M N O P Q R S T U V Feet Above Resurrection Bay 2 Elevations Computed Without Consideration of Backwater Effects From Resurrection Bay TABLE 5 FEDERAL EMERGENCY MANAGEMENT AGENCY KENAI PENINSULA BOROUGH, AK AND INCORPORATED AREAS FLOODWAY DATA SALMON CREEK 34
39 FLOODING SOURCE CROSS SECTION DISTANCE 1 WIDTH (FEET) FLOODWAY SECTION AREA (SQUARE FEET) MEAN VELOCITY (FEET PER SECOND) REGULATORY (FEET NAVD) 1-PERCENT-ANNUAL-CHANCE FLOOD WATER SURFACE ELEVATION WITHOUT FLOODWAY (FEET NAVD) WITH FLOODWAY (FEET NAVD) INCREASE (FEET) Salmon Cr. (Continued) W X Y Z AA AB AC AD AE AF AG AH AI AJ AK AL AM AN AO AP AQ AR Feet Above Resurrection Bay 2 Floodway Width Includes Dry Land TABLE 5 FEDERAL EMERGENCY MANAGEMENT AGENCY KENAI PENINSULA BOROUGH, AK AND INCORPORATED AREAS FLOODWAY DATA SALMON CREEK 35
40 FLOODING SOURCE CROSS SECTION DISTANCE 1 WIDTH (FEET) FLOODWAY SECTION AREA (SQUARE FEET) MEAN VELOCITY (FEET PER SECOND) REGULATORY (FEET NAVD) 1-PERCENT-ANNUAL-CHANCE FLOOD WATER SURFACE ELEVATION WITHOUT FLOODWAY (FEET NAVD) WITH FLOODWAY (FEET NAVD) INCREASE (FEET) Salmon Cr. (Continued) AS AT AU AV AW AX AY AZ BA BB BC BD BE BF BG BH BI BJ BK BL BM BN Feet Above Resurrection Bay 2 Shared Floodway with Kwechak Creek TABLE 5 FEDERAL EMERGENCY MANAGEMENT AGENCY KENAI PENINSULA BOROUGH, AK AND INCORPORATED AREAS FLOODWAY DATA SALMON CREEK 36
41 FLOODING SOURCE CROSS SECTION DISTANCE 1 WIDTH (FEET) FLOODWAY SECTION AREA (SQUARE FEET) MEAN VELOCITY (FEET PER SECOND) REGULATORY (FEET NAVD) 1-PERCENT-ANNUAL-CHANCE FLOOD WATER SURFACE ELEVATION WITHOUT FLOODWAY (FEET NAVD) WITH FLOODWAY (FEET NAVD) INCREASE (FEET) Salmon Cr. (Continued) BO BP BQ BR BS BT Feet Above Resurrection Bay TABLE 5 FEDERAL EMERGENCY MANAGEMENT AGENCY KENAI PENINSULA BOROUGH, AK AND INCORPORATED AREAS FLOODWAY DATA SALMON CREEK 37
42 FLOODING SOURCE CROSS SECTION DISTANCE 1 WIDTH (FEET) FLOODWAY SECTION AREA (SQUARE FEET) MEAN VELOCITY (FEET PER SECOND) REGULATORY (FEET NAVD) 1-PERCENT-ANNUAL-CHANCE FLOOD WATER SURFACE ELEVATION WITHOUT FLOODWAY (FEET NAVD) WITH FLOODWAY (FEET NAVD) INCREASE (FEET) Salmon Creek Overflow A B C D E F G H I J K L M N O P Q R S T U V Feet Above Salmon Creek TABLE 5 FEDERAL EMERGENCY MANAGEMENT AGENCY KENAI PENINSULA BOROUGH, AK AND INCORPORATED AREAS FLOODWAY DATA SALMON CREEK OVERFLOW 38
43 FLOODING SOURCE CROSS SECTION DISTANCE 1 WIDTH (FEET) FLOODWAY SECTION AREA (SQUARE FEET) MEAN VELOCITY (FEET PER SECOND) REGULATORY (FEET NAVD) 1-PERCENT-ANNUAL-CHANCE FLOOD WATER SURFACE ELEVATION WITHOUT FLOODWAY (FEET NAVD) WITH FLOODWAY (FEET NAVD) INCREASE (FEET) Salmon Creek Overflow (Continued) W X Y Z Feet Above Salmon Creek TABLE 5 FEDERAL EMERGENCY MANAGEMENT AGENCY KENAI PENINSULA BOROUGH, AK AND INCORPORATED AREAS FLOODWAY DATA SALMON CREEK OVERFLOW 39
44 FLOODING SOURCE CROSS SECTION DISTANCE 1 WIDTH (FEET) FLOODWAY SECTION AREA (SQUARE FEET) MEAN VELOCITY (FEET PER SECOND) REGULATORY (FEET NAVD) 1-PERCENT-ANNUAL-CHANCE FLOOD WATER SURFACE ELEVATION WITHOUT FLOODWAY (FEET NAVD) WITH FLOODWAY (FEET NAVD) INCREASE (FEET) Salmon Creek / Resurrection River Split A B C D E F G Feet Above Resurrection River 2 Shared Floodway with Resurrection River 3 Elevations computed without backwater effects from Resurrection River TABLE 5 FEDERAL EMERGENCY MANAGEMENT AGENCY KENAI PENINSULA BOROUGH, AK AND INCORPORATED AREAS FLOODWAY DATA SALMON CREEK / RESURRECTION RIVER SPLIT 40
45 FLOODING SOURCE CROSS SECTION DISTANCE 1 WIDTH (FEET) FLOODWAY SECTION AREA (SQUARE FEET) MEAN VELOCITY (FEET PER SECOND) REGULATORY (FEET NAVD) 1-PERCENT-ANNUAL-CHANCE FLOOD WATER SURFACE ELEVATION WITHOUT FLOODWAY (FEET NAVD) WITH FLOODWAY (FEET NAVD) INCREASE (FEET) Salmon Creek Split A B C D E F G H I J K L M N O P Feet Above Confluence with Salmon Creek TABLE 5 FEDERAL EMERGENCY MANAGEMENT AGENCY KENAI PENINSULA BOROUGH, AK AND INCORPORATED AREAS FLOODWAY DATA SALMON CREEK SPLIT 41
46 The area between the floodway and 1-percent-annual-chance floodplain boundaries is termed the floodway fringe. The floodway fringe encompasses the portion of the floodplain that could be completely obstructed without increasing the water surface elevation of the 1-percent-annual-chance flood more than 1 foot at any point. Typical relationships between the floodway and the floodway fringe and their significance to floodplain development are shown in Figure Base Flood Elevations Figure 2 - Floodway Schematic Areas within the community studied by detailed engineering methods have Base Flood Elevations (BFEs) established in AE and VE Zones. These are the elevations of the 1-percent-annual-chance (base flood) relative to NAVD. In coastal areas affected by wave action, BFEs are generally maximum at the normal open shoreline. These elevations generally decrease in a landward direction at a rate dependent on the presence of obstructions capable of dissipating the wave energy. Where possible, changes in BFEs have been shown in 1-foot increments on the FIRM. However, where the scale did not permit, 2- or 3-foot increments were sometimes used. BFEs shown in the wave action areas represent the average elevation within the zone. Current program regulations generally require that all new construction be elevated such that the first floor, including basement, is elevated to or above the BFE in AE and VE Zones. 4.4 Velocity Zones The USACE has established the 3-foot wave height as the criterion for identifying coastal high hazard zones (Reference 31). This was based on a study 42
47 of wave action effects on structures. This criterion has been adopted by FEMA for the determination of VE zones. Because of the additional hazards associated with high-energy waves, the NFIP regulations require much more stringent floodplain management measures in these areas, such as elevating structures on piles or piers. In addition, insurance rates in VE zones are higher than those in AE zones. The location of the VE zone is determined by the 3-foot wave as discussed previously. The detailed analysis of wave heights performed in this study allowed a much more accurate location of the VE zone to be established. The VE zone generally extends inland to the point where the 1-percent-annual-chance stillwater flood depth is insufficient to support a 3-foot wave. 5.0 INSURANCE APPLICATIONS For flood insurance rating purposes, flood insurance zone designations are assigned to a community based on the results of the engineering analyses. These zones are as follows: Zone A Zone A is the flood insurance risk zone that corresponds to the 1-percent-annual-chance floodplains that are determined in the FIS by approximate methods. Because detailed hydraulic analyses are not performed for such areas, no BFEs or base flood depths are shown within this zone. Zone AE Zone AE is the flood insurance risk zone that corresponds to the 1-percent-annualchance floodplains that are determined in the FIS by detailed methods. In most instances, whole-foot BFEs derived from the detailed hydraulic analyses are shown at selected intervals within this zone. Zone AH Zone AH is the flood insurance risk zone that corresponds to the areas of 1-percentannual-chance shallow flooding (usually areas of ponding) where average depths are between 1 and 3 feet. Whole-foot BFEs derived from the detailed hydraulic analyses are shown at selected intervals within this zone. Zone AO Zone AO is the flood insurance risk zone that corresponds to the areas of 1-percentannual-chance shallow flooding (usually sheet flow on sloping terrain) where average depths are between 1 and 3 feet. Average whole-foot base flood depths derived from the detailed hydraulic analyses are shown within this zone. 43
48 Zone V Zone V is the flood insurance risk zone that corresponds to the 1-percent-annual-chance coastal floodplains that have additional hazards associated with storm waves. Because approximate hydraulic analyses are performed for such areas, no BFEs are shown within this zone. Zone VE Zone VE is the flood insurance risk zone that corresponds to the 1-percent-annualchance coastal floodplains that have additional hazards associated with storm waves. Whole-foot BFEs derived from the detailed hydraulic analyses are shown at selected intervals within this zone. Zone X Zone X is the flood insurance risk zone that corresponds to areas outside the 0.2- percent-annual-chance floodplain, areas within the 0.2-percent-annual-chance floodplain, areas of 1-percent-annual-chance flooding where average depths are less than 1 foot, areas of 1-percent-annual-chance flooding where the contributing drainage area is less than 1 square mile, and areas protected from the 1-percent-annual-chance flood by levees. No BFEs or base flood depths are shown within this zone. Zone D Zone D is the flood insurance risk zone that corresponds to unstudied areas where flood hazards are undetermined, but possible. 6.0 FLOOD INSURANCE RATE MAP The FIRM is designed for flood insurance and floodplain management applications. For flood insurance applications, the map designates flood insurance risk zones as described in Section 5.0 and, in the 1-percent-annual-chance floodplains that were studied by detailed methods, shows selected whole-foot BFEs or average depths. Insurance agents use the zones and BFEs in conjunction with information on structures and their contents to assign premium rates for flood insurance policies. For floodplain management applications, the map shows by tints, screens, and symbols, the 1- and 0.2-percent-annual-chance floodplains, floodways, and the locations of selected cross sections used in the hydraulic analyses and floodway computations. Historical data relating to the maps prepared for each community are presented in Table 6. 44
49 Table 6 - Community Map History COMMUNITY NAME INITIAL IDENTIFICATION FLOOD HAZARD BOUNDARY MAP REVISION DATE FIRM EFFECTIVE DATE FIRM REVISION DATE Kachemak, City of May 19, 1981 None May 19, 1981 None Kenai, City of May 19, 1981 None May 19, 1981 July 5, 1983 December 6, 1999 Kenai Peninsula, Borough of May 19, 1981 None May 19, 1981 July 5, 1983 December 6, 1999 Seldovia, City of May 19, 1981 None May 19, 1981 None Seward, City of May 19, 1981 None May 19, 1981 None Soldotna, City of May 19, 1981 None May 19, 1981 July 5, 1983 December 6, 1999 TABLE 6 FEDERAL EMERGENCY MANAGEMENT AGENCY KENAI PENINSULA BOROUGH, AK AND INCORPORATED AREAS COMMUNITY MAP HISTORY 45
50 7.0 OTHER STUDIES Flood Insurance Studies have been performed for Seward, Soldotna, and Seldovia (References 32, 33, and 34, respectively). For Seldovia, in the 1999 FIS, the study area was increased to include the area where Trene Lake flows out to Kachemak Bay. Except for this area, the Coastal High Hazard runups to elevations of 37.3 feet (28 feet MLLW) and 34.3 feet (23 feet MLLW), in areas sheltered from runup but subject to tidal influence, were used from the previous study. The actual flood boundary differs from the March 1974 study at Seldovia due to the new mapping. The 1974 study mapping had no contour lines; thus, flood lines were not exact. Another change is the designation of the flood zone in Seldovia Bay. It was called Zone A in 1974 but is Zone V under the later coastal criteria guidelinesthe original flood boundary at Seward (Reference 32) added the surge and runup to the highest observed tide. For the 1999 FIS, surge and runup were added to a calculated 1-percent-annual-chance tide which is less than reported previously. There are several Floodplain Information reports for Kenai River (References 23, 24, and 25). This study generally agrees with those reports. This study is also in general agreement with previously published Flood Hazard Boundary Maps for the Cities of Soldotna and Kenai (References 35 and 36, respectively). This report either supersedes or is compatible with all previous studies on streams studied in this report and should be considered authoritative for purposes of the NFIP. 8.0 LOCATION OF DATA Information concerning the pertinent data used in the preparation of this study can be obtained by contacting FEMA, Federal Insurance and Mitigation Division, Federal Regional Center, th Street Southwest, Bothell, WA
51 9.0 BIBLIOGRAPHY AND REFERENCES 1. U.S. Department of the Interior, Geological Survey, Atlas HA-455, Glacier- Dammed Lakes and Outburst Floods in Alaska, U.S. Department of the Army, Corps of Engineers, Waterways Experiment Station, Technical Report H-74-3, Vicksburg, Mississippi, May State of Alaska, Division of Planning and Research, Alaska Regional Profiles, South Central Region, Pouch AD, Juneau, Alaska, U.S. Department of the Army, Corps of Engineers, Coastal Engineering Research Center, Technical Memorandum No. 25, The Tsunami of the Alaskan Earthquake, 1964, Engineering Evaluation, May U.S. Department of the Army, Corps of Engineers, Alaska District, Water Resources Development in Alaska, U.S. Department of the Army, Corps of Engineers, North Pacific Engineer Division, SSARR-Streamflow Synthesis and Reservoir Regulation, Portland, Oregon, September U.S. Water Resources Council, Guidelines for Determining Flood Flow Frequencies, Bulletin 17, March U.S. Geologic Society, Estimating the Magnitude and Frequency of Peak Streamflows for Ungaged Sites on Streams in Alaska and Conterminous Basins in Canada, Water-Resources Investigations Report , Northwest Hydraulic Consultants, Inc., Technical Memorandum, Hydrology for Floodplain Insurance Restudy of City of Seward, Kenai Peninsula Borough, Alaska, November 30 th, U.S. Department of the Army, Corps of Engineers, Hydrologic Engineering Center, HEC-2 Water-Surface Profiles, A User s Manual, Davis, California, November U.S. Department of the Army, Corps of Engineers, Hydrologic Engineering Center, HEC-RAS, User s Manual, Version 4.0, Davis, California, March U.S. Department of the Interior, Bureau of Land Management, Topographic Map, Scale 1:2400, Contour Intervals 5 and 10 feet: Port Graham, Alaska (1967) 13. U.S. Department of the Interior, Bureau of Land Management, Topographic Map, Scale 1:2400, Contour Intervals 2 and 10 feet: English Bay, Alaska (1967) 47
52 14. City of Seward, Topographic Map, Scale 1:2400, Contour Interval 2 feet: City of Seward, Alaska (1975) 15. Kenai Peninsula Borough, Topographic Map, Scale 1:4800, Contour Intervals 2 and 10 feet, Mean Lower Low Water Level (MLLW) datum: City of Seldovia, Alaska 16. Kenai Peninsula Borough, Topographic Map, Scale 1:4800, Contour Interval 5 feet: Kasilof River, Alaska 17. Kenai Peninsula Borough, Topographic Map, Scale 1:12,000, Contour Interval 10 feet: North Kenai Peninsula 18. U.S. Department of the Army, Corps of Engineers, Alaska District, Topographic Map, Scale 1:4800, Contour Interval 5 feet: Kenai River, Alaska (1965) 19. U.S. Department of the Army, Corps of Engineers, Topographic Map, Scale 1:12,000: Homer Spit, Alaska 20. U.S. Department of the Interior, Geological Survey, 15-Minute Series Topographic Maps, Scale 1:63,360, Contour Interval 100 feet: Seward, Alaska B7, B8, C7, D7, and D8 (1951); Seward, Alaska A7 (1950); Seldovia, Alaska D5 (1961) 21. U.S. Department of the Interior, Geological Survey, 15-Minute Series Topographic Maps, Scale 1:63,360, Contour Interval 50 feet: Kenai, Alaska A5, B4, C3, C4, D3, and D4 (1951) 22. U.S. Department of Agriculture, Soil Conservation Service, Topographic Map, Scale 1:2400, Contour Interval 5 feet: Homer, Alaska 23. U.S. Department of the Army, Corps of Engineers, Flood Plain Information Report, Kenai River, U.S. Department of the Army, Corps of Engineers, Flood Plain Information Report, Kenai River-Phase One, U.S. Department of the Army, Corps of Engineers, Flood Plain Information Report, Kenai River-Phase Two, U.S. Department of the Army, Corps of Engineers, Coastal Engineering Research Center, Shore Protection Manual, U.S. Department of the Interior, Coast and Geodetic Survey, Navigation Charts, Kenai Peninsula, Alaska 28. U.S. Department of Commerce, National Oceanic and Atmospheric Administration, National Climatic Service, Annual Reports, Environmental Data and Information Service, Asheville, North Carolina 48
53 29. U.S. Department of Commerce, National Oceanic and Atmospheric Administration, National Ocean Survey Tidal Datum, Cline and Associates, Seward FIS Surveys Control Statement, February 18 th, U.S. Army Corps of Engineers, Guidelines for Identifying Coastal High Hazard Zones, Galveston District, Galveston, Texas, June Federal Emergency Management Agency, Federal Insurance Administration, Flood Insurance Study, City of Seward, Kenai Peninsula Borough, Alaska, unpublished 33. Federal Emergency Management Agency, Federal Insurance Administration, Flood Insurance Study, City of Soldotna-Kenai River, Kenai Peninsula Borough, Alaska, unpublished 34. Federal Emergency Management Agency, Federal Insurance Administration, Flood Insurance Study, City of Seldovia, Kenai Peninsula Borough, Alaska, unpublished 35. U.S. Department of Housing and Urban Development, Federal Insurance Administration, Flood Hazard Boundary Map, City of Soldotna, Kenai Peninsula Borough, Alaska, U.S. Department of Housing and Urban Development, Federal Insurance Administration, Flood Hazard Boundary Map, City of Kenai, Kenai Peninsula Borough, Alaska, U.S. Department of the Army, Corps of Engineers, Hydrologic Engineering Center, HEC-RAS River Analysis System Computer Program, Davis, California, April U.S. Department of the Army, Corps of Engineers, Topographic Map, Scale 1:12,000, Contour Interval 2 feet, Kenai Peninsula Borough, Alaska, January
54 10.0 REVISIONS DESCRIPTION This section has been added to provide information regarding significant revisions made since the original FIS and FIRM were printed. Future revisions may be made that do not result in the republishing of the FIS report. All users are advised to contact the Community Map Repository at the address below to obtain the most up-to-date flood hazard data. Kenai River Center 514 Funny River Road Soldotna, AK First Revision (Revised December 6, 1999) This study was revised on December 6, 1999, to reflect corrections made to the topographic mapping on which the original hydraulic model was based. This is a restudy of approximately 5 miles of the Kenai River from approximately 4,500 feet downstream of the confluence with Shikok Creek to approximately 6.1 miles downstream of the confluence with Shikok Creek. This area is commonly referred to as Big Eddy. The Kenai River is within the boundaries of the Kenai Peninsula Borough. The hydrologic and hydraulic analyses for the restudy were performed by the U.S. Army Corps of Engineers (USACE), Alaska District, for the Federal Emergency Management Agency, under Interagency Agreement No. EMW-96- IA-0195, Project Order No. 9. This work was completed in December In November 1995, the lower portion of the Kenai River experienced a flood event that approximated the 1-percent-annual-chance flood discharge figure used in the original study. While the water levels in the Big Eddy area were well below the 1-percent-annual-chance floodplain elevations identified in the original study, significant flooding occurred, inundating land identified as being above the 1-percent-annual-chance flood event. Subsequent investigations indicated an error in a portion of the topographic mapping on which the hydraulic model was based, necessitating the restudy. The results of this restudy were reviewed at a final Consultation Coordination Officer meeting held on December 2, 1998, and attended by representatives of Kenai Peninsula Borough, USACE, Alaska Department of Community and Regional Affairs, and FEMA. All problems raised at that meeting have been addressed in this restudy. A hydrologic analysis was done to establish peak discharge-frequency relationships for the Kenai River. Peak discharges were determined using U.S. Geological Survey stream-gaging records for the Kenai River at Cooper Landing (1947 to 1996) and the Kenai River at Soldotna (1965 to 1996). Peak discharges 50
55 for the glacier dam releases or Jokulhlaups were obtained from the National Weather Service river forecast office. Water-surface elevations for the Kenai River were computed using the USACE HEC-RAS computer program (Reference 37). The hydraulic analysis was performed using the USACE HEC-RAS computer program (Reference 37). The restudy model was calibrated against the November 1995 flood, the elevation of which had been surveyed in detail shortly after the flood. The restudy identified a new 1-percent-annual-chance discharge of 42,300 cubic feet per second, which is based on additional years of gaging records. This flow is higher than the 1-percent-annual-chance discharge determined by the original study. However, the new 1-percent-annual-chance discharge and resultant flood profile are applicable only to the restudy area. Cross sections for the Kenai River were determined using topographic maps at a scale of 1:12,000, with a contour interval of 2 feet (Reference 38), supplemented by field surveys and actual flood watermarks placed by many residents during the flood. All waterway-opening and invert elevations through bridges and culverts were obtained through field surveys. Manning s n roughness values were established based on field observations and engineering judgment. Channel roughness values along the Kenai River were Overbank roughness values ranged from to Starting water-surface elevations for the Kenai River were computed using the slope-area method. Table 1, Floods of Record on the Kenai Peninsula, Table 2, Summary of Discharges, Table 5, Floodway Data, and Exhibit 1, Flood Profiles, were revised to reflect changes as a result of the restudy Second Revision (Revised TBD) Bear Creek, Grouse Creek, Kwechak Creek, Resurrection River, Salmon Creek, and Sawmill Creek were modeled and mapped for FEMA Flood Insurance Studies within the City of Seward, Alaska and adjacent Borough lands. Northwest Hydraulic Consultants, Inc. (NHC) completed this work in December The work was conducted under IDIQ Contract EMS-2001-CO-0067 Task #28. Peak discharge quantiles were updated for these six detailed study reaches. Discharge quantiles were initially estimated using regional regression equations developed by the USGS (Reference 8). These data were evaluated against observations of extreme peak discharges resulting from surge-release floods (i.e. debris dam failures) or other anomalous events and appropriate adjustments were then made to the peak flows (Reference 9). 51
56 The U.S. Army Corps of Engineers HEC-RAS Version 4.0 was used for hydraulic modeling of the reaches. Cross sections for these models were cut from 2-foot contours provided by the Kenai Peninsula Borough, and augmented with in-stream survey and bridge soundings completed during the period of October to December Manning s n roughness values were selected based on professional judgment and comparing channel characteristics observed at the site to photographs of channels with computed n values. Each of the six study reaches are detailed in the following paragraphs. Bear Creek Bear Creek is a detailed study covering the 1 mile reach from Bear Lake to Salmon Creek. A Manning s n value of 0.04 was used within channel banks, in the overbanks, and in wooded overbanks upstream of the Bear Creek Road Culvert. The Bear Creek Fish weir and the fish hatchery were represented as physical features in the modeling. Both the 1- percent and 0.2-percent-annual-chance floodplain boundaries are completely contained within the incised channel corridor between Seward Highway and Bear Creek Road crossing. The floodway and floodplain are also coincident within this reach. For all other portions of Beer Creek, floodways were encroached to the channel banks without exceeding a 1-foot rise. Grouse Creek Grouse Creek is a limited detailed study extending approximately 0.6 miles from Grouse Lake to the confluence with Salmon Creek (where Grouse and Lost Creeks combine to become Salmon Creek). The downstream boundary conditions are based on assuming a coincident peak between Lost and Grouse Creeks because of similar drainage areas, 8.6 and 6 square miles, respectively (Table 2). The boundary condition elevations were taken from the upstream end of the Salmon Creek modeling. A check using a normal depth downstream boundary condition resulted in water surface elevations that are generally within a half a foot of those taken from the Salmon Creek modeling. Manning s roughness values of 0.05 and 0.1 were used for Grouse Creek in-channel and over bank areas, respectively. A floodway was not developed for Grouse Creek. 52
57 Kwechak Creek Kwechak Creek is a detailed study extending approximately 2.5 upstream from the confluence with Salmon Creek. Manning s roughness values of 0.05 and were used for Kwechak Creek in-channel and overbank areas, respectively. For the 0.2-percent annual chance event, a flow split was modeled starting upstream of the Bruno Street bridge and reconnecting with Kwechak Creek about 0.2 miles upstream of the confluence with Salmon Creek. Manning s roughness values of and were used in the split for the in-channel and overbank areas, respectively. The 1- percent-annual-chance and lower peak flows are not high enough to flow into this side channel. Cross-sections in the lower portion of the Kwechak Creek model are common with the Salmon Creek model. The lower part of the Kwechak Creek reach is perched, with earthen berms restricting flood water from reaching lower ground in the overbanks. Therefore, the final modeling results account for a without levee simulation that follow FEMA guidelines and assumes that these berms do not provide any flood protection for the 1-percent-annual-chance event. The without left levee failure of Kwechak Creek results in flows connecting with the left overbank of Salmon Creek (between river stations AU and BX). This flow is maintained in the overbank of Salmon Creek and intermittent high ground limits the flow from reaching the Salmon Creek main channel. Therefore, BFEs are different between the left overbank and main channel of Salmon Creek. This is reflected in the Salmon Creek Flood Profiles for the 1- percent-annual-chance flood. The floodway boundary encroaches to the banks of Kwechak Creek. Resurrection River Resurrection River is a detailed study extending approximately 3.0 miles upstream from Resurrection Bay. Manning s n values of to 0.1 in the overbanks, to 0.04 in-channel were based on historical models, comparison of aerial photographs and channel characteristics observed onsite to photographs of channels with computed n values, and professional judgment. A floodway analysis was completed to match effective floodway boundaries then adjusted as needed to produce up to a one-foot rise. Salmon Creek Salmon Creek is a detailed study covering the reach 6.5 miles upstream from Resurrection Bay. Manning s roughness values were selected based on field observations and comparison of channel photos. Manning s n - values of to 0.05 were used within main channel banks, with overbank n values ranging from to
58 Three flow splits were also modeled; Salmon Creek Overflow, Salmon Creek Split, and Salmon Creek / Resurrection River Split. The most upstream split, called Salmon Creek Overflow, occurs above Seward Highway. During high flows, water escapes the right bank and enters a swale running roughly parallel and to the west of the mainstem. Approximately 1 mile downstream, Salmon Creek Overflow passes through a pair of culverts in the Seward Highway. The side channel then continues roughly another 0.7 miles downstream before connecting back to the mainstem channel. Intermittent high ground between the Salmon Creek Overflow and Salmon Creek mainstem restricts flow passing between the two reaches. This results in different BFEs on the two reaches. Manning s n values of 0.04 to 0.08 were used within main channel banks, with overbank n values ranging from 0.08 to The second flow split, called Salmon Creek Split, occurs upstream of the railroad bridge (approximate 3.6 miles upstream of Resurrection Bay) where low ground allows flow to escape the left bank (to the south of the main channel). Salmon Creek Split runs roughly parallel to the railroad grade, and follows Salmon Creek Road, before reconnecting with the Salmon Creek mainstem approximately 1.4 miles upstream of Resurrection Bay where the Seward Highway and railroad grade crosses over Salmon Creek. Manning s n values of and 0.08 were used within the main channel banks and overbank areas, respectively. The third split, called Salmon Creek/Resurrection River Split, is located downstream of where water overtops the Seward Highway, on the right bank of Salmon Creek upstream of the Seward Highway and railroad grade bridge crossing over Salmon Creek. This split channel connects at the downstream end to the Resurrection River. The Seward Highway hinders, to some extent, the 1-percent-annual-chance event from flooding the downstream area. Because the roadway is not certified for flood protection the final modeling results account for a without levee simulation that follows FEMA guidelines and assumes that the roadway does not limit flow into the Salmon Creek/Resurrection River Split. Manning s n values used within the split reach range from to A floodway was developed for Salmon Creek and the various split channels by starting with the effective floodway boundary and then making revisions to reflect newer topography and simulate up to a one-foot rise in the 1- percent-annual-chance peak flow. 54
59 Sawmill Creek Sawmill Creek is a limited detailed study covering the reach 2 miles upstream from Resurrection Bay. Manning s n values of 0.05 were used within channel banks and in the overbanks. Both the 1-percent and 0.2-percent-annual-chance floodplain boundaries are completely contained within the incised channel corridor in the upper reaches of Sawmill Creek. The main branch of Sawmill Creek passes beneath the Nash Road Bridge and into Resurrection Bay through a channel confined on the right bank by an earthen berm. The final modeling results account for a without levee simulation that follow FEMA guidelines and assume that this berm does not provide any flood protection for the 1-percent-annual-chance event. Without the berm, flow inundates the right overbank area downstream of Nash Road. A floodway was not developed for Sawmill Creek. A little more than half-a-mile upstream of Resurrection Bay, a low left bank allows an appreciable amount of flow to escape into a swale running along the north side of Nash Road. This flow split was modeled as a separate reach, referred to as Sawmill Creek Split, and passes through a series of culverts before ultimately emptying into Resurrection Bay. Locations of selected cross sections used in the hydraulic analyses are shown on the Flood Profiles (Exhibit 1). For stream segments for which a floodway was computed, selected cross section locations are also shown on the FIRM (Exhibit 2). As part of this second revision, the format of the map panels has changed. Previously, flood-hazard information was shown on both the Flood Insurance Rate Map and Flood Boundary and Floodway Map. In the new format, all base flood elevations, cross sections, zone designations, and floodplain and floodway boundary delineations are shown on the Flood Insurance Rate Map and the Flood Boundary and Floodway Map has been eliminated. Some of the flood insurance zone designations were changed to reflect the new format. Areas previously shown as numbered Zone A were changed to Zone AE. Areas previously shown as Zone B were changed to Zone X (shaded). Areas previously shown as Zone C were changed to Zone X (unshaded). In addition, all Flood Insurance Zone Data Tables were removed from the FIS report and all zone designations and reach determinations were removed from the profile panels. 55
60 ELEVATION IN FEET (NAVD 88) FLOODING INFLUENCED BY SALMON CREEK LEGEND A B C D STREAM DISTANCE IN FEET ABOVE CONFLUENCE WITH SALMON CREEK E 0.2% ANNUAL CHANCE FLOOD 1% ANNUAL CHANCE FLOOD 2% ANNUAL CHANCE FLOOD 10% ANNUAL CHANCE FLOOD STREAM BED CROSS SECTION 01P FEDERAL EMERGENCY MANAGEMENT AGENCY KENAI PENINSULA BOROUGH, AK AND INCORPORATED AREAS CONFLUENCE WITH SALMON CREEK FLOOD PROFILES BEAR CREEK SEWARD HIGHWAY ALASKA RAILROAD
61
62
63
64
65
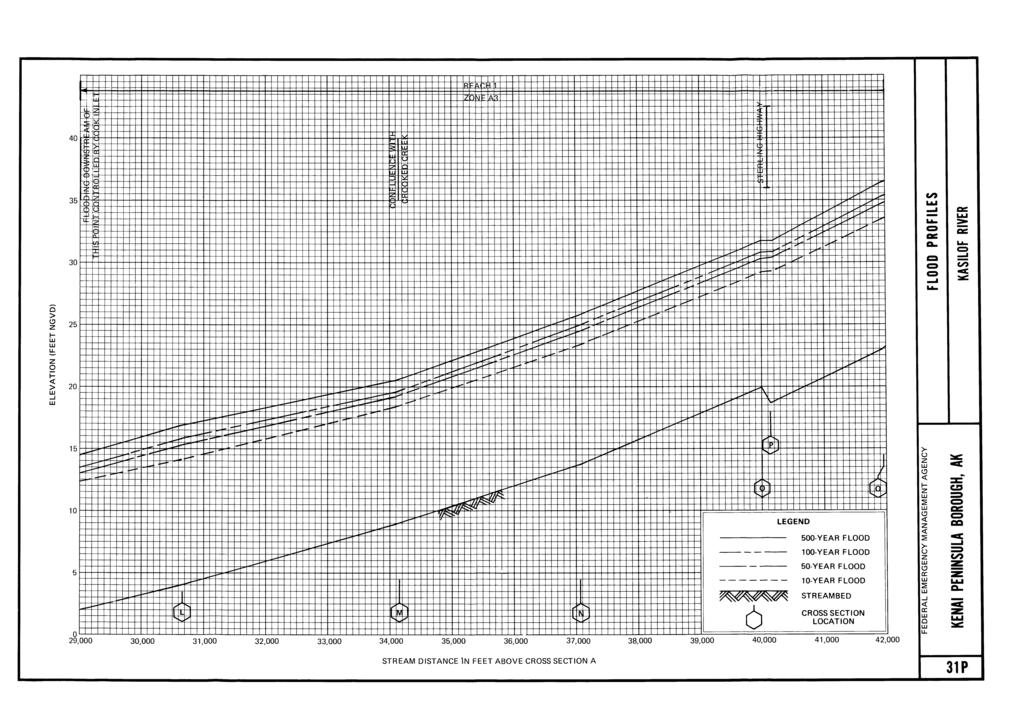
66

67

68

69

70

71

72

73

74

75

76

77

78
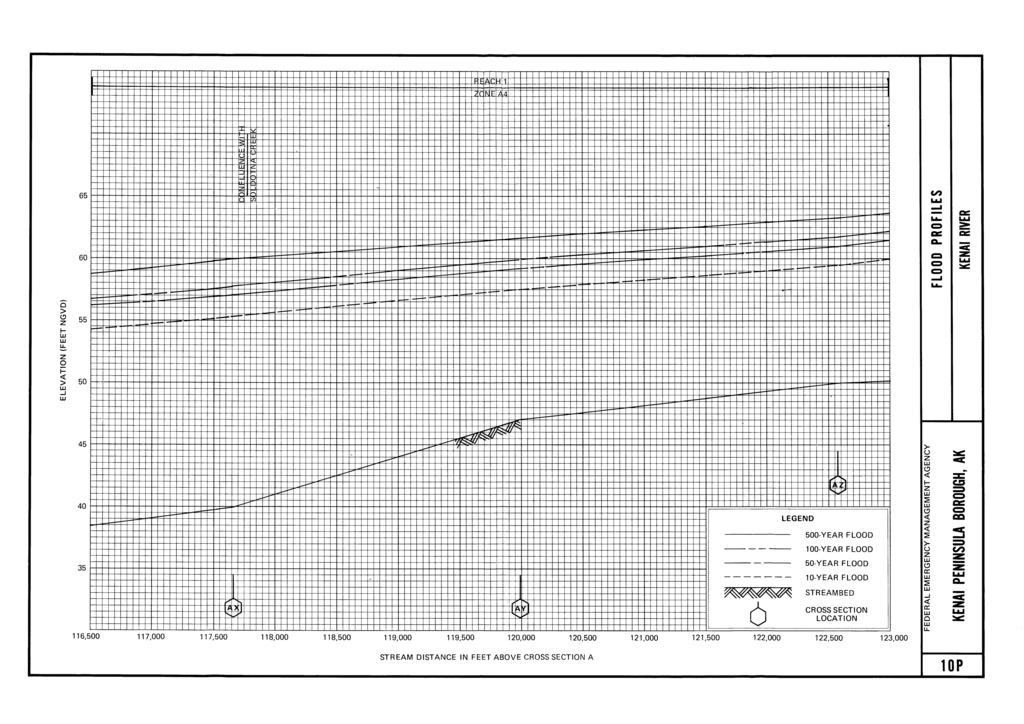
79

80

81

82

83

84

85

86

87

88
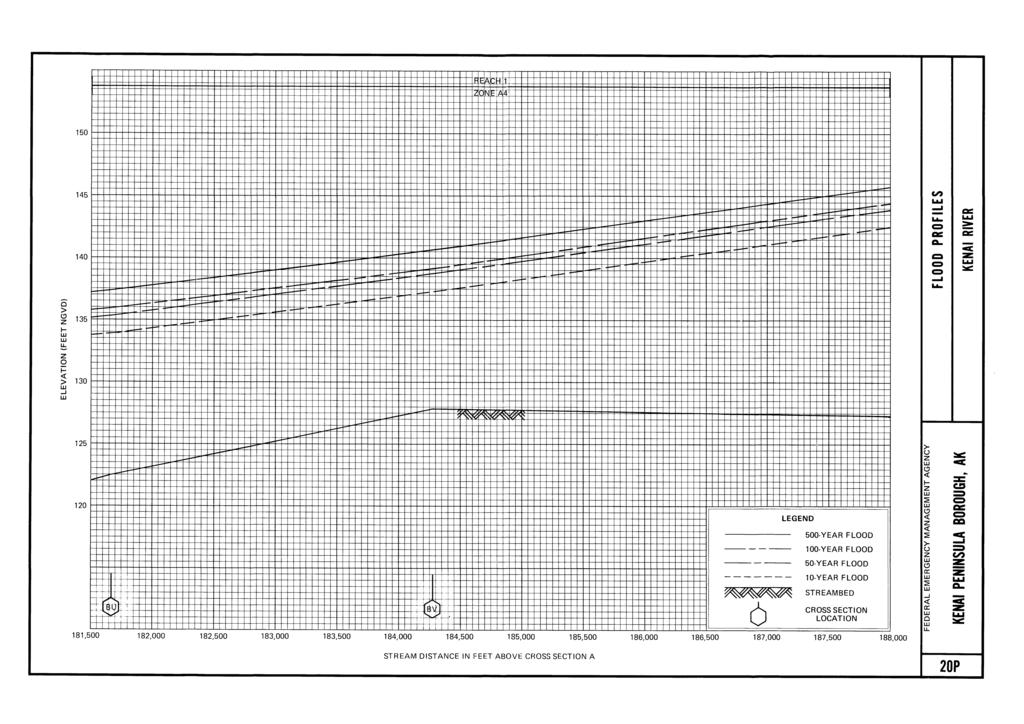
89

90

91
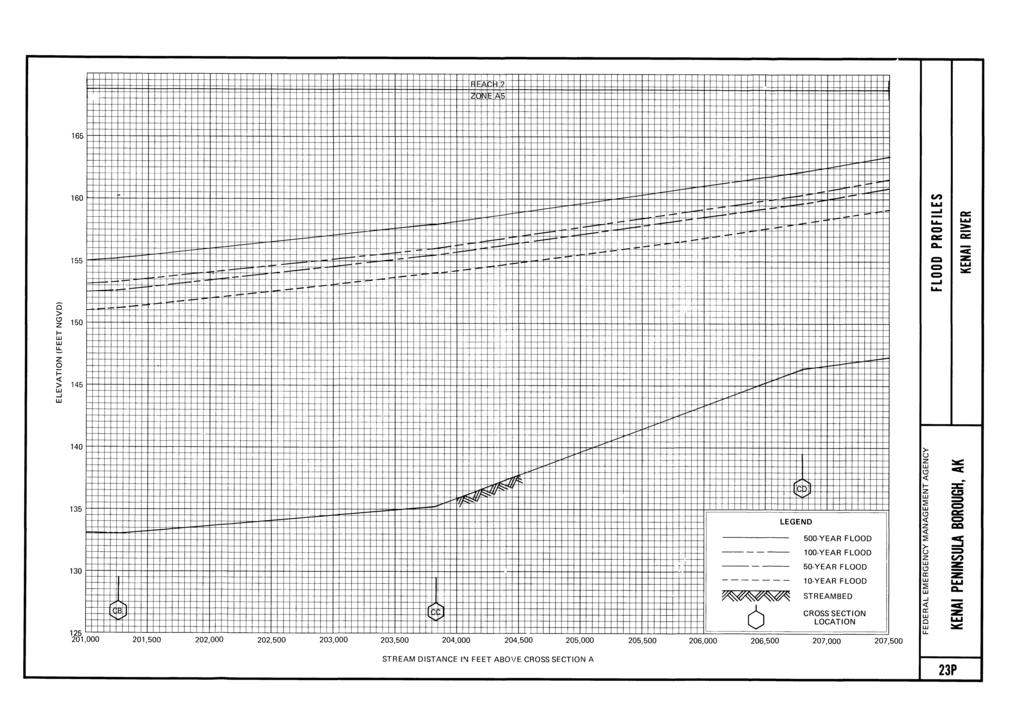
92

93

94

95

96

97

98

99
UPPER COSUMNES RIVER FLOOD MAPPING
 UPPER COSUMNES RIVER FLOOD MAPPING DRAFT BASIC DATA NARRATIVE FLOOD INSURANCE STUDY SACRAMENTO COUTY, CALIFORNIA Community No. 060262 November 2008 Prepared By: CIVIL ENGINEERING SOLUTIONS, INC. 1325 Howe
LOMR SUBMITTAL LOWER NEHALEM RIVER TILLAMOOK COUNTY, OREGON
 LOMR SUBMITTAL LOWER NEHALEM RIVER TILLAMOOK COUNTY, OREGON Prepared for: TILLAMOOK COUNTY DEPARTMENT OF COMMUNITY DEVELOPMENT 1510-B THIRD STREET TILLAMOOK, OR 97141 Prepared by: 10300 SW GREENBURG ROAD,
Appendix E Guidance for Shallow Flooding Analyses and Mapping
 Appendix E Guidance for Shallow Flooding Analyses and Mapping E.1 Introduction Different types of shallow flooding commonly occur throughout the United States. Types of flows that result in shallow flooding
LOMR SUBMITTAL LOWER NESTUCCA RIVER TILLAMOOK COUNTY, OREGON
 LOMR SUBMITTAL LOWER NESTUCCA RIVER TILLAMOOK COUNTY, OREGON Prepared for: TILLAMOOK COUNTY DEPARTMENT OF COMMUNITY DEVELOPMENT 1510-B THIRD STREET TILLAMOOK, OR 97141 Prepared by: 10300 SW GREENBURG ROAD,
YELLOWSTONE RIVER FLOOD STUDY REPORT TEXT
 YELLOWSTONE RIVER FLOOD STUDY REPORT TEXT TECHNICAL REPORT Prepared for: City of Livingston 411 East Callender Livingston, MT 59047 Prepared by: Clear Creek Hydrology, Inc. 1627 West Main Street, #294
PENNSYLVANIA DEPARTMENT OF TRANSPORTATION ENGINEERING DISTRICT 3-0
 PENNSYLVANIA DEPARTMENT OF TRANSPORTATION ENGINEERING DISTRICT 3-0 LYCOMING COUNTY S.R.15, SECTION C41 FINAL HYDROLOGIC AND HYDRAULIC REPORT STEAM VALLEY RUN STREAM RELOCATION DATE: June, 2006 REVISED:
CAMDEN COUNTY, GEORGIA
 CAMDEN COUNTY, GEORGIA AND INCORPORATED AREAS COMMUNITY NAME COMMUNITY NUMBER CAMDEN COUNTY 130262 (UNINCORPORATED AREAS) KINGSLAND, CITY OF 130238 ST. MARYS, CITY OF 130027 WOODBINE, CITY OF 130241 CAMDEN
3.12 Geology and Topography Affected Environment
 3 Affected Environment and Environmental Consequences 3.12 Geology and Topography 3.12.1 Affected Environment 3.12.1.1 Earthquakes Sterling Highway MP 45 60 Project Draft SEIS The Kenai Peninsula is predisposed
The last three sections of the main body of this report consist of:
 Threatened and Endangered Species Geological Hazards Floodplains Cultural Resources Hazardous Materials A Cost Analysis section that provides comparative conceptual-level costs follows the Environmental
Gateway Trail Project
 Gateway Trail Project Debris Flow Hazard Assessment By: Juan de la Fuente April 30, 2010 Background- On April 22, 2010, the Shasta-Trinity National Forest (Mt. Shasta-McCloud Unit) requested a geologic
VOLUME 3 OF 3 FAIRFIELD COUNTY, OHIO AND INCORPORATED AREAS COMMUNITY NAME NUMBER COMMUNITY NAME NUMBER
 VOLUME 3 OF 3 FAIRFIELD COUNTY, OHIO AND INCORPORATED AREAS COMMUNITY NAME NUMBER COMMUNITY NAME NUMBER AMANDA, VILLAGE OF * 390688 PICKERINGTON, CITY OF 390162 BALTIMORE, VILLAGE OF 390159 PLEASANTVILLE,
Ground Water Protection Council 2017 Annual Forum Boston, Massachusetts. Ben Binder (303)
") Ground Water Protection Council 2017 Annual Forum Boston, Massachusetts Protecting Groundwater Sources from Flood Borne Contamination Ben Binder (303) 860-0600 Digital Design Group, Inc. The Problem Houston
Ground Water Protection Council 2017 Annual Forum Boston, Massachusetts Protecting Groundwater Sources from Flood Borne Contamination Ben Binder (303) 860-0600 Digital Design Group, Inc. The Problem Houston
Local Flood Hazards. Click here for Real-time River Information
 Local Flood Hazards Floods of the White River and Killbuck Creek are caused by runoff from general, and/or intense rainfall. Other areas of flooding concern are from the Boland Ditch and Pittsford Ditch.
Erosion Information Paper - South Naknek, Alaska Current as of November 14, 2007
 U.S. Army Corps of Engineers ALASKA BASELINE EROSION ASSESSMENT Erosion Information Paper - South Naknek, Alaska Current as of November 14, 2007 Community Information South Naknek (NACK-neck), originally
YANKTON COUNTY, SOUTH DAKOTA
 YANKTON COUNTY, SOUTH DAKOTA AND INCORPORATED AREAS Community Name Community Number GAYVILLE, TOWN OF* 460205 IRENE, TOWN OF 460120 LESTERVILLE, TOWN OF* 460206 MISSION HILL, TOWN OF 460091 UTICA, TOWN
MORGAN COUNTY COLORADO, AND INCORPORATED AREAS
 MORGAN COUNTY COLORADO, AND INCORPORATED AREAS VOLUME 1 OF 1 Morgan County COMMUNITY NAME COMMUNNITY NUMBER BRUSH, CITY OF 080130 FORT MORGAN, CITY OF 080131 LOG LANE VILLAGE, TOWN OF* 080217 MORGAN COUNTY
COMMUNITY EMERGENCY RESPONSE TEAM FLOODS INTRODUCTION
 INTRODUCTION Floods are one of the most common hazards in the United States. A flood occurs any time a body of water rises to cover what is usually dry land. Flood effects can be local, impacting a neighborhood
TOWN OF FORT KENT, MAINE AROOSTOOK COUNTY
 TOWN OF FORT KENT, MAINE AROOSTOOK COUNTY PRELIMINARY: 01/07/2013 Federal Emergency Management Agency COMMUNITY NUMBER 230019V000A NOTICE TO FLOOD INSURANCE STUDY USERS Communities participating in the
 Red River Flooding June 2015 Caddo and Bossier Parishes Presented by: Flood Technical Committee Where the Rain Falls Matters I-30 versus I-20 I-20 Backwater and Tributary Floods (Localized) 2016 Flood
Appendix C Fluvial Flood Hazards
 Appendix C Fluvial Flood Hazards Sea Level Rise Vulnerability Assessment and Adaptation Project March 2019 Contents Contents... i Figures... i Tables... i Definitions, Acronyms, & Abbreviations... ii
ARMSTRONG COUNTY, PA
 ARMSTRONG COUNTY, PA Revised Preliminary DFIRM Mapping March 31, 2013 Kevin Donnelly, P.E., CFM GG3, Greenhorne & O Mara, Inc. Presentation Agenda Armstrong County DFIRM Overview - June 25, 2010 DFIRM
Background on the March 13-14, 2007 Flooding in Browns Valley (Traverse County), Minnesota
, Minnesota") Background on the March 13-14, 2007 Flooding in Browns Valley (Traverse County), Minnesota Report to the Minnesota Governor s Office Prepared by: Minnesota Department of Natural Resources Waters Division
Background on the March 13-14, 2007 Flooding in Browns Valley (Traverse County), Minnesota Report to the Minnesota Governor s Office Prepared by: Minnesota Department of Natural Resources Waters Division
Section 4: Model Development and Application
 Section 4: Model Development and Application The hydrologic model for the Wissahickon Act 167 study was built using GIS layers of land use, hydrologic soil groups, terrain and orthophotography. Within
UGRC 144 Science and Technology in Our Lives/Geohazards
 UGRC 144 Science and Technology in Our Lives/Geohazards Flood and Flood Hazards Dr. Patrick Asamoah Sakyi Department of Earth Science, UG, Legon College of Education School of Continuing and Distance Education
U.S. ARMY CORPS OF ENGINEERS
 CORPS FACTS Regulating Mississippi River Navigation Pools U.S. ARMY CORPS OF ENGINEERS BUILDING STRONG Historical Background Federal improvements in the interest of navigation on the Mississippi River
3/3/2013. The hydro cycle water returns from the sea. All "toilet to tap." Introduction to Environmental Geology, 5e
 Introduction to Environmental Geology, 5e Running Water: summary in haiku form Edward A. Keller Chapter 9 Rivers and Flooding Lecture Presentation prepared by X. Mara Chen, Salisbury University The hydro
3.11 Floodplains Existing Conditions
 Other stormwater control practices may be needed to mitigate water quality impacts. In addition to detention facilities, other practices such as vegetated basins/buffers, infiltration basins, and bioswales
Red River Levee Panel
 Red River Levee Panel Mississippi River Commission Monday, August 9, 2017 Red River Levees in LA & AR NONE along TX & OK Boarder Red River Levee Issues Caddo Levee Cherokee Park Authorization Bossier Levee
CLAY COUNTY, MINNESOTA AND INCORPORATED AREAS
 CLAY COUNTY, MINNESOTA AND INCORPORATED AREAS Community Name Community Number BARNESVILLE, CITY OF 270078 CLAY COUNTY 275235 (UNINCORPORATED AREAS) *COMSTOCK, CITY OF 270079 DILWORTH, CITY OF 270080 *FELTON,
Section 5. Low-Gradient Streams. What Do You See? Think About It. Investigate. Learning Outcomes
 Chapter 4 Surface Processes Section 5 Low-Gradient Streams What Do You See? Learning Outcomes In this section, you will Use models and real-time streamflow data to understand the characteristics of lowgradient
Summary. Streams and Drainage Systems
 Streams and Drainage Systems Summary Streams are part of the hydrologic cycle and the chief means by which water returns from the land to the sea. They help shape the Earth s surface and transport sediment
REDWOOD VALLEY SUBAREA
 Independent Science Review Panel Conceptual Model of Watershed Hydrology, Surface Water and Groundwater Interactions and Stream Ecology for the Russian River Watershed Appendices A-1 APPENDIX A A-2 REDWOOD
GREENE COUNTY, PA. Revised Preliminary DFIRM Mapping FEMA. Kevin Donnelly, P.E., CFM GG3, Greenhorne & O Mara, Inc. April 10, 2013
 GREENE COUNTY, PA Revised Preliminary DFIRM Mapping April 10, 2013 Kevin Donnelly, P.E., CFM GG3, Greenhorne & O Mara, Inc. Presentation Agenda Greene County DFIRM Overview September 30, 2010 DFIRM Countywide
5.2 IDENTIFICATION OF HAZARDS OF CONCERN
 5.2 IDENTIFICATION OF HAZARDS OF CONCERN 2016 HMP Update Changes The 2011 HMP hazard identification was presented in Section 3. For the 2016 HMP update, the hazard identification is presented in subsection
5.2. IDENTIFICATION OF NATURAL HAZARDS OF CONCERN
 5.2. IDENTIFICATION OF NATURAL HAZARDS OF CONCERN To provide a strong foundation for mitigation strategies considered in Sections 6 and 9, County considered a full range of natural hazards that could impact
Floods Lecture #21 20
 Floods 20 Lecture #21 What Is a Flood? Def: high discharge event along a river! Due to heavy rain or snow-melt During a flood, a river:! Erodes channel o Deeper & wider! Overflows channel o Deposits sediment
JOSEPHINE COUNTY, OREGON AND INCORPORATED AREAS VOLUME 1 OF 2
 JOSEPHINE COUNTY, OREGON AND INCORPORATED AREAS VOLUME 1 OF 2 COMMUNITY NAME COMMUNITY NUMBER CAVE JUNCTION, CITY OF 410107 GRANTS PASS, CITY OF 410108 JOSEPHINE COUNTY UNINCORPORATED AREAS 415590 Effective:
MASON COUNTY, MICHIGAN
 MASON COUNTY, MICHIGAN (ALL JURISDICTIONS) MASON COUNTY Community Community Community Community Name Number Name Number AMBER, TOWNSHIP OF 261271 LOGAN, TOWNSHIP OF 260811 BRANCH, TOWNSHIP OF 261272 LUDINGTON,
Lecture 14: Floods. Key Questions
 Lecture 14: Floods Key Questions 1. What is an upstream flood? 2. What is a downstream flood? 3. What were the setup conditions that cause floods? 4. What is a 100-year flood? 5. How are 100-year flood
APPENDIX E. GEOMORPHOLOGICAL MONTORING REPORT Prepared by Steve Vrooman, Keystone Restoration Ecology September 2013
 APPENDIX E GEOMORPHOLOGICAL MONTORING REPORT Prepared by Steve Vrooman, Keystone Restoration Ecology September 2 Introduction Keystone Restoration Ecology (KRE) conducted geomorphological monitoring in
Erosion Information Paper - Barrow, Alaska Current as of September 14, 2007
 U.S. Army Corps of Engineers ALASKA BASELINE EROSION ASSESSMENT Erosion Information Paper - Barrow, Alaska Current as of September 14, 2007 Community Information Barrow (BARE-row, a.k.a. Ukpeagvik), population
Pequabuck River Flooding Study and Flood Mitigation Plan The City of Bristol and Towns of Plainville and Plymouth, CT
 Pequabuck River Flooding Study and Flood Mitigation Plan The City of Bristol and Towns of Plainville and Plymouth, CT Raymond Rogozinski and Maged Aboelata The City of Bristol and Towns of Plainville and
PLYMOUTH COUNTY, MASSACHUSETTS (ALL JURISDICTIONS)
") PLYMOUTH COUNTY, MASSACHUSETTS Volume 2 of 3 COMMUNITY NAME COMMUNITY NUMBER ABINGTON, TOWN OF 250259 BRIDGEWATER, TOWN OF 250260 BROCKTON, CITY OF 25026 CARVER, TOWN OF 250262 DUXBURY, TOWN OF 250263
PLYMOUTH COUNTY, MASSACHUSETTS Volume 2 of 3 COMMUNITY NAME COMMUNITY NUMBER ABINGTON, TOWN OF 250259 BRIDGEWATER, TOWN OF 250260 BROCKTON, CITY OF 25026 CARVER, TOWN OF 250262 DUXBURY, TOWN OF 250263
Erosion Information Paper Eagle City and Eagle Village, Alaska Current as of January 21, 2008
 U.S. Army Corps of Engineers ALASKA BASELINE EROSION ASSESSMENT Erosion Information Paper Eagle City and Eagle Village, Alaska Current as of January 21, 2008 Community Information The City of Eagle, population
USGS Flood Inundation Mapping of the Suncook River in Chichester, Epsom, Pembroke and Allenstown, New Hampshire
 USGS Flood Inundation Mapping of the Suncook River in Chichester, Epsom, Pembroke and Allenstown, New Hampshire NH Water & Watershed Conference Robert Flynn, USGS NH-VT Water Science Center March 23, 2012
STREAM SYSTEMS and FLOODS
 STREAM SYSTEMS and FLOODS The Hydrologic Cycle Precipitation Evaporation Infiltration Runoff Transpiration Earth s Water and the Hydrologic Cycle The Hydrologic Cycle The Hydrologic Cycle Oceans not filling
Precipitation Evaporation Infiltration Earth s Water and the Hydrologic Cycle. Runoff Transpiration
 STREAM SYSTEMS and FLOODS The Hydrologic Cycle Precipitation Evaporation Infiltration Earth s Water and the Hydrologic Cycle Runoff Transpiration The Hydrologic Cycle The Hydrologic Cycle Oceans not filling
Issue 44: Phase II & III H&H Issues Date: 07/03/2006 Page 1
 Background Phase I of the NCFMP studies have primarily focused on the coastal plain and sandhills physiographic regions in of the State. Phase II and III study areas will focus on the piedmont, foothills,
SEVERE WEATHER 101. Flood Basics
 SEVERE WEATHER 101 Flood Basics What is flooding? Flooding is an overflowing of water onto land that is normally dry. Floods can happen during heavy rains, when ocean waves come on shore, when snow melts
Great Lakes Update. Volume 194: 2015 Annual Summary
 Great Lakes Update Volume 194: 2015 Annual Summary Background The U.S. Army Corps of Engineers (USACE) tracks and forecasts the water levels of each of the Great Lakes. This report summarizes the hydrologic
1 INTRODUCTION AND MAJOR FINDINGS... 1
 Memorandum To: Lindsey Clark, Stillwater Valley Watershed Council Coordinator From: Chad Raisland, Pioneer Technical Services, Inc. and Karin Boyd, Applied Geomorphology, Inc. CC: Tanya Lester, Stillwater
GEOL 1121 Earth Processes and Environments
 GEOL 1121 Earth Processes and Environments Wondwosen Seyoum Department of Geology University of Georgia e-mail: seyoum@uga.edu G/G Bldg., Rm. No. 122 Seyoum, 2015 Chapter 6 Streams and Flooding Seyoum,
Modeling Great Britain s Flood Defenses. Flood Defense in Great Britain. By Dr. Yizhong Qu
 Modeling Great Britain s Flood Defenses AIRCurrents Editor s note: AIR launched its Inland Flood Model for Great Britain in December 2008. The hazard module captures the physical processes of rainfall-runoff
Floods. Floods COMMUNITY EMERGENCY RESPONSE TEAM FLOODS CONTENT INSTRUCTOR GUIDANCE
 Floods Floods Introduce this topic by explaining that floods are one of the most common hazards in the United States. A flood occurs any time a body of water rises to cover what is usually dry land. Display
Learning Objectives: I can identify and interpret river flows and directions.
 Learning Objectives: I can identify and interpret river flows and directions. Bellringer Review: Check for Understanding Questions: 1 2 What Are The Key Parts Of A River s Anatomy? In your data notebooks
Dealing with Zone A Flood Zones. Topics of Discussion. What is a Zone A Floodplain?
 Dealing with Zone A Flood Zones Topics of Discussion Overview of Zone A Floodplains Permitting Development in Zone A Floodplains Estimating Flood Elevations in Zone A Flood Insurance Implications Letters
Erosion Surface Water. moving, transporting, and depositing sediment.
 + Erosion Surface Water moving, transporting, and depositing sediment. + Surface Water 2 Water from rainfall can hit Earth s surface and do a number of things: Slowly soak into the ground: Infiltration
HYDROLOGIC AND HYDRAULIC REPORT FOR SR. 0522, SECTION 5BN ALONG BLACKLOG CREEK CROMWELL TOWNSHIP HUNTINGDON COUNTY. Prepared for:
 HYDROLOGIC AND HYDRAULIC REPORT FOR SR. 0522, SECTION 5BN ALONG BLACKLOG CREEK CROMWELL TOWNSHIP Prepared for: KCI Technologies, Inc. Mechanicsburg, PA and Pennsylvania Department of Transportation Engineering
5.2 IDENTIFICATION OF HAZARDS OF CONCERN
 5.2 IDENTIFICATION OF HAZARDS OF CONCERN 2015 HMP Update Changes The 2010 HMP hazard identification was presented in Section 6. For the 2015 HMP update, the hazard identification is presented in subsection
McINTOSH COUNTY, GEORGIA
 McINTOSH COUNTY, GEORGIA AND INCORPORATED AREAS Community Name Community Number Darien, City of 130131 McIntosh County 130130 (Unincorporated Areas) Preliminary: McIntosh County FLOOD INSURANCE STUDY NUMBER
4.1 Hazard Identification: Natural Hazards
 data is provided in an annex, it should be assumed that the risk and potential impacts to the affected jurisdiction are similar to those described here for the entire Sacramento County Planning Area. This
Draft exercise for share fair at Bozeman workshop only. This exercise is not ready for distribution. Please send helpful suggestions to
 Draft exercise for share fair at Bozeman workshop only. This exercise is not ready for distribution. Please send helpful suggestions to foleyd@plu.edu Figure list 1. Trailer photograph 2. Location map
L OWER N OOKSACK R IVER P ROJECT: A LTERNATIVES A NALYSIS A PPENDIX A: H YDRAULIC M ODELING. PREPARED BY: LandC, etc, LLC
 L OWER N OOKSACK R IVER P ROJECT: A LTERNATIVES A NALYSIS A PPENDIX A: H YDRAULIC M ODELING PREPARED BY: LandC, etc, LLC TABLE OF CONTENTS 1 Introduction... 1 2 Methods... 1 2.1 Hydraulic Model... 1 2.2
Juneau Jokulhlaup Inundation Report
 2015 Juneau Jokulhlaup Inundation Report 3 November 2015 Alaska Silver Jackets Contents Contents... 2 1. Introduction... 3 a. Project Overview and Purpose... 3 b. Site Description... 3 c. Flood History...
Community Erosion Assessment Napakiak, Alaska 15 January 2008
 1. Community: Napakiak, Alaska Community Erosion Assessment Napakiak, Alaska 15 January 2008 Figure 1: Napakiak Location & Vicinity Map 2. Community Profile Summary: Napakiak is a 2 nd class city of 378
Flooding in Western North Carolina: Some Spatial, Hydrologic, and Seasonal Characteristics CAUTION!! Outline. Basic Flood Facts.
 Flooding in Western North Carolina: Some Spatial, Hydrologic, and Seasonal Characteristics J. Greg Dobson CAUTION!! National Environmental Modeling and Analysis Center RENCI at UNC-Asheville Engagement
Case Study 2: Twenty-mile Creek Rock Fords
 Case Study : Twenty-mile Creek Rock Fords Location Crossing Description Washington. Okanagan National Forest. Methow Valley Ranger District. Chewuch river basin, East Chewuch Road. The Twenty-mile Creek
Natural Variability in Annual Maximum Water Level and Outflow of Yellowstone Lake
 Natural Variability in Annual Maximum Water Level and Outflow of Yellowstone Lake Phillip E. Farnes Abstract The water level in Yellowstone Lake varies each year in response to differences in the winter
Analysis of Hydraulic Impacts on the Schuylkill River
 Analysis of Hydraulic Impacts on the Schuylkill River Manayunk Sewer Basin Construction Project and the Venice Island Recreation Center Reconstruction Project Venice Island, Manayunk, Philadelphia, PA
27. Running Water I (p ; )
") 27. Running Water I (p. 424-436; 440-444) Hydrosphere How much of the Earth s surface is covered by water? Earth's water is collectively called the and is stored in a number of so-called as follows: 1.
27. Running Water I (p. 424-436; 440-444) Hydrosphere How much of the Earth s surface is covered by water? Earth's water is collectively called the and is stored in a number of so-called as follows: 1.
9. PROBABLE MAXIMUM PRECIPITATION AND PROBABLE MAXIMUM FLOOD
 9. PROBABLE MAXIMUM PRECIPITATION AND PROBABLE MAXIMUM FLOOD 9.1. Introduction Due to the size of Watana Dam and the economic importance of the Project to the Railbelt, the Probable Maximum Flood (PMF)
Coastal Flood Risk Study Project for East Coast Central Florida Study Area
 Coastal Flood Risk Study Project for East Coast Central Florida Study Area St Lucie County, Florida Flood Risk Review Meeting March 28, 2017 Introductions Risk MAP Project Team FEMA Region IV BakerAECOM,
Earth Science Chapter 6 Section 2 Review
 Name: Class: Date: Earth Science Chapter 6 Section Review Multiple Choice Identify the choice that best completes the statement or answers the question. 1. Most streams carry the largest part of their
JOURNAL OF ENVIRONMENTAL HYDROLOGY The Electronic Journal of the International Association for Environmental Hydrology VOLUME
 JOURNAL OF ENVIRONMENTAL HYDROLOGY The Electronic Journal of the International Association for Environmental Hydrology VOLUME 18 2010 REDUCED CHANNEL CONVEYANCE ON THE WICHITA RIVER AT WICHITA FALLS, TEXAS,
Assessment of the Hood River Delta Hood River, Oregon
 Assessment of the Hood River Delta Hood River, Oregon Pacific Northwest Waterways Association Annual Meeting October 13, 2010 Michael McElwee, Executive Director Port of Hood River Overview U.S. Army Corps
Summary of Hydraulic and Sediment-transport. Analysis of Residual Sediment: Alternatives for the San Clemente Dam Removal/Retrofit Project,
 Appendix N SUMMARY OF HYDRAULIC AND SEDIMENT-TRANSPORT ANALYSIS OF RESIDUAL SEDIMENT: ALTERNATIVES FOR THE SAN CLEMENTE DAM REMOVAL/RETROFIT PROJECT, CALIFORNIA the San Clemente Dam Removal/Retrofit Project,
CHAPTER 28. PHYSIOGRAPHY Cook Inlet Drainages
 PEBBLE PROJECT ENVIRONMENTAL BASELINE DOCUMENT 2004 through 2008 CHAPTER 28. PHYSIOGRAPHY Cook Inlet Drainages PREPARED BY: Knight Piésold Ltd. PHYSIOGRAPHY COOK INLET DRAINAGES TABLE OF CONTENTS TABLE
Highland Lake Bathymetric Survey
 Highland Lake Bathymetric Survey Final Report, Prepared For: The Town of Highland Lake 612 Lakeshore Drive Oneonta, AL 35121 Prepared By: Tetra Tech 2110 Powers Ferry Road SE Suite 202 Atlanta, GA 30339
ENGINEERING HYDROLOGY
 ENGINEERING HYDROLOGY Prof. Rajesh Bhagat Asst. Professor Civil Engineering Department Yeshwantrao Chavan College Of Engineering Nagpur B. E. (Civil Engg.) M. Tech. (Enviro. Engg.) GCOE, Amravati VNIT,
3.12 Geology and Topography Affected Environment
 3 Affected Environment and Environmental Consequences 3.12 Geology and Topography 3.12.1 Affected Environment 3.12.1.1 Earthquakes Sterling Highway MP 45 60 Project Final EIS The Kenai Peninsula is predisposed
CLIMATE READY BOSTON. Climate Projections Consensus ADAPTED FROM THE BOSTON RESEARCH ADVISORY GROUP REPORT MAY 2016
 CLIMATE READY BOSTON Sasaki Steering Committee Meeting, March 28 nd, 2016 Climate Projections Consensus ADAPTED FROM THE BOSTON RESEARCH ADVISORY GROUP REPORT MAY 2016 WHAT S IN STORE FOR BOSTON S CLIMATE?
EROSION AND DEPOSITION
 CHAPTER 8 EROSION AND DEPOSITION SECTION 8 1 Changing Earth s Surface (pages 252-255) This section explains how sediment is carried away and deposited elsewhere to wear down and build up Earth s surface.
ES 105 Surface Processes I. Hydrologic cycle A. Distribution % in oceans 2. >3% surface water a. +99% surface water in glaciers b.
 ES 105 Surface Processes I. Hydrologic cycle A. Distribution 1. +97% in oceans 2. >3% surface water a. +99% surface water in glaciers b. >1/3% liquid, fresh water in streams and lakes~1/10,000 of water
L _*" I_
 -- @ o*.d 8 UNIVERSITY OF NEVADA-RENO ---^^_ lo-k L - - -- --- - _*" I lll-l-lllll Nevada Bureau of Fdlines and Goology LJriivrts~ly o: Nevada tierlo Ficnn, Novnda 8055 7 OORO (102) it34 6691 NEMG OPEN
Stream Geomorphology. Leslie A. Morrissey UVM July 25, 2012
 Stream Geomorphology Leslie A. Morrissey UVM July 25, 2012 What Functions do Healthy Streams Provide? Flood mitigation Water supply Water quality Sediment storage and transport Habitat Recreation Transportation
GOAL 7 AREAS SUBJECT TO NATURAL DISASTERS AND HAZARDS. To protect life and property from natural disasters and hazards.
 GOAL 7 AREAS SUBJECT TO NATURAL DISASTERS AND HAZARDS A. GOALS: To protect life and property from natural disasters and hazards. B. POLICIES: 1. Floodplains shall be maintained as natural drainage-ways.
DRAFT Design Hydraulic Study. Bridge 04C-0055, Mattole Road Bridge over Mattole River at Honeydew. Humboldt County. Prepared for:
 DRAFT Design Hydraulic Study Bridge 04C-0055, Mattole Road Bridge over Mattole River at Honeydew Humboldt County Prepared for: Morrison Structures Incorporated 1890 Park Marina Drive, Suite 104 Redding,
Hydrologic Forecast Centre Manitoba Infrastructure, Winnipeg, Manitoba. MARCH OUTLOOK REPORT FOR MANITOBA March 23, 2018
 Page 1 of 21 Hydrologic Forecast Centre Manitoba Infrastructure, Winnipeg, Manitoba MARCH OUTLOOK REPORT FOR MANITOBA March 23, 2018 Overview The March Outlook Report prepared by the Hydrologic Forecast
LIBERTY COUNTY, GEORGIA
 LIBERTY COUNTY, GEORGIA AND INCORPORATED AREAS Liberty County Community Name Community Number ALLENHURST, TOWN OF 130350 FLEMINGTON, CITY OF 130124 GUMBRANCH, CITY OF 130610 HINESVILLE, CITY OF 130125
Application #: TEXT
 TOWN OF FORT MYERS BEACH 2008 PROPOSED COMPREHENSIVE PLAN AMENDMENTS Application #: 2008-13-TEXT Description: Modify the Coastal Management and Future Land Use Elements to reflect the state s new definition
Storm Surge Analysis Update Meeting Cross City, Florida June 17, 2014
 Big Bend Coastal Storm Surge Study Storm Surge Analysis Update Meeting Cross City, Florida June 17, 2014 Introductions Risk MAP Project Team FEMA Region IV Florida Division of Emergency Management (FDEM)
Solutions to Flooding on Pescadero Creek Road
 Hydrology Hydraulics Geomorphology Design Field Services Photo courtesy Half Moon Bay Review Solutions to Flooding on Pescadero Creek Road Prepared for: San Mateo County Resource Conservation District
LEVEE DESIGN FOR FLOOD PROTECTION ON ALLUVIAL FANS
 LEVEE DESIGN FOR FLOOD PROTECTION ON ALLUVIAL FANS BRUCE M. PHILLIPS 1 ABSTRACT The dynamic nature of alluvial fans in arid environments offers numerous floodplain management challenges primarily due to
HyMet Company. Streamflow and Energy Generation Forecasting Model Columbia River Basin
 HyMet Company Streamflow and Energy Generation Forecasting Model Columbia River Basin HyMet Inc. Courthouse Square 19001 Vashon Hwy SW Suite 201 Vashon Island, WA 98070 Phone: 206-463-1610 Columbia River
CHAPTER FIVE: THE LOWER MISSISSIPPI REGION AND PLAQUEMINES PARISH
 CHAPTER FIVE: THE LOWER MISSISSIPPI REGION AND PLAQUEMINES PARISH 5.1 Overview Plaquemines Parish is the area where the last portion of the Mississippi River flows out into the Gulf of Mexico (see Figures
5.2 IDENTIFICATION OF HAZARDS OF CONCERN
 5.2 IDENTIFICATION OF HAZARDS OF CONCERN 2016 HMP Update Changes The 2011 HMP hazard identification was presented in Section 3. For the 2016 HMP update, the hazard identification is presented in subsection
MEDIA RELEASE FOR IMMEDIATE RELEASE March 17, 2014 Preparing for the Spring Thaw
 BRACEBRIDGE, ONT Springtime is fast approaching and flooding in low lying areas of the Town is a potential risk due to melting snow and spring rain fall. Flooding can also be experienced during extreme
Lab 12 Coastal Geology
 Lab 12 Coastal Geology I. Fluvial Systems Hydrologic Cycle Runoff that flows into rivers = precipitation (rain and snowmelt) [infiltration (loss to groundwater) + evaporation (loss to atmosphere) + transpiration
B-1. Attachment B-1. Evaluation of AdH Model Simplifications in Conowingo Reservoir Sediment Transport Modeling
 Attachment B-1 Evaluation of AdH Model Simplifications in Conowingo Reservoir Sediment Transport Modeling 1 October 2012 Lower Susquehanna River Watershed Assessment Evaluation of AdH Model Simplifications
Emergency Action Plan (EAP) Tata Pond Dam
 Tata Pond Dam") For Official Use Only Not for Public Distribution 02/03/16 Emergency Action Plan (EAP) Tata Pond Dam State of Connecticut Dam ID: 0000 Town or City, County, Connecticut Name of Dam Owner Dam Hazard Classification
For Official Use Only Not for Public Distribution 02/03/16 Emergency Action Plan (EAP) Tata Pond Dam State of Connecticut Dam ID: 0000 Town or City, County, Connecticut Name of Dam Owner Dam Hazard Classification