LIBERTY COUNTY, GEORGIA
|
|
|
- Lisa Long
- 6 years ago
- Views:
Transcription

")

1 LIBERTY COUNTY, GEORGIA AND INCORPORATED AREAS Liberty County Community Name Community Number ALLENHURST, TOWN OF FLEMINGTON, CITY OF GUMBRANCH, CITY OF HINESVILLE, CITY OF LIBERTY COUNTY (UNINCORPORATED AREAS) MIDWAY, CITY OF RICEBORO, CITY OF WALTHOURVILLE, CITY OF Effective: September 26, 2008 FLOOD INSURANCE STUDY NUMBER 13179CV000A
2 NOTICE TO FLOOD INSURANCE STUDY USERS Communities participating in the National Flood Insurance Program have established repositories of flood hazard data for floodplain management and flood insurance purposes. This Flood Insurance Study (FIS) report may not contain all data available within the Community Map Repository. Please contact the Community Map Repository for any additional data. The Federal Emergency Management Agency (FEMA) may revise and republish part or all of this FIS report at any time. In addition, FEMA may revise part of this FIS report by the Letter of Map Revision process, which does not involve republication or redistribution of the FIS report. Therefore, users should consult with community officials and check the Community Map Repository to obtain the most current FIS report components. Selected Flood Insurance Rate Map panels for this community contain information that was previously shown separately on the corresponding Flood Boundary and Floodway Map panels (e.g., floodways, cross sections). In addition, former flood hazard zone designations have been changed as follows: Old Zone(s) Al through A30 VI through V30 B C New Zone AE VE X X Initial Countywide FIS Effective Date: September 26, 2008
3 TABLE OF CONTENTS 1.0 INTRODUCTION Purpose of Study Authority and Acknowledgments Coordination AREA STUDIED Scope of Study Community Description Principal Flood Problems Flood Protection Measures ENGINEERING METHODS Hydrologic Analyses Hydraulic Analyses Wave Height Analysis Vertical Datum FLOODPLAIN MANAGEMENT APPLICATIONS Floodplain Boundaries Floodways Base Flood Elevations Velocity Zones INSURANCE APPLICATIONS FLOOD INSURANCE RATE MAP OTHER STUDIES LOCATION OF DATA BIBLIOGRAPHY AND REFERENCES...40 i
4 TABLE OF CONTENTS (Continued) FIGURES Figure 1 - Transect Location Map Figure 2 - Transect Schematic Figure 3 - Sample Transect Figure 4 - Floodway Schematic TABLES Table 1 - Streams Studied by Detailed Methods... 5 Table 2 - Streams Studied by Approximate Methods... 5 Table 3 - Summary of Discharges Table 4 - Summary of Tidal Elevations Table 5 - Parameter Values for Surge Elevation Computations Table 6 - Manning s n Values Table 7 - Transect Data Table 8 - Vertical Datum Conversion Table 9 - Floodway Data Table 10 - Community Map History Exhibit 1 - Flood Profiles EXHIBITS Alligator Canal Cay Creek Goshen Canal Mallard Canal Mill Creek Mill Creek Tributary No. 2 Peacock Creek Peacock Creek Tributary No. 1 Riceboro Creek Panels 01P-02P Panels 03P-04P Panels 05P-08P Panel 09P Panels 10P-14P Panels 15P-16P Panels 17P-22P Panels 23P-24P Panels 25P-26P Exhibit 2 - Flood Insurance Rate Map Index Flood Insurance Rate Map ii
5 FLOOD INSURANCE STUDY LIBERTY COUNTY, GEORGIA AND INCORPORATED AREAS 1.0 INTRODUCTION 1.1 Purpose of Study This Flood Insurance Study (FIS) revises and updates information on the existence and severity of flood hazards in the geographic area of Liberty County, including the Cities of Flemington, Gumbranch, Hinesville, Midway, Riceboro, and Walthourville; the Town of Allenhurst; and the unincorporated areas of Liberty County (referred to collectively herein as Liberty County), and aids in the administration of the National Flood Insurance Act of 1968 and the Flood Disaster Protection Act of This study has developed flood-risk data for various areas of the community that will be used to establish actuarial flood insurance rates and to assist the community in its efforts to promote sound floodplain management. Minimum floodplain management requirements for participation in the National Flood Insurance Program (NFIP) are set forth in the Code of Federal Regulations at 44 CFR, In some states or communities, floodplain management criteria or regulations may exist that are more restrictive or comprehensive than the minimum Federal requirements. In such cases, the more restrictive criteria take precedence and the State (or other jurisdictional agency) will be able to explain them. The Digital Flood Insurance Rate Map (DFIRM) and FIS report for this countywide study have been produced in digital format. Flood hazard information was converted to meet the Federal Emergency Management Agency (FEMA) DFIRM database specifications and Geographic Information System (GIS) format requirements. The flood hazard information was created and is provided in a digital format so that it can be incorporated into a local GIS and be accessed more easily by the community. 1.2 Authority and Acknowledgments The sources of authority for this FIS are the National Flood Insurance Act of 1968 and the Flood Disaster Protection Act of
6 Precountywide Analyses Information on the authority and acknowledgements for each jurisdiction included in this countywide FIS report, as compiled from their previously printed FIS reports, are shown below: Flemington, City of: The hydrologic and hydraulic analyses for Alligator Canal, Goshen Canal, Mallard Canal, and Peacock Creek for the original FIS report dated May 17, 1982, were prepared by Post, Buckley, Schuh & Jernigan, Inc., for the Federal Insurance Administration (FIA), under Contract No. H-4778 (FIA, 1982). The work was completed in June The revised hydrologic and hydraulic analyses for Peacock Creek for the first revision, dated September 30, 1988 (FEMA, 1988), were prepared by the U.S. Army Corps of Engineers (USACE), Savannah District. Hinesville, City of: The hydrologic and hydraulic analyses for Mill Creek, Mill Creek Tributary No. 2, Peacock Creek, and Peacock Creek Tributary No. 1 for the original FIS report dated February 4, 1987 (FEMA, 1987), were prepared by Post, Buckley, Schuh & Jernigan, Inc., for FEMA, under Contract No. EMW The work was completed in January Liberty County (Unincorporated Areas): The hydrologic and hydraulic analyses for Cay Creek, Goshen Canal, Mill Creek, and Peacock Creek for the original FIS report dated June 1, 1983 (FEMA, 1983), were completed by Post, Buckley, Schuh & Jernigan, Inc., for FEMA, under Contract No. H The work was completed in May
7 Midway, City of: The hydrologic and hydraulic analyses for Cay Creek for the original FIS report dated March 30, 1981 (FIA, 1981a), were prepared by Post, Buckley, Schuh & Jernigan, Inc., for the FIA, under Contract No. H The work was completed in April Riceboro, City of: The hydrologic and hydraulic analyses for Riceboro Creek for the original FIS report dated May 4, 1981 (FIA, 1981b), were prepared by Post, Buckley, Schuh & Jernigan, Inc., for the FIA, under Contract No. H The work was completed in April This Countywide FIS Report For this countywide FIS, streams restudied by approximate methods and redelineation of floodplain boundaries for streams studied by approximate methods was performed by PBS&J, for the Georgia Department of Natural Resources (DNR), under Contract No. EMA-2006-CA-5615, with FEMA. The work was completed in June Base map information shown on the Flood Insurance Rate Map (FIRM) was provided for Liberty County by ImageAmerica, dated 2006 and captured at a resolution of six inches. The projection used in the preparation of this map is State Plane Georgia East (FIPS Zone 1001), and the horizontal datum used is the North American Datum of Coordination Precountywide Analyses An initial meeting is held with representatives from FEMA, the community, and the study contractor to explain the nature and purpose of a FIS, and to identify the streams to be studied or restudied. A final meeting is held with representatives from FEMA, the community, and the study contractor to review the results of the study. The initial and final meeting dates for the previous FIS reports for Liberty County and its communities are listed in the following table: 3
8 Community FIS Date Initial Meeting Final Meeting Flemington, City of May 17, 1982 May 1978 May 5, 1981 September 30, 1988 * * Hinesville, City of February 4, 1987 * February 13, 1986 Liberty County (Unincorporated Areas) June 1, 1983 May 1978 December 12, 1982 Midway, City of March 3, 1981 May 1978 August 28, 1980 Riceboro, City of May 4, 1981 May 1978 August 28, 1980 * Data not available This Countywide FIS Report For this countywide FIS, a scoping meeting was held on September 30, 2004, at the Coastal Georgia Regional Development Center, and attended by representatives of Liberty County, the Georgia DNR, and PBS&J. The purpose of this meeting was to discuss the scope of the countywide FIS. The results of the study were reviewed at the final meeting held on November 15, 2007, and attended by representatives of PBS&J, Liberty County, and the Georgia DNR. All problems raised at the meeting have been addressed. 2.0 AREA STUDIED 2.1 Scope of Study This FIS covers the geographic area of Liberty County, Georgia, including the incorporated communities listed in Section 1.1. The areas studied by detailed methods were selected with priority given to all known flood hazards and areas of projected development or proposed construction through the time of the study. Precountywide Analyses The potential for flooding due to open coast surge wave was studied, and the added effect of wind induced waves was also examined. The effects of flooding due to ponding were not considered. 4
9 Streams that were studied by detailed methods are indicated in Table 1. The limits of detailed study are indicated on the Flood Profiles (Exhibit 1) and on the FIRM (Exhibit 2). Table 1 - Streams Studied by Detailed Methods Alligator Canal Mill Creek Tributary No. 2 Cay Creek Peacock Creek Goshen Canal Peacock Creek Tributary No. 1 Mallard Canal Riceboro Creek Mill Creek This Countywide FIS Report For this countywide FIS, the FIS report and FIRM were converted to countywide format, and the flooding information for the entire county, including both incorporated and unincorporated areas is shown. Also, the vertical datum was converted from the National Geodetic Vertical Datum of 1929 (NGVD) to the North American Vertical Datum of 1988 (NAVD). In addition, the Universal Transverse Mercator, State Plane coordinates, previously referenced to the North American Datum of 1927, are now referenced to the North American Datum of Existing areas studied by detailed methods were redelineated as part of this countywide revision. LIDAR-generated contour intervals of two feet were obtained and used to update floodplain boundaries with the latest available data (Laser Mapping Specialists Inc., 2006). Also, existing areas studied by approximate methods were redelineated using the new two foot contours as part of this countywide FIS. In addition, areas restudied by approximate methods were selected with priority given to all known flood hazards and areas of projected development or proposed construction through June The streams restudied by approximate methods are presented in Table 2. Table 2 - Streams Studied by Approximate Methods Stream Cay Creek Porter Creek Reach Description From approximately 11,000 feet downstream of Cay Creek Road to CSX railroad From approximately 6,450 feet downstream of Cay Creek Road to approximately 3,200 feet upstream of CSX railroad 5
10 Table 2 - Streams Studied by Approximate Methods (Continued) Stream Porter Creek Tributary No. 2 Riceboro Creek Riceboro Creek Tributary No. 6 Riceboro Creek Tributary No. 7 Reach Description From the confluence with Porter Creek to approximately 2,430 feet upstream of Ernie Drive From approximately 880 feet upstream of U.S. Highway 17/State Highway 25/South Coastal Highway to approximately 3,100 feet upstream of Dunlevie Road From approximately 5,550 feet downstream of Dunlevie Road to approximately 2,750 feet upstream of Dunlevie Road From the confluence with Riceboro Creek to approximately 1,840 feet upstream of West Oglethorpe Highway/U.S. Highway 84/State Highway 38 Taylors Creek From approximately 23,200 feet downstream of State Highway 119/144 to the county boundary Riceboro Creek From approximately 880 feet upstream of U.S. Highway 17/State Highway 25/South Coastal Highway to approximately 3,100 feet upstream of Dunlevie Road The following tabulation presents Letters of Map Change (LOMCs) incorporated into this countywide study: LOMC Case Number Date Issued Project Identifier LOMR P 12/01/1997 Horse Creek Waterfield Subdivision LOMR P 05/15/2002 McDonald Ridge Subdivision The following tabulation lists streams that have names in this countywide FIS other than those used in the previously printed FIS reports for the communities in which they are located. Community Old Name New Name Flemington, City of Peacock Canal Peacock Creek Approximate analyses were used to study those areas having low development potential or minimal flood hazards. The scope and methods of study were proposed to and agreed upon by FEMA and Liberty County. 6
11 2.2 Community Description Liberty County is located in the eastern coastal plains region of the State of Georgia. The county is bordered by the Atlantic Ocean to the east, McIntosh and Long Counties to the south, Evans County to the east, Bryan County to the north, and Tatnall County to the northwest. The total land area contained within the county limits is approximately 514 square miles. Liberty County is approximately 38 miles southwest of Savannah, 200 miles southeast of Atlanta, and 120 miles northwest of Jacksonville, Florida. According to the U.S. Census Bureau, in 2006 the population for Liberty County and its incorporated areas was 62,571 (U.S. Census Bureau, 2006). Since 1990, Liberty County has experienced a population increase of 1.2%. The climate in this area is warm and temperate to subtropical. Mean summer and winter temperatures range from 83 degrees Fahrenheit ( F) in July to 52 F in January. Annual average precipitation of the region is 48 inches. Most of the precipitation occurs in the summer months (The Weather Channel, 2007). The South Newport River forms the boundary between Liberty and McIntosh Counties. It flows in an eastward direction, where it empties into Sapelo Sound. Water levels and flows in the South Newport River are significantly affected by tides. At the lower limit of the study, the South Newport River has a drainage area of approximately 160 square miles. The South Newport River was studied in detail from Sapelo Sound upstream to its intersection with State Highway 25/U.S. Highway 17. The Peacock Creek/North Newport River system and a tributary, Goshen Canal, are studied in detail. The detailed analysis of Peacock Creek extends from Interstate Highway 95 upstream to the Hinesville city limits. Goshen Canal is studied from its confluence with Peacock Creek to the Flemington city limits. Two smaller tributaries flow into the Peacock Creek/North Newport River system near the lower limits of the detailed study. One of these tributaries is Riceboro Creek and another tributary is Cay Creek. Riceboro Creek is studied in detail from its confluence with Peacock Creek to the Riceboro city limits. The detailed study of Cay Creek extends from the CSX railroad to the Midway city limits. The Peacock Creek/North Newport River system flows in a southeasterly direction toward the coast. In the coastal area, the channels of the rivers cut across tidal marshlands of approximately two feet elevation (NAVD). These tidal floodplains are bounded by higher ground of approximately nine feet elevation (NAVD) or greater. In the vicinity of their downstream limits of study, as evident on the U.S. Geological Survey (USGS) 7.5 minute topographic maps, the floodplains become much wider. There are a series of sounds (main channels) and a network of tributaries (USGS, various dates). 7
12 The U.S. Department of Agriculture Soil Conservation Service (SCS) has published a general Soil Map for Liberty County (SCS, undated). In the tidal floodplain area, the predominant soil association is Tidal Marsh-Capers. Further inland, the predominant associations in the floodplains are Bayou-Rains- Portsmouth and Swamp-Johnston. Both associations consist of poorly drained soils. For the higher ground, the predominant soils in the area near the coast are sandy. Further inland, predominant soils are those with medium textured subsoils. Permeabilities here range from good to poor (SCS, undated). In the coastal floodplain areas, vegetation consists of long grasses. In the higher ground there are numerous bushes and trees. Inland along the rivers, the vegetation of the floodplain becomes progressively more dense, with bushes and trees appearing. 2.3 Principal Flood Problems The geographic location of Liberty County along the Atlantic Ocean places it in the hurricane path from storms originating in this warm tropical area of the Atlantic Ocean, Carribean Sea, and the Gulf of Mexico. During the last century, the county has escaped the direct path of a hurricane, but has felt the effects of some. A 1970 Environmental Science Service Administration (ESSA) document identified two storms affecting Liberty County. On August 31, 1964, Hurricane Cleo produced some side effects caused by heavy rains and winds, but resulted in no casualties, and no extensive damage was reported. Hurricane Dora produced similar effects in September 1964 (ESSA, 1970). 2.4 Flood Protection Measures The Coastal Area Planning and Development Commission (CAPDC) has developed a document titled Areawide Land Use Plan Non-Metropolitan Coastal Area (CAPDC, 1978). Its coverage is Liberty County and seven other counties. It defines flood-prone areas as those inundated by a 1-percent-annualchance flood. The document states that only new development that can sustain periodic flooding or that will not create public burdens should be encouraged to locate in flood-prone areas. Examples given of activities that are well suited for floodplain locations include recreation and agriculture, with necessary incidental structures. A map of strategic development areas in the land use plan (CAPDC, 1978) shows major development concentrated along a band stretching through the cities of Flemington, Hinesville, Allenhurst, and Walthourville (that is, along State Highway 119 and State Highway 38/U.S. Highway 82). Only minor development activity is projected in areas closer to the coast. 8
13 The Zoning ordinance for Liberty County, from March 1975, deals with land subject to flooding. It states that no building or mobile home shall be moved into or constructed in a flood-prone area unless the first floor elevation is one foot above the highest elevation at that location expected to be flooded in a 1-percentannual-chance flood. Subdivision regulations for the City of Hinesville were published in The regulations state that an adequate drainage system (including necessary open ditches pipes, culverts, storm sewers, intersectional drains, drop inlets, bridges, and other necessary appurtenances) shall be installed by the subdivider. The regulations also state that the Hinesville Planning Board shall not approve a subdivision where the soil conditions have proven to not be suitable for the development proposed. Further, no portion of a subdivision shall be approved that is subject to inundation by a 1-percent-annual-chance flood or less, unless such portion of the subdivision is filled or otherwise protected to raise the elevation to at least the 1-percent-annual-chance flood elevation The City of Midway Subdivision Regulations (CAPDC, 1975a), state that no portion of a subdivision shall be approved which is subject to the 1-percentannual-chance flood. The regulations contain standards for flood prone area uses. These indicate that construction of buildings, utilities, and waste disposal systems shall be located and constructed so as to minimize flooding damage. This requires adequate drainage to reduce exposure to flood damage. The regulations have additional standards dealing with fill, structures, and storage of material and equipment. Finally, the regulations require that an adequate drainage system (including necessary open ditches, pipes, culverts, storm sewers, intersectional drains, drop inlets, bridges, and other necessary appurtenances) shall be installed by the subdivider according to plans and specifications approved by the County Health Department (CAPDC, 1975a). Subdivision regulations for the City of Riceboro were published in March The regulations state that no portion of subdivision shall be approved which is subject to inundation by a flood of 1-percent-annual-chance frequency, if it fails to meet certain conditions. These conditions consist of construction standards for flood-prone areas, use of fill, structures (temporary or permanent), and storage of material and equipment (CAPDC, 1975b). 3.0 ENGINEERING METHODS For the flooding sources studied by detailed methods in the community, standard hydrologic and hydraulic study methods were used to determine the flood hazard data required for this study. Flood events of a magnitude that are expected to be equaled or exceeded once on the average during any 10-, 50-, 100-, or 500-year 9
14 period (recurrence interval) have been selected as having special significance for floodplain management and for flood insurance rates. These events, commonly termed the 10-, 50-, 100-, and 500-year floods, have a 10-, 2-, 1-, and 0.2-percent chance, respectively, of being equaled or exceeded during any year. Although the recurrence interval represents the long-term, average period between floods of a specific magnitude, rare floods could occur at short intervals or even within the same year. The risk of experiencing a rare flood increases when periods greater than 1 year are considered. For example, the risk of having a flood that equals or exceeds the 1-percent-annual-chance (100-year) flood in any 50-year period is approximately 40 percent (4 in 10); for any 90-year period, the risk increases to approximately 60 percent (6 in 10). The analyses reported herein reflect flooding potentials based on conditions existing in the community at the time of completion of this study. Maps and flood elevations will be amended periodically to reflect future changes. 3.1 Hydrologic Analyses Hydrologic analyses were carried out to establish peak discharge-frequency relationships for each flooding source studied by detailed methods affecting the community. Pre-Countywide Analysis For all streams studied by detailed methods, Alligator Canal, Cay Creek, Goshen Canal, Mallard Canal, Mill Creek, Peacock Creek, and Riceboro Creek, discharge-frequency relationships for riverine flooding were based on the Regional Analysis as outlined in the USGS publication Open-File Report , titled Flood Frequency Analysis for Small Natural Stream in Georgia (USGS, 1976). This regional analysis is based on statistical computations of discharge records at various sites in Georgia, regressed against basin characteristics. The 0.2-percent-annual-chance discharge values were extrapolated from the lower frequency floods. Peak discharge-drainage area relationships for Liberty County are shown in Table 3. Table 3 - Summary of Discharges Peak Discharges (cubic feet per second) Flooding Source and Location Drainage Area (square miles) 10-Percent- Annual-Chance 2-Percent- Annual-Chance 1-Percent- Annual-Chance 0.2-Percent- Annual- Chance ALLIGATOR CANAL Approximately 1,620 feet ,000 upstream of confluence with Goshen Canal Approximately 1,620 feet upstream of Old Hines Road 10
15 Table 3 - Summary of Discharges (Continued) Peak Discharges (cubic feet per second) Flooding Source and Location Drainage Area (square miles) 10-Percent- Annual-Chance 2-Percent- Annual-Chance 1-Percent- Annual-Chance 0.2-Percent- Annual- Chance CAY CREEK Upstream of the confluence ,190 1,410 1,970 with Peacock Creek Approximately 3,045 feet Highway 84/State Highway 38/East Oglethorpe Highway GOSHEN CANAL Upstream of confluence with ,190 1,410 1,970 Peacock Creek Approximately 5,300 feet ,350 1,600 2,240 upstream of U.S. Highway 84/State Highway 38/East Oglethorpe Highway Just below Old Hines Road ,280 1,520 2,120 MALLARD CANAL Approximately 430 feet upstream of the confluence with Alligator Canal Just below U.S. Highway 84/ State Highway 38/East Oglethorpe Highway MILL CREEK Just above 18 th Street ,204 1,906 2,269 3,150 Approximately 3,925 feet ,550 1,840 2,600 upstream of Fort Stewart Railway Just downstream of the ,330 1,570 2,000 confluence of Mill Creek Tributary No. 2 Just upstream of the ,220 1,440 1,800 confluence of Mill Creek Tributary No. 2 MILL CREEK TRIBTARY NO. 2 Just upstream of the confluence with Mill Creek PEACOCK CREEK At confluence with North ,550 4,080 4,920 7,000 Newport River Downstream of the ,540 4,070 4,900 6,970 confluence of Cay Creek Downstream of the ,330 3,720 4,480 6,300 confluence of Riceboro Creek Upstream of the confluence ,140 3,420 4,110 5,800 of Riceboro Creek At USGS Gage ,650 2,630 3,150 4,400 Downstream of the ,490 2,370 2,830 3,950 confluence of Goshen Canal 11
16 Table 3 - Summary of Discharges (Continued) Peak Discharges (cubic feet per second) Flooding Source and Location Drainage Area (square miles) 10-Percent- Annual-Chance 2-Percent- Annual-Chance 1-Percent- Annual-Chance 0.2-Percent- Annual- Chance PEACOCK CREEK (continued) ,190 1,880 2,240 3,100 Upstream of the confluence of Goshen Canal Approximately 2,150 feet ,020 1,610 1,910 2,700 upstream of the confluence of Goshen Canal Downstream of the ,080 1,270 1,790 confluence of Peacock Creek Tributary No. 1 Upstream of the confluence ,220 of Peacock Creek Tributary No. 1 Approximately 2,980 feet ,040 downstream of U.S. Highway 84/State Highway 38/State Highway 196/Oglethorpe Highway Approximately 905 feet upstream of Joseph Martin Drive PEACOCK CREEK TRIBUTARY NO. 1 Just upstream of the confluence with Peacock Creek RICEBORO CREEK Approximately 210 feet ,060 1,250 1,750 upstream of the confluence with Peacock Creek Approximately 1,220 feet ,150 1,600 upstream of U.S. Highway 17/State Highway 25/ South Coastal Highway Cay Creek, North Newport River, Peacock Creek, and Riceboro Creek are also subject to flooding due to hurricane tides. The frequency of hurricane tides at the open coast (at the mouth of St. Catherines Sound) was computed from statistical analysis of the results of the computer program TTSURGE (FIA, 1978) The resultant tide frequency relationship for the coastal area near the mouth of St. Catherines Sound is summarized in Table 4. Tidal water levels in that area were routed inland by means of the Inland Routing Model (See Section 3.2). 12
17 Table 4 - Summary of Tidal Elevations Elevation (feet*) Flooding Source and Location 10-Percent- Annual-Chance 2-Percent- Annual-Chance 1-Percent- Annual-Chance 0.2-Percent- Annual-Chance Coast of Georgia Mouth of St. Catherines Sound *North American Vertical Datum of 1988 Most other rivers under detailed study are also subject to flooding due to hurricane tides. The determination of inundation caused by passage of a hurricane storm surge was approached by the Joint Probability Method (ESSA, 1970). The storm populations were described by probability distributions of five parameters that influence surge heights. These were 1) central pressure depression (which measure intensity of the storm), 2) radius to maximum winds, 3) forward speed of the storm, 4) shoreline crossing point, and 5) crossing angle. These characteristics were described statistically based on an analysis of observed storms in the vicinity of Liberty County. (U.S. Weather Bureau, 1959; National Weather Service, 1975; National Climatic Center, date unknown; Cry, 1965; and National Weather Service, 1974). A summary of the parameters used for the Liberty County area is presented in Table 5. Table 5 - Parameter Values for Surge Elevation Computations P PP F PF R PR A PA D FN Exiting Storms Parallel Storms Entering Storms Distance storm crossing point from the City of Savannah in Nautical Miles 2 Distance from shore in Nautical Miles P = Central Pressure (millibars) PP = Probability of storm with P Value F = Forward velocity of storm (KTS) 13
18 PF = Probability of storm with F Value R = Radius to maximum winds (NM) PR = Probability of storm with R Value A = Direction of storm measured from coast (North) (degrees) PA = Probability of storm with A Value D = Distance from shore (NM) FN = Frequency of storm occurrence/year The determination of maximum wave crest elevations associated with the 10- and 1-percent-annual-chance events was approached by the method recommended by the National Academy of Sciences (National Academy of Sciences, 1977). Further details are included in Section 3.3 of this study. This Countywide FIS Report For the approximate study streams listed in Table 2, peak flows were determined using the rural regression equations for Georgia (Stamey and Hess, 1993). 3.2 Hydraulic Analyses Analyses of the hydraulic characteristics of flooding from the sources studied were carried out to provide estimates of the elevations of floods of the selected recurrence intervals. Users should be aware that flood elevations shown on the FIRM represent rounded whole-foot elevations and may not exactly reflect the elevations shown on the Flood Profiles or in the Floodway Data Table in the FIS report. Flood elevations shown on the FIRM are primarily intended for flood insurance rating purposes. For construction and/or floodplain management purposes, users are cautioned to use the flood elevation data presented in this FIS report in conjunction with the data shown on the FIRM. Users of the FIRM should also be aware that coastal flood elevations are provided in the Transect Data table in this report (Table 7). If the elevation on the FRIM is higher than the elevation shown in the table, a wave height, wave runup and/or wave setup component likely exists, in which case, the higher elevation should be used for construction and/or floodplain management purposes. Precountywide FIS Reports Cross sections for the backwater analyses were obtained from aerial photographs flown in March 1979, at a scale of 1:4,800 (Abrams Aerial Survey Corporation, 1979). The below-water sections were obtained by field measurement. All bridges, dams, and culverts were field checked to obtain elevation data and structural geometry. 14
19 Cross sections were field surveyed in the restudied areas of Mill Creek and Mill Creek Tributary No. 2 to assess the impact of channel modifications and realignment on flood elevations and floodway boundaries. For areas of riverine flooding, water surface elevations (WSELs) of floods of the selected recurrence intervals were computed using the USACE s Hydrologic Engineering Center (HEC) HEC-2 computer program (HEC, 1984). Flood profiles were drawn (where required) showing computed WSELs for floods of the selected recurrence intervals. Starting WSELs were calculated using the slope-area method, except for Riceboro Creek. The starting WSEL for Riceboro Creek was the estimate for a 1-percent-annual-chance tide. Locations of selected cross sections used in the hydraulic analyses are shown on the Flood Profiles (Exhibit 1). For stream segments for which a floodway was computed (Section 4.2), selected cross section locations are also shown on the FIRM (Exhibit 2). Channel roughness factors (Mannings n ) used in the hydraulic computations were estimated based on field inspection and calibrated using available data from adjacent studies. The Manning s n values for all detailed studied streams are listed in Table 6. Table 6 - Manning's "n" Values Stream Channel n Overbank n Alligator Canal Cay Creek Goshen Canal Mallard Canal Mill Creek Mill Creek Tributary No Peacock Creek Peacock Creek Tributary No Riceboro Creek The hydraulic analyses for this study were based on unobstructed flow. The flood elevations shown on the Flood Profiles (Exhibit 1) are thus considered valid only if hydraulic structures remain unobstructed, operate properly, and do not fail. The profile baselines depicted on the FIRM represent the hydraulic modeling baselines that match the flood profiles on this FIS report. As a result of improved topographic data, the profile baseline in some cases, may deviate significantly from the channel centerline or appear outside the Special Flood Hazard Area. Frequencies of hurricane tides at the open coast were computed from a statistical analysis of the results of the computer program TTSURGE (FIA, 1978). This model was used to simulate the coastal surge generated by any chosen storm 15
20 (that is, any combination of the five storm parameters defined previously). Performing such simulations for a large number of storms, each of known total probability, permits the establishment of the frequency distribution of surge height as a function of coastline location. These distributions incorporate the large scale surge behavior but do not include an analysis of the added effects associated with much finer scale wave phenomena such as wave heights, setup, or runup. The astronomic tide for the region is then statistically combined with the computed storm surge to yield recurrence intervals of total water level (National Academy of Sciences, 1977). The numerical grid used in the TTSURGE program was 416 nautical miles by 165 nautical miles, with a mesh spacing of 8 nautical miles along the y-axis (parallel to the coast) and 5 nautical miles along the x-axis (perpendicular to the coast). Routing of hurricane tides inland through Sapelo Sound/South Newport River, St. Catherines Sound/North Newport River/Peacock Creek, Medway/Laurel River/Jerico River, and Riceboro Creek was conducted using the Inland Routing Model (Harleman, 1976). The Inland Routing Model is an adaption of an existing model to the specific conditions in the Georgia coastal area. The model has been calibrated against recorded water elevations produced by two hurricanes making landfall near Savannah, Georgia. The computed stillwater flood elevations for Liberty County are tabulated in Table 7. This Countywide FIS Report For the approximate study streams listed in Table 2, cross section data was obtained from two foot contours derived from a LiDAR generated digital terrain model (Laser Mapping Specialists Inc., 2006). Roads were modeled as weirs, using elevations from the topography. The studied streams listed in Table 2 were modeled using HEC-RAS Version (HEC, 2004). 3.3 Wave Height Analysis The methodology for analyzing the effects of wave heights associated with coastal storm surge flooding is described in the National Academy of Sciences report (National Academy of Sciences, 1997). This method is based on the following major concepts. First, depth-limited waves in shallow water reach a maximum breaking height that is equal to 0.78 times the stillwater depth. The wave crest elevation is 70 percent of the total wave height plus the stillwater elevation. The second major concept is that wave may be diminished due to the presence of obstructions such as sand dunes, dikes and seawalls, buildings, and vegetation. The amount of energy dissipation is a function of the physical characteristics of the obstruction. The third major concept is that wave height 16
21 FLOODING SOURCE TRANSECTS 10-PERCENT- ANNUAL-CHANCE STILLWATER ELEVATION (FEET NAVD) 2-PERCENT- ANNUAL-CHANCE 1-PERCENT- ANNUAL-CHANCE 0.2-PERCENT- ANNUAL-CHANCE ZONE 1 BASE FLOOD ELEVATION (FEET NAVD) 2 ATLANTIC OCEAN/ VE SAPELO SOUND AE VE AE VE AE VE AE VE AE VE AE VE AE VE AE Includes the effects of wave action, where applicable 2 Due to map scale limitations, BFEs shown on the FIRM may represent average elevation for the zone depicted TABLE 7 FEDERAL EMERGENCY MANAGEMENT AGENCY LIBERTY COUNTY, GA AND INCORPORATED AREAS TRANSECT DATA ATLANTIC OCEAN
22 FLOODING SOURCE TRANSECTS 10-PERCENT- ANNUAL-CHANCE STILLWATER ELEVATION (FEET NAVD) 2-PERCENT- ANNUAL-CHANCE 1-PERCENT- ANNUAL-CHANCE 0.2-PERCENT- ANNUAL-CHANCE ZONE 1 BASE FLOOD ELEVATION (FEET NAVD) 2 ATLANTIC OCEAN/ VE SAPELO SOUND AE VE AE VE AE VE AE VE VE AE VE AE Includes the effects of wave action, where applicable 2 Due to map scale limitations, BFEs shown on the FIRM may represent average elevation for the zone depicted TABLE 7 FEDERAL EMERGENCY MANAGEMENT AGENCY LIBERTY COUNTY, GA AND INCORPORATED AREAS TRANSECT DATA ATLANTIC OCEAN
23 FLOODING SOURCE TRANSECTS 10-PERCENT- ANNUAL-CHANCE STILLWATER ELEVATION (FEET NAVD) 2-PERCENT- ANNUAL-CHANCE 1-PERCENT- ANNUAL-CHANCE 0.2-PERCENT- ANNUAL-CHANCE ZONE 1 BASE FLOOD ELEVATION (FEET NAVD) 2 ATLANTIC OCEAN/ VE ST. CATHERINE * * 13.1 * AE SOUND * * 12.1 * AE * * 10.1 * AE ST. CATHERINE N/A AE 10 SOUND/RICEBORO CREEK ST. CATHERINE N/A AE SOUND/NEWPORT RIVER ST. CATHERINE SOUND/CAY CREEK N/A AE 7 1 Includes the effects of wave action, where applicable 2 Due to map scale limitations, BFEs shown on the FIRM may represent average elevation for the zone depicted *Data not available TABLE 7 FEDERAL EMERGENCY MANAGEMENT AGENCY LIBERTY COUNTY, GA AND INCORPORATED AREAS TRANSECT DATA ATLANTIC OCEAN
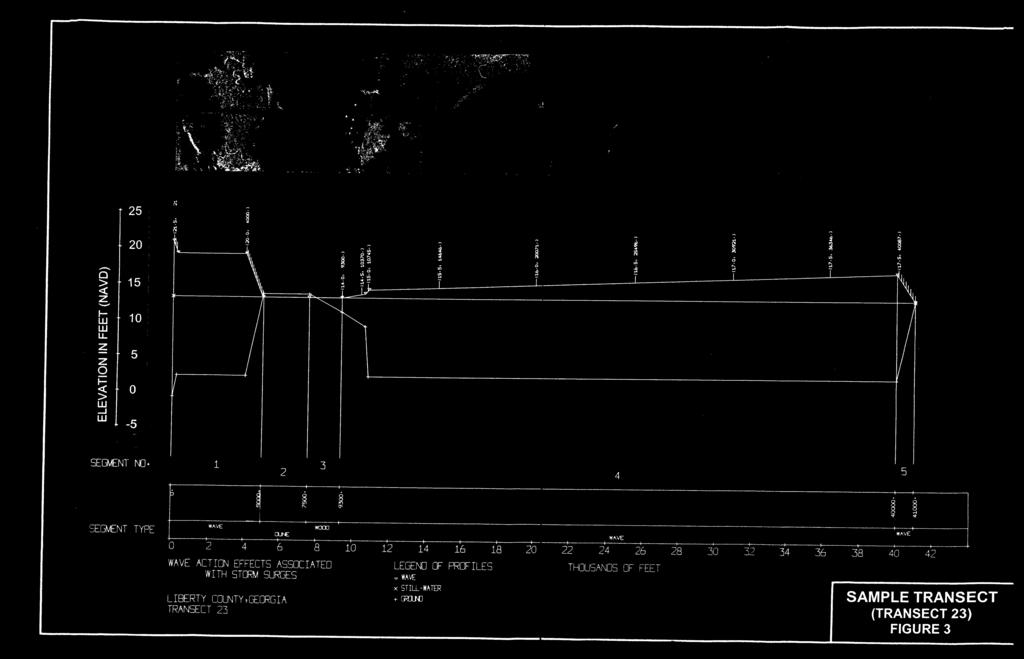
24 can be regenerated in open fetch areas due to transfer of wind energy to the water. This added energy is related to fetch length and depth. Wave heights were computed along transects (cross section lines) that were located along the coastal areas, as illustrated in Figure 1, in accordance with the Users Manual for Wave Height Analysis (FIA, 1981). Transects were located with consideration given to the physical and cultural characteristics of the land so that they would closely represent conditions in their locality. Transects were spaced close together in areas of complex topography and dense development. In areas having more uniform characteristics, they were spaced at larger intervals. It was also necessary to locate transects in areas where unique flooding existed and in areas where computed wave heights varied significantly between adjacent transects. The transects were continued inland until the wave was dissipated or until flooding from another source with equal or greater elevation was reached. Along each transect, wave heights and elevations were computed considering the combined effects of changes in ground elevation, vegetation, and physical features. The stillwater elevations for the 1-percent-annual-chance flood were used as starting elevations for these computations. Wave heights were calculated to the nearest 0.1 foot, and wave elevations were determined at whole-foot increments along transects. Areas with a wave component 3-feet or greater were designated as velocity zones. Other areas subject to wave action were designated as A Zones with base flood elevations adjusted to include wave crest elevations. Figure 2 is a profile for a hypothetical transect showing the effects of energy dissipation on a wave as it moves inland. This figure shows the wave elevations being diminished by obstructions, such as buildings, vegetation, and rising ground elevations and being increased by open, unobstructed wind fetches. Actual wave conditions in Liberty County may not necessarily include all the situations illustrated in Figure 2. Figure 3 is a sample transect reflecting actual conditions in Liberty County. Data for the model grid systems and for the wave height calculations were obtained from USGS quadrangle sheets (USGS, various dates) and NOAA nautical charts. The results of this study are considered accurate until local topography, vegetation, or cultural development undergo any minor changes. 20
25
26 Figure 2 - Transect Schematic 3.4 Vertical Datum All FIS reports and FIRMs are referenced to a specific vertical datum. The vertical datum provides a starting point against which flood, ground, and structure elevations can be referenced and compared. Until recently, the standard vertical datum in use for newly created or revised FIS reports and FIRMs was NGVD. With the finalization of NAVD, many FIS reports and FIRMs are being prepared using NAVD as the referenced vertical datum. All flood elevations shown in this FIS report and on the FIRM are referenced to NAVD. Structure and ground elevations in the community must, therefore, be referenced to NAVD. It is important to note that adjacent communities may be referenced to NGVD. This may result in differences in Base Flood Elevations (BFEs) across the corporate limits between the communities. The average conversion factor that was used to convert the data in this FIS report to NAVD was calculated using the National Geodetic Survey s VERTCON online utility (NGS, 2007). The data points used to determine the conversion are listed in Table 8. 22

27
28 Table 8 Vertical Datum Conversion Conversion from Quad Name Corner Latitude Longitude NGVD to NAVD Glissons Millpond SE Willie SE Letford SW SE Glennville NE SE Taylors Creek SE Trinity SE Limerick NW SE Walthourville SE Hinesville SE Dorchester SE Limerick SE SE Riceboro SE Seabrook SE Saint Catherines Sound SE Average: For additional information regarding conversion between NGVD and NAVD, visit the National Geodetic Survey website at or contact the National Geodetic Survey at the following address: Vertical Network Branch, N/CG13 National Geodetic Survey, NOAA Silver Spring Metro Center East-West Highway Silver Spring, Maryland (301) Temporary vertical monuments are often established during the preparation of a flood hazard analysis for the purpose of establishing local vertical control. Although these monuments are not shown on the FIRM, they may be found in the Technical Support Data Notebook associated with the FIS report and FIRM for this community. Interested individuals may contact FEMA to access these data. To obtain current elevation, description, and/or location information for benchmarks shown on this map, please contact the Information Services Branch of the NGS at (301) , or visit their website at 24
29 4.0 FLOODPLAIN MANAGEMENT APPLICATIONS The NFIP encourages State and local governments to adopt sound floodplain management programs. Therefore, each FIS provides 1-percent-annual-chance (100- year) flood elevations and delineations of the 1- and 0.2-percent-annual-chance (500- year) floodplain boundaries and 1-percent-annual-chance floodway to assist communities in developing floodplain management measures. This information is presented on the FIRM and in many components of the FIS report, including Flood Profiles, Floodway Data Table, and Summary of Stillwater Elevations Table. Users should reference the data presented in the FIS report as well as additional information that may be available at the local map repository before making flood elevation and/or floodplain boundary determinations. 4.1 Floodplain Boundaries To provide a national standard without regional discrimination, the 1-percentannual-chance flood has been adopted by FEMA as the base flood for floodplain management purposes. The 0.2-percent-annual-chance flood is employed to indicate additional areas of flood risk in the community. For each stream studied by detailed methods, except for Riceboro Creek, the 1- and 0.2-percent-annualchance floodplain boundaries have been delineated using the flood elevations determined at each cross section. Between cross sections, the boundaries were interpolated using two foot contours derived from LiDAR data (Laser Mapping Specialists Inc., 2006). For Riceboro Creek, the 1- and 0.2-percent-annualchance floodplain boundaries have been delineated using topographic maps at a scale of 1:4,800 with a contour interval of 2 feet (Abrams Aerial Survey Corporation, 1979). Note that the flooding for Riceboro Creek is controlled by hurricane tides from the coast of Georgia. For streams restudied by approximate methods presented in Table 2, and for redelineated areas studied by approximate methods, the 1-percent-annual-chance floodplain boundaries were delineated using two foot contours derived from LiDAR data (Laser Mapping Specialists Inc., 2006). For areas studied by approximate methods comprised of swamplands, the 1- percent-annual-chance floodplain boundaries were delineated using topographic maps at a scale of 1:4,800 and 1:9,600 with a contour interval of 2 feet (Abrams Aerial Survey Corporation, 1979). In areas where photogrammetric topographic maps were not available, USGS quadrangle maps were used (USGS, various dates). For the coastal zones, floodplain boundaries were delineated using the flood elevations determined at transects. Between transects, the 1-percent-annualchance floodplain boundaries were interpolated using topographic maps at a scale of 1:4,800 and 1:9,600 with a contour interval of 2 feet (Abrams Aerial 25
30 Survey Corporation, 1979). In areas where photogrammetric topographic maps were not available, USGS quadrangle maps were used (USGS, various dates). The 1- and 0.2-percent-annual-chance floodplain boundaries are shown on the FIRM (Exhibit 2). On this map, the 1-percent-annual-chance floodplain boundary corresponds to the boundary of the areas of special flood hazards (Zones A, AE, and VE), and the 0.2-percent-annual-chance floodplain boundary corresponds to the boundary of areas of moderate flood hazards. In cases where the 1- and 0.2-percent-annual-chance floodplain boundaries are close together, only the 1-percent-annual-chance floodplain boundary has been shown. Small areas within the floodplain boundaries may lie above the flood elevations but cannot be shown due to limitations of the map scale and/or lack of detailed topographic data. For the streams studied by approximate methods, only the 1-percent-annualchance floodplain boundary is shown on the FIRM (Exhibit 2). 4.2 Floodways Encroachment on floodplains, such as structures and fill, reduces flood-carrying capacity, increases flood heights and velocities, and increases flood hazards in areas beyond the encroachment itself. One aspect of floodplain management involves balancing the economic gain from floodplain development against the resulting increase in flood hazard. For purposes of the NFIP, a floodway is used as a tool to assist local communities in this aspect of floodplain management. Under this concept, the area of the 1-percent-annual-chance floodplain is divided into a floodway and a floodway fringe. The floodway is the channel of a stream, plus any adjacent floodplain areas, that must be kept free of encroachment so that the 1-percent-annual-chance flood can be carried without substantial increases in flood heights. Minimum Federal standards limit such increases to 1 foot, provided that hazardous velocities are not produced. The floodways in this study are presented to local agencies as minimum standards that can be adopted directly or that can be used as a basis for additional floodway studies. The floodways presented in this FIS report and on the FIRM were computed for certain stream segments on the basis of equal-conveyance reduction from each side of the floodplain. Floodway widths were computed at cross sections. Between cross sections, the floodway boundaries were interpolated. The results of the floodway computations have been tabulated for selected cross sections (Table 9). In cases where the floodway and 1-percent-annual-chance floodplain boundaries are either close together or collinear, only the floodway boundary has been shown. The area between the floodway and 1-percent-annual-chance floodplain boundaries is termed the floodway fringe. The floodway fringe encompasses the portion of the floodplain that could be completely obstructed without increasing the WSEL of the 26
CAMDEN COUNTY, GEORGIA
 CAMDEN COUNTY, GEORGIA AND INCORPORATED AREAS COMMUNITY NAME COMMUNITY NUMBER CAMDEN COUNTY 130262 (UNINCORPORATED AREAS) KINGSLAND, CITY OF 130238 ST. MARYS, CITY OF 130027 WOODBINE, CITY OF 130241 CAMDEN
McINTOSH COUNTY, GEORGIA
 McINTOSH COUNTY, GEORGIA AND INCORPORATED AREAS Community Name Community Number Darien, City of 130131 McIntosh County 130130 (Unincorporated Areas) Preliminary: McIntosh County FLOOD INSURANCE STUDY NUMBER
LOMR SUBMITTAL LOWER NEHALEM RIVER TILLAMOOK COUNTY, OREGON
 LOMR SUBMITTAL LOWER NEHALEM RIVER TILLAMOOK COUNTY, OREGON Prepared for: TILLAMOOK COUNTY DEPARTMENT OF COMMUNITY DEVELOPMENT 1510-B THIRD STREET TILLAMOOK, OR 97141 Prepared by: 10300 SW GREENBURG ROAD,
LOMR SUBMITTAL LOWER NESTUCCA RIVER TILLAMOOK COUNTY, OREGON
 LOMR SUBMITTAL LOWER NESTUCCA RIVER TILLAMOOK COUNTY, OREGON Prepared for: TILLAMOOK COUNTY DEPARTMENT OF COMMUNITY DEVELOPMENT 1510-B THIRD STREET TILLAMOOK, OR 97141 Prepared by: 10300 SW GREENBURG ROAD,
ARMSTRONG COUNTY, PA
 ARMSTRONG COUNTY, PA Revised Preliminary DFIRM Mapping March 31, 2013 Kevin Donnelly, P.E., CFM GG3, Greenhorne & O Mara, Inc. Presentation Agenda Armstrong County DFIRM Overview - June 25, 2010 DFIRM
UPPER COSUMNES RIVER FLOOD MAPPING
 UPPER COSUMNES RIVER FLOOD MAPPING DRAFT BASIC DATA NARRATIVE FLOOD INSURANCE STUDY SACRAMENTO COUTY, CALIFORNIA Community No. 060262 November 2008 Prepared By: CIVIL ENGINEERING SOLUTIONS, INC. 1325 Howe
Appendix E Guidance for Shallow Flooding Analyses and Mapping
 Appendix E Guidance for Shallow Flooding Analyses and Mapping E.1 Introduction Different types of shallow flooding commonly occur throughout the United States. Types of flows that result in shallow flooding
GREENE COUNTY, PA. Revised Preliminary DFIRM Mapping FEMA. Kevin Donnelly, P.E., CFM GG3, Greenhorne & O Mara, Inc. April 10, 2013
 GREENE COUNTY, PA Revised Preliminary DFIRM Mapping April 10, 2013 Kevin Donnelly, P.E., CFM GG3, Greenhorne & O Mara, Inc. Presentation Agenda Greene County DFIRM Overview September 30, 2010 DFIRM Countywide
MASON COUNTY, MICHIGAN
 MASON COUNTY, MICHIGAN (ALL JURISDICTIONS) MASON COUNTY Community Community Community Community Name Number Name Number AMBER, TOWNSHIP OF 261271 LOGAN, TOWNSHIP OF 260811 BRANCH, TOWNSHIP OF 261272 LUDINGTON,
CLAY COUNTY, MINNESOTA AND INCORPORATED AREAS
 CLAY COUNTY, MINNESOTA AND INCORPORATED AREAS Community Name Community Number BARNESVILLE, CITY OF 270078 CLAY COUNTY 275235 (UNINCORPORATED AREAS) *COMSTOCK, CITY OF 270079 DILWORTH, CITY OF 270080 *FELTON,
Dealing with Zone A Flood Zones. Topics of Discussion. What is a Zone A Floodplain?
 Dealing with Zone A Flood Zones Topics of Discussion Overview of Zone A Floodplains Permitting Development in Zone A Floodplains Estimating Flood Elevations in Zone A Flood Insurance Implications Letters
YANKTON COUNTY, SOUTH DAKOTA
 YANKTON COUNTY, SOUTH DAKOTA AND INCORPORATED AREAS Community Name Community Number GAYVILLE, TOWN OF* 460205 IRENE, TOWN OF 460120 LESTERVILLE, TOWN OF* 460206 MISSION HILL, TOWN OF 460091 UTICA, TOWN
YELLOWSTONE RIVER FLOOD STUDY REPORT TEXT
 YELLOWSTONE RIVER FLOOD STUDY REPORT TEXT TECHNICAL REPORT Prepared for: City of Livingston 411 East Callender Livingston, MT 59047 Prepared by: Clear Creek Hydrology, Inc. 1627 West Main Street, #294
TOWN OF FORT KENT, MAINE AROOSTOOK COUNTY
 TOWN OF FORT KENT, MAINE AROOSTOOK COUNTY PRELIMINARY: 01/07/2013 Federal Emergency Management Agency COMMUNITY NUMBER 230019V000A NOTICE TO FLOOD INSURANCE STUDY USERS Communities participating in the
Location: Jacksonville, FL December 11, 2012
 Technical Update Meeting Northeast Florida Surge Study Location: Jacksonville, FL December 11, 2012 Agenda 2:00 2:15 Welcome/Introductions Tucker Mahoney, FEMA Region IV Michael DelCharco, BakerAECOM 2:15
Section 4: Model Development and Application
 Section 4: Model Development and Application The hydrologic model for the Wissahickon Act 167 study was built using GIS layers of land use, hydrologic soil groups, terrain and orthophotography. Within
Coastal Flood Risk Study Project for East Coast Central Florida Study Area
 Coastal Flood Risk Study Project for East Coast Central Florida Study Area St Lucie County, Florida Flood Risk Review Meeting March 28, 2017 Introductions Risk MAP Project Team FEMA Region IV BakerAECOM,
VOLUME 3 OF 3 FAIRFIELD COUNTY, OHIO AND INCORPORATED AREAS COMMUNITY NAME NUMBER COMMUNITY NAME NUMBER
 VOLUME 3 OF 3 FAIRFIELD COUNTY, OHIO AND INCORPORATED AREAS COMMUNITY NAME NUMBER COMMUNITY NAME NUMBER AMANDA, VILLAGE OF * 390688 PICKERINGTON, CITY OF 390162 BALTIMORE, VILLAGE OF 390159 PLEASANTVILLE,
PLYMOUTH COUNTY, MASSACHUSETTS (ALL JURISDICTIONS)
") PLYMOUTH COUNTY, MASSACHUSETTS Volume 2 of 3 COMMUNITY NAME COMMUNITY NUMBER ABINGTON, TOWN OF 250259 BRIDGEWATER, TOWN OF 250260 BROCKTON, CITY OF 25026 CARVER, TOWN OF 250262 DUXBURY, TOWN OF 250263
PLYMOUTH COUNTY, MASSACHUSETTS Volume 2 of 3 COMMUNITY NAME COMMUNITY NUMBER ABINGTON, TOWN OF 250259 BRIDGEWATER, TOWN OF 250260 BROCKTON, CITY OF 25026 CARVER, TOWN OF 250262 DUXBURY, TOWN OF 250263
PENNSYLVANIA DEPARTMENT OF TRANSPORTATION ENGINEERING DISTRICT 3-0
 PENNSYLVANIA DEPARTMENT OF TRANSPORTATION ENGINEERING DISTRICT 3-0 LYCOMING COUNTY S.R.15, SECTION C41 FINAL HYDROLOGIC AND HYDRAULIC REPORT STEAM VALLEY RUN STREAM RELOCATION DATE: June, 2006 REVISED:
SOMERSET COUNTY, MARYLAND
 SOMERSET COUNTY, MARYLAND AND INCORPORATED AREAS COMMUNITY NAME CID NUMBER CRISFIELD, CITY OF 240062 PRINCESS ANNE, TOWN OF 240063 SOMERSET COUNTY (UNINCORPORATED AREAS) 240061 Somerset County PRELIMINARY:
New Jersey Department of Transportation Extreme Weather Asset Management Pilot Study
 New Jersey Department of Transportation Extreme Weather Asset Management Pilot Study Overview Prepared for: June 26, 2018 Introduction Overview of Pilot Study New Jersey s Climate New Jersey s Transportation
MORGAN COUNTY COLORADO, AND INCORPORATED AREAS
 MORGAN COUNTY COLORADO, AND INCORPORATED AREAS VOLUME 1 OF 1 Morgan County COMMUNITY NAME COMMUNNITY NUMBER BRUSH, CITY OF 080130 FORT MORGAN, CITY OF 080131 LOG LANE VILLAGE, TOWN OF* 080217 MORGAN COUNTY
Ground Water Protection Council 2017 Annual Forum Boston, Massachusetts. Ben Binder (303)
") Ground Water Protection Council 2017 Annual Forum Boston, Massachusetts Protecting Groundwater Sources from Flood Borne Contamination Ben Binder (303) 860-0600 Digital Design Group, Inc. The Problem Houston
Ground Water Protection Council 2017 Annual Forum Boston, Massachusetts Protecting Groundwater Sources from Flood Borne Contamination Ben Binder (303) 860-0600 Digital Design Group, Inc. The Problem Houston
2016 NC Coastal Local Governments Annual Meeting
 6 NC Coastal Local Governments Annual Meeting NCFMP Coastal Map Maintenance Flood Study Updates and Changes April, 6 Tom Langan, PE, CFM Engineering Supervisor NCEM-Risk Management - Floodplain Mapping
ASFPM - Rapid Floodplain Mapping
 ASFPM - Nicole Cominoli Hydraulic Engineer USACE - Omaha District mary.n.cominoli@usace.army.mil June 3, 2015 US Army Corps of Engineers Mitigation = Risk Informed Decisions 2 The National Flood Insurance
LEVY COUNTY, FLORIDA AND INCORPORATED AREAS
 LEVY COUNTY, FLORIDA AND INCORPORATED AREAS COMMUNITY NAME COMMUNITY NUMBER BRONSON, TOWN OF 120582 CEDAR KEY, CITY OF 120373 CHIEFLAND, CITY OF 120392 INGLIS, TOWN OF 120586 LEVY COUNTY 120145 (UNINCORPORATED
LOCATED IN INDIAN RIVER COUNTY PREPARED FOR S.J.R.W.M.D. AND F.W.C.D. DECEMBER, 2003 Updated 2007 Updated May 2014 PREPARED BY
 FELLSMERE WATER CONTROL DISTRICT EAST MASTER DRAINAGE PLAN AND STORMWATER HYDROLOGIC ANALYSIS OF THE GRAVITY DRAINAGE SYSTEM LOCATED BETWEEN THE EAST BOUNDARY, LATERAL U, THE MAIN CANAL, AND DITCH 24 LOCATED
PRINCE GEORGE COUNTY, VIRGINIA AND INCORPORATED AREAS
 PRINCE GEORGE COUNTY, VIRGINIA AND INCORPORATED AREAS COMMUNITY NAME COMMUNITY NUMBER PRINCE GEORGE COUNTY (UNINCORPORATED AREAS) 510204 Prince George County Federal Emergency Management Agency FLOOD INSURANCE
Issue 44: Phase II & III H&H Issues Date: 07/03/2006 Page 1
 Background Phase I of the NCFMP studies have primarily focused on the coastal plain and sandhills physiographic regions in of the State. Phase II and III study areas will focus on the piedmont, foothills,
3.11 Floodplains Existing Conditions
 Other stormwater control practices may be needed to mitigate water quality impacts. In addition to detention facilities, other practices such as vegetated basins/buffers, infiltration basins, and bioswales
JOURNAL OF ENVIRONMENTAL HYDROLOGY The Electronic Journal of the International Association for Environmental Hydrology VOLUME
 JOURNAL OF ENVIRONMENTAL HYDROLOGY The Electronic Journal of the International Association for Environmental Hydrology VOLUME 18 2010 REDUCED CHANNEL CONVEYANCE ON THE WICHITA RIVER AT WICHITA FALLS, TEXAS,
Pequabuck River Flooding Study and Flood Mitigation Plan The City of Bristol and Towns of Plainville and Plymouth, CT
 Pequabuck River Flooding Study and Flood Mitigation Plan The City of Bristol and Towns of Plainville and Plymouth, CT Raymond Rogozinski and Maged Aboelata The City of Bristol and Towns of Plainville and
Miami-Dade County Technical Update Meeting South Florida Coastal Study. May 11, 2016
 Miami-Dade County Technical Update Meeting South Florida Coastal Study May 11, 2016 Welcome and Introductions FEMA Region IV Christina Lindemer Technical Lead Production and Technical Services (PTS) Contractor
Ed Curtis, PE, CFM, FEMA Region IX and Darryl Hatheway, CFM, AECOM ASFPM 2016, Grand Rapids, MI
 Methodology to Determine Process-Based Total Water Level Profiles in Areas Dominated by Wave Runup Ed Curtis, PE, CFM, FEMA Region IX and Darryl Hatheway, CFM, AECOM ASFPM 2016, Grand Rapids, MI Thurs.
Base Level Engineering FEMA Region 6
 Base Level Engineering Over the past five years, has been evaluating its investment approach and data preparation work flow to establish an efficient and effective change in operation, generating an approach
Coastal Flood Risk Study Project for Northeast Florida Study Area
 Coastal Flood Risk Study Project for Northeast Florida Study Area Duval County, Florida Flood Risk Review Meeting September 22, 2015 Introductions Risk MAP Project Team FEMA Region IV BakerAECOM, FEMA
Chapter 5 CALIBRATION AND VERIFICATION
 Chapter 5 CALIBRATION AND VERIFICATION This chapter contains the calibration procedure and data used for the LSC existing conditions model. The goal of the calibration effort was to develop a hydraulic
USGS Flood Inundation Mapping of the Suncook River in Chichester, Epsom, Pembroke and Allenstown, New Hampshire
 USGS Flood Inundation Mapping of the Suncook River in Chichester, Epsom, Pembroke and Allenstown, New Hampshire NH Water & Watershed Conference Robert Flynn, USGS NH-VT Water Science Center March 23, 2012
CARROLL COUNTY, NEW HAMPSHIRE
 VOLUME 1 OF 2 CARROLL COUNTY, NEW HAMPSHIRE Carroll County Community Community Community Community Name Number Name Number ALBANY, TOWN OF 330174 JACKSON, TOWN OF 330014 BARTLETT, TOWN OF 330010 MADISON,
COASTAL FLOODING IMPACT REPORT (100-YEAR RETURN PERIOD EVENT) CORDECO DISCOVERY BAY RESORT & MARINA BO. ESPINAL, AGUADA, P.R.
 CORDECO DISCOVERY BAY RESORT & MARINA BO. ESPINAL, AGUADA, P.R.") COASTAL FLOODING IMPACT REPORT (100-YEAR RETURN PERIOD EVENT) CORDECO DISCOVERY BAY RESORT & MARINA BO. ESPINAL, AGUADA, P.R. submitted to CORDECO NORTHWEST CORP. 2305 LAUREL ST. SAN JUAN, P.R. 00913 by
COASTAL FLOODING IMPACT REPORT (100-YEAR RETURN PERIOD EVENT) CORDECO DISCOVERY BAY RESORT & MARINA BO. ESPINAL, AGUADA, P.R. submitted to CORDECO NORTHWEST CORP. 2305 LAUREL ST. SAN JUAN, P.R. 00913 by
Storm Induced Coastal Erosion for Flood Insurance Studies and Forecasting Coastal Flood Damage Impacts: Erosion, Runup & Overtopping
 Storm Induced Coastal Erosion for Flood Insurance Studies and Forecasting Coastal Flood Damage Impacts: Erosion, Runup & Overtopping Jeff Gangai- Dewberry Tucker Mahoney FEMA HQ Introduction Background
Storm Surge Analysis Update Meeting Cross City, Florida June 17, 2014
 Big Bend Coastal Storm Surge Study Storm Surge Analysis Update Meeting Cross City, Florida June 17, 2014 Introductions Risk MAP Project Team FEMA Region IV Florida Division of Emergency Management (FDEM)
Final Results and Outreach Lessons Learned
 FEMA REGION III COASTAL HAZARD STUDY Final Results and Outreach Lessons Learned June 4, 2014 Mari Radford Christine Worley Robin Danforth David Bollinger FEMA Region III RAMPP FEMA Region III FEMA Region
OKALOOSA COUNTY, FLORIDA AND INCORPORATED AREAS
 VOLUME 1 OF 1 OKALOOSA COUNTY, FLORIDA AND INCORPORATED AREAS COMMUNITY NAME CINCO BAYOU, TOWN OF 120596 CRESTVIEW, CITY OF 120597 DESTIN, CITY OF 125158 FORT WALTON BEACH, CITY OF 120174 LAUREL HILL,
Appendix C Fluvial Flood Hazards
 Appendix C Fluvial Flood Hazards Sea Level Rise Vulnerability Assessment and Adaptation Project March 2019 Contents Contents... i Figures... i Tables... i Definitions, Acronyms, & Abbreviations... ii
SANDUSKY COUNTY, OHIO (AND INCORPORATED AREAS)
") SANDUSKY COUNTY, OHIO (AND INCORPORATED AREAS) COMMUNITY NAME COMMUNITY NUMBER BURGOON, VILLAGE OF 390488 CLYDE, CITY OF 390489 FREMONT, CITY OF 390490 GIBSONBURG, VILLAGE OF 390491 GREEN SPRINGS, VILLAGE
SANDUSKY COUNTY, OHIO (AND INCORPORATED AREAS) COMMUNITY NAME COMMUNITY NUMBER BURGOON, VILLAGE OF 390488 CLYDE, CITY OF 390489 FREMONT, CITY OF 390490 GIBSONBURG, VILLAGE OF 390491 GREEN SPRINGS, VILLAGE
FLOOD INSURANCE STUDY
 FLOOD INSURANCE STUDY CHARLES CITY COUNTY, VIRGINIA AND INCORPORATED AREAS COMMUNITY NAME COMMUNITY NUMBER CHARLES CITY COUNTY (UNINCORPORATED AREAS) 510198 Charles City County REVISED DATE Preliminary
FEMA REGION III COASTAL HAZARD STUDY
 FEMA REGION III COASTAL HAZARD STUDY Impacts and Rollout June 11, 2013 Robin Danforth, FEMA Region III David Bollinger, FEMA Region III Jeff Gangai, RAMPP Christine Worley, RAMPP 1 Today s Discussion Overview
L OWER N OOKSACK R IVER P ROJECT: A LTERNATIVES A NALYSIS A PPENDIX A: H YDRAULIC M ODELING. PREPARED BY: LandC, etc, LLC
 L OWER N OOKSACK R IVER P ROJECT: A LTERNATIVES A NALYSIS A PPENDIX A: H YDRAULIC M ODELING PREPARED BY: LandC, etc, LLC TABLE OF CONTENTS 1 Introduction... 1 2 Methods... 1 2.1 Hydraulic Model... 1 2.2
SAN FRANCISCO DISTRICT INFORMATION REQUESTED FOR VERIFICATION OF CORPS JURISDICTION
 DEPARTMENT OF THE ARMY SAN FRANCISCO DISTRICT, U.S. ARMY CORPS OF ENGINEERS 1455 MARKET STREET SAN FRANCISCO, CALIFORNIA 94103-1398 SAN FRANCISCO DISTRICT INFORMATION REQUESTED FOR VERIFICATION OF CORPS
Out with the Old, In with the New: Implementing the Results of the Iowa Rapid Floodplain Modeling Project
 Out with the Old, In with the New: Implementing the Results of the Iowa Rapid Floodplain Modeling Project Traci Tylski, E.I., CFM Hydraulics Engineer USACE - Omaha District Traci.M.Tylski@USACE.army.mil
Chapter 7 Mudflow Analysis
 Chapter 7 Mudflow Analysis 7.0 Introduction This chapter provides information on the potential and magnitude of mud floods and mudflows that may develop in Aspen due to rainfall events, snowmelt, or rain
COUNTY, DICTIONS) 44001CV000B COMMUNITY COMMUNITY NUMBER BRISTOL, TOWN
 44001CV000B COMMUNITY COMMUNITY NUMBER BRISTOL, TOWN") BRISTOL COUNTY, RHODE ISLAND (ALL JURISD DICTIONS) COMMUNITY NAME BARRINGTON, TOWN OF BRISTOL, TOWN OF WARREN, TOWN OF COMMUNITY NUMBER 445392 445393 445408 Federal Emerge ency Management Agency FLOOD
BRISTOL COUNTY, RHODE ISLAND (ALL JURISD DICTIONS) COMMUNITY NAME BARRINGTON, TOWN OF BRISTOL, TOWN OF WARREN, TOWN OF COMMUNITY NUMBER 445392 445393 445408 Federal Emerge ency Management Agency FLOOD
Application #: TEXT
 TOWN OF FORT MYERS BEACH 2008 PROPOSED COMPREHENSIVE PLAN AMENDMENTS Application #: 2008-13-TEXT Description: Modify the Coastal Management and Future Land Use Elements to reflect the state s new definition
FLOOD INSURANCE STUDY
 FLOOD INSURANCE STUDY NEW KENT COUNTY, VIRGINIA AND INCORPORATED AREAS COMMUNITY NAME COMMUNITY NUMBER NEW KENT COUNTY (UNINCORPORATED AREAS) 510306 New Kent REVISED DATE Preliminary Date: January 31,
5.2. IDENTIFICATION OF NATURAL HAZARDS OF CONCERN
 5.2. IDENTIFICATION OF NATURAL HAZARDS OF CONCERN To provide a strong foundation for mitigation strategies considered in Sections 6 and 9, County considered a full range of natural hazards that could impact
COMMUNITY EMERGENCY RESPONSE TEAM FLOODS INTRODUCTION
 INTRODUCTION Floods are one of the most common hazards in the United States. A flood occurs any time a body of water rises to cover what is usually dry land. Flood effects can be local, impacting a neighborhood
 Red River Flooding June 2015 Caddo and Bossier Parishes Presented by: Flood Technical Committee Where the Rain Falls Matters I-30 versus I-20 I-20 Backwater and Tributary Floods (Localized) 2016 Flood
Chapter 7 Mudflow Analysis
 Chapter 7 Mudflow Analysis 7.0 Introduction This chapter provides information on the potential and magnitude of mud floods and mudflows that may develop in Aspen due to rainfall events, snowmelt, or rain
SUSSEX COUNTY, DELAWARE AND INCORPORATED AREAS
 VOLUME 1 OF 3 SUSSEX COUNTY, DELAWARE AND INCORPORATED AREAS COMMUNITY COMMUNITY NUMBER COMMUNITY COMMUNITY NUMBER BETHANY BEACH, TOWN OF 105083 LAUREL, TOWN OF 100040 BETHEL, TOWN OF 100055 LEWES, CITY
FLOOD INSURANCE STUDY
 FLOOD INSURANCE STUDY RICHMOND COUNTY, VIRGINIA AND INCORPORATED AREAS COMMUNITY NAME COMMUNITY NUMBER RICHMOND COUNTY (UNINCORPORATED AREAS) 510310 * WARSAW, TOWN OF 510115 *No Special Flood Hazard Areas
COASTAL DATA APPLICATION
 2015 Coastal GeoTools Proactive By Design. Our Company Commitment COASTAL DATA APPLICATION Projecting Future Coastal Flood Risk for Massachusetts Bay Bin Wang, Tianyi Liu, Daniel Stapleton & Michael Mobile
Appendix A STORM SURGE AND WAVE HEIGHT ANALYSIS
 Appendix A STORM SURGE AND WAVE HEIGHT ANALYSIS Memo To: Jeff Robinson, P.E., GEC, Inc. From: Silong Lu, Ph.D., P.E., D.WRE, Dynamic Solutions, LLC. Date: 1/9/2014 CC: Re: Chris Wallen, Vice President,
Draft for Discussion 11/11/2016
 Coastal Risk Consulting (CRC) Climate Vulnerability Assessment for Village of Key Biscayne Deliverable 1.1 in Statement of Work. Preliminary Vulnerability Assessment Identifying Flood Hotspots Introduction...
JOSEPHINE COUNTY, OREGON AND INCORPORATED AREAS VOLUME 1 OF 2
 JOSEPHINE COUNTY, OREGON AND INCORPORATED AREAS VOLUME 1 OF 2 COMMUNITY NAME COMMUNITY NUMBER CAVE JUNCTION, CITY OF 410107 GRANTS PASS, CITY OF 410108 JOSEPHINE COUNTY UNINCORPORATED AREAS 415590 Effective:
HURRICANE IVAN CHARACTERISTICS and STORM TIDE EVALUATION
 HURRICANE IVAN CHARACTERISTICS and STORM TIDE EVALUATION By Robert Wang and Michael Manausa Sponsored by Florida Department of Environmental Protection, Bureau of Beaches and Coastal Systems Submitted
HEC & GIS Modeling of the Brushy Creek HEC & GIS Watershed Modeling of the
 HEC & GIS Modeling of the Brushy Creek HEC & GIS Watershed Modeling of the By Cassandra Fagan 5, December 2014 http://ubcwatershedstudy.ursokr.com/images/ Contents Introduction... 3 Figure 1: 24-hour rainfall
CITY OF PORTSMOUTH, VIRGINIA (INDEPENDENT CITY)
") CITY OF PORTSMOUTH, VIRGINIA (INDEPENDENT CITY) City of Portsmouth PRELIMINARY JANUARY 13, 2014 REVISED: Federal Emergency Management Agency FLOOD INSURANCE STUDY NUMBER 515529V000B NOTICE TO FLOOD INSURANCE
CITY OF PORTSMOUTH, VIRGINIA (INDEPENDENT CITY) City of Portsmouth PRELIMINARY JANUARY 13, 2014 REVISED: Federal Emergency Management Agency FLOOD INSURANCE STUDY NUMBER 515529V000B NOTICE TO FLOOD INSURANCE
MEMORANDUM FOR SWG
 MEMORANDUM FOR SWG-2007-1623 Subject: Jurisdictional Determination (JD) for SWG-2007-1623 on Interdunal Wetlands Adjacent to Traditional Navigable Waters (TNWs) Summary The U.S. Environmental Protection
Randall W. Parkinson, Ph.D., P.G. Institute of Water and Environment Florida International University
 An Update on Adaptation Action Activities Undertaken Since Completion of the City of Satellite Beach (FL) Vulnerability Assessment to Rising Seas (2010) Randall W. Parkinson, Ph.D., P.G. Institute of Water
CAPE MAY COUNTY, NEW JERSEY (All Jurisdictions)
") VOLUME 1 OF 1 CAPE MAY COUNTY, NEW JERSEY (All Jurisdictions) COMMUNITY NAME COMMUNITY NUMBER AVALON, BOROUGH OF 345279 CAPE MAY, CITY OF 345288 CAPE MAY POINT, BOROUGH OF 345289 DENNIS, TOWNSHIP OF 340552
VOLUME 1 OF 1 CAPE MAY COUNTY, NEW JERSEY (All Jurisdictions) COMMUNITY NAME COMMUNITY NUMBER AVALON, BOROUGH OF 345279 CAPE MAY, CITY OF 345288 CAPE MAY POINT, BOROUGH OF 345289 DENNIS, TOWNSHIP OF 340552
Nebraska. Large Area Mapping Initiative. The Nebraska. Introduction. Nebraska Department of Natural Resources
 Nebraska Department of Natural Resources Introduction The Nebraska The Nebraska Department of Natural Resources (NDNR) has developed a process for using a geographic information system (GIS) to map Approximate
Flood and Sea Level Rise Mapping Methodologies: The Way Forward
 Flood and Sea Level Rise Mapping Methodologies: The Way Forward Malcolm L. Spaulding Professor Emeritus, Ocean Engineering University of Rhode Island spaulding@egr.uri.edu Interagency Coordination Meeting
3301 Rickenbacker Causeway, Miami, FL 33149
 Virginia Key and Miami Beach 2016 King Tide Report and Projections (to 2045) using: 3301 Rickenbacker Causeway, Miami, FL 33149 *THIS REPORT IS PROVIDED SUBJECT TO THE COASTAL RISK CONSULTING, LLC, PRINTED
HYDROLOGIC AND HYDRAULIC REPORT FOR SR. 0522, SECTION 5BN ALONG BLACKLOG CREEK CROMWELL TOWNSHIP HUNTINGDON COUNTY. Prepared for:
 HYDROLOGIC AND HYDRAULIC REPORT FOR SR. 0522, SECTION 5BN ALONG BLACKLOG CREEK CROMWELL TOWNSHIP Prepared for: KCI Technologies, Inc. Mechanicsburg, PA and Pennsylvania Department of Transportation Engineering
SLOSH New Orleans Basin 2012 Update
 SLOSH New Orleans Basin 2012 Update Michael Koziara Science and Operations Officer National Weather Service Slidell, LA The Basics What is storm surge? What is SLOSH? Details Assumptions Inundation = Storm
APPROVED JURISDICTIONAL DETERMINATION FORM U.S. Army Corps of Engineers
 APPROVED JURISDICTIONAL DETERMINATION FORM U.S. Army Corps of Engineers This form should be completed by following the instructions provided in Section IV of the JD Form Instructional Guidebook. SECTION
5.2 IDENTIFICATION OF HAZARDS OF CONCERN
 5.2 IDENTIFICATION OF HAZARDS OF CONCERN 2015 HMP Update Changes The 2010 HMP hazard identification was presented in Section 6. For the 2015 HMP update, the hazard identification is presented in subsection
Red River Levee Panel
 Red River Levee Panel Mississippi River Commission Monday, August 9, 2017 Red River Levees in LA & AR NONE along TX & OK Boarder Red River Levee Issues Caddo Levee Cherokee Park Authorization Bossier Levee
APPROVED JURISDICTIONAL DETERMINATION FORM U.S. Army Corps of Engineers
 APPROVED JURISDICTIONAL DETERMINATION FORM U.S. Army Corps of Engineers This form should be completed by following the instructions provided in Section IV of the JD Form Instructional Guidebook. SECTION
Discovery Data Questionnaire
 Region III Discovery Data Questionnaire Thank you for taking the time to complete this Discovery Data questionnaire. It will provide important information to help FEMA better understand flood risk issues
Background on the March 13-14, 2007 Flooding in Browns Valley (Traverse County), Minnesota
, Minnesota") Background on the March 13-14, 2007 Flooding in Browns Valley (Traverse County), Minnesota Report to the Minnesota Governor s Office Prepared by: Minnesota Department of Natural Resources Waters Division
Background on the March 13-14, 2007 Flooding in Browns Valley (Traverse County), Minnesota Report to the Minnesota Governor s Office Prepared by: Minnesota Department of Natural Resources Waters Division
Quick Response Report #126 Hurricane Floyd Flood Mapping Integrating Landsat 7 TM Satellite Imagery and DEM Data
 Quick Response Report #126 Hurricane Floyd Flood Mapping Integrating Landsat 7 TM Satellite Imagery and DEM Data Jeffrey D. Colby Yong Wang Karen Mulcahy Department of Geography East Carolina University
Chapter 10 - Sacramento Method Examples
 Chapter 10 Sacramento Method Examples Introduction Overview This chapter presents two example problems to demonstrate the use of the Sacramento method. These example problems use the SACPRE and HEC-1 computer
5.2 IDENTIFICATION OF HAZARDS OF CONCERN
 5.2 IDENTIFICATION OF HAZARDS OF CONCERN 2016 HMP Update Changes The 2011 HMP hazard identification was presented in Section 3. For the 2016 HMP update, the hazard identification is presented in subsection
NYE COUNTY, NEVADA AND INCORPORATED AREAS Nye County
 NYE COUNTY, NEVADA AND INCORPORATED AREAS Nye County Community Name Community Number NYE COUNTY, UNINCORPORATED AREAS 320018 February 17, 2010 Federal Emergency Management Agency FLOOD INSURANCE STUDY
Big Rivers Electric Corporation Disposal of Coal Combustion Residuals (CCR) from Electric Utilities Final Rule CCR Impoundment Liner Assessment Report
 from Electric Utilities Final Rule CCR Impoundment Liner Assessment Report") Big Rivers Electric Corporation Disposal of Coal Combustion Residuals (CCR) from Electric Utilities Final Rule CCR Impoundment Liner Assessment Report CCR Surface Impoundment Information Name: Operator:
Big Rivers Electric Corporation Disposal of Coal Combustion Residuals (CCR) from Electric Utilities Final Rule CCR Impoundment Liner Assessment Report CCR Surface Impoundment Information Name: Operator:
MVP WMS, George Schorr
 APPROVED JURISDICTIONAL DETERMINATION FORM U.S. Army Corps of Engineers This form should be completed by following the instructions provided in Section IV of the JD Form Instructional Guidebook. SECTION
MARTIN COUNTY, FLORIDA AND INCORPORATED AREAS
 MARTIN COUNTY, FLORIDA AND INCORPORATED AREAS Community Name Community Number JUPITER ISLAND, TOWN OF 120162 MARTIN COUNTY (UNINCORPORATED AREAS) 120161 OCEAN BREEZE, TOWN OF 120163 SEWALL S POINT, TOWN
New Mapping, Recent Events What do we know? June 9, 2011
 New Mapping, Recent Events What do we know? June 9, 2011 e FEMA Mapping Process Current Flood Insurance Rate Maps (FIRMs) or Floodplain Maps date back to the early 1970 s. The District contracted with
YUMA COUNTY, ARIZONA AND INCORPORATED AREAS
 YUMA COUNTY, ARIZONA AND INCORPORATED AREAS Community Name Community Number SAN LUIS, CITY OF 040136 SOMERTON, CITY OF 1 040114 WELLTON, TOWN OF 040112 YUMA, CITY OF 040102 YUMA COUNTY (UNINCORPORATED
Flooding in Western North Carolina: Some Spatial, Hydrologic, and Seasonal Characteristics CAUTION!! Outline. Basic Flood Facts.
 Flooding in Western North Carolina: Some Spatial, Hydrologic, and Seasonal Characteristics J. Greg Dobson CAUTION!! National Environmental Modeling and Analysis Center RENCI at UNC-Asheville Engagement
GLOUCESTER COUNTY, VIRGINIA (ALL JURISDICTIONS)
") GLOUCESTER COUNTY, VIRGINIA (ALL JURISDICTIONS) COMMUNITY NAME COMMUNITY NUMBER GLOUCESTER COUNTY (UNINCORPORATED AREAS) 510071 Gloucester County REVISED: NOVEMBER 19, 2014 Federal Emergency Management
GLOUCESTER COUNTY, VIRGINIA (ALL JURISDICTIONS) COMMUNITY NAME COMMUNITY NUMBER GLOUCESTER COUNTY (UNINCORPORATED AREAS) 510071 Gloucester County REVISED: NOVEMBER 19, 2014 Federal Emergency Management
Elevations are in meters above mean sea level. Scale 1:2000
 12.001 LAB 7: TOPOGRAPHIC MAPS Due: Monday, April 11 PART I: CONTOURING AND PROFILES (20 PTS) 1. Contour this area map using a 5 meter contour interval. Remember some fundamental rules of contour lines,
Chapter 6 Mapping and Online Tools
 Chapter 6 Mapping and Online Tools The stream site you monitor is just part of a much larger system. When analyzing stream health, it is important to take a holistic view by considering the entire watershed.
Evaluation of Storm Tide Measurements at Panama City Beach, FL
 Evaluation of Storm Tide Measurements at Panama City Beach, FL 1993-2007 Prepared by Mark E. Leadon Beaches and Shores Resource Center Florida State University May 2009 Prepared for Florida Department
Protecting the Storm Damage Prevention and Flood Control Interests of Coastal Resource Areas
 Protecting the Storm Damage Prevention and Flood Control Interests of Coastal Resource Areas Presented by: Massachusetts Department of Environmental Protection & Massachusetts Office of Coastal Zone Management
Floodplain Mapping & Flood Warning Applications in North Carolina
 Floodplain Mapping & Flood Warning Applications in North Carolina Marc Stanard, IT Project Manager Ken Ashe, Assistant Director David Herlong, Flood Warning Program Manager NC Crime Control & Public Safety
McHenry County Property Search Sources of Information
 Disclaimer: The information in this system may contain inaccuracies or typographical errors. The information in this system is a digital representation of information derived from original documents; as