YUMA COUNTY, ARIZONA AND INCORPORATED AREAS
|
|
|
- Basil Daniel
- 6 years ago
- Views:
Transcription


1 YUMA COUNTY, ARIZONA AND INCORPORATED AREAS Community Name Community Number SAN LUIS, CITY OF SOMERTON, CITY OF WELLTON, TOWN OF YUMA, CITY OF YUMA COUNTY (UNINCORPORATED AREAS) NON-FLOODPRONE COMMUNITY Yuma County REVISED Month Day, Year Federal Emergency Management Agency FLOOD INSURANCE STUDY NUMBER 04027CV000B
2 NOTICE TO FLOOD INSURANCE STUDY USERS Communities participating in the National Flood Insurance Program have established repositories of flood hazard data for floodplain management and flood insurance purposes. This Flood Insurance Study may not contain all data available within the repository. It is advisable to contact the community repository for any additional data. This preliminary Flood Insurance Study contains profiles presented at a reduced scale to minimize reproduction costs. All profiles will be included and printed at full scale in the final published report. Part or all of this Flood Insurance Study may be revised and republished at any time. In addition, part of this Flood Insurance Study may be revised by the Letter of Map Revision process, which does not involve republication or redistribution of the Flood Insurance Study. It is, therefore, the responsibility of the user to consult with community officials and to check the community repository to obtain the most current Flood Insurance Study components. Initial Countywide FIS Effective Date: August 28, 2008 First Revised Countywide FIS Date: Month xx, 201x i
3 TABLE OF CONTENTS 1.0 INTRODUCTION... 1 Page 1.1 Purpose of Study Authority and Acknowledgments Coordination AREA STUDIED Scope of Study Community Description Principal Flood Problems Flood Protection Measures ENGINEERING METHODS Hydrologic Analyses Methods for Flooding Sources with New or Revised Analyses in Current Study Methods for Flooding Sources Incorporated from Previous Studies Hydraulic Analyses Methods for Flooding Sources with New or Revised Analyses in Current Study Methods for Flooding Sources Incorporated from Previous Studies Behind-Levee Analyses Vertical Datum FLOODPLAIN MANAGEMENT APPLICATIONS Floodplain Boundaries Methods for Flooding Sources with New or Revised Analyses Methods for Flooding Sources Incorporated from Previous Studies Floodways INSURANCE APPLICATIONS FLOOD INSURANCE RATE MAP OTHER STUDIES LOCATION OF DATA BIBLIOGRAPHY AND REFERENCES REVISION DESCRIPTIONS First Revision (Revised Month Day, Year) ii
4 TABLE OF CONTENTS (continued) FIGURES Figure 1. Floodway Schematic TABLES Table 1: Initial and Final CCO Meetings... 4 Table 2: Flooding Sources Studied by Detailed Methods... 5 Table 3: Letters of Map Correction... 7 Table 4: Summary of Discharges Table 5: Manning s n Values Table 6: Vertical Datum Conversion Table Table 7: Floodway Data Table 8: Community Map History Exhibit 1 Flood Profiles EXHIBITS Coyote Wash Panels 01P 06P Fortuna Wash Panels 07P 14P Fortuna Wash East Fork Panel 15P Fortuna Wash East Fork Split Channel Panel 16P Fortuna Wash Tributary B Panel 17P Fortuna Wash Tributary C Panel 18P Gila River Panels 19P 47P Gila River North Split Panels 48P 49P Split Channel 1 Panel 50P Split Channel 2 Panel 51P Unnamed Tributary to Fortuna Wash East Fork Panel 52P Exhibit 2 Flood Insurance Rate Map Index (Published Separately) Flood Insurance Rate Maps (Published Separately) iii
5 FLOOD INSURANCE STUDY YUMA COUNTY, ARIZONA, AND INCORPORATED AREAS 1.0 INTRODUCTION 1.1 Purpose of Study This Flood Insurance Study (FIS) revises and updates information on the existence and severity of flood hazards in the geographic area of Yuma County, including the Cities of San Luis, Somerton, and Yuma; the Town of Wellton; and the unincorporated areas of Yuma County (hereinafter referred to collectively as Yuma County), and aids in the administration of the National Flood Insurance Act of 1968 and the Flood Disaster Protection Act of This study has developed flood-risk data for various areas of the community that will be used to establish actuarial flood insurance rates and to assist the community in its efforts to promote sound floodplain management. Minimum floodplain management requirements for participation in the National Flood Insurance Program (NFIP) are set forth in the Code of Federal Regulations at 44 CFR, In some states or communities, floodplain management criteria or regulations may exist that are more restrictive or comprehensive than the minimum Federal requirements. In such cases, the more restrictive criteria take precedence, and the State (or other jurisdictional agency) will be able to explain them. Yuma County also includes the City of Somerton, which does not contain any Special Flood Hazard Areas (SFHAs) and is non-floodprone. 1.2 Authority and Acknowledgments The sources of authority for this FIS report are the National Flood Insurance Act of 1968 and the Flood Disaster Protection Act of This revision involves updating the mapping for portions of Yuma County, Arizona, by removal of PAL notes for levees along the Gila and Colorado Rivers from affected Digital Flood Insurance Rate Map (DFIRM) panels. In addition new hydrologic and hydraulic studies for two separate reaches along the Gila River were developed. These studies were incorporated by BakerAECOM, LLC, for FEMA, under Contract No. HSFEHQ-09-D-0368 and completed in February of The original countywide FIS was prepared by MAP IX-Mainland under contract number EMF-2003-CO That work was completed in September of Information on the authority and acknowledgments for each jurisdiction included in that countywide FIS, as compiled from their previously printed FIS reports, is shown below. 1
6 Yuma, City of: Yuma County (Unincorporated Areas): The hydrologic and hydraulic analyses from the original FIS report were performed by PRC Toups for FEMA, under Contract No. H That study was completed in September A hydraulic stage-discharge-frequency analysis for the Colorado River was performed by Dames & Moore for FEMA to establish water-surface elevations downstream of 4 th Avenue to reflect the effects of levee improvements. That analysis was completed in September The hydrologic and hydraulic analyses from the original FIS report were performed by PRC Toups for FEMA under Contract No. H The work, completed in September 1981, covered all significant flooding sources affecting the unincorporated areas of Yuma County. A hydraulic stage discharge-frequency analysis for the Colorado River was performed by Dames & Moore for FEMA to establish water-surface elevations below 4 th Avenue to reflect the effects of levee improvements. That analysis was completed in September The hydrologic and hydraulic analyses for Washes A, B, and C (tributaries of Fortuna Wash) were performed by PRC Engineering for FEMA under Contract No. EMW-83-C That work was completed in September A reevaluation of the flooding situation affecting Washes A, B, C, and D was performed by Dames & Moore for FEMA. The delineations shown on the FIRM reflect the results of Dames & Moore's reevaluation, which was completed in September There is no information for the Cities of San Luis and Somerton and the Town of Wellton because there were no previously published FIS reports for these communities. For this revision, base map information shown on these FIRMs was derived from digital orthophotography collected by the U.S. Department of Agriculture Farm Service Agency under its National Agriculture Imagery Program (NAIP). This imagery was flown in 2010 and was produced with a 1-meter ground sample distance. Base map information on the unrevised FIRMs was derived from U.S. Geological Survey (USGS) Digital Orthophoto Quadrangles produced at a scale of 1:12,000 from photography dated 1992 or later. The projection used in the preparation of this map was Universal Transverse Mercator (UTM) Zone 11N. The horizontal datum was NAD83. Differences in the datum and 2
7 spheroid used in the production of FIRMs for adjacent counties may result in slight positional differences in map features at the county boundaries. These differences do not affect the accuracy of information shown on the FIRM. 1.3 Coordination An initial Consultation Coordination Officer (CCO) meeting is held with representatives of FEMA, the community, and the study contractors to explain the nature and purpose of the FIS and to identify the streams to be studied by detailed methods. A final CCO meeting, often also referred to as the Preliminary DFIRM Community Coordination (PDCC) meeting, is held with representatives of FEMA, the community, and the study contractors to review the results of the study. For this revision of the countywide FIS, the initial CCO meeting was held on November 18, 2009, and attended by representatives of Yuma County, the City of San Luis, the Town of Wellton, FEMA Region IX, and the study contractor. The PDCC meeting was held on to review and accept the results of this FIS. Those who attended this meeting included representatives of, the study contractor, FEMA, and the communities. All problems raised at that meeting have been addressed in this study. For Yuma County, study areas for the original study were identified at a meeting attended by representatives of the study contractor, FEMA, and Yuma County on April 11, The Yuma County Highway Department, Arizona Department of Transportation (ADOT), Arizona Water Commission, U.S. Bureau of Reclamation (USBR), U.S. Army Corps of Engineers (USACE), and USGS have furnished reports, maps, and flood hazard data pertinent to the original study. Several meetings were held, with correspondence exchanged between meetings, tocoordinate information and to inform the Yuma County Engineer on the progress of the study. An intermediate/final coordination meeting to discuss the original study results was held on August 12, 1981, and was attended by representatives of the study contractor, Yuma County, and FEMA. There were no major objections to the study results. A coordination meeting to discuss the analysis of Washes A, B, and C was held on May 19, 1983, and attended by representatives of the study contractor, FEMA, and Yuma County. Effective coordination efforts were established with FEMA, Yuma County, ADOT, and the Natural Resources Conservation Service (NRCS) to locate existing hydrologic and hydraulic data. Additional conversations and meetings were held with these same representatives throughout the course of the study to discuss methodology and to relay and review data regarding flood elevations and flood boundaries. 3
8 On May 8, 1986, the results of the revised study were reviewed at the final community coordination meeting attended by representatives of Yuma County, the study contractor, and FEMA. The study was found to be acceptable to the community. Further revisions based on Dames & Moore's reevaluation of the flood situation were made after the May 8, 1986, final meeting. These revisions were coordinated between FEMA, Dames & Moore, and the study contractor. For the City of Yuma, study areas were originally identified at a meeting attended by representatives of the study contractor, FEMA, and the City of Yuma on April 12, This study was coordinated with representatives of the city, the USACE, the Water and Power Resources Service (WPRS), and the Yuma County Water Users Association. These and other Federal and State agencies and private consultants were contacted in an effort to locate all existing hydrologic and hydraulic data. Several contacts were made with representatives of the agencies listed above throughout the course of this study for the purpose of data collection and to relay and review data development regarding hydrology, flood elevations, and floodplain boundaries. An intermediate/final coordination meeting to discuss the results of the original study was held on August 12, It was attended by representatives of the city, the State, the study contractor, and FEMA. The study was acceptable to the community. The dates for the previous revisions and countywide revision, initial and final CCO meetings held for Yuma County and the incorporated communities within its boundaries are shown in Table 1, Initial and Final CCO Meetings. Table 1: Initial and Final CCO Meetings Community Name For FIS Dated Initial CCO Date Final CCO Date City of Yuma Yuma County (Unincorporated Areas) Yuma County and Incorporated Areas July 5, 1983 November 15, 1985 December 15, 1983 November 15, 1985 September 30, 1988 April 12, 1978 August 12, 1981 April 11, 1978 * May 19, 1983 August 12, 1981 * May 8, 1986 August 28, 2008 * December 17, 2007 *Data not available 4
9 2.0 AREA STUDIED 2.1 Scope of Study This FIS report covers the geographic area of Yuma County, Arizona. For this revision to the countywide FIS, two separate reaches of the Gila River were restudied using detailed methods, for a total of 24.4 miles. The first study covers the Gila River from the confluence with the Colorado River up to Highway 95, a stream distance of 12.1 miles. The second study covers the Gila River from approximately 5,000 feet downstream of Ave. 20E to approximately 5,000 feet upstream of Ave. 30E, a stream distance of 13.6 miles. Due to the topography of the Entellus studied portion of the Gila River, it was deemed necessary to study two unnamed washes that flow into the Gila River in order to adequately tie them in. All or portions of the flooding sources listed in Table 2: Flooding Sources Studied by Detailed Methods were studied by detailed methods. Limits of detailed study are indicated on the Flood Profiles (Exhibit 1) and on the FIRM. Table 2: Flooding Sources Studied by Detailed Methods Flooding Source Reach Length (miles) Study Limits Colorado River 62.0 From the U.S. Mexico Border to 62.0 miles upstream of the U.S. Mexico Border Fortuna Wash 8.9 From the confluence with Gila River to approximately3.2 miles upstream of Highway 80 Fortuna Wash East Fork 1.0 From the confluence with Fortuna Wash to approximately 1,800 feet upstream of the confluence of Split Channel Fortuna Wash East Fork Split Channel 0.2 From the convergence with Fortuna Wash East Fork to the divergence from Fortuna Wash East Fork 5
10 Flooding Source Fortuna Wash Tributary B Reach Length (miles) 0.5 Study Limits From approximately 1,100 feet downstream of Avenue 14E to approximately 2,500 feet upstream of Avenue 14E Fortuna Wash Tributary C 0.2 From the confluence with Fortuna Wash Tributary B to approximately 900 feet upstream of the confluence with Fortuna Wash Tributary B Gila River* 34.9 From the confluence with the Colorado River to approximately 5,000 feet upstream of Ave. 30E Split Channel From confluence with Fortuna Wash East Fork to confluence of Unnamed Tributary to Fortuna Wash East Fork Split Channel From confluence with Fortuna Wash East Fork to confluence of Unnamed Tributary to Fortuna Wash East Fork Unnamed Tributary to Fortuna Wash East Fork 0.6 From approximately 2,300 feet downstream of the confluence of Split Channel 2 to the confluence of Split Channel 1 *Flooding source with new or revised analyses incorporated as part of the current study update Alluvial fan analyses were performed for wash areas bounded by Fortuna Wash to the west and the Gila Mountains to the east. Each wash is a tributary to Fortuna Wash. For the purposes of this report, the washes (dry arroyos) are designated as Washes A, B, C, and D. All or portions of numerous flooding sources in the county were studied by approximate methods. Approximate analyses were used to study those areas having a low development potential or minimal flood hazards. The scope and methods of study were proposed to, and agreed upon by, FEMA and Yuma County. 6
11 This countywide FIS also incorporates the determination of letters issued by FEMA resulting in map changes (Letter of Map Revision [LOMR], Letter of Map Revision - based on Fill [LOMR-F], and Letter of Map Amendment [LOMA]), as shown in Table 3, Letters of Map Correction. Table 3: Letters of Map Correction Community Flooding Source(s)/ Project Identifier Date Issued Type Yuma County (Unincorporated Areas) Avenue 14E low flow crossing March 30, 2005 LOMR Town of Wellton Links at Coyote Wash Subdivision June 10, 2004 LOMR Yuma County (Unincorporated Areas) Foothills Mobile Estates #27 March 24, 2004 LOMR Yuma County (Unincorporated Areas) Wash C-North and South, D, E, and F June 30, 2000 LOMR Yuma County (Unincorporated Areas) Foothills Mobile Estates May 11, 1999 LOMR The areas studied by detailed methods were selected with priority given to all known flood hazards and areas of projected development or proposed construction. 2.2 Community Description Yuma County, located in southwestern Arizona, is bounded by Imperial County, California, to the west; La Paz County, Arizona, to the north; Maricopa and Pima County, Arizona, to the east; and Mexico to the south. The population of the unincorporated areas of the county was 106,895 in 1990 (U.S. Department of Commerce, 1990). The population was 160,026 in This figure represents a 49.7-percent increase from 1990 to The year 2010 population for both incorporated and unincorporated areas was 195,751. The unincorporated areas near the City of Yuma, the county seat and seventh largest city in Arizona, are greatly influenced by the city. From a population of 9,145 in 1950, the city grew 464 percent to a population of 42,433 in Transportation serving the City of Yuma includes Interstate Highway 8, the main line of the Union Pacific Railroad, and an international airport. The climate of Yuma County is desert, characterized by short, mild winters and long, hot summers with 2.3 inches of precipitation annually. The average maximum temperature in July is 106 degrees Fahrenheit ( F). The average minimum temperature in January is 43.3 F. Average annual maximum and minimum temperatures are 86.9 F and 60.4 F, respectively. 7
12 The soils in the Colorado River, Gila River, and lower Fortuna Wash areas are deep, medium coarse-textured, and are of the Type B hydrologic soil group. Soils in the upper Fortuna Wash area are deep, very gravelly to gravelly on an old alluvial fan, and are of the Type B hydrologic soil group. Native vegetation consists of sparse stands of creosote bush, bursage, annual grasses, Palo Verde trees, and mesquite. Dense stands of salt cedar, salt brush, mesquite, and arrowweed grow along streams. Cultivated crops include cotton, vegetables, fruit, small grains, Bermuda grass, and pecans. The topography of the Yuma area includes the main channels of the Colorado and Gila Rivers, with their broad and relatively flat floodplains. Rising 40 to 70 feet above the floodplain of the Colorado and Gila Rivers and separated by a well- defined bluff is the relatively level Yuma Mesa. The Yuma Mesa, upon which much of the city is built, runs in a general east-west direction south of the Colorado and Gila Rivers. The Gila River empties into the Colorado River approximately 4 miles upstream of the City of Yuma. Further upstream from its confluence with the Colorado River, the Gila River floodplain rises abruptly to the Laguna and Muggins Mountains to the north and the Gila Mountains to the south. Fortuna Wash, a tributary to the Gila River, parallels the Gila Mountains. Main Outlet Drain starts at the confluence of the Gila Gravity Canal and the Gila River and proceeds downstream, parallel to the Gila River to the confluence with the Colorado River. Wellton-Mohawk Canal proceeds upstream from Gila Gravity Canal, parallel to the Gila River. Several levees are parallel to the Colorado River. The South Gila and Yuma Levees are on the south side of the Colorado River, while Upper and Lower Reservation Levees are on the north side. Development of the overbank areas is mostly agricultural, with some light residential development. Because of the growth of the City of Yuma, there is some potential for further residential development in the overbanks of the rivers. The detailed-study area along the Tributaries to Fortuna Wash is located approximately 12 miles east of the City of Yuma, adjacent to Interstate Highway 8. Fortuna Wash flows northerly beneath Interstate Highway 8 and borders the detailed-study area on the west. The Gila Mountains border the detailed-study area on the east. Washes A, B, and C are located north of Interstate Highway 8; Wash D is located south of Interstate Highway 8. The area drains westerly to Fortuna Wash. The drainage area consists of very steep slopes in the mountainous upper portions of the watershed to moderate slopes adjacent to Fortuna Wash. Elevations range from 300 to 2,100 feet. Soils in the upper elevations of the drainage area have low infiltration characteristics. The lower elevations of the drainage area have soils with moderately high infiltration characteristics. This watershed area has a mean annual precipitation of 4.0 inches. 8
13 Within the last several years, the alluvial fan area east of Fortuna Wash has experienced a significant increase in residential development. Development in the area is expected to continue as the City of Yuma's population grows and the area gains in popularity for retirement and winter residence. 2.3 Principal Flood Problems Three basic types of storms affect the study area: general winter, summer, and tropical storms. The summer storms typically are short-duration, high-intensity thunderstorms. Winter storms typically are longer in duration and less intense. General winter storms occur from November to March as moisture from extratropical disturbances moves inland from the Pacific Ocean. General summer storms originate in the Gulf of Mexico or along the western coast of Mexico. These storms are often accompanied by thunderstorm activity, resulting in flash floods caused by the heavy rains of short duration. Summer thunderstorms are usually preceded or accompanied by strong winds and blowing dust. Prior to control of the Colorado River, large and damaging floods were not uncommon in the Yuma area. The largest flood of record, on January 22, 1916, had a peak discharge estimated at 250,000 cubic feet per second (cfs), with a recurrence interval of 450 years. The Colorado River at Yuma crested at 165,000 cfs (recurrence interval 180 years) in February 1920 as a result of floods on the Gila River. In June 1920, the Colorado River crested at 190,000 cfs as a result of snowmelt floods from the upper Colorado River basin. In June 1921, the spring flood runoff from the upper Colorado River peaked at 188,000 cfs at Yuma. The June 1920 and June 1921 floods had recurrence intervals of 250 years (U.S. Department of the Interior, 1973). The completion of Hoover Dam in 1935 eliminated extreme floods reaching the City of Yuma from the upper Colorado River basin. Parker and Davis Dams on the Colorado River added to the control of the river. Alamo Dam on the Bill Williams River and Painted Rock Dam on the Gila River, both flood-control dams constructed by the USACE, added substantial control of those tributaries. However, significant floods are still a distinct possibility in the vicinity of Yuma, even though their magnitude, frequency, and destructive potential have been reduced by the upstream dams (U.S. Department of the Interior, 1973; U.S. Department of the Interior, 1971; USACE, 1979). Main Canal, East Main Canal, and West Main Canal are irrigation canals under the jurisdiction of the Yuma County Water Users Association; Main Canal has a capacity of 1,000 cfs; East and West Main Canals have a 500-cfs capacity. Storm runoff has raised the water surface in the canals to within 1.0 foot of the top of the bank. This indicates that breaching of the canals is possible. Local runoff from the mesa west of the Union Pacific Railroad on the eastern side of the City of Yuma will form ponding areas in the vicinity of 10 th Street and Walnut Avenue. Typical of the arid southwest, the washes being studied remain dry most of the year, but during a storm have the capacity to convey large volumes of water with very short notice. These alluvial channels also have the capacity to carry large volumes of sediment and other debris which cause the stage-discharge relationship of a channel to constantly 9
14 change. Recent development in the area has increased the need to identify potential flooding sources. 2.4 Flood Protection Measures Parker Dam is the major flood-protection structure on the Colorado River in LaPaz County. Although Parker Dam has not completely removed the possibility of a large flood, it has reduced the number and magnitude of floods on the river. The dams on the Colorado River in the immediate vicinity of Yuma contribute little to flood control. Imperial and Laguna Dams, located upstream of the city, are diversion dams for irrigation. These dams are operated at a nearly constant level and, therefore, cannot reduce floodflows. Painted Rock Dam, a flood-control structure, is located 100 miles east of Yuma on the Gila River. The City of Yuma is separated from the Colorado River by a series of levees. Yuma Levee extends from Yuma to the United States-Mexico border on the southern side of the river, Upper and Lower Reservation Levees extend from Laguna Dam to high ground near Araz on the northern side of the river, and South Gila Levee extends from the confluence with the Gila River to Prison Hill on the southern side of the river. In the vicinity of Yuma, the USBR has improved the Upper and Lower Reservation, South Gila, and Yuma Levees to prevent overtopping during a 1-percent-annual-chance flood. This has significantly reduced flood hazards in areas protected by the levees. FEMA specifies that all levees must have a minimum of 3 foot freeboard against 1-percent-annual chance flooding to be considered a safe flood protection structure. Levees exist in the study area that provides the community with some degree of protection against flooding. However, it has been ascertained that some of these levees may not protect the community from rare events such as the 1-percent-annual-chance flood. The criteria used to evaluate protection against the 1-percent-annual-chance flood are 1) adequate design, including freeboard, 2) structural stability, and 3) proper operation and maintenance. Levees that do not protect against the 1-percent-annualchance flood are not considered in the hydraulic analysis of the 1-percent-annual-chance floodplain. Automatic wasteways and overflow chutes protect Gila Gravity Main and Wellton-Mohawk Canals from breaching their banks due to overlapping from excess storm runoff into the canals. Detention basins have been constructed on the eastern side of East Main Canal. However, their capacity is only effective in providing flood protection during lower- frequency, short-duration storms. The irrigation water in the canals is decreased by the Yuma County Water Users Association in anticipation of a storm, thereby providing adequate capacity in the canals to safely convey storm runoff. 10
15 Storm drains in the city are effective in providing flood protection only during lower frequency storms of short duration. 3.0 ENGINEERING METHODS For the flooding sources studied by detailed methods in the community, standard hydrologic and hydraulic study methods were used to determine the flood-hazard data required for this study. Flood events of a magnitude that is expected to be equaled or exceeded once on the average during any 10-, 50-, 100-, or 500-year period (recurrence interval) have been selected as having special significance for floodplain management and for flood insurance rates. These events, commonly termed the 10-, 50-, 100-, and 500-year floods, have a 10-, 2-, 1-, and 0.2-percent chance, respectively, of being equaled or exceeded during any year. Although the recurrence interval represents the long-term, average period between floods of a specific magnitude, rare floods could occur at short intervals or even within the same year. The risk of experiencing a rare flood increases when periods greater than 1 year are considered. For example, the risk of having a flood that equals or exceeds the 1-percent-annual-chance flood in any 50-year period is approximately 40 percent (4 in 10); for any 90-year period, the risk increases to approximately 60 percent (6 in 10). The analyses reported herein reflect flooding potentials based on conditions existing in the community at the time of completion of this study. Maps and flood elevations will be amended periodically to reflect future changes. 3.1 Hydrologic Analyses For this countywide study, hydrologic analyses were carried out to establish peak discharge frequency relationships for each flooding source studied by detailed and approximate methods affecting the community. A summary of peak discharge-drainage area relationships for streams studied by detailed methods is shown in Table 4, "Summary of Discharges." Methods for Flooding Sources with New or Revised Analyses in Current Study Discharges for the 50-, 10- and 1-percent-annual-chance recurrence interval for the new detailed study of the Gila River in Yuma County were determined using Log Pearson Type III flood frequency analysis according to Bulletin 17B (U.S. Water Resources Council, 1976) procedures. The U.S. Geological Survey computer program PeakFQ Version 5.0 (U.S.Geological Survey, 2005) was used to determine the peak discharge for the modeled reach of the Gila River using flood records from the USGS stream gage number , Gila River Near Dome, AZ (USGS). This USGS stream gage has records dating back to 1904; however, records prior to 1960 were not included in this analysis due to the construction of Painted Rock Dam upstream of the study reach. Due to the topography of the Entellus studied portion of the Gila River, it was deemed necessary to study two unnamed washes that flow into the Gila River in order to adequately tie them in. Both unnamed washes were previously studied with approximate methods and are studied herein with approximate methods. This approximate study was performed using Watershed Information System 11
16 (WISE) as a preprocessor to HEC-RAS. Tools within WISE allowed the engineer to verify that the cross section data was acceptable. The WISE program was used to generate the input data files for HEC-RAS. Then HEC-RAS was used to determine the flood elevation at each cross section of the modeled stream Methods for Flooding Sources Incorporated from Previous Studies The hydrologic analyses for communities within Yuma County that had previous printed FIS reports have been compiled and are summarized below. There is no information for the Cities of San Luis, Somerton, and the Town of Wellton because there were no previously published FIS reports for these communities. Hydrologic analyses were carried out to establish peak discharge-frequency relationships for each flooding source studied by detailed methods affecting the county. In the unincorporated area of Yuma County, the hydrology for the Colorado and Gila Rivers and Main Outlet Drain was derived from information obtained from the WPRS and the USACE. WPRS has been assigned flood-control responsibility for the lower Colorado River by the Boulder Canyon Project Act and the Colorado River Front Work and Levee System Act. WPRS operates and maintains the Colorado River Front Work, keeping flow records and hydrologic information. Because the Colorado River is controlled by a series of dams for most of its length and the Gila River is controlled by Painted Rock Dam, the original countywide FIS involved studies of only the 10- and 1-percent-annual-chance flood events, as recommended by the government agencies controlling water releases. Although determination of a 2-percent-annual-chance flood discharge for the Colorado River was not recommended by WPRS, a 2-percent-annual-chance flood discharge was computed using a Gumbel plot for use in the USACE HEC-2 computer program (USACE, 1976). Because the Colorado River is regulated by a series of dams, a Gumbel plot may not give compatible results with a 2-percentannual-chance flood discharge obtained by the methods used by the WPRS in determining the 10- and 1-percent-annual-chance flood discharges. The 2- percent-annual chance flood discharges used for the Colorado River above and below its confluence with the Gila River were 74,000 and 80,000 cfs, respectively. The NRCS TR-20 computer program (U.S. Department of Agriculture, 1965) was used to determine flood peaks at various points of inflow along East Main Canal and West Main Canal for the 1-percent-annual-chance flood only. USGS 7.5-minute quadrangle maps, NRCS soil maps (U.S. Department of Agriculture, 1980), aerial photographs, U.S. Weather Bureau data, and detailed field investigations were used in establishing the drainage basin characteristics 12
17 for the hydrologic modeling to the Fortuna Wash area. The hydrologic analysis of the watersheds affecting Fortuna Wash was generated using the NRCS TR-20 computer program (U.S. Department of Agriculture, 1965). These results were compared with those obtained from USGS regression equations (Arizona Department of Transportation, 1978). The map for the wash areas east of Fortuna Wash was prepared with the results obtained using the regional USGS regression equations. The USACE established discharges on Gila River through a combination of the probabilities of the releases from Painted Rock Dam and from the uncontrolled drainage area below the dam. The 2-percent annual chance flood was not analyzed because experienced hydraulic engineers observing field conditions, aerial photography, and topographic maps decided that a significant part of the total study area would be subjected to shallow flooding for a flood of this frequency. In the City of Yuma, the hydrology for the Colorado River below the confluence with Gila River was obtained from the WPRS and the USACE (U.S. Department of the Interior, 1973; USACE, 1979). The WPRS has been assigned flood-control responsibility for the lower Colorado River by the Boulder Canyon Project Act and the Colorado River Front Work and Levee System Act. The WPRS operates and maintains the Colorado River Front Work, maintaining such things as flow records and hydrologic information. The WPRS and the USACE agreed to the flows shown in Table 4 for the Colorado River below the confluence with Gila River. For Yuma Main Canal, East Main Canal, West Main Canal, and the Union Pacific Railroad, the NRCS TR-20 computer program for hydrology (U.S. Department of Agriculture, 1965) was used to determine flood peaks at various points of concentration for canal for inflow and the quantity of flow for ponding areas located along the canals and the Union Pacific Railroad on the eastern side of the city. Information for the TR-20 computer program was based on USGS topographic maps (U.S. Department of the Interior, Yuma East, Arizona- California, 1965; U.S. Department of the Interior, Yuma West, Arizona- California, 1965), more detailed topographic maps (PRC Toups, 1978), and associated aerial photographs and field observations. This analysis was based on the conditions of present development. 13
18 Flooding Source and Location COLORADO RIVER Table 4: Summary of Discharges Drainage Area Peak Discharges (Cubic Feet per Second) (Square miles) 10-percent 2-percent 1-percent 0.2-percent Below confluence with Gila River 242, ,000 * 40,000 * Above 4 th Avenue bridge crossing 242,900 31,000 * 40,000 * Above confluence with Gila River 184, ,000 * 40,000 * At Needles 170,600 * * 40,000 * At Bullhead City 169,300 * * 40,000 * Just downstream of Piute Wash * * * 40,000 * Just downstream of Sacramento Wash * * * 40,000 * At Parker * * * 40,000 * At Palo Verde Dam * * * 40,000 * Just downstream of Tyson Wash * * * 40,000 * Just downstream of Arroyo Salada * * * 40,000 * At I-10/Blythe * * * 40,000 * Just downstream of Trigo Wash * * * 40,000 * Just downstream of Gould Wash * * * 40,000 * At Imperial Dam * * * 40,000 * At I-8/Yuma * * * 40,000 * 1 Approximate drainage area of USBR Gage No at Yuma Main Canal Wasteway at Yuma, Arizona 2 Approximate drainage area of USBR Gage No at Imperial Dam, Arizona/California, 15 miles NE of Yuma, Arizona * Data not available 14
19 Flooding Source and Location FORTUNA WASH Table 4: Summary of Discharges (continued) Drainage Area Peak Discharges (Cubic Feet per Second) (Square miles) 10-percent 2-percent 1-percent 0.2-percent At intersection with Gila Gravity Main Canal ,980 5,670 7,840 * Approximately 0.9 mile downstream of U.S. Highway ,610 4,620 6,390 * At intersection with U.S. Highway ,300 3,850 5,340 * Approximately 1.9 miles upstream of U.S. Highway 80 Approximately 2.0 miles upstream of U.S. Highway 80 FORTUNA WASH EAST FORK ,620 3,680 * ,970 2,750 * At mouth ,050 1,470 * GILA RIVER At Confluence with Colorado River 57, ,000 15,000 23,000 52,000 Approximately 0.9 mile downstream of Avenue 20E WASH A 57, ,945 * 26,310 * At apex of Fortuna Wash alluvial fan ,240 1,681 3,083 WASH B At apex of Fortuna Wash alluvial fan ,014 1,841 WASH C At apex of alluvial fan ,270 WASH D At apex of alluvial fan ,929 2,626 4,859 1 Approximate drainage area of USGS Gage No near Dome, Arizona, located 12 miles upstream from mouth * Data not available 15
20 3.2 Hydraulic Analyses Discharges for Fortuna Wash East Fork Split Channel, Split Channel 1, Split Channel 2, and Unnamed Tributary to Fortuna East Fork were obtained from the discharges of Fortuna Wash East Fork. Analyses of the hydraulic characteristics of flooding from the sources studied were carried out to provide estimates of the elevations of floods of the selected recurrence intervals. Users should be aware that flood elevations shown on the FIRM represent rounded whole-foot elevations and may not exactly reflect the elevations shown on the Flood Profiles or in the Floodway Data tables in the FIS report. Flood elevations shown on the FIRM are primarily intended for flood insurance rating purposes. For construction and/or floodplain management purposes, users are cautioned to use the flood elevation data presented in this FIS in conjunction with the data shown on the FIRM. Roughness coefficients (Manning s n ) used in the hydraulic computations were chosen by engineering judgment and were based on aerial photographs and field observations of the streams and floodplain areas. The acceptability of assumed hydraulic factors, cross sections, and bridge structure dimensions was checked by comparing calculated water surface elevations with historical information. Roughness factors for all streams studied by detailed methods are shown in Table 5, Manning s n Values. Table 5: Manning s n Values Stream Left Overbank Channel Right Overbanks Colorado River Fortuna Wash Fortuna Wash East Fork Gila River Flood profiles were drawn showing the computed water-surface elevations for floods of the selected recurrence intervals. Locations of selected cross sections used in the hydraulic analyses are shown on the Flood Profiles (Exhibit 1). For stream segments for which a floodway was computed (Section 4.2), selected cross-section locations are also shown on the FIRM (Exhibit 2). The downstream boundary (starting) conditions for both reaches were both known water surfaces from the existing effective reach of detailed study on Gila River. Qualifying bench marks within a given jurisdiction that are cataloged by the National Geodetic Survey (NGS) and entered into the National Spatial Reference System (NSRS) as First or Second Order Vertical and have a vertical stability classification of A, B, or C are shown and labeled on the FIRM with their 6- character NSRS Permanent Identifier. Bench marks cataloged by the NGS and entered into the NSRS vary widely in vertical stability classification. NSRS vertical stability classifications are as follows: 16
21 Stability A: Monuments of the most reliable nature, expected to hold position/elevation well (e.g., mounted in bedrock) Stability B: Monuments which generally hold their position/elevation well (e.g., concrete bridge abutment) Stability C: Monuments which may be affected by surface ground movements (e.g., concrete monument below frost line) Stability D: Mark of questionable or unknown vertical stability (e.g., concrete monument above frost line, or steel witness post) In addition to NSRS bench marks, the FIRM may also show vertical control monuments established by a local jurisdiction; these monuments will be shown on the FIRM with the appropriate designations. Local monuments will only be placed on the FIRM if the community has requested that they be included, and if the monuments meet the aforementioned NSRS inclusion criteria. Temporary vertical monuments are often established during the preparation of a flood hazard analysis for the purpose of establishing local vertical control. Although these monuments are not shown on the FIRM, they may be found in the Technical Support Data Notebook associated with the FIS report and FIRM for this community. Interested individuals may contact FEMA to access these data.the hydraulic analyses for this study were based on unobstructed flow. The flood elevations shown on the Flood Profiles are thus considered valid only if hydraulic structures remain unobstructed, operate properly, and do not fail. The exception to this statement is in the analysis of East Main Canal, where breaching of the canal was considered Methods for Flooding Sources with New or Revised Analyses in Current Study Analyses of the hydraulic characteristics of flooding from the sources studied by detailed methods were carried out to provide estimates of the elevations of floods of the selected recurrence intervals. Water-surface profiles were computed for detailed study streams through the use of the USACE HEC-RAS Version (HEC-RAS, Army Corps of Engineers, May 2005) and HEC-GeoRAS Version (HEC-GeoRAS, Army Corpos of Engineers, September 2005) computer programs. Water surface profiles were produced for the 10- and 1-percent annual chance events. HEC-GeoRAS was used to preprocess the required geometric data inside ArcGIS. Then HEC-RAS was used to determine the flood elevation at each cross section of the modeled stream. The starting water surface elevations for the Gila River model were determined by using a rating curve available at the Rockwood Weir, dated July 7, Cross sections for streams studied in detail were drawn based on 2 foot contour data. In addition, several natural floodplain cross sections were surveyed on each 17
22 stream. All bridges, diversion structures, and culverts were field checked to obtain elevation data and structural geometry. Two major hydraulic structures are present in the study area. The Avenue 20 East bridge crosses the Gila River approximately 1 mile above the downstream end of the study reach. The second hydraulic structure is the Avenue 30 East bridge, approximately 1 mile below the upstream end of the study reach. There are two non-certified levees located within the study area. The first noncertified levee is located north of the main Gila River channel between Avenue 24E and Avenue 26E. This levee was assumed to wash away during the 100-year event; therefore, it was not considered a permanent structure in the hydraulic modeling. The second non certified levee is aligned with County 10 th road and runs along the south side of the main Gila River channel between Avenue 24E and Avenue 26E. These non-certified levees were not considered to be permanent structures in the hydraulic modeling. The Gila River is divided by an island under high flow conditions into a main channel and a split channel. To accompany this split flow, the Gila River was modeled with four river reaches: Gila River Upstream, Gila River South Split, and Gila River Downstream on the main channel and Gila River North Split representing the north split flow region. Two junctions were created in the model to hydraulically connect the reaches together and accurately represent the hydraulic output. The Gila River diverges at approximately River Station 150,000 and the north and south splits reconverge at approximately River Station 136,000. Optimization of the model showed that 10% of the 100 year flow moved through the north split and 90% of the 100 year flow stayed within the Gila River Methods for Flooding Sources Incorporated from Previous Studies This section describes hydraulic analyses that were not revised for this revision of the countywide FIS. Water-surface elevations for floods of the selected recurrence intervals were computed through the use of the USACE HEC-2 stepbackwater computer program (USACE, 1976). For the Colorado River downstream of 4 th Avenue, the 1-percent-annual-chance flood water-surface elevations were determined by extrapolation of stagedischarge relationships from the HEC-2 backwater analysis. Cross sections used for the backwater analysis of streams studied by detailed methods were digitized from aerial photographs at a negative scale of 1:14,400 (Aerial Mapping Company, 1978; Aerial Mapping Company, 1980). Cross-section data on the Colorado River downstream of the City of Yuma, below the existing water-surface elevations, were obtained from the WPRS (Water and Power Resources Service, 1977). 18
23 Cross-section data not obtained by aerial photography below the water-surface elevations of the Colorado River, upstream of the City of Yuma and the confluence with the Gila River, were estimated by an iterative process. The iterative process involved using the known water-surface elevations and width of effective flow for the river as obtained from the aerial photography (Aerial Mapping Company, 1978; Aerial Mapping Company, 1980) and the known discharges from gage station records at the date of the photography. Using the known information with an estimated Manning's "n" value, a trapezoidal cross section was input to the HEC-2 computer program, and the cross-section invert elevation, bottom width, and side slopes were varied until the known watersurface profile was obtained. Structural geometry and elevation data for all bridges and culverts were obtained from highway construction plans (Arizona Department of Transportation, "Plan and Profile of Proposed State Highway, Ehrenburg-Phoenix") and from field measurements. The starting water-surface elevations for all streams studied by detailed methods, except the Gila River and Washes A, B, C, and D, were determined using the slope/area method. Runoff from the mesa above the city that enters East Main Canal would exceed the capacity of the canal, especially when irrigation flow is high in the canal, causing overtopping of the canal for the 1-percent-annual-chance flood. Because of the overtopping of East Main Canal and past occurrences of breaching within the study area, breaching was considered to occur along East Main Canal for the 1-percent-annual-chance flood. The flooding hazard caused by breaching of the canal banks was analyzed for canal banks exceeding 2 feet in height. Using Manning's equation, computations were performed to determine the distance required for flow through a break in the canal to spread out and be reduced to a depth of 1 foot. Assumptions used in the breaching analysis of East Main Canal are as follows: 1. Peak flow from the total drainage area contributing to the point of breach is concentrated at the point being analyzed for breaching. 2. Flows from a break in the canal banks will spread in the area below the canal at a symmetrical Canal breaching can occur at any point along the canal. Yuma Main Canal divides within the City of Yuma, forming East Main Canal and West Main Canal. As determined by HEC-2 step-backwater analysis, the 1- percent-annual-chance flood does not cause significant overtopping of West Main Canal. Gila Gravity Main Canal and Wellton-Mohawk Canal were not considered in danger of breaching because of storm runoff. Automatic wasteways exist at 19
24 intervals along the portions of the canals that were designed to convey storm runoff. These wasteways are activated by the rising water level in the canals and have the capacity to drain the design discharge of the canals without human intervention. Other portions of Gila Gravity Main and Wellton-Mohawk Canals are designed to convey intercepted storm runoff over the canal to the Gila River, eliminating the possibility of the breaching of the canal due to excess storm flow. To maintain a certain water level, Borrow Pit Lake receives Gila Gravity Main Canal water on a limited basis from the wasteway located to the north. Although no frequency analysis was made of the releases from this wasteway, an estimate of the maximum discharge the wasteway could release was made. This discharge, 1,280 cfs, was assigned the 1-percent-annual-chance frequency flood event from the wasteway. As a result of the hydraulic analysis of this wasteway release, Borrow Pit Lake was determined to have an assigned 1-percent-annual-chance lake elevation of 160 feet. Additional shallow flooding occurs in the areas adjacent to Borrow Pit Lake due to flow from the wasteway and these areas were assigned appropriate flood hazard zone designations. An alluvial fan flooding analysis was performed on the wash areas east of Fortuna Wash. The approach, as presented on the maps, treated all uncertainties in flow paths uniformly and the four major flooding sources as independent of each other. The alluvial fan computer program was used to determine the depth and velocity zones for flooding from the Wash A, B, C, and D (FEMA, 1982; U.S. Water Resources Council, 1976). The best available topographic mapping was used for approximate-study analyses (U.S. Department of the Interior, 1965; U.S. Department of the Interior, 1955, et cetera; U.S. Department of the Interior, 1965, et cetera; U.S. Department of the Interior, 1955). The extent of flooding in the approximate-study area on the Gila River from Ligurta to Texas Hill (approximately 47.3 miles) was based on information obtained from USGS Flood-Prone Area Maps (U.S. Department of the Interior, Flood-Prone Area Maps, 1965, et cetera). A hydrologic analysis was performed to determine 1-percent-annual-chance peak discharges at points along the Colorado River from Davis Dam to the U.S. Mexico border. Runoff from above Hoover Dam is typically the dominant contributing factor for flood flows, although combinations of releases from Davis and Parker Dams with flash floods originating from downstream watersheds also contribute to flood flows into the Colorado River and are significant in determining peak 1-percent-annual-chance discharges. Details regarding the methods used to calculate the peak discharges along the Colorado River are outlined in the USBR report titled "Flood Frequency Determinations for the Lower Colorado River," Volume I, Supporting Hydrologic Documents of the Colorado River Floodway Protection Act of 1986, dated March Hydraulic routing was completed using the Dynamic Wave Routing Model (DWOPER) computer program. The Base (1-percent-annual-chance) Flood Elevations (BFEs) along the Colorado River were computed by assuming that the 20
25 floodway fringe would not convey any portion of the flood flow. Cross sections used in the hydraulic computer model include both channel and overflow areas and reflect hydrographic surveys taken by the USBR. The DWOPER hydraulic model was calibrated using known hourly flow values from Davis and Parker Dams and the observed gage records below the two dams resulting from the known flows. Final maps of the Colorado River floodway were published by USBR at a scale of 1"=2,000' with 1-percent-annual-chance flood elevations in NGVD 29. These flood elevations have been converted to NAVD 88 for the FIRM and this report using a conversion offset of 2.2 feet (for Yuma, Imperial, La Paz, and Riverside Counties) and 2.3 feet (for Mohave and San Bernardino Counties). The flood hazard data produced as part of Public Law is summarized for river mile markers in Table 8, Floodway Data, for the Colorado River. Peak discharges are listed in Table 4. Flood profiles for the Colorado River are not included because the available flood elevation data is included in the Floodway Data tables. Flood insurance is not available for structures in the Colorado River Floodway built or substantially improved on or after April 8, Starting water-surface elevations for the detailed-study areas of the Colorado River were based on the slope/area method. The flatness of the land causes local rainfall to run off in a sheet flow pattern and become ponded at depths of less than 1.0 foot behind manmade features and in local depressions. Therefore, most of the city is designated as Zone X (shaded) as determined by field investigations by experienced hydraulic engineers and by local observations during heavy rainfall Behind-Levee Analyses Some flood hazard information presented in prior FIRMs and in prior FIS reports for Yuma County and its incorporated communities was based on flood protection provided by levees. Based on the information available and the mapping standards of the NFIP at the time that the prior FISs and FIRMs were prepared, FEMA accredited the levees as providing protection from the flood that has a 1-percent-annual-chance of being equaled or exceeded in any given year. For FEMA to continue to accredit the identified levees with providing protection from the base flood, the levees must meet the criteria of the Code of Federal Regulations, Title 44, Chapter I, Section (44 CFR 65.10), titled "Mapping of Areas Protected by Levee Systems." On August 22, 2005, FEMA issued "Procedure Memorandum No. 34 Interim Guidance for Studies Including Levees." The purpose of the memorandum was to help clarify the responsibility of community officials or other parties seeking recognition of a levee by providing information identified during a study/mapping project. Often, documentation regarding levee design, accreditation, and the impacts on flood hazard mapping is outdated or missing altogether. To remedy this, Procedure Memorandum No. 34 provides interim 21
26 guidance on procedures to minimize delays in near-term studies/mapping projects, to help our mapping partners properly assess how to handle levee mapping issues. While documentation related to 44 CFR is being compiled, the release of a more up-to-date FIRM for other parts of a community or county may be delayed. To minimize the impact of the levee recognition and certification process, FEMA issued "Procedure Memorandum No. 43 Guidelines for Identifying Provisionally Accredited Levees" on March 16, These guidelines allow issuance of the FIS and FIRM while levee owners or communities compile full documentation required to show compliance with 44 CFR The guidelines also explain that a FIRM can be issued while providing the communities and levee owners with a specified timeframe to correct any maintenance deficiencies associated with a levee and to show compliance with 44 CFR FEMA contacted the communities within Yuma County to obtain data required under 44 CFR to continue to show the levees as providing protection from the flood that has a 1-percent-annual-chance of being equaled or exceeded in any given year. FEMA understood that it may take time to acquire and/or assemble the documentation necessary to fully comply with 44 CFR Therefore, FEMA put forth a process to provide the communities with additional time to submit all the necessary documentation. For a community to avail itself of the additional time, it had to sign an agreement with FEMA. Levees for which such agreements were signed are shown on the final effective FIRM as providing protection from the flood that has a 1-percent-annual-chance of being equaled or exceeded in any given year and labeled as a Provisionally Accredited Levee (PAL). Communities have two years from the date of FEMA's initial coordination to submit to FEMA final accreditation data for all PALs. Following receipt of final accreditation data, FEMA will revise the FIS and FIRM as warranted. FEMA coordinated with the local communities, Bureau of Reclamation, and other organizations to compile a list of levees based on information from the FIRM and community provided information. Approximate analyses of "behind levee" flooding were conducted for all the levees to indicate the extent of the "behind levee" floodplains. The methodology used in these analyses is discussed below. Road or railroad embankment with inventory ID # 2 is located on the Gila River. Runoff from up gradient areas drains towards Palomas Road and flows along the north side of the road. Using topography from the USGS (i.e., 10m DEMs) the drainage area to the road was determined to be 29 sq. mi. with a 1-percentannual-chance discharge of 8,040 cfs. Some of the terrain south of the road is alluvial fan in nature. An alluvial fan analysis found that the width of a fan south of the road would extend 14,000 feet to the south of the road. Based on engineering judgment, the approximate areas of 1-percent-annual-chance flooding in the event of failure of the levees was determined to extend to 14,000 22
27 feet south of the road for the length of the road where the Zone A was delineated north of the road in the effective FIS. As the depth of flow was estimated to be less than 1 foot, this floodplain was delineated as a shaded Zone X. Road or railroad embankment with inventory ID # 4 is located on the Colorado River. The BOR has prepared workmaps for this part of the Colorado River. The approximate areas of 1-percent-annual-chance flooding in the event of failure of the levees were determined based on redelineation of the Colorado River base flood elevation on the landward side of the levees using topographic information from the USGS (i.e., 10m DEMs). Road or railroad embankments with inventory IDs # 6, 7, and 8 are located on the Gila River and unnamed side washes. Based on the FIS and topographic information from the USGS (i.e., 10m DEMs), the shaded Zone X areas to the north and east were recommended as the approximate areas of 1-percent-annual-chance flooding in the event of failure of the levees. Road or railroad embankment with inventory ID # 15 is located on Fortuna Wash Tributary C. Based on the FIS and topographic information from the USGS (i.e., 10m DEMs), no change in flood hazards at this location were recommended. Levee with inventory ID # 20 is located on the Gila River and unnamed side washes. Based on the FIS and topographic information from the USGS (i.e., 10m DEMs), the approximate areas of 1-percent-annual-chance flooding in the event of failure of the levees were determined. Levee with inventory ID # 21 is located on the Gila River and unnamed side washes. Yuma County Department of Development Services provided and analysis that computed the flood depths downstream from this structure to be below 1 foot. Based on this analysis, no change in the flood hazards at this location was recommended Levee with inventory ID # 22 is located on the Gila River and unnamed side washes. Based on the HS and topographic information from the USGS (i.e., 10m DEMs), the approximate areas of 1-percent-annual-chance flooding in the event of failure of the levees were determined. Levee with inventory ID # 23 is located on the Gila River and unnamed side washes. Based on the FIS and topographic information from the USGS (i.e., 10-meter DEMs), the shaded Zone X areas on the landward side of the levee were recommended as the approximate areas of 1-percent-annual-chance flooding in the event of failure of the levees. Levees with inventory IDs # 24 and 25 are located on the Gila River and unnamed side washes. Based on the FIS and topographic information from the USGS (i.e., 10m DEMs), the approximate areas of 1-percent-annual-chance flooding in the event of failure of the levees were determined. Levee with inventory ID # 26 is located on the Gila River, Dome Canal, Long Mountain Wash, and unnamed side washes. Based on the FIS and topographic information from the USGS (i.e., 10m DEMs), the approximate areas of 1-23
28 percent-annual-chance flooding in the event of failure of the levees were determined. Levee with inventory ID # 27 is located on an unnamed wash. Based on the FIS and topographic information from the USGS (i.e., 10m DEMs), approximate areas of 1-percent-annual-chance flooding in the event of failure of the levees were determined based on engineering judgment. Levee with inventory ID # 28 is located on the Gila River and an unnamed wash. Based on the FIS and topographic information from the USGS (i.e., 10m DEMs), approximate areas of 1-percent-annual-chance flooding in the event of failure of the levees were determined based on engineering judgment. Road or railroad embankment with inventory ID # 29 is located on the Gila River and an unnamed wash. Based on the FIS and topographic information from the USGS (i.e., 10m DEMs), approximate areas of 1-percent-annual-chance flooding in the event of failure of the levees were determined based on engineering judgment. Levee with inventory ID # 30 is located on the Gila River and Mohawk Canal. Based on the FIS and topographic information from the USGS (i.e., 10m DEMs), approximate areas of 1-percent-annual-chance flooding in the event of failure of the levees were determined based on engineering judgment. Levees with inventory IDs # 31 and 32 are located on the Wellton-Mohawk Canal. Based on the FIS and topographic information from the USGS (i.e., 10m DEMs), approximate areas of 1-percent-annual-chance flooding in the event of failure of the levees were determined based on engineering judgment. Levee with inventory ID # 33 (aka 77) is located on the Gila River and Main Outlet Drain. Portions of this levee as 77 are PAL levees under USBR. The approximate areas of 1-percent-annual-chance flooding in the event of failure of the levees were determined based on redelineation of the Gila River base flood elevations on the landward side of the levees using topographic information from the USGS (i.e., 10m DEMs). Levee with inventory ID # 35 is located on the Wellton Canal. This levee is located in the approximate area of 1-percent-annual-chance flooding in the event of failure of levee # 41. Therefore, the approximate areas of 1-percent-annualchance flooding in the event of failure of this levee were not computed. Levee with inventory ID # 36 is located on the Mohawk Canal. Based on the FIS and topographic information from the USGS (i.e., 10m DEMs), approximate areas of 1-percent-annual-chance flooding in the event of failure of the levees were determined based on engineering judgment. Road or railroad embankment with inventory ID # 37 is located on the Gila River and an unnamed wash. Based on the FIS and topographic information from the USGS (i.e., 10m DEMs), approximate areas of 1-percent-annual-chance flooding 24
29 in the event of failure of the levees were determined based on engineering judgment. Levee with inventory ID # 38 is located on Tenmile Wash. Based on the F1S and topographic information from the USGS (i.e., 10m DEMs), approximate areas of 1-percent-annual-chance flooding in the event of failure of the levees were determined based on engineering judgment. Levee with inventory ID # 41 is located on the Mohawk Canal. The FIS indicates that numerous streams flow north towards this levee. Hydraulic analyses for similar streams indicated an average depth of 2 feet. Based on topographic information from the USGS (i.e., 10m DEMs) and a flow depth of 2 feet, the approximate areas of 1-percent-annual-chance flooding in the event of failure of the levees were determined. Levee with inventory ID # 42 is located on the Mohawk Canal and an unnamed channel. Based on the F1S and topographic information from the USGS (i.e., 10m DEMs), the approximate areas of 1-percent-annual-chance flooding in the event of failure of the levees were determined. Road or railroad embankment with inventory ID # 43 is located on an unnamed wash. Based on the FIS and topographic information from the USGS (i.e., 10-meter DEMs), the approximate areas of 1-percent-annual-chance flooding in the event of failure of the levees were determined. Road or railroad embankment with inventory ID # 44 is located on an unnamed wash. Based on the FIS and topographic information from the U.S. Geological Survey (i.e. 10m DEMs), approximate areas of 1-percent-annual-chance flooding in the event of failure of the levees were determined based on engineering judgment. Levee structure with inventory ID # 51 is located on an unnamed wash near the Mittry Lake area. Based on the F1S and topographic information from the USGS (i.e., 10m DEMs), the approximate areas of 1-percent-annual-chance flooding in the event of failure of the levee was determined. Levee structure with inventory ID # 90 is located on the Colorado River. Based on the FIS and topographic information from the USGS (i.e., 10m DEMs), the approximate areas of 1-percent-annual-chance flooding in the event of failure of the levee was determined. Levee structures with inventory IDs # 45 (aka 88), 78, 79, 84, 89, and 91 are located on the Colorado River. The Yuma County Flood Control District and the BOR have provided workmaps for entire reach of Colorado River. Where available, the approximate areas of 1-percent-annual-chance flooding in the event of failure of the levees were obtained from the Yuma County Flood Control District workmap. For other areas, the approximate areas of 1-percent-annualchance flooding in the event of failure of the levees were determined based on redelineation of the Colorado River base flood elevations on the landward side of 25
30 3.3 Vertical Datum the levees using topographic information provided by Yuma County Department of Development Services or from the USGS (i.e., 10m DEMs). No levee protected areas were shown where the 1% floodplain is contained by natural grade within levees. All FIS reports and FIRMs are referenced to a specific vertical datum. The vertical datum provides a starting point against which flood, ground, and structure elevations can be referenced and compared. Until recently, the standard vertical datum used for newly created or revised FIS reports and FIRMs was the National Geodetic Vertical Datum of 1929 (NGVD). With the completion of the North American Vertical Datum of 1988 (NAVD), many FIS reports and FIRMs are now prepared using NAVD 88 as the referenced vertical datum. Flood elevations shown in this FIS report and on the FIRM are referenced to the NAVD 88. Ground, structure, and flood elevations may be compared to NGVD 29 by applying a standard conversion factor. The conversion from NGVD 29 to NAVD 88 ranged between 2.15 and 3.06 for this county. Accordingly, due to the statistically significant range in conversion factors, an average conversion factor could not be established for the entire county. The elevations shown in the FIS report and on the FIRM were, therefore, converted to NAVD 88 using a stream-by-stream approach. In this method, an average conversion was established for each flooding source and applied accordingly. The conversion factor for each flooding source in the community may be found in the following table as well as on the FIRM. The vertical datum conversion values used for this countywide study are included in Table 6, "Vertical Datum Conversion Table". Table 6: Vertical Datum Conversion Table Flooding Source Vertical Datum Conversion (ft) Colorado River Conversion +2.2 (feet) Fortuna Wash +2.2 Fortuna Wash East Fork +2.2 Fortuna Wash East Fork Split Channel +2.2 Fortuna Wash Tributary B +3.1 Fortuna Wash Tributary C +3.1 Gila River +2.2 Split Channel Split Channel Unnamed Tributary to Fortuna Wash East Fork
31 Flooding Source Vertical Datum Conversion (ft) Example: To convert Fortuna Wash elevations to NAVD Conversion 88, 2.2 feet (feet) were added to the NGVD 29 elevations. Users who wish to convert the elevations in this FIS to NGVD 29 should apply the stated conversion factor(s) to elevations shown on the Flood Profiles and supporting data tables in the FIS report, which are shown at a minimum to the nearest 0.1 foot. For information regarding conversion between the NGVD and NAVD, see the FEMA publication entitled Converting the National Flood Insurance Program to the North American Vertical Datum of 1988 (Reference 2), visit the National Geodetic Survey website at Hwww.ngs.noaa.govH, or contact the National Geodetic Survey at the following address: NGS Information Services NOAA, N/NGS12 National Geodetic Survey SSMC-3, # East-West Highway Silver Spring, Maryland (301) To obtain current elevation, description, and/or location information for benchmarks shown on this map, please contact the Information Services Branch of the NGS at (301) , or visit their website at FLOODPLAIN MANAGEMENT APPLICATIONS The NFIP encourages State and local governments to adopt sound floodplain management programs. To assist in this endeavor, each FIS report provides 1-percent-annual-chance floodplain data, which may include a combination of the following: 10-, 2-, 1-, and 0.2-percentannual-chance flood elevations; delineations of the 1- and 0.2-percent-annual-chance floodplains; and a 1-percent-annual-chance floodway. This information is presented on the FIRM and in many components of the FIS report, including Flood Profiles, Floodway Data tables, and Summary of Stillwater Elevation tables. Users should reference the data presented in the FIS report as well as additional information that may be available at the local community map repository before making flood elevation and/or floodplain boundary determinations. 4.1 Floodplain Boundaries To provide a national standard without regional discrimination, the 1-percent-annualchance flood has been adopted by FEMA as the base flood for floodplain management purposes. The 0.2-percent-annual-chance flood is employed to indicate additional areas of flood risk in the community. 27
32 The 1- and 0.2-percent-annual-chance floodplain boundaries for streams studied by detailed methods are shown on the FIRM (Exhibit 2). On this map, the 1-percent-annualchance floodplain boundary corresponds to the boundary of the areas of special flood hazards (Zones A, AE, AH, and AO), and the 0.2-percent-annual-chance floodplain boundary corresponds to the boundary of areas of moderate flood hazards. In cases where the 1- and 0.2-percent-annual-chance floodplain boundaries are close together, only the 1-percent-annual-chance floodplain boundary has been shown. Small areas within the floodplain boundaries may lie above the flood elevations, but cannot be shown due to limitations of the map scale and/or lack of detailed topographic data Methods for Flooding Sources with New or Revised Analyses For the streams studied in detail, the 1-percent-annual-chance floodplain boundaries have been delineated using the flood elevations determined at each cross section. Between cross sections, the boundaries were interpolated using topographic maps at scales of 1:12,000 with contour intervals of 2 feet Methods for Flooding Sources Incorporated from Previous Studies For the streams studied in detail, except Washes A, B, C, and D, the 1-percentannual-chance floodplain boundaries have been delineated using the flood elevations determined at each cross section. Between cross sections, the boundaries were interpolated using topographic maps at scales of 1:1,200, with a contour interval of 2 feet (Water and Power Resources Service, 1977); 1:4,800, with a contour interval of 4 feet (PRC Toups Corporation, 1978; PRC Toups Corporation, 1980); and 1:24,000, with contour intervals of 5 and 20 feet (U.S. Department of the Interior, Yuma East, Arizona-California, 1965; U.S. Department of the Interior, Yuma West, Arizona-California, 1965, et cetera). The flood boundaries of the alluvial fans on Washes A, B, C, and D were determined through aerial photo interpretation, topographic map inspection, and field reconnaissance. Fan boundaries were delineated on topographic maps with a scale of 1:10,000 and a contour interval of 4 feet (Kenny Aerial Mapping, 1984), and on topographic maps at a scale of 1:24,000, with a contour interval of 20 feet (U.S. Department of the Interior, 1965, et cetera). Fan arc widths for the depth and velocity zones were determined for each source of alluvial fan flooding by computer modeling (FEMA, 1982) and then applied to the topographic maps assuming statistical independence, at the proper locations to produce the combined flood hazard zone boundaries shown on the map, based on the probability of the union of the independent events. For stream channels designated as "Zone A Contained in Channel," the 1- percent-annual-chance floodplain boundaries are based on existing channel alignment and right-of-way. Approximate floodplain boundaries for the Gila River were delineated using topographic maps at a scale of 1:24,000, with contour intervals of 5, 10, 20, and 28
33 4.2 Floodways 40 feet (U.S. Department of the Interior, 1965; U.S. Department of the Interior, 1955, et cetera; U.S. Department of the Interior, 1965, et cetera; U.S. Department of the Interior, 1955). Approximate floodplain boundaries in some portions of the study area were taken from the FIRM (FEMA, 1985). For the flooding sources studied by approximate methods, the boundaries of the 1-percent-annual-chance floodplains were delineated using topographic maps taken from the previously printed FIS reports, FHBMs, and/or FIRMS for all of the incorporated and unincorporated jurisdictions within Yuma County. For streams studied by approximate methods, only the 1-percent-annual-chance floodplain boundary is shown on the FIRM (Exhibit 2). No floodway was calculated for streams studied by approximate methods Encroachment on floodplains, such as structures and fill, reduces flood-carrying capacity, increases flood heights and velocities, and increases flood hazards in areas beyond the encroachment itself. One aspect of floodplain management involves balancing the economic gain from floodplain development against the resulting increase in flood hazard. For purposes of the NFIP, a floodway is used as a tool to assist local communities in this aspect of floodplain management. Under this concept, the area of the 1-percentannual-chance floodplain is divided into a floodway and a floodway fringe. The floodway is the channel of a stream, plus any adjacent floodplain areas, that must be kept free of encroachment so that the base flood can be carried without substantial increases in flood heights. Minimum Federal standards limit such increases to 1 foot, provided that hazardous velocities are not produced. The floodways in this study are presented to local agencies as minimum standards that can be adopted directly or that can be used as a basis for additional floodway studies. The floodways presented in this study were computed for certain stream segments on the basis of equal-conveyance reduction from each side of the floodplain. The FIRM for Yuma County and incorporated areas reflects flood hazard data produced as a result of the Colorado Floodway Protection Act passed by Congress in 1986 (Public Law ). The act was passed to establish a floodway along the Colorado River from Davis Dam to the U.S. Mexico border. The hydrologic and hydraulic analyses and floodway mapping for the Colorado River were prepared by the Colorado River Floodway Task Force and the USBR. Floodway widths were computed at cross sections. Between cross sections, the floodway boundaries were interpolated. The results of the floodway computations are tabulated for selected cross sections (Table 7). The computed floodways are shown on the FIRM (Exhibit 2). In cases where the floodway and 1-percent-annual-chance floodplain boundaries are either close together or collinear, only the floodway boundary is shown. 29
34 Portions of the floodway widths for the Colorado River extend beyond the county boundary. In the case of shallow flooding on an alluvial fan, flow paths are highly unpredictable and subject to sudden changes in direction. Because this type of flooding is over land without a stable and consistent flow path to serve as a point of orientation around which to establish land-use control areas, delineation of a floodway meeting Federal Insurance Administration criteria is impossible. Therefore, no floodways were developed for the areas of Washes A, B, C, and D. Encroachment into areas subject to inundation by floodwaters having hazardous velocities aggravates the risk of flood damage and heightens potential flood hazards by further increasing velocities. A listing of stream velocities at selected cross sections is provided in Table 8, Floodway Data. To reduce the risk of property damage in areas where the stream velocities are high, the community may wish to restrict development in areas outside the floodway. The area between the floodway and 1-percent-annual-chance floodplain boundaries is termed the floodway fringe. The floodway fringe encompasses the portion of the floodplain that could be completely obstructed without increasing the water-surface elevation (WSEL) of the base flood more than 1 foot at any point. Typical relationships between the floodway and the floodway fringe and their significance to floodplain development are shown in Figure 1. Figure 1. Floodway Schematic 30
35
36
37
38 FLOODING SOURCE CROSS SECTION DISTANCE 1 WIDTH (FEET) FLOODWAY SECTION AREA (SQUARE FEET) MEAN VELOCITY (FEET PER SECOND) REGULATORY (FEET NAVD 88) BASE FLOOD WATER SURFACE ELEVATION WITHOUT FLOODWAY (FEET NAVD 88) WITH FLOODWAY (FEET NAVD 88) INCREASE (FEET) Coyote Wash A B C D E F G H I J K L M N O P Q R S T Feet above confluence with Gila River 2 Elevation computed without consideration for backwater effects from Gila River. TABLE 7 FEDERAL EMERGENCY MANAGEMENT AGENCY YUMA COUNTY, AZ AND INCORPORATED AREAS FLOODWAY DATA COYOTE WASH
39 FLOODING SOURCE CROSS SECTION DISTANCE WIDTH (FEET) FLOODWAY SECTION AREA (SQUARE FEET) MEAN VELOCITY (FEET PER SECOND) REGULATORY (FEET NAVD 88) BASE FLOOD WATER SURFACE ELEVATION WITHOUT FLOODWAY (FEET NAVD 88) WITH FLOODWAY (FEET NAVD 88) INCREASE (FEET) Coyote Wash (continued) U V W X Y Z AA AB AC AD AE AF AG AH AI TABLE 7 FEDERAL EMERGENCY MANAGEMENT AGENCY YUMA COUNTY, AZ AND INCORPORATED AREAS FLOODWAY DATA COYOTE WASH
40 FLOODING SOURCE CROSS SECTION DISTANCE 1 WIDTH (FEET) FLOODWAY SECTION AREA (SQUARE FEET) MEAN VELOCITY (FEET PER SECOND) REGULATORY (FEET NAVD 88) BASE FLOOD WATER SURFACE ELEVATION WITHOUT WITH FLOODWAY FLOODWAY (FEET NAVD 88) (FEET NAVD 88) INCREASE (FEET) A 1, , B 1, , C 2, , D 3, E 4, , F 5, , G 6, , H 7, , I 7, , J 7, , K 7, , L 8, , M 9, , N 10, , O 10, , P 10, , Q 11, , R 11, S 11, , T 12, , U 12, , V 12, , W 13, , X 13, Y 14, , Z 15, Feet above confluence with Gila River 2 Elevation computed without consideration of backwater effects from Gila River TABLE 7 FEDERAL EMERGENCY MANAGEMENT AGENCY YUMA COUNTY, AZ AND INCORPORATED AREAS FLOODWAY DATA FORTUNA WASH
41
42
43
44
45 TABLE 7 FLOODING SOURCE CROSS SECTION DISTANCE 1 WIDTH (FEET) FLOODWAY SECTION AREA (SQUARE FEET) MEAN VELOCITY (FEET PER SECOND) REGULATORY (FEET NAVD 88) BASE FLOOD WATER SURFACE ELEVATION WITHOUT FLOODWAY (FEET NAVD 88) WITH FLOODWAY (FEET NAVD 88) INCREASE (FEET) Gila River A 1,641 1,000 9, B 3,721 1,165 8, C 5,092 1,370 6, D 6,138 1,070 6, E 7,376 1,220 7, F 8,782 1,160 8, G 10,016 1,180 7, H 11,836 1,388 11, I 14,338 1,860 11, J 16,334 2,072 12, K 17,493 1,117 6, L 19,645 1,008 11, M 19, , N 21,451 2,495 19, O 22,405 2,593 14, P 26, , Q 27, , R 29,775 1,991 15, S 31,584 1,497 12, T 32,811 1,520 11, Feet above confluence with Colorado River 2 Elevation computed without consideration of Backwater effects from Colorado River FEDERAL EMERGENCY MANAGEMENT AGENCY YUMA COUNTY, AZ AND INCORPORATED AREAS FLOODWAY DATA GILA RIVER
46 TABLE 7 FLOODING SOURCE CROSS SECTION DISTANCE 1 WIDTH (FEET) FLOODWAY SECTION AREA (SQUARE FEET) MEAN VELOCITY (FEET PER SECOND) REGULATORY (FEET NAVD 88) BASE FLOOD WATER SURFACE ELEVATION WITHOUT FLOODWAY (FEET NAVD 88) WITH FLOODWAY (FEET NAVD 88) INCREASE (FEET) Gila River (continued) U 33,828 1,434 10, V 35,122 1,605 9, W 36,625 1,853 11, X 38,036 1,725 9, Y 39,268 1, , Z 40, , AA 41,798 1,136 9, AB 43, , AC 44, , AD 46, , AE 47, , AF 48,478 1,250 11, AG 49,385 1,026 8, AH 50, , Al 53,515 1,352 10, AJ 56,613 2,500 15, AK 57,770 2,421 13, AL 58,891 2,063 10, AM 62, , AN 64, , Feet above confluence with Colorado River 2 Width computed without consideration of combined floodway with Fortuna Wash FEDERAL EMERGENCY MANAGEMENT AGENCY YUMA COUNTY, AZ AND INCORPORATED AREAS FLOODWAY DATA GILA RIVER
47 TABLE 7 FLOODING SOURCE CROSS SECTION DISTANCE 1 WIDTH (FEET) FLOODWAY SECTION AREA (SQUARE FEET) MEAN VELOCITY (FEET PER SECOND) REGULATORY (FEET NAVD 88) BASE FLOOD WATER SURFACE ELEVATION WITHOUT FLOODWAY (FEET NAVD 88) WITH FLOODWAY (FEET NAVD 88) INCREASE (FEET) Gila River (continued) AO 66, , AP 68, , AQ 69,690 1,239 8, AR 71, , AS 74,260 1,585 11, AT 77,130 1,119 10, AU 77,592 1,200 6, AV 79,017 1,400 10, AW 80,232 1,350 9, AX 81,763 1,550 6, AY 83,241 1,820 9, AZ 85,142 3,624 15, BA 89,260 3,193 10, BB 90,739 2,495 8, BC 92,164 2,150 5, BD 95,227 1,900 12, BE 96,864 1,662 11, BF 98,553 1,819 9, BG 100,296 2,314 12, BH 101,721 2,718 13, Feet above confluence with Colorado River FEDERAL EMERGENCY MANAGEMENT AGENCY YUMA COUNTY, AZ AND INCORPORATED AREAS FLOODWAY DATA GILA RIVER
48 TABLE 7 FLOODING SOURCE CROSS SECTION DISTANCE 1 WIDTH (FEET) FLOODWAY SECTION AREA (SQUARE FEET) MEAN VELOCITY (FEET PER SECOND) REGULATORY (FEET NAVD 88) BASE FLOOD WATER SURFACE ELEVATION WITHOUT FLOODWAY (FEET NAVD 88) WITH FLOODWAY (FEET NAVD 88) INCREASE (FEET) Gila River (continued) BI 103,305 2,620 13, BJ 104,942 1,471 5, BK 106,473 1,290 7, BL 108,004 1,450 8, BM 110,961 1,711 10, BN 114,024 1,382 5, BO 116, , BP 117,934 3,036 24, BQ 119,305 3,178 18, BR 120,782 2,969 21, BS 122,562 2,552 17, BT 124,357 2,222 16, BU 125,527 2,579 19, BV 126,912 1,957 13, BW 128,068 1,864 9, BX 129,284 1,658 9, BY 130,585 2,101 12, BZ 132,073 1,989 12, CA 133,271 2,276 12, CB 134,702 3,121 12, Feet above confluence with Colorado River FEDERAL EMERGENCY MANAGEMENT AGENCY YUMA COUNTY, AZ AND INCORPORATED AREAS FLOODWAY DATA GILA RIVER
49 TABLE 7 FLOODING SOURCE CROSS SECTION DISTANCE 1 WIDTH (FEET) FLOODWAY SECTION AREA (SQUARE FEET) MEAN VELOCITY (FEET PER SECOND) REGULATORY (FEET NAVD 88) BASE FLOOD WATER SURFACE ELEVATION WITHOUT FLOODWAY (FEET NAVD 88) WITH FLOODWAY (FEET NAVD 88) INCREASE (FEET) Gila River (continued) CC 136,025 3,739 22, CD 137,142 3,880 12, CE 138,234 3,888 14, CF 139,378 3,895 13, CG 140,567 3,655 15, CH 141,769 3,504 14, CI 143,192 3,336 14, CJ 144,485 2,817 14, CK 145,834 1,775 9, CL 146,932 1,480 9, CM 147,854 1,414 8, CN 149,355 1,559 8, CO 150,742 1,908 15, CP 151,759 1,848 10, CQ 152,838 1,774 10, CR 154,260 1,263 9, CS 155,691 1,026 9, CT 157,063 1,379 13, CU 158,744 2,354 18, CV 160,485 2,694 19, CW 161,707 3,465 18, Feet above confluence with Colorado River FEDERAL EMERGENCY MANAGEMENT AGENCY YUMA COUNTY, AZ AND INCORPORATED AREAS FLOODWAY DATA GILA RIVER
50 TABLE 7 FLOODING SOURCE CROSS SECTION DISTANCE 1 WIDTH (FEET) FLOODWAY SECTION AREA (SQUARE FEET) MEAN VELOCITY (FEET PER SECOND) REGULATORY (FEET NAVD 88) BASE FLOOD WATER SURFACE ELEVATION WITHOUT FLOODWAY (FEET NAVD 88) WITH FLOODWAY (FEET NAVD 88) INCREASE (FEET) Gila River (continued) CX 163,259 3,644 22, CY 164,593 3,907 21, CZ 165,819 4,025 19, DA 167,055 4,314 16, DB 168,795 5,103 20, DC 169,856 5,339 16, DD 171,060 5,639 17, DE 172,462 6,186 18, DF 173,654 5,596 17, DG 174,967 3,444 12, DH 176,136 3,029 11, DI 177,586 3,076 13, DJ 178,759 3,302 14, DK 180,253 3,399 18, DL 181,374 3,663 16, DM 182,915 3,956 20, DN 184,430 3,950 15, Feet above confluence with Colorado River FEDERAL EMERGENCY MANAGEMENT AGENCY YUMA COUNTY, AZ AND INCORPORATED AREAS FLOODWAY DATA GILA RIVER
51 5.0 INSURANCE APPLICATIONS For flood insurance rating purposes, flood insurance zone designations are assigned to a community based on the results of the engineering analyses. These zones are as follows: Zone A Zone A is the flood insurance rate zone that corresponds to the 1-percent-annual-chance floodplains that are determined in the FIS report by approximate methods. Because detailed hydraulic analyses are not performed for such areas, no base (1-percent-annual-chance) flood elevations (BFEs) or depths are shown within this zone. Zone AE Zone AE is the flood insurance rate zone that corresponds to the 1-percent-annual-chance floodplains that are determined in the FIS report by detailed methods. Whole-foot BFEs derived from the detailed hydraulic analyses are shown at selected intervals within this zone. Zone AH Zone AH is the flood insurance rate zone that corresponds to the areas of 1-percent-annualchance shallow flooding (usually areas of ponding) where average depths are between 1 and 3 feet. Whole-foot BFEs derived from the detailed hydraulic analyses are shown at selected intervals within this zone. Zone AO Zone AO is the flood insurance risk zone that corresponds to the areas of 1-percent-annualchance shallow flooding (usually sheet flow on sloping terrain) where average depths are between 1 and 3 feet. Average whole-foot base flood depths derived from the detailed hydraulic analyses are shown within this zone. Zone X Zone X is the flood insurance rate zone that corresponds to areas outside the 0.2-percent-annual-chance floodplain, areas within the 0.2-percent-annual-chance floodplain, areas of 1-percent-annual-chance flooding where average depths are less than 1 foot, areas of 1-percent-annual-chance flooding where the contributing drainage area is less than 1 square mile (sq. mi.), and areas protected from the base flood by levees. No BFEs or depths are shown within this zone. Zone D Zone D is the flood insurance rate zone that corresponds to unstudied areas where flood hazards are undetermined, but possible. 47
52 6.0 FLOOD INSURANCE RATE MAP The FIRM is designed for flood insurance and floodplain management applications. For flood insurance applications, the map designates flood insurance rate zones as described in Section 5.0 and, in the 1-percent-annual-chance floodplains that were studied by detailed methods, shows selected whole-foot BFEs or average depths. Insurance agents use zones and BFEs in conjunction with information on structures and their contents to assign premium rates for flood insurance policies. For floodplain management applications, the map shows by tints, screens, and symbols, the 1- and 0.2-percent-annual-chance floodplains, floodways, and the locations of selected cross sections used in the hydraulic analyses and floodway computations. The current FIRM presents flooding information for the entire geographic area of Yuma County. Previously, separate Flood Hazard Boundary Maps and/or FIRMs were prepared for each incorporated community and the unincorporated areas of the County identified as flood-prone. This countywide FIRM also includes flood-hazard information that was presented separately on Flood Boundary and Floodway Maps (FBFMs), where applicable. Historical data relating to the maps prepared for each community are presented in Table 8, Community Map History. 7.0 OTHER STUDIES Information pertaining to revised and unrevised flood hazards for each jurisdiction within Yuma County was compiled into the previous countywide FIS, which was used as the basis for this study. Therefore, this FIS supersedes all previously printed FIS Reports, FHBMs, FBFMs, and FIRMs for all of the incorporated and unincorporated jurisdictions within Yuma County. 8.0 LOCATION OF DATA Information concerning the pertinent data used in the preparation of this study can be obtained by contacting Federal Emergency Management Agency, Region IX, 1111 Broadway, Suite 1200, Oakland, CA
53 TABLE 8 COMMUNITY NAME INITIAL IDENTIFICATION FLOOD HAZARD BOUNDARY MAP REVISIONS DATE FIRM EFFECTIVE DATE FIRM REVISIONS DATE San Luis, City of April 12, 1974 September 13, 1974 April 18, 1978 December 15, 1983 November 15, 1985 September 30, 1988 February 17, 1989 Somerton, City of August 28, August 28, Wellton, Town of April 12, 1974 September 13, 1974 April 18, 1978 December 15, Yuma, City of April 12, 1974 November 19, 1976 July 5, 1983 November 13, 1985 Yuma County (Unincorporated Areas) April 12, 1974 September 13, 1974 April 18, 1978 December 15, November 15, 1985 September 30, 1988 February 17, 1989 FEDERAL EMERGENCY MANAGEMENT AGENCY YUMA COUNTY, AZ AND INCORPORATED AREAS COMMUNITY MAP HISTORY
54 9.0 BIBLIOGRAPHY AND REFERENCES Aerial Mapping Company. (November 1980). Aerial Photographs, Unincorporated Areas of Yuma County, Arizona, Scale 1:14,400. Aerial Mapping Company. (November 1978). Aerial Photographs, Unincorporated Areas of Yuma County, Arizona, Scale 1:14,400. Arizona Department of Transportation. (September 1978). Methods for Estimating the Magnitude and Frequency of Floods in Arizona. Phoenix, Arizona. Arizona Department of Transportation, Highways Division. "Plan and Profile of Proposed State Highway, Ehrenburg-Phoenix, Yuma County, I-10-1 (54)." Federal Emergency Management Agency. (Revised November 15, 1985). Flood Insurance Rate Map, Yuma County, Arizona (Unincorporated Areas). Federal Emergency Management Agency. (Revised November 15, 1985). Flood Insurance Study, City of Yuma, Arizona. Federal Emergency Management Agency, Office of Natural and Technological Hazards. (December 1982). Computer Program for Determining Flood Depths and Velocities on Alluvial Fans. Prepared by David S. Harty, Dames & Moore. Bethesda, Maryland. Kenny Aerial Mapping. (Phoenix, Arizona, 1984). Aerial Photogrammetry, Yuma County, Arizona, Scale 1:10,000. PRC Toups Corporation. (Yuma County, Arizona, 1980). Topographic Maps, Scale 1:4,800, Contour Interval 4 feet. PRC Toups Corporation. (Yuma County, Arizona, 1978). Topographic Maps, Scale 1:4,800, Contour Interval 4 feet. U.S. Army Corps of Engineers, Los Angeles District, and U.S. Department of the Interior, Bureau of Reclamation, Lower Colorado River Regional Office. (April 1979). Study for Reevaluation for Hoover Dam Flood Control Regulation. U.S. Army Corps of Engineers, Los Angeles District. (March 1979). Painted Rock Dam Operation Study. U.S. Army Corps of Engineers, Hydrologic Engineering Center. (November 1976). HEC-2 Water-Surface Profiles, Generalized Computer Program. Davis, California. U.S. Department of Agriculture, Soil Conservation Service. (December 1980). Soil Survey of Yuma Wellton Area. Phoenix, Arizona. U.S. Department of Agriculture, Soil Conservation Service. (May 1965). Technical Release No. 20, Computer Program for Project Formulation, Hydrology. Washington, D.C. 50
55 U.S. Department of Commerce, Bureau of the Census. (January 1982) Census of Population. U.S. Department of the Interior, Bureau of Reclamation. (August 1973). Floodplain Information, Colorado River, Imperial Dam to San Luis, Including a Portion of the Lower Gila River Valley. U.S. Department of the Interior, Bureau of Reclamation. (July 1971). Floodplain Information, Colorado River Parker Dam to Headgate Rock Dam. U.S. Department of the Interior, Geological Survey. (Yuma East, Arizona-California, 1965, Photorevised 1979; Texas Hill, Arizona, 1965). 7.5-Minute Series Topographic Maps, Scale 1:24,000, Contour Interval 5 feet. U.S. Department of the Interior, Geological Survey. (Yuma West, Arizona-California, 1965, Photorevised 1979; Ligurta, Arizona, 1965; Roll, Arizona, 1955; Wellton, Arizona, 1965; Fortuna, Arizona, 1965, Photorevised 1979; Bard, California-Arizona, 1965, Photorevised 1979). 7.5-Minute Series Topographic Maps, Scale 1:24,000, Contour Interval 20 feet. U.S. Department of the Interior, Geological Survey. (Growler, Arizona, 1965; Ligurta, Arizona, 1965; Mohawk, Arizona, 1965; Red Bluff Mountain, Arizona, 1965; Roll, Arizona, 1965; Tacna, Arizona, 1965; Texas Hill, Arizona, 1965; Wellton, Arizona, 1965; Wellton Mesa, Arizona, 1965.) Flood-Prone Area Maps, Scale 1:24,000. U.S. Department of the Interior, Geological Survey. (Growler, Arizona, 1955; Mohawk, Arizona, 1965; Tacna, Arizona, 1965; Wellton Mesa, Arizona, 1965). 7.5-Minute Series Topographic Maps, Scale 1:24,000, Contour Interval 10 feet. U.S. Department of the Interior, Geological Survey. (Red Bluff Mountain, Arizona, 1955) Minute Series Topographic Maps, Scale 1:24,000, Contour Interval 40 feet. U.S. Interagency Advisory Committee on Water Data. (1982). Guidelines for Determining Flood Flow Frequency, Bulletin 17B. Reston, VA. U.S. Water Resources Council. (March 1976). "Guidelines for Determining Flood Flow Frequency," Bulletin 17. Washington, D.C. Water and Power Resources Service. (1977). Topographic Maps, Colorado River, Scale 1:1,200, Contour Interval 2 feet. 51
56 10.0 REVISION DESCRIPTIONS This section has been added to provide information regarding significant revisions made since the original FIS was printed. Future revisions may be made that do not result in the republishing of the FIS report. To assure that the user is aware of all revisions, it is advisable to contact the community repositories of flood-hazard data located at: City of San Luis City Hall 1090 East Union St. San Luis, Arizona City of Somerton City Hall 110 North State Avenue Somerton, Arizona Town of Wellton Town Hall Oakland Avenue Wellton, Arizona City of Yuma Community Planning Department One City Plaza Yuma, Arizona Yuma County (Unincorporated Areas) Department of Development Services 2351 West 26 th Street Yuma, Arizona First Revision (Revised Month Day, Year) This partial revision involved updating the mapping for portions of Yuma County, Arizona. The revision includes the removal of PAL notes for levees along the Gila and Colorado Rivers from affected DFIRM panels. In addition, new detailed studies along the Gila River were incorporated. 52
57
58
59
60
61
62
63 STREAM DISTANCE IN FEET ABOVE CONFLUENCE WITH GILA RIVER ELEVATION IN FEET (NAVD 88) CONFLUENCE IWHT GILA RIVER MAIN OUTLET DRAIN SIPHON 1% ANNUAL CHANCE BACKWATER EFFECTS FROM GILA RIVER 2% AND 10% ANNUAL CHANCE BACKWATER AREA NOT SHOWN LEGEND 0.2% ANNUAL CHANCE FLOOD* 1% ANNUAL CHANCE FLOOD 2% ANNUAL CHANCE FLOOD 10% ANNUAL CHANCE FLOOD STREAM BED CROSS SECTION LOCATION *DATA NOT AVAILABLE 07P FEDERAL EMERGENCY MANAGEMENT AGENCY YUMA COUNTY, AZ AND INCORPORATED AREAS FLOOD PROFILES FORTUNA WASH
64 FEDERAL EMERGENCY MANAGEMENT AGENCY YUMA COUNTY, AZ AND INCORPORATED AREAS FLOOD PROFILES FORTUNA WASH T S Q R U V K 150 J I P G H L M N O STREAM DISTANCE IN FEET ABOVE CONFLUENCE WITH GILA RIVER 02P UNNAMED ROAD GILA GRAVITY MAIN CANAL SIPHON U.S. HIGHWAY 95 DIP SECTION SOUTHERN PACIFIC RAILROAD LEGEND *0.2% ANNUAL CHANCE FLOOD 1% ANNUAL CHANCE FLOOD 2% ANNUAL CHANCE FLOOD 10% ANNUAL CHANCE FLOOD STREAM BED CROSS SECTION LOCATION *DATA NOT AVAILABLE ELEVATION IN FEET (NAVD 88)
65 UNNAMED ROAD FLOOD PROFILES FORTUNA WASH ELEVATION IN FEET (NAVD 88) W X Y Z AA AB STREAM DISTANCE IN FEET ABOVE CONFLUENCE WITH GILA RIVER AC LEGEND *0.2% ANNUAL CHANCE FLOOD 1% ANNUAL CHANCE FLOOD 2% ANNUAL CHANCE FLOOD 10% ANNUAL CHANCE FLOOD STREAM BED CROSS SECTION LOCATION *DATA NOT AVAILABLE FEDERAL EMERGENCY MANAGEMENT AGENCY YUMA COUNTY, AZ AND INCORPORATED AREAS 03P
66 FLOOD PROFILES FORTUNA WASH ELEVATION IN FEET (NAVD 88) AD AE AF AG STREAM DISTANCE IN FEET ABOVE CONFLUENCE WITH GILA RIVER AH AI LEGEND *0.2% ANNUAL CHANCE FLOOD 1% ANNUAL CHANCE FLOOD 2% ANNUAL CHANCE FLOOD 10% ANNUAL CHANCE FLOOD STREAM BED CROSS SECTION LOCATION *DATA NOT AVAILABLE FEDERAL EMERGENCY MANAGEMENT AGENCY YUMA COUNTY, AZ AND INCORPORATED AREAS 04P
67 FEDERAL EMERGENCY MANAGEMENT AGENCY YUMA COUNTY, AZ AND INCORPORATED AREAS FLOOD PROFILES FORTUNA WASH AT 280 AO AQ AJ AK AL AM AN AP AR AS CROSS SECTION LOCATION STREAM DISTANCE IN FEET ABOVE CONFLUENCE WITH GILA RIVER 05P FRONTAGE ROAD US HIGHWAY 80 INTERSTATE HIGHWAY 8 WEST BOUND INTERSTATE HIGHWAY 8 EAST BOUND LEGEND *0.2% ANNUAL CHANCE FLOOD 1% ANNUAL CHANCE FLOOD 2% ANNUAL CHANCE FLOOD 10% ANNUAL CHANCE FLOOD STREAM BED *DATA NOT AVAILABLE ELEVATION IN FEET (NAVD 88)
68 FLOOD PROFILES FORTUNA WASH ELEVATION IN FEET (NAVD 88) AU AV AW AX AY AZ STREAM DISTANCE IN FEET ABOVE CONFLUENCE WITH GILA RIVER BA BB LEGEND *0.2% ANNUAL CHANCE FLOOD 1% ANNUAL CHANCE FLOOD 2% ANNUAL CHANCE FLOOD 10% ANNUAL CHANCE FLOOD STREAM BED CROSS SECTION LOCATION *DATA NOT AVAILABLE FEDERAL EMERGENCY MANAGEMENT AGENCY YUMA COUNTY, AZ AND INCORPORATED AREAS 06P
69 DATA NOT AVAILABLE FOR 2% AND 10% ANNUAL CHANCE FLOOD PROFILES FLOOD PROFILES FORTUNA WASH ELEVATION IN FEET (NAVD 88) BC BD BE BF STREAM DISTANCE IN FEET ABOVE CONFLUENCE WITH GILA RIVER BG LEGEND *0.2% ANNUAL CHANCE FLOOD 1% ANNUAL CHANCE FLOOD 2% ANNUAL CHANCE FLOOD 10% ANNUAL CHANCE FLOOD STREAM BED CROSS SECTION LOCATION *DATA NOT AVAILABLE FEDERAL EMERGENCY MANAGEMENT AGENCY YUMA COUNTY, AZ AND INCORPORATED AREAS 07P
70 LUKE AIR FORCE RANGE FLOOD PROFILES FORTUNA WASH ELEVATION IN FEET (NAVD 88) BH STREAM DISTANCE IN FEET ABOVE CONFLUENCE WITH GILA RIVER LEGEND *0.2% ANNUAL CHANCE FLOOD 1% ANNUAL CHANCE FLOOD *2% ANNUAL CHANCE FLOOD *10% ANNUAL CHANCE FLOOD STREAM BED CROSS SECTION LOCATION *DATA NOT AVAILABLE FEDERAL EMERGENCY MANAGEMENT AGENCY YUMA COUNTY, AZ AND INCORPORATED AREAS 08P
71 FEDERAL EMERGENCY MANAGEMENT AGENCY YUMA COUNTY, AZ AND INCORPORATED AREAS FLOOD PROFILES FORTUNA WASH EAST FORK THE 10%, 2% AND 0.2% ANNUAL CHANCE FLOOD PROFILES ARE TOO CLOSE TO THE 1% ANNUAL CHANCE ELEVATION TO BE SHOWN SEPARATELY K A B C D E F G H I J STREAM DISTANCE IN FEET ABOVE CONFLUENCE WITH FORTUNA WASH 09P CONFLUENCE WITH FORTUNA WASH CONFLUENCE OF FORTUNA WASH EAST FORK SPLIT CHANNEL CONFLUENCE OF UNNAMED TRIBUTARY TO FORTUNA WASH EAST FORK DIVERGENCE OF SPLIT CHANNEL CONFLUENCE OF SPLIT CHANNEL 2 CONFLUENCE OF SPLIT CHANNEL 1 LEGEND *0.2% ANNUAL CHANCE FLOOD 1% ANNUAL CHANCE FLOOD 2% ANNUAL CHANCE FLOOD 10% ANNUAL CHANCE FLOOD STREAM BED CROSS SECTION LOCATION *DATA NOT AVAILABLE ELEVATION IN FEET (NAVD 88)
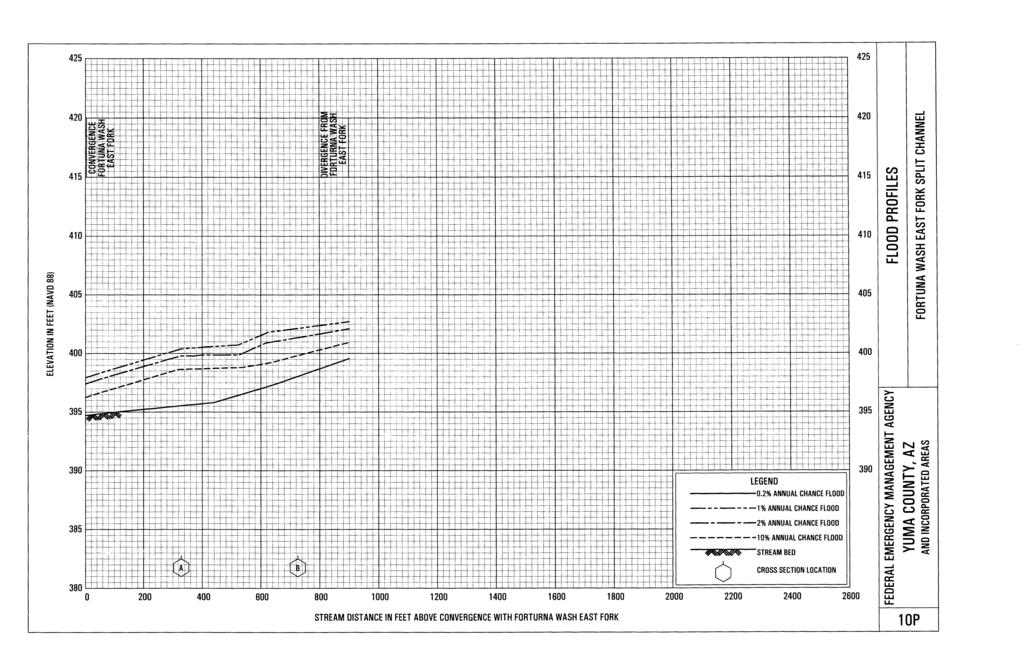
72
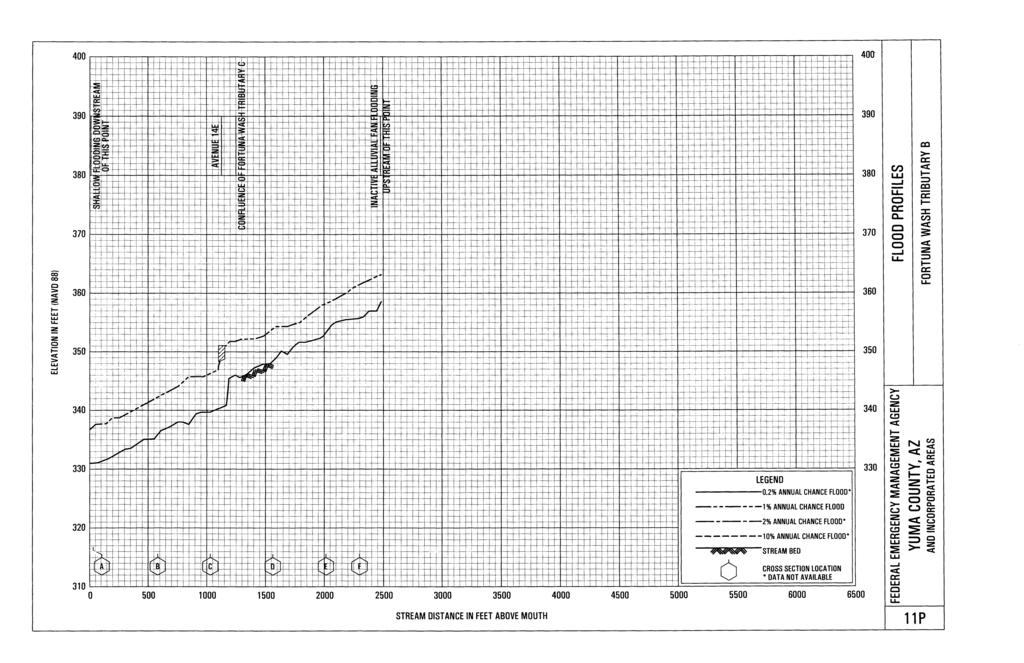
73
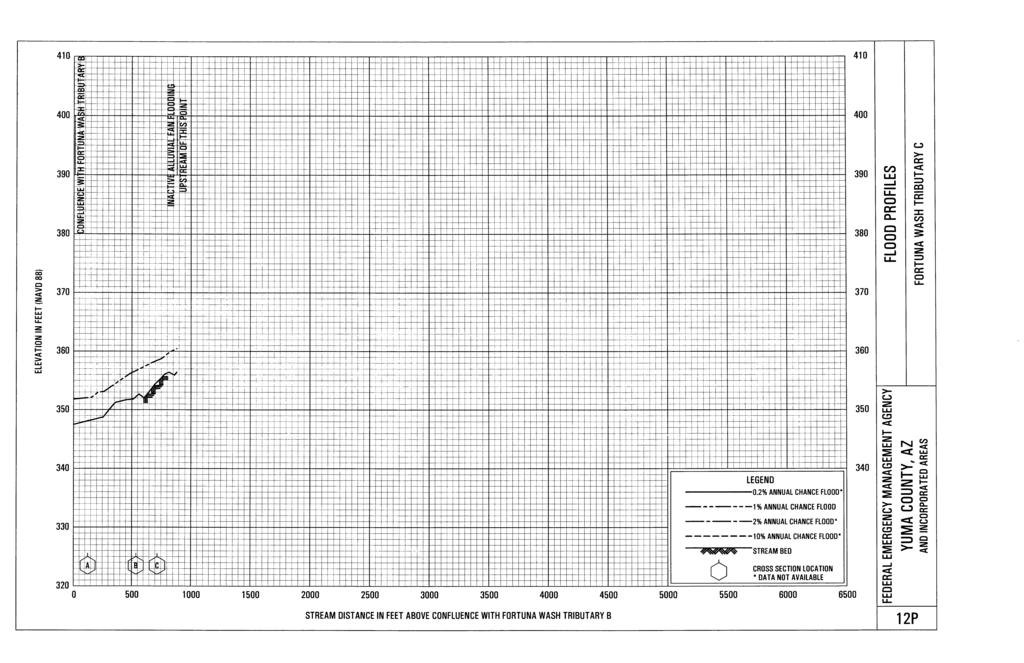
74
75 1% ANNUAL CHANCE BACKWATER EFFECTS FROM COLORADO RIVER THE 0.2% ANNUAL CHANCE FLOOD EVENT IS TOO CLOSE TO THE 1% ANNUAL CHANCE EVENT TO DISPLAY FLOOD PROFILES ELEVATION IN FEET (NAVD88) GILA RIVER LEGEND 0.2% ANNUAL CHANCE FLOOD 1% ANNUAL CHANCE FLOOD 2% ANNUAL CHANCE FLOOD 10% ANNUAL CHANCE FLOOD STREAM BED CROSS SECTION LOCATION FEDERAL EMERGENCY MANAGEMENT AGENCY YUMA COUNTY, AZ AND INCORPORATED AREAS STREAM DISTANCE IN FEET ABOVE CONFLUENCE WITH COLORADO RIVER 19P
76 1% ANNUAL CHANCE BACKWATER EFFECTS FROM COLORADO RIVER ELEVATION IN FEET (NAVD88) FLOOD PROFILES GILA RIVER LEGEND 0.2% ANNUAL CHANCE FLOOD 1% ANNUAL CHANCE FLOOD 2% ANNUAL CHANCE FLOOD 10% ANNUAL CHANCE FLOOD STREAM BED CROSS SECTION LOCATION FEDERAL EMERGENCY MANAGEMENT AGENCY YUMA COUNTY, AZ AND INCORPORATED AREAS STREAM DISTANCE IN FEET ABOVE CONFLUENCE WITH COLORADO RIVER 20P
77
78
79 STREAM DISTANCE IN FEET ABOVE CONFLUENCE WITH COLORADO RIVER ELEVATION IN FEET (NAVD) LEGEND 0.2% ANNUAL CHANCE FLOOD 1% ANNUAL CHANCE FLOOD 2% ANNUAL CHANCE FLOOD 10% ANNUAL CHANCE FLOOD STREAM BED CROSS SECTION LOCATION 23P FEDERAL EMERGENCY MANAGEMENT AGENCY YUMA COUNTY, AZ AND INCORPORATED AREAS FLOOD PROFILES GILA RIVER
80
81
82
83
84
85
86
87 STREAM DISTANCE IN FEET ABOVE CONFLUENCE WITH COLORADO RIVER ELEVATION IN FEET (NAVD88) LEGEND 0.2% ANNUAL CHANCE FLOOD 1% ANNUAL CHANCE FLOOD 2% ANNUAL CHANCE FLOOD 10% ANNUAL CHANCE FLOOD STREAM BED CROSS SECTION LOCATION 31P FEDERAL EMERGENCY MANAGEMENT AGENCY YUMA COUNTY, AZ AND INCORPORATED AREAS FLOOD PROFILES GILA RIVER
88 STREAM DISTANCE IN FEET ABOVE CONFLUENCE WITH COLORADO RIVER ELEVATION IN FEET (NAVD88) LEGEND 0.2% ANNUAL CHANCE FLOOD 1% ANNUAL CHANCE FLOOD 2% ANNUAL CHANCE FLOOD 10% ANNUAL CHANCE FLOOD STREAM BED CROSS SECTION LOCATION 32P FEDERAL EMERGENCY MANAGEMENT AGENCY YUMA COUNTY, AZ AND INCORPORATED AREAS FLOOD PROFILES GILA RIVER
89 STREAM DISTANCE IN FEET ABOVE CONFLUENCE WITH COLORADO RIVER ELEVATION IN FEET (NAVD88) LEGEND 0.2% ANNUAL CHANCE FLOOD 1% ANNUAL CHANCE FLOOD 2% ANNUAL CHANCE FLOOD 10% ANNUAL CHANCE FLOOD STREAM BED CROSS SECTION LOCATION 33P FEDERAL EMERGENCY MANAGEMENT AGENCY YUMA COUNTY, AZ AND INCORPORATED AREAS FLOOD PROFILES GILA RIVER
90
91
92
93 STREAM DISTANCE IN FEET ABOVE CONFLUENCE WITH COLORADO RIVER ELEVATION IN FEET (NAVD88) S. AVENUE 20 E E. COUNTY 9TH ST LEGEND *0.2% ANNUAL CHANCE FLOOD 1% ANNUAL CHANCE FLOOD *2% ANNUAL CHANCE FLOOD 10% ANNUAL CHANCE FLOOD STREAM BED CROSS SECTION LOCATION *Data Not Available 37P FEDERAL EMERGENCY MANAGEMENT AGENCY YUMA COUNTY, AZ AND INCORPORATED AREAS FLOOD PROFILES GILA RIVER
94 STREAM DISTANCE IN FEET ABOVE CONFLUENCE WITH COLORADO RIVER ELEVATION IN FEET (NAVD88) LEGEND *0.2% ANNUAL CHANCE FLOOD 1% ANNUAL CHANCE FLOOD *2% ANNUAL CHANCE FLOOD 10% ANNUAL CHANCE FLOOD STREAM BED CROSS SECTION LOCATION *Data Not Available 38P FEDERAL EMERGENCY MANAGEMENT AGENCY YUMA COUNTY, AZ AND INCORPORATED AREAS FLOOD PROFILES GILA RIVER
95 STREAM DISTANCE IN FEET ABOVE CONFLUENCE WITH COLORADO RIVER ELEVATION IN FEET (NAVD88) LEGEND *0.2% ANNUAL CHANCE FLOOD 1% ANNUAL CHANCE FLOOD *2% ANNUAL CHANCE FLOOD 10% ANNUAL CHANCE FLOOD STREAM BED CROSS SECTION LOCATION *Data Not Available 39P FEDERAL EMERGENCY MANAGEMENT AGENCY YUMA COUNTY, AZ AND INCORPORATED AREAS FLOOD PROFILES GILA RIVER
96 STREAM DISTANCE IN FEET ABOVE CONFLUENCE WITH COLORADO RIVER ELEVATION IN FEET (NAVD88) CONFLUENCE OF GILA RIVER NORTH SPLIT LEGEND *0.2% ANNUAL CHANCE FLOOD 1% ANNUAL CHANCE FLOOD *2% ANNUAL CHANCE FLOOD 10% ANNUAL CHANCE FLOOD STREAM BED CROSS SECTION LOCATION *Data Not Available 40P FEDERAL EMERGENCY MANAGEMENT AGENCY YUMA COUNTY, AZ AND INCORPORATED AREAS FLOOD PROFILES GILA RIVER
97 STREAM DISTANCE IN FEET ABOVE CONFLUENCE WITH COLORADO RIVER ELEVATION IN FEET (NAVD88) LEGEND *0.2% ANNUAL CHANCE FLOOD 1% ANNUAL CHANCE FLOOD *2% ANNUAL CHANCE FLOOD 10% ANNUAL CHANCE FLOOD STREAM BED CROSS SECTION LOCATION *Data Not Available 41P FEDERAL EMERGENCY MANAGEMENT AGENCY YUMA COUNTY, AZ AND INCORPORATED AREAS FLOOD PROFILES GILA RIVER
98 STREAM DISTANCE IN FEET ABOVE CONFLUENCE WITH COLORADO RIVER ELEVATION IN FEET (NAVD88) LEGEND *0.2% ANNUAL CHANCE FLOOD 1% ANNUAL CHANCE FLOOD *2% ANNUAL CHANCE FLOOD 10% ANNUAL CHANCE FLOOD STREAM BED CROSS SECTION LOCATION *Data Not Available 42P FEDERAL EMERGENCY MANAGEMENT AGENCY YUMA COUNTY, AZ AND INCORPORATED AREAS FLOOD PROFILES GILA RIVER
99 STREAM DISTANCE IN FEET ABOVE CONFLUENCE WITH COLORADO RIVER ELEVATION IN FEET (NAVD88) CONFLUENCE OF COYOTE WASH DIVERGENCE OF GILA RIVER NORTH SPLIT LEGEND *0.2% ANNUAL CHANCE FLOOD 1% ANNUAL CHANCE FLOOD *2% ANNUAL CHANCE FLOOD 10% ANNUAL CHANCE FLOOD STREAM BED CROSS SECTION LOCATION *Data Not Available 43P FEDERAL EMERGENCY MANAGEMENT AGENCY YUMA COUNTY, AZ AND INCORPORATED AREAS FLOOD PROFILES GILA RIVER
100 STREAM DISTANCE IN FEET ABOVE CONFLUENCE WITH COLORADO RIVER ELEVATION IN FEET (NAVD88) LEGEND *0.2% ANNUAL CHANCE FLOOD 1% ANNUAL CHANCE FLOOD *2% ANNUAL CHANCE FLOOD 10% ANNUAL CHANCE FLOOD STREAM BED CROSS SECTION LOCATION *Data Not Available 44P FEDERAL EMERGENCY MANAGEMENT AGENCY YUMA COUNTY, AZ AND INCORPORATED AREAS FLOOD PROFILES GILA RIVER
101 STREAM DISTANCE IN FEET ABOVE CONFLUENCE WITH COLORADO RIVER ELEVATION IN FEET (NAVD88) LEGEND *0.2% ANNUAL CHANCE FLOOD 1% ANNUAL CHANCE FLOOD *2% ANNUAL CHANCE FLOOD 10% ANNUAL CHANCE FLOOD STREAM BED CROSS SECTION LOCATION *Data Not Available 45P FEDERAL EMERGENCY MANAGEMENT AGENCY YUMA COUNTY, AZ AND INCORPORATED AREAS FLOOD PROFILES GILA RIVER
102 ELEVATION IN FEET (NAVD88) STREAM DISTANCE IN FEET ABOVE CONFLUENCE WITH COLORADO RIVER AVENUE 30E LEGEND *0.2% ANNUAL CHANCE FLOOD 1% ANNUAL CHANCE FLOOD *2% ANNUAL CHANCE FLOOD 10% ANNUAL CHANCE FLOOD STREAM BED CROSS SECTION LOCATION *Data Not Available 46P FEDERAL EMERGENCY MANAGEMENT AGENCY YUMA COUNTY, AZ AND INCORPORATED AREAS FLOOD PROFILES GILA RIVER
103 ELEVATION IN FEET (NAVD88) STREAM DISTANCE IN FEET ABOVE CONFLUENCE WITH COLORADO RIVER LIMIT OF DETAILED STUDY LEGEND *0.2% ANNUAL CHANCE FLOOD 1% ANNUAL CHANCE FLOOD *2% ANNUAL CHANCE FLOOD 10% ANNUAL CHANCE FLOOD STREAM BED CROSS SECTION LOCATION *Data Not Available 47P FEDERAL EMERGENCY MANAGEMENT AGENCY YUMA COUNTY, AZ AND INCORPORATED AREAS FLOOD PROFILES GILA RIVER
104 ELEVATION IN FEET (NAVD88) CONFLUENCE WITH GILA RIVER FLOODING CONTROLLED BY GILA RIVER STREAM DISTANCE IN FEET ABOVE CONFLUENCE WITH GILA RIVER LEGEND 0.2% ANNUAL CHANCE FLOOD* 1% ANNUAL CHANCE FLOOD 2% ANNUAL CHANCE FLOOD* 10% ANNUAL CHANCE FLOOD STREAM BED CROSS SECTION LOCATION *DATA NOT AVAILABLE 48P FEDERAL EMERGENCY MANAGEMENT AGENCY YUMA COUNTY, AZ AND INCORPORATED AREAS FLOOD PROFILES GILA RIVER NORTH SPLIT
105 ELEVATION IN FEET (NAVD88) STREAM DISTANCE IN FEET ABOVE CONFLUENCE WITH GILA RIVER DIVERGENCE FROM GILA RIVER LEGEND 0.2% ANNUAL CHANCE FLOOD* 1% ANNUAL CHANCE FLOOD 2% ANNUAL CHANCE FLOOD* 10% ANNUAL CHANCE FLOOD STREAM BED CROSS SECTION LOCATION *DATA NOT AVAILABLE 49P FEDERAL EMERGENCY MANAGEMENT AGENCY YUMA COUNTY, AZ AND INCORPORATED AREAS FLOOD PROFILES GILA RIVER NORTH SPLIT
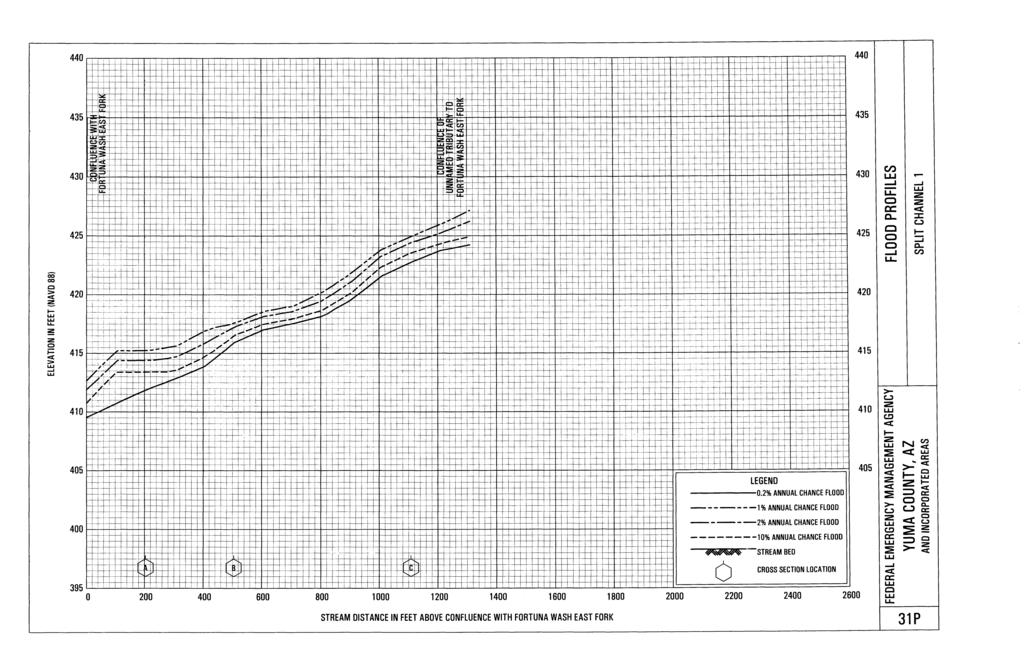

106
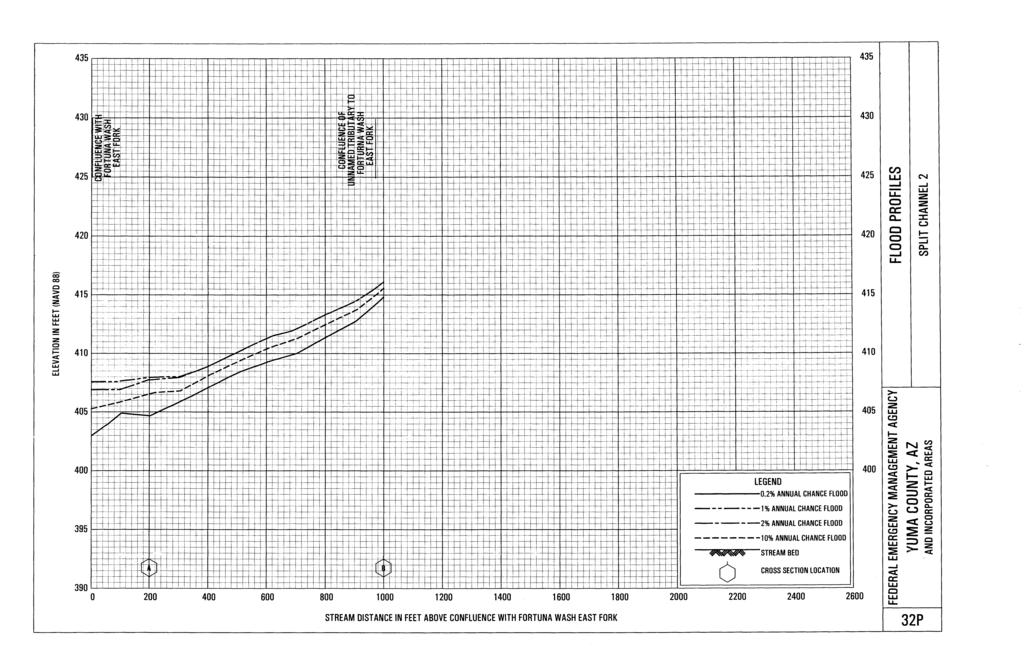

107
Appendix E Guidance for Shallow Flooding Analyses and Mapping
 Appendix E Guidance for Shallow Flooding Analyses and Mapping E.1 Introduction Different types of shallow flooding commonly occur throughout the United States. Types of flows that result in shallow flooding
LOMR SUBMITTAL LOWER NEHALEM RIVER TILLAMOOK COUNTY, OREGON
 LOMR SUBMITTAL LOWER NEHALEM RIVER TILLAMOOK COUNTY, OREGON Prepared for: TILLAMOOK COUNTY DEPARTMENT OF COMMUNITY DEVELOPMENT 1510-B THIRD STREET TILLAMOOK, OR 97141 Prepared by: 10300 SW GREENBURG ROAD,
UPPER COSUMNES RIVER FLOOD MAPPING
 UPPER COSUMNES RIVER FLOOD MAPPING DRAFT BASIC DATA NARRATIVE FLOOD INSURANCE STUDY SACRAMENTO COUTY, CALIFORNIA Community No. 060262 November 2008 Prepared By: CIVIL ENGINEERING SOLUTIONS, INC. 1325 Howe
YELLOWSTONE RIVER FLOOD STUDY REPORT TEXT
 YELLOWSTONE RIVER FLOOD STUDY REPORT TEXT TECHNICAL REPORT Prepared for: City of Livingston 411 East Callender Livingston, MT 59047 Prepared by: Clear Creek Hydrology, Inc. 1627 West Main Street, #294
LOMR SUBMITTAL LOWER NESTUCCA RIVER TILLAMOOK COUNTY, OREGON
 LOMR SUBMITTAL LOWER NESTUCCA RIVER TILLAMOOK COUNTY, OREGON Prepared for: TILLAMOOK COUNTY DEPARTMENT OF COMMUNITY DEVELOPMENT 1510-B THIRD STREET TILLAMOOK, OR 97141 Prepared by: 10300 SW GREENBURG ROAD,
TOWN OF FORT KENT, MAINE AROOSTOOK COUNTY
 TOWN OF FORT KENT, MAINE AROOSTOOK COUNTY PRELIMINARY: 01/07/2013 Federal Emergency Management Agency COMMUNITY NUMBER 230019V000A NOTICE TO FLOOD INSURANCE STUDY USERS Communities participating in the
VOLUME 3 OF 3 FAIRFIELD COUNTY, OHIO AND INCORPORATED AREAS COMMUNITY NAME NUMBER COMMUNITY NAME NUMBER
 VOLUME 3 OF 3 FAIRFIELD COUNTY, OHIO AND INCORPORATED AREAS COMMUNITY NAME NUMBER COMMUNITY NAME NUMBER AMANDA, VILLAGE OF * 390688 PICKERINGTON, CITY OF 390162 BALTIMORE, VILLAGE OF 390159 PLEASANTVILLE,
MORGAN COUNTY COLORADO, AND INCORPORATED AREAS
 MORGAN COUNTY COLORADO, AND INCORPORATED AREAS VOLUME 1 OF 1 Morgan County COMMUNITY NAME COMMUNNITY NUMBER BRUSH, CITY OF 080130 FORT MORGAN, CITY OF 080131 LOG LANE VILLAGE, TOWN OF* 080217 MORGAN COUNTY
YANKTON COUNTY, SOUTH DAKOTA
 YANKTON COUNTY, SOUTH DAKOTA AND INCORPORATED AREAS Community Name Community Number GAYVILLE, TOWN OF* 460205 IRENE, TOWN OF 460120 LESTERVILLE, TOWN OF* 460206 MISSION HILL, TOWN OF 460091 UTICA, TOWN
Issue 44: Phase II & III H&H Issues Date: 07/03/2006 Page 1
 Background Phase I of the NCFMP studies have primarily focused on the coastal plain and sandhills physiographic regions in of the State. Phase II and III study areas will focus on the piedmont, foothills,
Dealing with Zone A Flood Zones. Topics of Discussion. What is a Zone A Floodplain?
 Dealing with Zone A Flood Zones Topics of Discussion Overview of Zone A Floodplains Permitting Development in Zone A Floodplains Estimating Flood Elevations in Zone A Flood Insurance Implications Letters
CLAY COUNTY, MINNESOTA AND INCORPORATED AREAS
 CLAY COUNTY, MINNESOTA AND INCORPORATED AREAS Community Name Community Number BARNESVILLE, CITY OF 270078 CLAY COUNTY 275235 (UNINCORPORATED AREAS) *COMSTOCK, CITY OF 270079 DILWORTH, CITY OF 270080 *FELTON,
CAMDEN COUNTY, GEORGIA
 CAMDEN COUNTY, GEORGIA AND INCORPORATED AREAS COMMUNITY NAME COMMUNITY NUMBER CAMDEN COUNTY 130262 (UNINCORPORATED AREAS) KINGSLAND, CITY OF 130238 ST. MARYS, CITY OF 130027 WOODBINE, CITY OF 130241 CAMDEN
JOURNAL OF ENVIRONMENTAL HYDROLOGY The Electronic Journal of the International Association for Environmental Hydrology VOLUME
 JOURNAL OF ENVIRONMENTAL HYDROLOGY The Electronic Journal of the International Association for Environmental Hydrology VOLUME 18 2010 REDUCED CHANNEL CONVEYANCE ON THE WICHITA RIVER AT WICHITA FALLS, TEXAS,
JOSEPHINE COUNTY, OREGON AND INCORPORATED AREAS VOLUME 1 OF 2
 JOSEPHINE COUNTY, OREGON AND INCORPORATED AREAS VOLUME 1 OF 2 COMMUNITY NAME COMMUNITY NUMBER CAVE JUNCTION, CITY OF 410107 GRANTS PASS, CITY OF 410108 JOSEPHINE COUNTY UNINCORPORATED AREAS 415590 Effective:
Ground Water Protection Council 2017 Annual Forum Boston, Massachusetts. Ben Binder (303)
") Ground Water Protection Council 2017 Annual Forum Boston, Massachusetts Protecting Groundwater Sources from Flood Borne Contamination Ben Binder (303) 860-0600 Digital Design Group, Inc. The Problem Houston
Ground Water Protection Council 2017 Annual Forum Boston, Massachusetts Protecting Groundwater Sources from Flood Borne Contamination Ben Binder (303) 860-0600 Digital Design Group, Inc. The Problem Houston
MASON COUNTY, MICHIGAN
 MASON COUNTY, MICHIGAN (ALL JURISDICTIONS) MASON COUNTY Community Community Community Community Name Number Name Number AMBER, TOWNSHIP OF 261271 LOGAN, TOWNSHIP OF 260811 BRANCH, TOWNSHIP OF 261272 LUDINGTON,
ARMSTRONG COUNTY, PA
 ARMSTRONG COUNTY, PA Revised Preliminary DFIRM Mapping March 31, 2013 Kevin Donnelly, P.E., CFM GG3, Greenhorne & O Mara, Inc. Presentation Agenda Armstrong County DFIRM Overview - June 25, 2010 DFIRM
Section 4: Model Development and Application
 Section 4: Model Development and Application The hydrologic model for the Wissahickon Act 167 study was built using GIS layers of land use, hydrologic soil groups, terrain and orthophotography. Within
3.11 Floodplains Existing Conditions
 Other stormwater control practices may be needed to mitigate water quality impacts. In addition to detention facilities, other practices such as vegetated basins/buffers, infiltration basins, and bioswales
INFLOW DESIGN FLOOD CONTROL SYSTEM PLAN 40 C.F.R. PART PLANT YATES ASH POND 2 (AP-2) GEORGIA POWER COMPANY
 GEORGIA POWER COMPANY") INFLOW DESIGN FLOOD CONTROL SYSTEM PLAN 40 C.F.R. PART 257.82 PLANT YATES ASH POND 2 (AP-2) GEORGIA POWER COMPANY EPA s Disposal of Coal Combustion Residuals from Electric Utilities Final Rule (40 C.F.R.
INFLOW DESIGN FLOOD CONTROL SYSTEM PLAN 40 C.F.R. PART 257.82 PLANT YATES ASH POND 2 (AP-2) GEORGIA POWER COMPANY EPA s Disposal of Coal Combustion Residuals from Electric Utilities Final Rule (40 C.F.R.
 Red River Flooding June 2015 Caddo and Bossier Parishes Presented by: Flood Technical Committee Where the Rain Falls Matters I-30 versus I-20 I-20 Backwater and Tributary Floods (Localized) 2016 Flood
Pequabuck River Flooding Study and Flood Mitigation Plan The City of Bristol and Towns of Plainville and Plymouth, CT
 Pequabuck River Flooding Study and Flood Mitigation Plan The City of Bristol and Towns of Plainville and Plymouth, CT Raymond Rogozinski and Maged Aboelata The City of Bristol and Towns of Plainville and
NYE COUNTY, NEVADA AND INCORPORATED AREAS Nye County
 NYE COUNTY, NEVADA AND INCORPORATED AREAS Nye County Community Name Community Number NYE COUNTY, UNINCORPORATED AREAS 320018 February 17, 2010 Federal Emergency Management Agency FLOOD INSURANCE STUDY
Gateway Trail Project
 Gateway Trail Project Debris Flow Hazard Assessment By: Juan de la Fuente April 30, 2010 Background- On April 22, 2010, the Shasta-Trinity National Forest (Mt. Shasta-McCloud Unit) requested a geologic
PENNSYLVANIA DEPARTMENT OF TRANSPORTATION ENGINEERING DISTRICT 3-0
 PENNSYLVANIA DEPARTMENT OF TRANSPORTATION ENGINEERING DISTRICT 3-0 LYCOMING COUNTY S.R.15, SECTION C41 FINAL HYDROLOGIC AND HYDRAULIC REPORT STEAM VALLEY RUN STREAM RELOCATION DATE: June, 2006 REVISED:
TSEGI WASH 50% DESIGN REPORT
 TSEGI WASH 50% DESIGN REPORT 2/28/2014 Daniel Larson, Leticia Delgado, Jessica Carnes I Table of Contents Acknowledgements... IV 1.0 Project Description... 1 1.1 Purpose... 1 Figure 1. Erosion of a Headcut...
Summary of Hydraulic and Sediment-transport. Analysis of Residual Sediment: Alternatives for the San Clemente Dam Removal/Retrofit Project,
 Appendix N SUMMARY OF HYDRAULIC AND SEDIMENT-TRANSPORT ANALYSIS OF RESIDUAL SEDIMENT: ALTERNATIVES FOR THE SAN CLEMENTE DAM REMOVAL/RETROFIT PROJECT, CALIFORNIA the San Clemente Dam Removal/Retrofit Project,
APPENDIX B HYDROLOGY
 APPENDIX B HYDROLOGY TABLE OF CONTENTS 1.0 INTRODUCTION... 1 2.0 PROBABLE MAXIMUM PRECIPITATION (PMP)... 1 3.0 DESIGN FLOW CALCULATION... 1 4.0 DIVERSION CHANNEL SIZING... 2 5.0 REFERENCES... 4 LIST OF
Local Flood Hazards. Click here for Real-time River Information
 Local Flood Hazards Floods of the White River and Killbuck Creek are caused by runoff from general, and/or intense rainfall. Other areas of flooding concern are from the Boland Ditch and Pittsford Ditch.
GREENE COUNTY, PA. Revised Preliminary DFIRM Mapping FEMA. Kevin Donnelly, P.E., CFM GG3, Greenhorne & O Mara, Inc. April 10, 2013
 GREENE COUNTY, PA Revised Preliminary DFIRM Mapping April 10, 2013 Kevin Donnelly, P.E., CFM GG3, Greenhorne & O Mara, Inc. Presentation Agenda Greene County DFIRM Overview September 30, 2010 DFIRM Countywide
L OWER N OOKSACK R IVER P ROJECT: A LTERNATIVES A NALYSIS A PPENDIX A: H YDRAULIC M ODELING. PREPARED BY: LandC, etc, LLC
 L OWER N OOKSACK R IVER P ROJECT: A LTERNATIVES A NALYSIS A PPENDIX A: H YDRAULIC M ODELING PREPARED BY: LandC, etc, LLC TABLE OF CONTENTS 1 Introduction... 1 2 Methods... 1 2.1 Hydraulic Model... 1 2.2
The last three sections of the main body of this report consist of:
 Threatened and Endangered Species Geological Hazards Floodplains Cultural Resources Hazardous Materials A Cost Analysis section that provides comparative conceptual-level costs follows the Environmental
Background on the March 13-14, 2007 Flooding in Browns Valley (Traverse County), Minnesota
, Minnesota") Background on the March 13-14, 2007 Flooding in Browns Valley (Traverse County), Minnesota Report to the Minnesota Governor s Office Prepared by: Minnesota Department of Natural Resources Waters Division
Background on the March 13-14, 2007 Flooding in Browns Valley (Traverse County), Minnesota Report to the Minnesota Governor s Office Prepared by: Minnesota Department of Natural Resources Waters Division
GEOL 1121 Earth Processes and Environments
 GEOL 1121 Earth Processes and Environments Wondwosen Seyoum Department of Geology University of Georgia e-mail: seyoum@uga.edu G/G Bldg., Rm. No. 122 Seyoum, 2015 Chapter 6 Streams and Flooding Seyoum,
PRELIMINARY DRAFT FOR DISCUSSION PURPOSES
 Memorandum To: David Thompson From: John Haapala CC: Dan McDonald Bob Montgomery Date: February 24, 2003 File #: 1003551 Re: Lake Wenatchee Historic Water Levels, Operation Model, and Flood Operation This
North Carolina Simplified Inundation Maps For Emergency Action Plans December 2010; revised September 2014; revised April 2015
 North Carolina Simplified Inundation Maps For Emergency Action Plans December 2010; revised September 2014; revised April 2015 INTRODUCTION Emergency Action Plans (EAPs) are critical to reducing the risks
Technical Memorandum No Sediment Model
 Pajaro River Watershed Study in association with Technical Memorandum No. 1.2.9 Sediment Model Task: Development of Sediment Model To: PRWFPA Staff Working Group Prepared by: Gregory Morris and Elsie Parrilla
PRINCE GEORGE COUNTY, VIRGINIA AND INCORPORATED AREAS
 PRINCE GEORGE COUNTY, VIRGINIA AND INCORPORATED AREAS COMMUNITY NAME COMMUNITY NUMBER PRINCE GEORGE COUNTY (UNINCORPORATED AREAS) 510204 Prince George County Federal Emergency Management Agency FLOOD INSURANCE
DRAFT Design Hydraulic Study. Bridge 04C-0055, Mattole Road Bridge over Mattole River at Honeydew. Humboldt County. Prepared for:
 DRAFT Design Hydraulic Study Bridge 04C-0055, Mattole Road Bridge over Mattole River at Honeydew Humboldt County Prepared for: Morrison Structures Incorporated 1890 Park Marina Drive, Suite 104 Redding,
SAN FRANCISCO DISTRICT INFORMATION REQUESTED FOR VERIFICATION OF CORPS JURISDICTION
 DEPARTMENT OF THE ARMY SAN FRANCISCO DISTRICT, U.S. ARMY CORPS OF ENGINEERS 1455 MARKET STREET SAN FRANCISCO, CALIFORNIA 94103-1398 SAN FRANCISCO DISTRICT INFORMATION REQUESTED FOR VERIFICATION OF CORPS
Design Hydraulic Study. Bridge 09C-0134, Blairsden-Graeagle Road over Middle Fork Feather River. Plumas County. Prepared for:
 Design Hydraulic Study Bridge 09C-0134, Blairsden-Graeagle Road over Middle Fork Feather River Plumas County Prepared for: Quincy Engineering, Inc 3247 Ramos Circle Sacramento, CA 95827-2501 Prepared by:
REDWOOD VALLEY SUBAREA
 Independent Science Review Panel Conceptual Model of Watershed Hydrology, Surface Water and Groundwater Interactions and Stream Ecology for the Russian River Watershed Appendices A-1 APPENDIX A A-2 REDWOOD
Appendix C Fluvial Flood Hazards
 Appendix C Fluvial Flood Hazards Sea Level Rise Vulnerability Assessment and Adaptation Project March 2019 Contents Contents... i Figures... i Tables... i Definitions, Acronyms, & Abbreviations... ii
ASFPM - Rapid Floodplain Mapping
 ASFPM - Nicole Cominoli Hydraulic Engineer USACE - Omaha District mary.n.cominoli@usace.army.mil June 3, 2015 US Army Corps of Engineers Mitigation = Risk Informed Decisions 2 The National Flood Insurance
4.1 Hazard Identification: Natural Hazards
 data is provided in an annex, it should be assumed that the risk and potential impacts to the affected jurisdiction are similar to those described here for the entire Sacramento County Planning Area. This
USGS Flood Inundation Mapping of the Suncook River in Chichester, Epsom, Pembroke and Allenstown, New Hampshire
 USGS Flood Inundation Mapping of the Suncook River in Chichester, Epsom, Pembroke and Allenstown, New Hampshire NH Water & Watershed Conference Robert Flynn, USGS NH-VT Water Science Center March 23, 2012
CASE STUDY #9 - Brushy Fork Dam, Sugar Grove, West Virginia
 CASE STUDY #9 - Brushy Fork Dam, Sugar Grove, West Virginia Brushy Fork Dam is a flood control structure built by the Soil Conservation Service southeast of the city of Franklin in Pendleton County, West
Chapter 5 CALIBRATION AND VERIFICATION
 Chapter 5 CALIBRATION AND VERIFICATION This chapter contains the calibration procedure and data used for the LSC existing conditions model. The goal of the calibration effort was to develop a hydraulic
HISTORY OF CONSTRUCTION FOR EXISTING CCR SURFACE IMPOUNDMENT PLANT GASTON ASH POND 40 CFR (c)(1)(i) (xii)
(1)(i) (xii)") HISTORY OF CONSTRUCTION FOR EXISTING CCR SURFACE IMPOUNDMENT PLANT GASTON ASH POND 40 CFR 257.73(c)(1)(i) (xii) (i) Site Name and Ownership Information: Site Name: E.C. Gaston Steam Plant Site Location:
HISTORY OF CONSTRUCTION FOR EXISTING CCR SURFACE IMPOUNDMENT PLANT GASTON ASH POND 40 CFR 257.73(c)(1)(i) (xii) (i) Site Name and Ownership Information: Site Name: E.C. Gaston Steam Plant Site Location:
UGRC 144 Science and Technology in Our Lives/Geohazards
 UGRC 144 Science and Technology in Our Lives/Geohazards Flood and Flood Hazards Dr. Patrick Asamoah Sakyi Department of Earth Science, UG, Legon College of Education School of Continuing and Distance Education
U.S. ARMY CORPS OF ENGINEERS
 CORPS FACTS Regulating Mississippi River Navigation Pools U.S. ARMY CORPS OF ENGINEERS BUILDING STRONG Historical Background Federal improvements in the interest of navigation on the Mississippi River
Using Soils Data to Map
 Using Soils Data to Map The Challenges of Eco Engineering: Making the Connections Natural Between Floodplains Engineering and Ecology Kevin Coulton, P.E., CFM cbec eco engineering Chris Bowles, Ph.D.,
HYDROLOGIC AND HYDRAULIC REPORT FOR SR. 0522, SECTION 5BN ALONG BLACKLOG CREEK CROMWELL TOWNSHIP HUNTINGDON COUNTY. Prepared for:
 HYDROLOGIC AND HYDRAULIC REPORT FOR SR. 0522, SECTION 5BN ALONG BLACKLOG CREEK CROMWELL TOWNSHIP Prepared for: KCI Technologies, Inc. Mechanicsburg, PA and Pennsylvania Department of Transportation Engineering
Chapter 7 Mudflow Analysis
 Chapter 7 Mudflow Analysis 7.0 Introduction This chapter provides information on the potential and magnitude of mud floods and mudflows that may develop in Aspen due to rainfall events, snowmelt, or rain
Red River Levee Panel
 Red River Levee Panel Mississippi River Commission Monday, August 9, 2017 Red River Levees in LA & AR NONE along TX & OK Boarder Red River Levee Issues Caddo Levee Cherokee Park Authorization Bossier Levee
Historical channel change on the Upper Gila River, Arizona and New Mexico in response to anthropogenic modifications and extreme floods
 Historical channel change on the Upper Gila River, Arizona and New Mexico in response to anthropogenic modifications and extreme floods www.archives.gov www.paztcn.wr.usgs.gov wrh.noaa.gov Upper Gila River
CARROLL COUNTY, NEW HAMPSHIRE
 VOLUME 1 OF 2 CARROLL COUNTY, NEW HAMPSHIRE Carroll County Community Community Community Community Name Number Name Number ALBANY, TOWN OF 330174 JACKSON, TOWN OF 330014 BARTLETT, TOWN OF 330010 MADISON,
Certification Process for North Indio East Side Dike in the Coachella Valley
 Certification Process for North Indio East Side Dike in the Coachella Valley September 7, 2016 Brady McDaniel (Northwest Hydraulic Consultants) Contributors Andrey Shvidchenko, Brent Wolfe and Jimmy Pan
3.12 Geology and Topography Affected Environment
 3 Affected Environment and Environmental Consequences 3.12 Geology and Topography 3.12.1 Affected Environment 3.12.1.1 Earthquakes Sterling Highway MP 45 60 Project Draft SEIS The Kenai Peninsula is predisposed
Hydrologic Forecast Centre Manitoba Infrastructure, Winnipeg, Manitoba. FEBRUARY OUTLOOK REPORT FOR MANITOBA February 23, 2018
 Page 1 of 17 Hydrologic Forecast Centre Manitoba Infrastructure, Winnipeg, Manitoba FEBRUARY OUTLOOK REPORT FOR MANITOBA February 23, 2018 Overview The February Outlook Report prepared by the Hydrologic
Flooding in Western North Carolina: Some Spatial, Hydrologic, and Seasonal Characteristics CAUTION!! Outline. Basic Flood Facts.
 Flooding in Western North Carolina: Some Spatial, Hydrologic, and Seasonal Characteristics J. Greg Dobson CAUTION!! National Environmental Modeling and Analysis Center RENCI at UNC-Asheville Engagement
Technical Memorandum No
 Pajaro River Watershed Study in association with Technical Memorandum No. 1.2.10 Task: Evaluation of Four Watershed Conditions - Sediment To: PRWFPA Staff Working Group Prepared by: Gregory Morris and
L _*" I_
 -- @ o*.d 8 UNIVERSITY OF NEVADA-RENO ---^^_ lo-k L - - -- --- - _*" I lll-l-lllll Nevada Bureau of Fdlines and Goology LJriivrts~ly o: Nevada tierlo Ficnn, Novnda 8055 7 OORO (102) it34 6691 NEMG OPEN
Base Level Engineering FEMA Region 6
 Base Level Engineering Over the past five years, has been evaluating its investment approach and data preparation work flow to establish an efficient and effective change in operation, generating an approach
5.2. IDENTIFICATION OF NATURAL HAZARDS OF CONCERN
 5.2. IDENTIFICATION OF NATURAL HAZARDS OF CONCERN To provide a strong foundation for mitigation strategies considered in Sections 6 and 9, County considered a full range of natural hazards that could impact
ENGINEERING HYDROLOGY
 ENGINEERING HYDROLOGY Prof. Rajesh Bhagat Asst. Professor Civil Engineering Department Yeshwantrao Chavan College Of Engineering Nagpur B. E. (Civil Engg.) M. Tech. (Enviro. Engg.) GCOE, Amravati VNIT,
Case Study 2: Twenty-mile Creek Rock Fords
 Case Study : Twenty-mile Creek Rock Fords Location Crossing Description Washington. Okanagan National Forest. Methow Valley Ranger District. Chewuch river basin, East Chewuch Road. The Twenty-mile Creek
A GIS-based Approach to Watershed Analysis in Texas Author: Allison Guettner
 Texas A&M University Zachry Department of Civil Engineering CVEN 658 Civil Engineering Applications of GIS Instructor: Dr. Francisco Olivera A GIS-based Approach to Watershed Analysis in Texas Author:
High Speed / Commuter Rail Suitability Analysis For Central And Southern Arizona
 High Speed / Commuter Rail Suitability Analysis For Central And Southern Arizona Item Type Reports (Electronic) Authors Deveney, Matthew R. Publisher The University of Arizona. Rights Copyright is held
McINTOSH COUNTY, GEORGIA
 McINTOSH COUNTY, GEORGIA AND INCORPORATED AREAS Community Name Community Number Darien, City of 130131 McIntosh County 130130 (Unincorporated Areas) Preliminary: McIntosh County FLOOD INSURANCE STUDY NUMBER
Folsom Dam Water Control Manual Update Joint Federal Project, Folsom Dam
 Folsom Dam Water Control Manual Update Joint Federal Project, Folsom Dam Public Workshop May 25, 2016 Sacramento Library Galleria 828 I Street, Sacramento, CA US Army Corps of Engineers BUILDING STRONG
LIBERTY COUNTY, GEORGIA
 LIBERTY COUNTY, GEORGIA AND INCORPORATED AREAS Liberty County Community Name Community Number ALLENHURST, TOWN OF 130350 FLEMINGTON, CITY OF 130124 GUMBRANCH, CITY OF 130610 HINESVILLE, CITY OF 130125
Swift Creek Sediment Management Action Plan (SCSMAP)
") Swift Creek Sediment Management Action Plan (SCSMAP) PHASE 2 PROJECT PLAN PROPOSAL Whatcom County Public Works Department 322 N. Commercial Street, Suite 210 Bellingham, WA 98225 (360) 676-6692 June 2013
Swift Creek Sediment Management Action Plan (SCSMAP) PHASE 2 PROJECT PLAN PROPOSAL Whatcom County Public Works Department 322 N. Commercial Street, Suite 210 Bellingham, WA 98225 (360) 676-6692 June 2013
APPENDIX E. GEOMORPHOLOGICAL MONTORING REPORT Prepared by Steve Vrooman, Keystone Restoration Ecology September 2013
 APPENDIX E GEOMORPHOLOGICAL MONTORING REPORT Prepared by Steve Vrooman, Keystone Restoration Ecology September 2 Introduction Keystone Restoration Ecology (KRE) conducted geomorphological monitoring in
Chapter 7 Mudflow Analysis
 Chapter 7 Mudflow Analysis 7.0 Introduction This chapter provides information on the potential and magnitude of mud floods and mudflows that may develop in Aspen due to rainfall events, snowmelt, or rain
NEEDLES S STREET LEVEE SYSTEM SAN BERNARDINO COUNTY, CALIFORNIA NLD SYSTEM ID #
 SAN BERNARDINO COUNTY, CALIFORNIA NLD SYSTEM ID # 3805030008 PERIODIC INSPECTION REPORT NO. 1 GENERALIZED EXECUTIVE SUMMARY FINAL SYSTEM RATING: MINIMALLY ACCEPTABLE FINAL RATING DATE: AUGUST 2014 PERIODIC
New Jersey Department of Transportation Extreme Weather Asset Management Pilot Study
 New Jersey Department of Transportation Extreme Weather Asset Management Pilot Study Overview Prepared for: June 26, 2018 Introduction Overview of Pilot Study New Jersey s Climate New Jersey s Transportation
PLATTE COUNTY, MISSOURI AND INCORPORATED AREAS VOLUME 1 OF 2
 PLATTE COUNTY, MISSOURI VOLUME 1 OF 2 COMMUNITY NAME COMMUNITY NUMBER CAMDEN POINT, CITY OF 295419 DEARBORN, CITY OF 290504 EDGERTON, CITY OF 290291 FARLEY, VILLAGE OF 290292 FERRELVIEW, VILLAGE OF 290895
6.4 Sensitivity Tests
 6.4 Sensitivity Tests 6.4.1 Sensitivity of Floodplain Inundation to Width of Dry Culvert The preliminary design for the Expressway based on consideration of possible future climate effects to 2090 assumed
CENTRAL TEXAS HILL COUNTRY FLOOD
 CENTRAL TEXAS HILL COUNTRY FLOOD Term project report DECEMBER 7, 2018 UNIVERSITY OF TEXAS AT AUSTIN CE394K: GIS in Water Resources Engineering RIFAAI Mohamed Talha Table of Contents Introduction... 3 Context...
Hydrologic Forecast Centre. Manitoba Infrastructure. Winnipeg, Manitoba FEBRUARY FLOOD OUTLOOK REPORT FOR MANITOBA.
 Page 1 of 20 Hydrologic Forecast Centre Manitoba Infrastructure Winnipeg, Manitoba FEBRUARY FLOOD OUTLOOK REPORT FOR MANITOBA February 28, 2019 Overview The February Outlook Report prepared by the Hydrologic
Laboratory Exercise #4 Geologic Surface Processes in Dry Lands
 Page - 1 Laboratory Exercise #4 Geologic Surface Processes in Dry Lands Section A Overview of Lands with Dry Climates The definition of a dry climate is tied to an understanding of the hydrologic cycle
Assessment of the Hood River Delta Hood River, Oregon
 Assessment of the Hood River Delta Hood River, Oregon Pacific Northwest Waterways Association Annual Meeting October 13, 2010 Michael McElwee, Executive Director Port of Hood River Overview U.S. Army Corps
Arizona Climate Summary September 2014 Summary of conditions for August 2014
 Arizona Climate Summary September 2014 Summary of conditions for August 2014 August 2014 Temperature and Precipitation Summary August 1 st 16 th : The first 5 days of August were quite wet with high pressure
Association of State Floodplain Managers, Inc.
 Association of State Floodplain Managers, Inc. 2809 Fish Hatchery Road, Suite 204, Madison, WI 53713 Phone: 608-274-0123 Fax: 608-274-0696 Email: asfpm@floods.org Website: www.floods.org Need for Updating
Discovery Data Questionnaire
 Region III Discovery Data Questionnaire Thank you for taking the time to complete this Discovery Data questionnaire. It will provide important information to help FEMA better understand flood risk issues
LEVY COUNTY, FLORIDA AND INCORPORATED AREAS
 LEVY COUNTY, FLORIDA AND INCORPORATED AREAS COMMUNITY NAME COMMUNITY NUMBER BRONSON, TOWN OF 120582 CEDAR KEY, CITY OF 120373 CHIEFLAND, CITY OF 120392 INGLIS, TOWN OF 120586 LEVY COUNTY 120145 (UNINCORPORATED
Hydrologic Forecast Centre Manitoba Infrastructure, Winnipeg, Manitoba. MARCH OUTLOOK REPORT FOR MANITOBA March 23, 2018
 Page 1 of 21 Hydrologic Forecast Centre Manitoba Infrastructure, Winnipeg, Manitoba MARCH OUTLOOK REPORT FOR MANITOBA March 23, 2018 Overview The March Outlook Report prepared by the Hydrologic Forecast
LOCATED IN INDIAN RIVER COUNTY PREPARED FOR S.J.R.W.M.D. AND F.W.C.D. DECEMBER, 2003 Updated 2007 Updated May 2014 PREPARED BY
 FELLSMERE WATER CONTROL DISTRICT EAST MASTER DRAINAGE PLAN AND STORMWATER HYDROLOGIC ANALYSIS OF THE GRAVITY DRAINAGE SYSTEM LOCATED BETWEEN THE EAST BOUNDARY, LATERAL U, THE MAIN CANAL, AND DITCH 24 LOCATED
Folsom Dam Water Control Manual Update
 Folsom Dam Water Control Manual Update Public Workshop April 3, 2014 Location: Sterling Hotel Ballroom 1300 H Street, Sacramento US Army Corps of Engineers BUILDING STRONG WELCOME & INTRODUCTIONS 2 BUILDING
9. PROBABLE MAXIMUM PRECIPITATION AND PROBABLE MAXIMUM FLOOD
 9. PROBABLE MAXIMUM PRECIPITATION AND PROBABLE MAXIMUM FLOOD 9.1. Introduction Due to the size of Watana Dam and the economic importance of the Project to the Railbelt, the Probable Maximum Flood (PMF)
Flash flood disaster in Bayangol district, Ulaanbaatar
 Flash flood disaster in Bayangol district, Ulaanbaatar Advanced Training Workshop on Reservoir Sedimentation Management 10-16 October 2007. IRTCES, Beijing China Janchivdorj.L, Institute of Geoecology,MAS
HEC & GIS Modeling of the Brushy Creek HEC & GIS Watershed Modeling of the
 HEC & GIS Modeling of the Brushy Creek HEC & GIS Watershed Modeling of the By Cassandra Fagan 5, December 2014 http://ubcwatershedstudy.ursokr.com/images/ Contents Introduction... 3 Figure 1: 24-hour rainfall
Lecture 14: Floods. Key Questions
 Lecture 14: Floods Key Questions 1. What is an upstream flood? 2. What is a downstream flood? 3. What were the setup conditions that cause floods? 4. What is a 100-year flood? 5. How are 100-year flood
3.0 TECHNICAL FEASIBILITY
 3.0 TECHNICAL FEASIBILITY 3.1 INTRODUCTION To enable seasonal storage and release of water from Lake Wenatchee, an impoundment structure would need to be constructed on the lake outlet channel. The structure
2017 January Conditions Report Manitoba Hydrologic Forecasting and Coordination Branch Manitoba Infrastructure
 2017 January Conditions Report Manitoba Hydrologic Forecasting and Coordination Branch Manitoba Infrastructure 1/30/2017 Page 1 of 22 Hydrologic Forecast Centre Manitoba Infrastructure and Transportation
Hydrology and Hydraulics Design Report. Background Summary
 To: National Park Services Montezuma Castle National Monument Richard Goepfrich, Facility Manager From: Multicultural Technical Engineers Date: Tuesday - February 13, 2018 Subject: 30% Hydrology and Hydraulics
Analysis of Hydraulic Impacts on the Schuylkill River
 Analysis of Hydraulic Impacts on the Schuylkill River Manayunk Sewer Basin Construction Project and the Venice Island Recreation Center Reconstruction Project Venice Island, Manayunk, Philadelphia, PA
Chapter 10 - Sacramento Method Examples
 Chapter 10 Sacramento Method Examples Introduction Overview This chapter presents two example problems to demonstrate the use of the Sacramento method. These example problems use the SACPRE and HEC-1 computer