LEVY COUNTY, FLORIDA AND INCORPORATED AREAS
|
|
|
- Martin Cole
- 6 years ago
- Views:
Transcription


1 LEVY COUNTY, FLORIDA AND INCORPORATED AREAS COMMUNITY NAME COMMUNITY NUMBER BRONSON, TOWN OF CEDAR KEY, CITY OF CHIEFLAND, CITY OF INGLIS, TOWN OF LEVY COUNTY (UNINCORPORATED AREAS) OTTER CREEK, TOWN OF WILLISTON, CITY OF YANKEETOWN, TOWN OF PRELIMINARY November 30, 2009 Federal Emergency Management Agency FLOOD INSURANCE STUDY NUMBER 12075CV0000
2 NOTICE TO FLOOD INSURANCE STUDY USERS Communities participating in the National Flood Insurance Program have established repositories of flood hazard data for floodplain management and flood insurance purposes. This Flood Insurance Study (FIS) may not contain all data available within the repository. It is advisable to contact the community repository for any additional data. Part or all of this FIS may be revised and republished at any time. In addition, part of this FIS may be revised by the Letter of Map Revision process, which does not involve republication or redistribution of the FIS. It is, therefore, the responsibility of the user to consult with community officials and to check the community repository to obtain the most current FIS components. Initial Countywide FIS Effective Date:
3 TABLE OF CONTENTS 1.0 INTRODUCTION Purpose of Study Authority and Acknowledgments Coordination AREA STUDIED Scope of Study Community Description Principal Flood Problems Flood Protection Measures ENGINEERING METHODS Hydrologic Analyses Hydraulic Analyses Wave Height Analysis Vertical Datum FLOOD PLAIN MANAGEMENT APPLICATIONS Flood Boundaries Floodways INSURANCE APPLICATION FLOOD INSURANCE RATE MAP (FIRM) OTHER STUDIES LOCATION OF DATA BIBLIOGRAPHY AND REFERENCES...38 Page i
4 TABLE OF CONTENTS (continued) FIGURES Page Figure 1 Transect Location Map (Levy County)...19 Figure 2 Transect Location Map (City of Cedar Key) Figure 3 Transect Location Map (Town of Yankeetown)...21 Figure 4 Transect Schematic...24 Figure 5 Floodway Schematic...33 TABLES Table 1 Scope of Revision...3 Table 2 Summary of Discharges...8 Table 3 Parameter Values for Surge Elevation Computations...11 Table 4 Transect Locations, Stillwater Starting Elevations and Maximum Wave Crest Elevations...22 Table 5 Transect Data...24 Table 6 Floodway Data...30 Table 7 Community Map History...36 Exhibit 1 Flood Profiles EXHIBITS Magee Branch Unnamed Tributary Suwannee River Waccasassa River Unnamed Tributary Withlacoochee River Panel 01P Panels 02P 03P Panel 04P Panels 05P 06P Exhibit 2 Flood Insurance Rate Map Index Exhibit 3 Flood Insurance Rate Map ii
5 FLOOD INSURANCE STUDY LEVY COUNTY, FLORIDA AND INCORPORATED AREAS 1.0 INTRODUCTION 1.1 Purpose of Study This countywide Flood Insurance Study (FIS) investigates the existence and severity of flood hazards in, or revises and updates previous FISs/Flood Insurance Rate Maps (FIRMs) for the geographic area of Levy County, Florida, including the Towns of Bronson, Inglis, Otter Creek, Yankeetown; Cities of Cedar Key, Chiefland, Williston and the unincorporated areas of Levy County (hereinafter referred to collectively as Levy County). Please note that the Town of Fanning Springs is located in Levy and Dixie Counties. The Town of Fanning Springs is not included in this FIS report. See separately published Dixie County FIS report and Flood Insurance Rate Map (DFIRM) for flood hazard information. This FIS aids in the administration of the National Flood Insurance Act of 1968 and the Flood Disaster Protection Act of This FIS has developed flood risk data for various areas of the county that will be used to establish actuarial flood insurance rates. This information will also be used by Levy County to update existing floodplain regulations as part of the Regular Phase of the National Flood Insurance Program (NFIP), and will also be used by local and regional planners to further promote sound land use and floodplain development. Minimum floodplain management requirements for participation in the NFIP are set forth in the Code of Federal Regulations at 44 CFR, In some States or communities, floodplain management criteria or regulations may exist that are more restrictive or comprehensive than the minimum Federal requirements. In such cases, the more restrictive criteria take precedence and the State (or other jurisdictional agency) will be able to explain them. 1.2 Authority and Acknowledgments The sources of authority for this Flood Insurance Study are the National Flood Insurance Act of 1968 and the Flood Disaster Protection Act of This FIS was prepared to include the unincorporated areas of Levy County and the incorporated communities within Levy County into a countywide format. Information on the authority and acknowledgments for this countywide FIS, as compiled from their previously printed FIS reports, is shown below. 1
6 Previous September 1, 1983 FIS The hydrologic and hydraulic analyses for this study were performed by Gee & Jenson Engineers-Architects-Planners, Inc., for the Federal Emergency Management Agency, under contract no. H This study was completed in March Hydrologic data for the Withlacoochee River was taken from a Flood Hazard Information Report prepared by the U.S. Army Corps of Engineers (USACE) for the Southwest Florida Water Management District (SWFWMD). For this countywide FIS, revised hydrologic and hydraulic analyses were prepared for FEMA by URS Corporation under contract with the Suwannee River Water Management District (SRWMD) and SWFWMD, FEMA Cooperating Technical Partner s (CTP s). The digital base map files were derived from Florida Department of Transportation Digital Orthoimagery, produced at a resolution of 1-foot from photography dated March The coordinate system used for the production of the digital FIRM is State Plane in the Florida HARN West projection zone, referenced to the North American Datum of Coordination Consultation Coordination Officer s (CCO) meetings may be held for each jurisdiction in this countywide FIS. An initial CCO meeting is held typically with representatives of FEMA, the community, and the study contractor to explain the nature and purpose of a FIS, and to identify the streams to be studied by detailed methods. A final CCO meeting is held typically with representatives of FEMA, the community, and the study contractor to review the results of the study. Areas requiring detailed study were identified at a meeting attended by representatives of FEMA, Gee & Jenson Engineers-Architects-Planners, Inc., the study contractor, and Levy County on May 4, The legal announcement of the flood insurance study and its purpose was placed in the Chiefland Citizen, the Gainesville Sun, and Dunnellon Press in January For this countywide FIS, an initial CCO meeting was held on November 14, A final CCO meeting was held on???. These meetings were attended by representatives of the study contractors, SRWMD, SWFWMD, Levy County, City of Cedar Key, Town of Inglis and the Town of Yankeetown and FEMA. 2
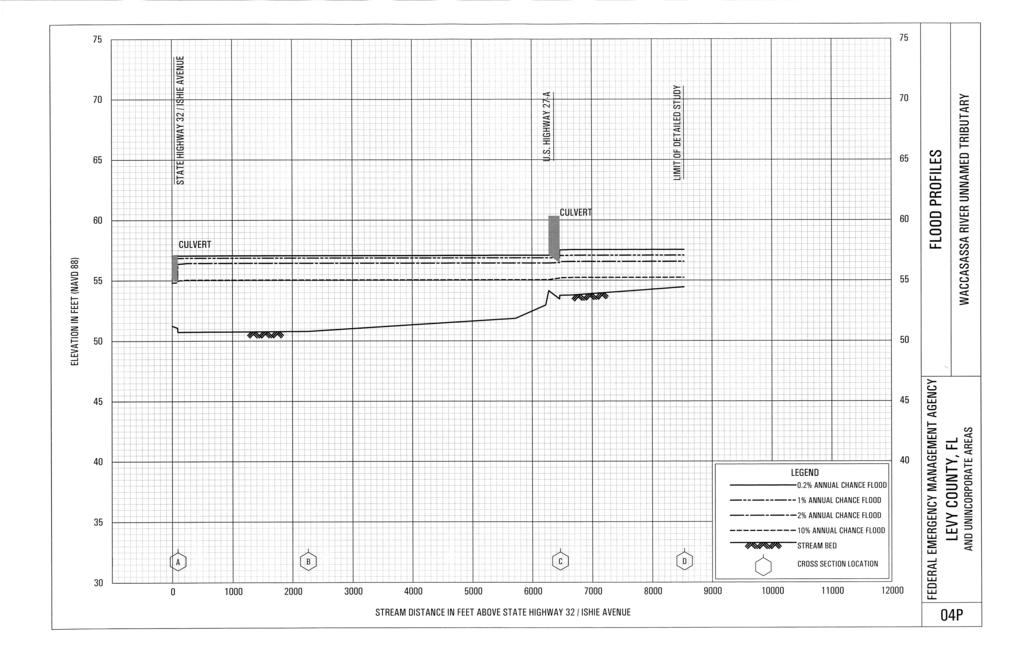
7 2.0 AREA STUDIED 2.1 Scope of Study This FIS covers the geographic area of Levy County, Florida. The following areas were delineated as detailed study areas: the Gulf of Mexico, the Suwannee River, and the Withlacoochee River. The study analysis included coastal flooding due to hurricane-induced storm surge. Both the open coast surge and its inland propagation were studied; in addition, the added effects of wave heights were also considered. For this countywide FIS, new or revised limited detail hydrologic and hydraulic analyses were included for the flooding sources shown in Table 1 Scope of Revision. TABLE 1 SCOPE OF REVISION Long Pond Stream Magee Branch Unnamed Tributary Waccasassa River Unnamed Tributary Limits of New or Revised Detailed Study Located near Chiefland, Florida on the west side of US Highway 19. The limits of the detailed study extends from CR-345 upstream 5.87 miles to a point located just upstream of CR-347 (NW 60 th St.). Located near Bronson, Florida. The limits of the detailed study extends from a point 1,000 feet downstream of NE 61 st Place, upstream 2.42 miles to a point located just downstream of SR-24. Located near Bronson, Florida. The limits of the detailed study extends from a point 1,000 feet downstream of NE 90 th Street, upstream 1.67 miles to a point located just downstream of SR-24. The Limits of detailed study are indicated on the Flood Profiles (Exhibit 1) and on the FIRM (Exhibit 2). Approximate analyses were used to study those areas having a low development potential or minimal flood hazards. The areas studied were selected with priority given to all known flood hazard areas and areas of projected development or proposed construction. The scope and methods of the study were proposed to and agreed upon by FEMA, SRWMD, SWFWMD and Levy County. 3
8 2.2 Community Description Levy County, located on the Gulf Coast of northern Florida, is bounded on the north by Dixie, Gilchrist and Alachua Counties, on the east by Marion County and on the south by Citrus County. It lies approximately 15 miles southwest of Gainesville and encompasses about 1,080 square miles. The major north-south arteries are U.S. Highways 98 and 19, and U.S. Highway ALT 27 (State Road 339). East-west access is via State Roads 24 and 121. Rail service to Levy County is supplied by The Seaboard Coastline Railroad with the major yard located in Chief land. Public air service is provided by the George T. Lewis Airport and the Williston Municipal Airport. The Levy County economy is mostly dependent upon forestry, farming, and commercial fishing. Residential and commercial development is presently centered about the communities of Cedar Key, Chiefland, Bronson, Williston and Yankeetown. Tourism and retirement interests are increasing, creating a potential for development in flood plain areas for water sports and recreation. The topography of the county is generally low in the coastal region, lying below the 10-foot North American Vertical Datum (NAVD88) contour. Elevations in the western portions of the county near the Town of Bronson rise to approximately 100 feet NAVD88. The Suwannee River, which flows in a southerly direction, forms the western boundary of the county. The river originates in the interior of Georgia and extends approximately 220 miles to the Gulf of Mexico. Its drainage area encompasses about 10,000 square miles. The Waccasassa River, lying in the central portion of the county extends approximately 30 miles from the northeastern portion of the county to the Gulf of Mexico. The City of Cedar Key is located on the gulf coast in northern Levy County. The City is located approximately 57 miles southwest of Gainesville. Cedar Key was established in the mid-1800 s and lumbering of the forested areas of cedar and cypress in the region was the major industry until the forest was depleted. Current economic activities consist mainly of commercial and recreational fishing and tourism. Development consists of single family residential and marine oriented commercial establishments. The City of Cedar Key, as the name implies includes a series of small keys projecting into the Gulf of Mexico, interconnected with short bridges and with only one link to the mainland over SR 24. The topography is characterized by small hills ranging in elevation from sea level to about 30 feet NAVD88. Several small keys lie about 1 to 3 miles offshore, forming a semicircle around the city. 4
9 The Town of Inglis is located near the gulf coast in southern Levy County. Tourism and retirement interests are increasing creating a potential for development in floodplain areas near the water for sports and recreation. The Withlacoochee River, which flows in a northwesterly direction, forms the southern boundary of the town. It is approximately 160 miles in length and extends from its headwaters beginning in the Green Swamp in Pasco, Sumter, Polk and Lake Counties to the Gulf of Mexico near Yankeetown at the Citrus County-Levy County boundary. The river s drainage area encompasses approximately 2,000 square miles. The Town of Yankeetown is located on the gulf coast in southern Levy County adjacent to the Withlacoochee River. A significant amount of the Town consists of wetlands and coastal marshes. The developed portion of Yankeetown generally lies between State Road 40 and the Withlacoochee River. State Route 40 is the primary access to Yankeetown and runs in an east west direction. It connects Yankeetown to U.S. Route 19, a major north-south arterial, providing access to the adjacent coastal counties. The land surface in Yankeetown range from low lying, marshy coastal lands extending approximately 2 miles inland from the coast to higher lands in the southwest portion of the town. Surface water runoff drains from the flatwood areas north of the town southward and southwestward toward the Withlacoochee River and the westward towards the Gulf of Mexico. The Withlacoochee River, which is located south of and adjacent to Yankeetown and flows in a northwesterly direction, forms the southern boundary of the town and Levy County. It is approximately 160 miles in length and extends from its headwaters beginning in the Green Swamp in Pasco, Sumter, Polk and Lake Counties to the Gulf of Mexico near Yankeetown at the Citrus County-Levy County boundary. The Inglis Dam, a short distance upstream, forms Lake Rousseau and just downstream for this point the Florida Cross State Canal intercepts the Withlacoochee River. The 2008 population estimate for Levy County was reported to be 29,012 (U.S. Census Bureau, 2008). Census counts for the incorporated areas are as follows. Community 2008 Population City of Cedar Key 977 Town of Inglis 1,636 Town of Yankeetown 694 The climate in Levy County is subtropical with mean annual temperatures in the upper 60s, and average winter temperatures varying between 50 and 60 degrees Fahrenheit (ºF). Temperatures in the summer months average about 80º F, being moderated by sea breezes and frequent thunderstorms. Rainfall averages about 60 inches annually with the majority of accumulation in May through September. 5
10 Winds are generally southerly in summer months and northerly in winter months (USDOC, 1978). 2.3 Principal Flood Problems General flooding in Levy County results from periods of intense rainfall causing ponding and sheet-runoff in the low, poorly-drained areas. The flood plains of the Suwannee, Withlacoochee, and Waccasassa River are also subject to flooding during high river stages. Coastal areas are subject to flooding and wave action associated with hurricanes and tropical storms. The northwestern portion of the county lies within the flood plain of the Suwannee River and has been subject to several historical floods. Notable flooding in this area occurred in 1948, 1959, and 1973 from storms which US Geographic Survey (USGS) gage records at Wilcox, Florida indicated had a magnitude that would occur on the average once in 200, 14 and 33 years respectively (200, 14 and 33 year recurrence intervals). The southern portion of the county lies within the flood plain of the Withlacoochee River which has also been subject to historical flooding. In recent years, floods causing significant damage along the Withlacoochee River were reported to have occurred in 1934, 1950 and USGS gage records at Croom, Florida indicated that the 1934 and 1950 storms had a magnitude that would occur on the average once in 75 and 60 years, respectively (75- and 60-year recurrence intervals). A more recent flood occurred in High water marks surveyed and referenced by the SWFWMD determined this to be approximately a 2-year flood (SWFWMD, April 1975). Records of past coastal flooding in this area have been limited, primarily because of the undeveloped nature of the shoreline areas. However, several hurricanes have affected Levy County in the past. Among the more historic was the September 22 October 11 hurricane of This storm made landfall between Cedar Key and St. Marks, Florida. At Cedar Key, 28 lives were lost as most of the town was destroyed by high tides, waves, and fires. Over 100 fishing and shrimping boats were lost during this storm (USACE, 1961). Previously, hurricane Alma in 1966, approximately a 5-year recurrence at Cedar Key (a storm that would occur every 5 years on the average) and Hurricane Agnes in 1972, approximately a 5-year recurrence at Cedar Key, have caused minor flooding of the low-lying areas. 2.4 Flood Protection Measures The southern portion of Levy County, the Towns of Inglis and Yankeetown is afforded protection against flooding from the Withlacoochee River by the Inglis Lock and Dam and Lake Rousseau. The Cross-Florida Barge Canal also helps 6
11 reduce flood stages in this portion of the county. The remainder of the county has no measures designed and constructed specifically for that purpose. 3.0 ENGINEERING METHODS For the flooding sources studied in detail in the community, standard hydrologic and hydraulic study methods were used to determine the flood hazard data required for this study. Flood events of a magnitude which are expected to be equaled or exceeded once on the average during any 10-, 50-, 100-, and 500-year period (recurrence intervals); have been selected as having special significance for flood plain management and for flood insurance premium rates. These events, commonly termed the 10-, 50-, 100-, and 500-year floods, have a 10, 2, 1, and 0.2 percent chance, respectively, of being equaled or exceeded during any year. Although the recurrence interval represents the long term, average period between floods of a specific magnitude, rare floods could occur at short intervals or even within the same year. The risk of experiencing a rare flood increases when periods greater than one year are considered. For example, the risk of having a flood which equals or exceeds the 100-year flood (one percent chance of annual occurrence) in any 50-year period is about 40 percent (four in 10), and for any 90-year period, the risk increases to about 60 percent (six in 10). The analyses reported here reflect flooding potentials based on conditions existing in the community at the time of completion of this study. Maps and flood elevations will be amended periodically to reflect future changes. 3.1 Hydrologic Analyses Pre-Countywide Analyses Hydrologic analyses were carried out to establish peak discharge-frequency relationships for floods of the selected recurrence intervals for each flooding source studied in detail in the county. The hydrologic data for the Withlacoochee River was taken from Flood Hazard Information, Withlacoochee River, Nobleton to Gulf of Mexico, Florida dated August 1976 (USACE, August 1976). This report indicates that the discharge through the portion of the Withlacoochee River downstream of Lake Rousseau is 1540 cubic feet per second (cfs). The USACE report on the Cross Florida Barge Canal states, Under present conditions the maximum capacity of the bypass facilities, with the highest operating stage at Inglis Dam held to 27.5 feet to avoid flood damages in Dunnellon is about 1,540 cfs. The bypass facilities were placed into operation in December The discharge since that time has varied from a maximum of 1,740 cfs to a minimum of 58 cfs. One of the major effects of the project in this area has been the reduction of potential flood damages along the Lower Withlacoochee River by elimination of 7
12 freshwater flooding. The maximum flood of record (1960) with a maximum discharge of about 9,500 cfs caused floodwater elevations of about 11.0 feet in Inglis and 6.0 feet in Yankeetown. With the additional discharge capacity of the project canal, it is estimated that such a flood could be discharged with a maximum flood elevation at Yankeetown slightly higher than 3 feet North American Vertical Datum (NAVD). Flood crests of that elevation could be passed without significant damage. The report presented flood profiles for the mean annual, 10-, 25-, 50-, and 100- year floods, and the Standard Project Flood. The 500-year flood profile was determined by plotting the various frequency floods on probability paper at various locations on the river and extrapolating the 500-year flood elevation. The flows of the required frequencies for the Suwannee River were based on statistical analyses of discharge records covering the 37-year period taken from the Wilcox, Florida gage (No ) on the Suwannee River. The statistical analysis is the standard Log-Pearson Type III method as recommended by the Water Resources Council (USWRC, June 1977). The flows at the mouth of the Suwannee River were considered the same as those at the gage in Wilcox. The small increase in drainage area is offset by the travel length in that reach. The summary of drainage area-peak discharge relationships for each stream studied in detail is shown in Table 2 Summary of Discharges. TABLE 2 SUMMARY OF DISCHARGES FLOODING SOURCE AND LOCATION DRAINAGE AREA (sq. miles) PEAK DISCHARGE (CFS) PERCENT ANNUAL CHANCE PERCENT ANNUAL CHANCE 0.2- PERCENT PERCENT ANNUAL ANNUAL CHANCE CHANCE LONG POND At County Road ,440 1,940 2,850 At County Road ,364 1,838 2,700 At NW 55 th Avenue ,302 1,754 2,577 At County Road MAGEE BRANCH UNNAMED TRIBUTARY At NE 61 st Place ,140 1,670 At NE 67 th Place At Picnic Street At Main Street SUWANNEE RIVER At mouth 9,940 41,465 62,910 72,905 98,310 At Wilcox 9,640 41,465 62,910 72,905 98,310 8
13 FLOODING SOURCE AND LOCATION DRAINAGE AREA (sq. miles) PEAK DISCHARGE (CFS) PERCENT ANNUAL CHANCE PERCENT ANNUAL CHANCE 0.2- PERCENT PERCENT ANNUAL ANNUAL CHANCE CHANCE WACCASASSA RIVER UNNAMED TRIBUTARY At State Highway At U.S. Highway 27-A Coastal storm frequencies (number of occurrences per year) were determined using the Joint Probability Method as developed by Vance Myers (USDOC, April 1970). The Joint Probability Method enables one to create a number of simulated storms based on an analysis of historical records. Characteristics analyzed include the frequency at which storms enter the study area, and the probabilities associated with the size and intensity of a given storm. A statistical analysis was performed to derive the probability distributions (range of parameter values versus their associated probabilities) for the principal parameters which describe a hurricane or tropical storm; these are the central barometric pressure (measures intensity of a storm), the radius to maximum winds (measures the lateral extent of a storm), the forward speed, and the direction of travel. An analysis was also performed to determine the frequency with which hurricanes and tropical storms penetrate the west Florida coast or pass offshore if parallel to the coast. Publications utilized in the above analysis included Tropical Cyclone Data Deck (USDOC, May 1973), Tropical Cyclones of the North Atlantic (USDOC, June 1978), Some Climatological Characteristics of Hurricanes and Tropical Storms, Gulf and the East Coasts of the United States (USDOC, May 1975) and Meteorological Criteria for Standard Project Hurricane and Probable Maximum Hurricane Windfields, Gulf and East Coasts of the United States (USDOC, September 1979), all by the National Oceanic and Atmospheric Administration. The National Hurricane Research Project Reports Nos. 5 and 33 (USDOC, March 1957 and November 1959) were also utilized in the analysis. By combination of all parameters each with its associated probability, a large number of simulated storms can be numerically modeled, each with its own unique probability (Joint Probability). The probability of each resulting storm surge is then combined with the storm recurrence rate (frequency at which storms strike the coast) and the corresponding frequency (events of this surge height per year) for each storm surge determined. This procedure permits the simulation of many years of record, from which reliable estimates of flood recurrence intervals can be made. As a final step in the calculations, the astronomic tide of the study area was combined with the computed storm surge to yield recurrence intervals of 9
14 total water level. Where the potential for generation of storm waves greater than 1-foot existed, an analysis of wave heights was also performed and the computed wave heights were combined with the total water level to yield BFEs. Reduction in still water level as the storm surge moved inland was also calculated taking into account topography and vegetation characteristics. The values representing the parameters and their assigned probabilities are shown in Table 3 Parameter Values for Surge Elevation Computations. Revised Analyses For this countywide FIS, three areas were analyzed in detail. The three study areas are described below. The Long Pond Study Reach consists of a single study reach, which is located near Chiefland, Florida on the west side of U.S. Highway 19. The limits of the detailed study extends from CR-345 upstream 5.87 miles to a point located just upstream of CR-347 (NW 60 th Street). The total contributing drainage area at the outfall for the reach located at CR-345 is approximately 43.9 square miles. The basin consists primarily of rural and agricultural land uses with a minor amount of low density urbanized areas (Chiefland). The basin contains an estimated 3.63 percent Lake Area and has an average channel slope of 2.47 feet per mile. The Magee Branch Unnamed Tributary Study Reach consists of a single study reach, which is located near Bronson, Florida. The limits of the detailed study extends from a point 1,000 feet downstream of NE 61 st Place, upstream 2.42 miles to a point located just downstream of SR-24. The total contributing drainage area at the outfall for the reach located at NE 61 st Place is approximately 4.55 square miles (Magee Branch Basin 2). The basin consists of a uniform distribution us land uses including rural, agricultural and low density urbanized areas (Bronson). The basin contains an estimated 1.7 percent Lake Area and has an average channel slope of feet per mile. The Waccasassa River Unnamed Tributary Study Reach consists of a single study reach, which is located near Bronson, Florida. The limits of the detailed study extends from a point 1,000 feet downstream of NE 90 th Street, upstream 1.67 miles to a point located just downstream of SR-24. The total contributing drainage area at the outfall for the reach located at NE 90 th Street is approximately 2.82 square miles (Waccasassa River Basin 2). The basin consists of a uniform distribution us land uses including rural, agricultural and low density urbanized areas (Bronson). The basin contains an estimated 3.46 percent Lake Area and has an average channel slope of 5.65 feet per mile. 10
15 CENTRAL PRESSURE DEPRESSION (In Hg.) PROBABILITY: Entering 31% 31% 12% 7% 7% 5% 2% 5% Exiting 26% 32% 7% 7% 11% 7% 4% 0% Parallel 32% 26% 7% 12% 11% 10% 4% 4% STORM RADIUS (Nautical Miles) PROBABILITY: 37% 43% 20% FORWARD SPEED (Knots) PROBABILITY: Entering 24% 36% 40% Exiting 55% 32% 13% Parallel 41% 40% 19% CROSSING ANGLE 1 (Degrees) PROBABILITY: 6% 24% 24% 23% 23% FREQUENCY Landfalling/Existing = storms/nautical mile/year OF OCCURRENCE Alongshore = storms/nautical mile/year 1 = Clockwise from North TABLE 3 FEDERAL EMERGENCY MANAGEMENT AGENCY LEVY COUNTY, FL AND INCORPORATED AREAS PARAMETER VALUES FOR SURGE ELEVATION COMPUTATIONS
16 Streamflows for the Long Pond, Magee Branch Unnamed Tributary and Waccasassa River Unnamed Tributary were estimated using USGS Regional Regression Equations for a series of flood frequencies. The methodologies and equations used in that analysis are presented in detail in USGS, Water Resources Investigations , Technique for Estimating Magnitude and Frequency of Floods on Natural-Flow Streams in Florida, The National Flood Frequency Program (NFF), Version 3, was used to compute streamflow estimates for this analysis. Drainage basin maps for the study area were prepared using GIS. Input data required for the regression equation estimates, including Drainage Area, Channel Slope and Lake Area, were all determined using GIS based data. A flood frequency analysis was conducted to estimate streamflows at 17 USGS gages within a 9 county area adjacent to Levy County on streams with characteristics similar to those of the study reaches. The methodologies used in this analysis are documented in Bulletin #17B, Guidelines for Determining Flood Flow Frequency, March The USGS computer program PEAKFQ Annual Flood Frequency Analysis Using Bulletin 17B Guidelines, Version 4.1, February 25, 2002 was used to estimate streamflows and associated flood frequencies. Elevations for floods of the selected recurrence intervals of Long Pond are shown below. FLOODING SOURCE AND LOCATION ELEVATION (FEET NAVD 88) PERCENT PERCENT PERCENT PERCENT LONG POND Along shoreline Hydraulic Analyses Analyses of the hydraulic characteristics of flooding from the sources studied were carried out to provide estimates of the elevations of floods of the selected recurrence intervals. Users should be aware that flood elevations shown on the FIRM represent rounded whole-foot elevations and may not exactly reflect the elevations shown on the Flood Profiles or in the Floodway Data tables in the FIS report. For construction and/or floodplain management purposes, users are encouraged to use the flood elevation data presented in this FIS in conjunction with the data shown on the FIRM. 12
17 Pre-Countywide Analyses Water-surface elevations of floods of the selected recurrence intervals for the Withlacoochee River were determined from analysis of stream gages which have sufficiently long periods of record (USACE, August 1976). Cross sections for the water elevation analysis of the Suwannee River were obtained by aerial surveying methods from photography flown in 1979 for upland areas and by field measurement for areas below the water-surface. Bridges were field checked to confirm elevation data and structural geometry. Channel roughness factors (the n factor for Manning s Formula) used in the hydraulic computations, were chosen based on aerial photography and field observations of the streams and flood plain areas. This measure of roughness for the main channel of the Suwannee River ranges from to with flood plain roughness values ranging from 0.05 to for all floods. The acceptability of the above hydraulic factors, cross-sections, and hydraulic structure data was checked using these computations and comparing the results to known historic storms and the resulting flood elevations. Water-surface elevations of floods of the selected recurrence intervals were initially computed through use of the Corps of Engineers HEC-2 step backwater computer program (USACE, November 1976). In 2006, the HEC-2 computer files for the Suwannee River were converted to HEC-RAS files by the SRWMD for the Dixie and Gilchrist County, Florida FIS. Flood profiles were drawn showing water-surface elevations for floods of the selected recurrence intervals. Starting water-surface elevations at the mouth of the Suwannee River used in these calculations were determined from the slope-area method. The hydraulic analyses for this study were based on unobstructed flow. The flood elevations shown on the profiles are thus considered valid only if hydraulic structures remain unobstructed, operate properly, and do not fail. Located on the Gulf of Mexico, the coastline areas of Levy County are primarily subject to coastal storm surge flooding from hurricanes and tropical storms. Detailed hydraulic analyses of the shoreline characteristics were carried out to provide estimates of the elevations of floods of the selected recurrence intervals. The U.S. Department of Housing and Urban Development s standard coastal storm surge model (USDHUD, May 1978 revised March 1979 and February 1979 revised April 1979) was utilized to determine these flood levels. This model is a numerical hydrodynamic computer model which calculates the coastal storm surges previously described in Section 3.1. Before applying the numerical model to the study area, several recent hurricanes which have affected the west coast of Florida were simulated for verification purposes. Surge elevations computed by 13
18 the numerical model were compared to recorded tide gage heights at St. Marks and Cedar Key, Florida. The results are shown below. Computed by Numerical Model Plus Location Storm Predicted Tide Observed St. Marks Hurricane Alma (a) Hurricane Agnes (a) Cedar Key Hurricane Alma (b) Hurricane Agnes (b) (a) = (b) = Data from tide gage station, U.S. Army Corps of Engineers. Data from tide gage station, U.S. Department of Commerce, National Oceanic and Atmospheric Administration, National Ocean Survey. All elevations referenced in feet above NAVD. The numerical model for this region consisted of five nautical mile square grids extending 200 nautical miles in the north-south direction, and 200 nautical miles in the east-west direction. Water depths for the offshore regions were taken from selected National Ocean Survey hydrographic surveys with various dates and scales and National Ocean Survey bathymetric maps at a scale of 1 to 250,000 with bathymetric contour intervals at 2 and 10 meters depending on depth (USDOC). Additional topographic sources were utilized in conjunction with the storm surge model (USDOI). Because of the increased development in southern Levy County, a finer numerical model was applied to determine surge reductions inland from the coast. The inland model consisted of one nautical mile square grids extending 35 nautical miles in the north-south direction, centered near the mouth of the Withlacoochee River and 20 nautical miles in the east-west direction, centered near the mouth of the Crystal River. Water depths for the fine grid model were obtained from National Ocean Survey hydrographic surveys with various dates and scales (USDOC). Land elevations for the model were obtained from USGS 7.5 minute series topographic quadrangles. Roughness values (the n factor for Manning s formula) used in the fine grid computations were chosen based on aerial photography (1979) and field inspection (1980 and 1981). Typical values ranged from 0.06 for the tidal marsh areas to 0.40 for densely wooded uplands. The assigned values for typical vegetation types were obtained from standard roughness coefficient tables, such as those given in Chow 1959 (Ven Te Chow, 1959), and from an unpublished 14
19 U.S. Army Corps of Engineers report on the evaluation of Manning s n in vegetated areas. The computed tillwater flood elevations for Levy County are tabulated in the Coastal Flood Insurance Zone Data Table. These elevations reflect the combination of storm parameters, bathymetric and other features to produce the storm surge elevation with a recurrence interval of 100 years at specific locations along the coast. The variation of the tillwater elevations along the coast is mainly attributed to the offshore bathymetry and the orientation of the shoreline. Other features such as constrictive bays, passes, and shoals have localized effects on the surge elevations. Revised Analyses For this countywide FIS, the areas presented below were studied in detail to estimate flood elevations for the selected recurrence intervals. The Long Pond is located near the Town of Chiefland, Levy County, Florida west of U.S. Highway 19 / U.S. Highway 98. The Limits of the detailed study extend from County Road 345 to approximately 5.14 miles upstream to County Road 347. The total contributing drainage area for the reach located above County Road 345 is approximately square miles with a channel slope for the main channel averaging about 5 feet per mile at the downstream and about 8 feet per mile at the upstream within the detailed study area. The main channel has mostly a soil bottom with vegetated banks, some minor local obstructions and moderate meander. The overbank areas are generally heavily vegetated with trees causing a high degree of roughness. The land use is characterized as being predominately forested with a few areas identified as small single family residential. The soil type for the main channel and floodplain is mainly Placid and Popah soils. The study includes conveyance of the stream through four culvert structures located at the following: County Road 347, NW 55 th Avenue, County Road 341 / NW 60 th Avenue, County Road 345 / NW 70 th Avenue. The structure located at County Road 347 consists of one 3.5-foot diameter concrete pipe culvert with a concrete headwall and approximately 53 feet in length. The structure located at NW 55 th Avenue consists of two parallel 3.5-foot diameter concrete pipe culverts with a concrete headwall and approximately 37 feet in length. The structure located at County Road 341 consists of two parallel concrete box culverts with dimensions of 10 feet span by 8 feet rise and approximately 33 feet in length. The structure located at County Road 345 consists of two parallel concrete box culverts with dimensions of 10.5 feet span by 5 feet rise and approximately 46 feet in length. The Magee Branch Unnamed Tributary is located near the Town of Bronson, Levy County, Florida southwest of County Road 24 and north of Chunky Pond. The limits of the detailed study extend from NE 61 st Place / Lime Rock Road to approximately 2.12 miles upstream. The total contributing drainage area for the 15
20 reach located above NE 61 st Place is approximately 4.29 square miles with a channel slope for the main channel averaging about 4 feet per mile within the detailed study area. The main channel has mostly a sandy bottom with vegetated banks, some minor local obstructions and moderate meander. The overbank areas are generally heavily vegetated with trees causing a high degree of roughness. The land use is characterized as being predominately forested with a few areas identified as recreation and single family residential. The soil type for the main channel and floodplain is mainly Placid and Smyrna fine sand. The study includes conveyance of the stream through three culvert structures located at NE 61 st Place/Lime Rock Road, Picnic Street, and Main Street as well as one bridge structure located at NE 67 th Place. The structure located at NE 61 st Place consists of consists a 4-foot diameter concrete pipe culvert approximately 49 feet in length. The structure located at Picnic Street consists of consists of a two parallel 3.5-foot diameter concrete pipe culverts approximately 77 feet in length. The structure located at Main Street consists of a 2-foot diameter corrugated metal pipe culvert approximately 48 feet in length. The wooden bridge structure located at NE 67 th Place has one 1-foot diameter circular wooden pier, a deck width of 10 feet, a deck thickness of 1.3 feet, and no existing bridge guard rail. The Waccasassa River Unnamed Tributary is located near the Town of Bronson, Levy County, Florida northeast of County Road 24 and south of Station Pond. The limits of the detailed study extend from State Highway 32 / Ishie Avenue to approximately 1.61 miles upstream. The total contributing drainage area for the reach located above State Highway 32 is approximately 2.82 square miles with a channel slope for the main channel averaging about 3 feet per mile within the detailed study area. The main channel has mostly a sandy bottom with vegetated banks, some minor local obstructions and moderate meander. The overbank areas are generally heavily vegetated with trees causing a high degree of roughness. The land use is characterized as being predominately forested with a few areas identified as commercial. The soil type for the main channel and floodplain is mainly Placid and Smyrna fine sand. The study includes conveyance of the stream through culvert structures located at the following: State Highway 32 and State Road 27-A. The structure located at State Highway 32 consists of two parallel concrete box culverts with dimensions of 6.15-feet span by 3.9 feet rise and approximately 35 feet in length. The structure located at State Road 27-A is a concrete box culvert with dimensions of 8.1-feet span by 3 feet rise and approximately 181 feet in length. HEC-RAS models were developed for the Long Pond, Magee Branch Unnamed Tributary and Waccasassa River Unnamed Tributary to simulate flood elevations. Each model included details of natural channel geometry and considered all structures which potentially impact flood levels such as bridges and culverts. Channel cross-sections were obtained primarily from field surveys with 16
21 supplemented cross-sections being developed from USGS Levy County topographic data. Bridge and culvert structures were surveyed to obtain elevation data and structural geometry. All field survey was established with horizontal control in Florida North Zone (903) State Plane coordinates, and vertical control in NAVD 1988 datum. Bridge and culvert structure surveys included the top of road profile and upstream regular cross section. Channel and floodplain roughness coefficients (Manning s n ) were estimated based upon the methodology documented in USGS Water Supply Paper A combination of field observation, surveyor photographs, and aerial photography (USGS DOQQ) was used to establish the parameters used in the methodology. All of the areas studied as part of this revision have channels composed of sandy material and generally have bare bottoms. The channels have a relatively high roughness factor due to overhanging vegetation that persists year round. Similarly, the overbank areas are quite rough due to surface irregularities and heavy vegetation. Roughness values for the main channels ranged from to 0.13, and overbank values ranged from to for the streams studied in detail in this revised analysis. The starting water-surface elevations for the HEC-RAS models were determined using either normal depth or known water surface elevations for areas that were a continuation of the previous FIS. Floodways were determined for the streams in this study using methods 4 and 5 in HEC-RAS initially, then method 1 to refine the floodway and fix the encroachment stations. All surcharge values are between 0.0 and 1.0, and the floodway contains the channel and is within the 1-percent annual chance floodplain at all cross sections. 3.3 Wave Height Analysis The methodology for analyzing the effects of wave heights associated with coastal storm surge flooding is described in the National Academy of Sciences report (NAS, 1977). This method is based on the following major concepts. First, depth-limited waves in shallow water reach a maximum breaking height that is equal to 0.78 times the tillwater depth. The wave crest elevation is 70 percent of the total wave height plus the tillwater elevation. The second major concept is that wave height may be diminished due to the presence of obstructions such as sand dunes, dikes and seawalls, buildings and vegetation. The amount of energy dissipation is a function of the physical characteristics of the obstruction and is determined by procedures prescribed in the National Academy of Sciences. The third major concept is that wave height can be regenerated in open fetch areas due to the transfer of wind energy to the water. This added energy is related to fetch length and depth. Wave heights were computed along transects (cross section lines) that were located along the coastal areas, as illustrated in Figures 1, 2 and 3 Transect Location Map in accordance with the Users Manual for Wave Height Analysis (FEMA, 1977). The transects were located with consideration given to the 17
22 physical and cultural characteristics of the land so that they would closely represent conditions in their locality. Transects were spaced close together in areas of complex topography and dense development. In areas having more uniform characteristics, they were spaced at larger intervals. It was also necessary to locate transects in areas where unique flooding existed and in areas where computed wave heights varied significantly between adjacent transects. The transects were continued inland until the wave was dissipated or until flooding from another source with equal or greater elevation was reached. Along each transect, wave heights and elevations were computed considering the combined effects of changes in ground elevation, vegetation and physical features. The tillwater elevations for the 100-year flood were used as the starting elevations for these computations. Wave heights were calculated to the nearest 0.1-foot and wave elevations were determined at whole-foot increments along the transects. Areas with a wave component 3 feet or greater were designated as velocity zones. Other areas subject to wave action were designated as A Zones with BFEs adjusted to include wave crest elevations. A listing of the transect locations, starting tillwater surge elevations and initial wave crest elevations is provided in Table 4 Transect Locations, Stillwater Starting Elevations and Maximum Wave Crest Elevations. 18
23
24
25
26 TABLE 4 TRANSECT LOCATIONS, STILLWATER STARTING ELEVATIONS AND MAXIMUM WAVE CREST ELEVATIONS ELEVATIONS ABOVE NAVD 88 (Ft) TRANSECT LOCATION STILLWATER WAVE CREST Levy County (Unincorporated Areas) 1 Levy County at Weeks Fisher Creek, heading northeast, Gulf of Mexico Levy County at Deer Island, heading east, Gulf of Mexico 3 Levy County at Hog Island, heading east, Gulf of Mexico 4 Levy County approximately 1/3 of a mile south of Richards Island, heading northeast, Gulf of Mexico 5 Levy County approximately 1/3 of a mile east of Live Oak Key, heading north, Gulf of Mexico 6 Levy County At Hall Creek, heading northnortheast, Gulf of Mexico Levy County approximately ½ of a mile west of Depew Creek, heading north, Gulf of Mexico 8 Levy County approximately 1/3 of a mile north of the Waccasassa River, heading northeast, Gulf of Mexico 9 Levy County at Divedapper Creek, heading east, Gulf of Mexico
27 TABLE 4 TRANSECT LOCATIONS, STILLWATER STARTING ELEVATIONS AND MAXIMUM WAVE CREST ELEVATIONS (Continued) TRANSECT LOCATION Levy County (Unincorporated Areas) 10 Levy County at Turtle Creek Bay, heading eastnortheast, Gulf of Mexico ELEVATIONS ABOVE NAVD 88 (Ft) STILLWATER WAVE CREST Levy County at 13.8 Eleven Prong, heading east, Gulf of Mexico City of Cedar Key 12 Oriented NNW crossing 2nd Street approximately 200 feet west of the intersection with C Street 13 Oriented due east and crossing Gulf Boulevard approximately 150 feet south of Hawthorne Avenue 14 Oriented due east and crossing Gulf Boulevard approximately 150 feet south of Paroda Avenue Town of Yankeetown 15 Approximately ¾ of a mile north of Hodges Island, heading west 16 At Jubb Island heading east 17 At Pumpkin Island heading east 18 Beginning at the mouth of John s Creek (Citrus County) and heading northeast into Yankeetown Figure 4 is a profile for a hypothetical transect showing the effects of energy dissipation on a wave as it moves inland. This figure shows the wave elevation being diminished by obstructions, such as buildings, vegetation and rising ground elevations and being increased by open, unobstructed wind fetches. Actual wave conditions in Levy County may not necessarily include all the situations illustrated in Figure 4. 23
28 Figure 4 Transect Schematic Table 5 Transect Data, lists the flood hazard zone and BFEs for each transect, along with the 1-percent annual chance starting stillwater elevation for the Gulf of Mexico. TABLE 5 TRANSECT DATA TRANSECTS STILLWATER ELEVATION (feet NAVD 88) Percent Percent Percent Percent Zone BASE FLOOD ELEVATION (feet NAVD 88) 1 Levy County VE AE VE AE VE AE VE AE AE Due to map scale limitations, BFEs shown on the Flood Insurance Rate Map may represent average elevations for the zone depicted. 24
29 TABLE 5 TRANSECT DATA (Continued) TRANSECTS STILLWATER ELEVATION (feet NAVD 88) Percent Percent Percent Percent Zone BASE FLOOD ELEVATION (feet NAVD 88) 1 Levy County VE VE AE AE VE VE AE AE VE VE AE AE VE VE AE AE VE VE AE AE VE VE AE VE VE AE AE City of Cedar Key VE Due to map scale limitations, BFEs shown on the Flood Insurance Rate Map may represent average elevations for the zone depicted. 25
30 TABLE 5 TRANSECT DATA (Continued) STILLWATER ELEVATION (feet NAVD 88) BASE FLOOD ELEVATION TRANSECTS Percent Percent Percent Percent Zone (feet NAVD 88) 1 Town of Inglis * AE 12.2 * AE 9.2 Town of Yankeetown VE VE AE AE VE VE AE AE VE VE VE 14.2 Due to map scale limitations, BFEs shown on the Flood Insurance Rate Map may represent average elevations for the one depicted. 2 Not available. * Outside corporate limits. Ground elevations for wave calculations were taken from USGS 7.5 minute quadrangles with a contour interval of five feet, and in some cases from aerial transects with a scale of 1-inch 800 feet flown in 1979 with spot elevations (USDOI and AASCF). Coefficients for inland wave height reduction (transmission coefficients) were determined from aerial photography (1979) and by field inspection (1981). Fetch factors for wave build-up in unobstructed wind fetches were determined from the above sources and from standard tables and figures. Wave elevations between transects were interpolated using the cited sources. Factors affecting wave elevations between transects were identified and considered in relation to their effect upon wave elevations. The results showed that wave action was not appreciably reduced over the tidal marsh areas boarding 26
31 the Gulf of Mexico. However, a significant decrease in height did occur in the wooded swamp areas. Computed wave elevations are based upon existing topography, vegetation, and current development patterns and will require recomputation if significant changes occur in any of the above factors. 3.4 Vertical Datum All FISs and FIRMs are referenced to a specific vertical datum. The vertical datum provides a starting point against which flood, ground, and structure elevations can be referenced and compared. Until recently, the standard vertical datum in use for newly created or revised FISs and FIRMs was the National Geodetic Vertical Datum of 1929 (NGVD 29). With the finalization of the North American Vertical Datum of 1988 (NAVD 88), many FIS reports and FIRMs are being prepared using NAVD 88 as the referenced vertical datum. All flood elevations shown in this FIS report and on the FIRM are referenced to NAVD 88. Structure and ground elevations in the community must, therefore, be referenced to NAVD 88. It is important to note that adjacent communities may be referenced to NGVD 29. This may result in differences in BFEs across the corporate limits between the communities. Prior versions of the FIS report and FIRM were referenced to NGVD 29. When a datum conversion is effected for an FIS report and FIRM, the Flood Profiles and BFEs reflect the new datum values. To compare structure and ground elevations to 1-percent annual chance flood elevations shown in the FIS and on the FIRM, the subject structure and ground elevations must be referenced to the new datum values. As noted above, the elevations shown in the FIS report and on the FIRM for Levy County, Florida and Incorporated Areas, are referenced to NAVD 88. Ground, structure, and flood elevations may be compared and/or referenced to NGVD 29 by applying a standard conversion factor. The conversion factor from NGVD 29 to NAVD 88 is feet. The BFEs shown on the FIRM represent whole-foot rounded values. For example, a BFE of will appear as 102 on the FIRM and will appear as 103. Therefore, users that wish to convert the elevations in this FIS to NGVD 29 should apply the stated conversion factor(s) to elevations shown on the Flood Profiles and supporting data tables in the FIS report, which are shown at a minimum to the nearest 0.1-foot. For more information on NAVD 88, see Converting the National Flood Insurance Program to the North American Vertical Datum of 1988, FEMA Publication FIA- 20/June 1992, or contact the Spatial Reference System Division, National Geodetic Survey, NOAA, Silver Spring Metro Center, 1315 East-West Highway, Silver Spring, Maryland (Internet address 27
32 4.0 FLOOD PLAIN MANAGEMENT APPLICATIONS The NFIP encourages State and local governments to adopt sound floodplain management programs. Therefore, each FIS provides 1-percent-annual-chance flood elevations and delineations of the 1- and 0.2-percent-annual-chance floodplain boundaries and 1-percent-annual-chance floodway to assist communities in developing floodplain management measures. This information is presented on the FIRM and in many components of the FIS, including Flood Profiles, Floodway Data tables, and Summary of Stillwater Elevation tables. Users should reference the data presented in the FIS as well as additional information that may be available at the local community map repository before making flood elevation and/or floodplain boundary determinations. 4.1 Flood Boundaries To provide a national standard without regional discrimination, the 1-percent annual chance flood has been adopted by FEMA as the base flood for floodplain management purposes. The 0.2-percent annual chance flood is employed to indicate additional areas of flood risk in the community. For each stream studied in detail, the 1- and 0.2-percent annual chance floodplain boundaries have been delineated using the flood elevations determined at each cross section and wholefoot BFEs. Between cross sections and whole-foot BFEs, the boundaries for Gulf of Mexico, Suwannee River, and some portion of Withlacoochee River were interpolated using a cell size of 5-foot LIDAR data. Long Pond, Magee Branch Unnamed Tributary, Waccasassa River Unnamed Tributary, and Withlacoochee River boundaries were interpolated using 10m resolution Seamless DEM. The 1- and 0.2-percent annual chance floodplain boundaries are shown on the FIRM (Exhibit 2). On this map, the 1-percent annual chance floodplain boundary corresponds to the boundary of the areas of special flood hazards (Zones A and AE), and the 0.2-percent annual chance floodplain boundary corresponds to the boundary of areas of moderate flood hazards. In cases where the 1- and 0.2-percent annual chance floodplain boundaries are close together, only the 1-percent annual chance floodplain boundary has been shown. Small areas within the floodplain boundaries may lie above the flood elevations but cannot be shown due to limitations of the map scale and/or lack of detailed topographic data. Areas studied by approximate methods within the SRWMD jurisdiction were updated using a data layer known as wetcomp provided by the Suwannee River Water Management District. Wetcomp combines National Wetlands Inventory (NWI) data, land use and cover, as well as hydrography features. In areas within the SWFWMD jurisdiction, the 2007 Land Use Land Cover data layer was downloaded from SWFWMD to identify wetland flood features. 28
33 4.2 Floodways The floodways is the channel of a stream, plus any adjacent flood plain areas that must be kept free of encroachment in order that the 100-year flood may be carried without substantial increases in flood heights. There was no floodway computed for the Withlacoochee River or the Long Pond area due to the extremely flat terrain of the area. Encroachment on floodplains, such as structures and fill, reduces the floodcarrying capacity, increases the flood heights and velocities, and increases flood hazards in areas beyond the encroachment itself. One aspect of floodplain management involves balancing the economic gain from floodplain development against the resulting increase in flood hazard. For purposes of the National Flood Insurance Program, a floodway is used as a tool to assist local communities in this aspect of floodplain management. Under this concept, the area of the 1-percent annual chance floodplain is divided into a floodway and a floodway fringe. The floodway is the channel of a stream plus any adjacent floodplain areas that must be kept free of encroachment so that the 1-percent chance annual flood can be carried without substantial increases in flood heights. Minimum Federal standards limit such increases to 1.0 foot, provided that hazardous velocities are not produced. The floodways in this study are presented to local agencies as a minimum standard that can be adopted directly or that can be used as a basis for additional floodway studies. The floodways presented in this FIS report and on the FIRM were computed for certain stream segments on the basis of equal conveyance reduction from each side of the floodplain. Floodway widths were computed at cross sections. Between cross sections, the floodway boundaries were interpolated. The results of the floodway computations are tabulated for selected cross sections and are shown in Table 6 Floodway Data. The computed floodways are shown on the FIRM. In cases where the floodway and the 1-percent annual chance floodplain boundaries are either close together or collinear, only the floodway boundary is shown. The area between the floodway and the 1-percent annual chance floodplain boundaries is termed the floodway fringe. The floodway fringe encompasses the portion of the floodplain that could be completely obstructed without increasing the water-surface elevation of the 1-percent annual chance flood by more that 1.0 foot at any point. Typical relationships between the floodway and the floodway fringe and their significance to floodplain development are shown in Figure 5- Floodway Schematic. Portions of the floodway for the Suwannee River extend beyond the county boundary. 29
34 BASE FLOOD FLOODING SOURCE FLOODWAY WATER-SURFACE ELEVATION (FEET NAVD) SECTION MEAN WITHOUT WITH WIDTH AREA VELOCITY REGULATORY INCREASE CROSS SECTION DISTANCE 1 FLOODWAY FLOODWAY (FEET) (SQUARE (FEET PER (FEET NAVD 88) (FEET) (FEET NAVD 88) (FEET NAVD 88) FEET) SECOND) Magee Branch Unnamed Tributary A B 5, C 9, D 10, E 11, Feet above NE 61st Place / Lime Rock Road. TABLE 6 FEDERAL EMERGENCY MANAGEMENT AGENCY LEVY COUNTY, FL AND INCORPORATED AREAS FLOODWAY DATA MAGEE BRANCH UNNAMED TRIBUTARY
35 BASE FLOOD FLOODING SOURCE FLOODWAY WATER-SURFACE ELEVATION (FEET NAVD) CROSS SECTION DISTANCE 1 SECTION MEAN WITHOUT WITH WIDTH 2 AREA VELOCITY REGULATORY INCREASE FLOODWAY FLOODWAY (FEET) (SQUARE (FEET PER (FEET NAVD 88) (FEET) (FEET NAVD 88) (FEET NAVD 88) FEET) SECOND) Suwannee River A ,091/312 63, B ,807/3,368 68, C ,847/1,030 47, D ,531/3,110 45, E ,688/334 60, Miles above mouth. 2 Width/Width within County boundary. TABLE 6 FEDERAL EMERGENCY MANAGEMENT AGENCY LEVY COUNTY, FL AND INCORPORATED AREAS FLOODWAY DATA SUWANNEE RIVER
36 FLOODING SOURCE CROSS SECTION DISTANCE 1 WIDTH (FEET) Waccasassa River Unnamed Tributary FLOODWAY SECTION AREA (SQUARE FEET) MEAN VELOCITY (FEET PER SECOND) REGULATORY (FEET NAVD 88) BASE FLOOD WATER-SURFACE ELEVATION (FEET NAVD) WITHOUT FLOODWAY (FEET NAVD 88) WITH FLOODWAY (FEET NAVD 88) INCREASE (FEET) A B 2, C 6, D 8, Feet above State Highway 32 / Ishie Avenue. TABLE 6 FEDERAL EMERGENCY MANAGEMENT AGENCY LEVY COUNTY, FL AND INCORPORATED AREAS FLOODWAY DATA WACCASASSA RIVER UNNAMED TRIBUTARY
37 Figure 5 - Floodway Schematic 5.0 INSURANCE APPLICATION For flood insurance rating purposes, flood insurance zone designations are assigned to a community based on the results of the engineering analyses. These zones are as follows: Zone A Zone A is the flood insurance rate zone that corresponds to the 1-percent annual chance floodplains that are determined in the Flood Insurance Study by approximate methods. Because detailed hydraulic analyses are not performed for such areas, no BFEs or depths are shown within this zone. Zone AE Zone AE is the flood insurance rate zone that corresponds to the 1-percent annual chance floodplains that are determined in the Flood Insurance Study by detailed methods. Whole-foot BFEs derived from the detailed hydraulic analyses are shown at selected intervals within this zone. 33
38 Zone AH Zone AH is the flood insurance rate zone that corresponds to the areas of 1-percent annual chance shallow flooding (usually areas of ponding) where average depths are between 1 and 3 feet. Whole-foot BFEs derived from the detailed hydraulic analyses are shown at selected intervals within this zone. Zone AO Zone AO is the flood insurance rate zone that corresponds to the areas of 1-percent annual chance shallow flooding (usually sheet flow on sloping terrain) where average depths are between 1 and 3 feet. Average whole-foot depths derived from the detailed hydraulic analyses are shown within this zone. Zone A99 Zone A99 is the flood insurance rate zone that corresponds to areas of the 1-percent annual chance floodplain that will be protected by a Federal flood protection system where construction has reached specified statutory milestones. No BFEs or depths are shown within this zone. Zone V Zone V is the flood insurance rate zone that corresponds to the 1-percent annual chance coastal floodplains that have additional hazards associated with storm waves. Because approximate hydraulic analyses are performed for such areas, no BFEs are shown within this zone. Zone VE Zone VE is the flood insurance rate zone that corresponds to the 1-percent annual chance coastal floodplains that have additional hazards associated with storm waves. Whole-foot BFEs derived from the detailed hydraulic analyses are shown at selected intervals within this zone. Zone X Zone X is the flood insurance rate zone that corresponds to areas outside the 0.2-percent annual chance floodplain, areas within the 0.2-percent annual chance floodplain, and to areas of 1-percent annual chance flooding where average depths are less than 1-foot, areas of 1-percent annual chance flooding where the contributing drainage area is less than 1 square mile, and areas protected from the 1-percent annual chance flood by levees. No BFEs or depths are shown within this zone. Zone D Zone D is the flood insurance rate zone that corresponds to unstudied areas where flood hazards are undetermined, but possible. 34
39 6.0 FLOOD INSURANCE RATE MAP The FIRM is designed for flood insurance and floodplain management applications. For flood insurance applications, the map designates flood insurance rate zones as described in Section 5.0 and, in the 1-percent annual chance floodplains that were studied by detailed methods, shows selected whole-foot BFEs or average depths. Insurance agents use the zones and BFEs in conjunction with information on structures and their contents to assign premium rates for flood insurance policies. For floodplain management applications, the map shows by tints, screens, and symbols the 1-and 0.2-percent annual chance floodplains, the floodways, and the locations of selected cross sections used in the hydraulic analyses and floodway computations. The current FIRM presents flooding information for the entire geographic area of Levy County. Prior to countywide mapping, separate Flood Hazard Boundary Maps (FHBMs) and/or FIRMs were prepared for each identified flood-prone incorporated community and the unincorporated areas of the county. Historical data relating to the pre-countywide FIRMs prepared for each community up to and including this countywide FIS, are presented in Table 7 Community Map History. 35
40 COMMUNITY NAME INITIAL IDENTIFICATION FLOOD HAZARD BOUNDARY MAP REVISIONS DATE FIRM EFFECTIVE DATE Bronson, Town Of October 13, 1978 None February 1, 1987 Cedar Key, City Of July 22, 1977 January 13, 1978 March 1, 1984 FIRM REVISIONS DATE June 2, 1992 June 30, 1999 Chiefland, City Of Inglis, Town Of December 29, 1978 None March 1, 1984 Levy County, Unincorporated Areas January 24, 1975 December 16, 1977 March 1, 1984 June 2, 1992 Otter Creek, Town Of August 17, 1979 None September 1, 2005 Williston, City Of Yankeetown, Town Of August 20, 1971 None August 20, 1971 July 1, 1974 February 27, 1976 March 1, 1984 TABLE 7 FEDERAL EMERGENCY MANAGEMENT AGENCY LEVY COUNTY, FL AND INCORPORATED AREAS COMMUNITY MAP HISTORY
41 7.0 OTHER STUDIES The U.S. Army Corps of Engineers, Jacksonville District, published "Special Flood Hazard Information, Suwannee River Floods, Florida and Georgia" in December 1974 (USACOE, December 1974). The profiles and flood mapping presented in this report are in agreement with the Corps of Engineers report. Stage Frequency Determination from High Water Marks (Withlacoochee and Little Withlacoochee Rivers)" in April 1975 (SWFWMD, April 1975), which is also in agreement with this study. The National Oceanic and Atmospheric Administration has published a report titled "Storm Tide Frequency Analysis for the Gulf Coast of Florida, from Cape San Blas to St. Petersburg Beach" (USDOC, April 1975). In this report, storm tide height frequency distributions are developed in the Levy County area of the Gulf Coast by computing storm tides from a set of climatologically representative hurricanes using the National Weather Service hydrodynamic storm surge model (USDOC, March 1974). Tide levels computed are for stillwater only. The elevations presented in this report are in agreement with the concurrent Flood Insurance Study reports for Dixie County, Florida (FEMA, 2006), Gilchrist County, Florida (FEMA, 2006) and Citrus County, Florida. Information pertaining to revised and unrevised flood hazards for each jurisdiction within Levy County has been compiled into this FIS. Therefore, this FIS supersedes all previously printed FIS Reports, FHBMs, FBFMs, and FIRMs for all of the incorporated and unincorporated jurisdictions within Levy County. 8.0 LOCATION OF DATA Information concerning the pertinent data used in the preparation of this study can be obtained by contacting FEMA, Federal Insurance and Mitigation Division, Koger Center Rutgers Building, 3003 Chamblee Tucker Road, Atlanta, Georgia
42 9.0 BIBLIOGRAPHY AND REFERENCES Abrams Aerial Survey Corporation of Florida, 1979, subcontracted by Gee & Jepson Engineers-Architects-Planners, Inc., Aerial Contour Maps, Scale 1" = 800', with spot elevations. Chow, Ven Te., Open Channel Hydraulics, McGraw-Hill New York, Toronto, London, Environmental Science Administration, Florida Hurricanes, by G.E. Dunn and Staff; Technical Memorandum W BTM-SR-38, Ft. Worth, Texas, November Federal Emergency Management Agency, Users Manual for Wave Action Effects Associated with Storm Surges (Notional Academy of Sciences 1977), April Federal Emergency Management Agency, Flood Insurance Study, Dixie County, Unincorporated Areas, Florida, Federal Emergency Management Agency, Flood Insurance Study, Gilchrist County, Unincorporated Areas, Florida, National Academy of Sciences, Methodology for Calculating Wave Action Effects Associated with Storm Surges, Southwest Florida Water Management District, "Flood Stage Frequency Determination from High Water Marks (Withlacoochee and Little Withlacoochee Rivers)", April, U.S. Army Corps of Engineers, Galveston District, Guidelines for Identifying Coastal High Hazard Zones, June U.S. Army Corps of Engineers, Hydrologic Engineering Center, HEC 2 Water-Surface Profiles Users Manual with Supplement, Davis, California, Computer Program 723-X6- L202A, November U.S. Army Corps of Engineers, Jacksonville District, Flood Hazard Information, Withlacoochee River Nobleton to Gulf of Mexico Florida, August, 1976, prepared for Southwest Florida Water Management District. U.S. Army Corps of Engineers, Jacksonville District, Survey Report, Analysis of Hurricane Problems in Coastal Areas of Florida, U.S. Army Corps of Engineers, Special Flood Hazard Information, Suwannee River Floods, Florida and Georgia, December U.S. Department of Commerce, Environmental Science Services Administration, Joint Probability Methods of Tide Frequency Analysis Applied to Atlantic City and Long Island, New Jersey; Vance A. Myers, ESSA Technical Memorandum WBPM, Hydro, April 1970.
43 U.S. Department of Commerce, National Oceanic and Atmospheric Administration, Environmental Data Service, National Climatic Center, Climate of Florida, Asheville, North Carolina, U.S. Department of Commerce, National Oceanic and Atmospheric Administration, PD-9636 Tropical Cyclone Data 993, Volume I, Volume 11, Data Processing Division, USAFETAC Card Deck Reference Manual, Revised May U.S. Department of Commerce, National Oceanic and Atmospheric Administration, Tropical Cyclones of the North Atlantic Ocean, 1971 to 1977; June U.S. Department of Commerce, National Oceanic and Atmospheric Administration, Some Climatological Characteristics of Hurricanes and Tropical Storms Gulf and East Coasts of the United States, by Francis P. Ho, Richard W. Schwerdt, and Hugo V. Goodyear, NOAA Technical Report NWS15, May U.S. Department of Commerce, National Oceanic and Atmospheric Administration, Meteorological Criteria for Standard Project Hurricane and Probable Maximum Hurricane Windfields, Gulf and East Coasts of the United States, NOAA TR W S23, September U.S. Department of Commerce, National Oceanic and Atmospheric Administration, National Ocean Survey, Selected NOS Hydrographic Surveys, various dates and scales. U.S. Department of Commerce, National Oceanic and Atmospheric Administration, National Ocean Survey Bathymetric Maps, scale 1:250,000 with two to ten meter bathymetric contour intervals depending on depth. Datum mean low water. U.S. Department of Commerce, National Oceanic and Atmospheric Administration, Technical Memorandum NWS HYDEO-20, Storm Tide Frequency Analysis for the Gulf Coast of Florida from Cape San Blas to St. Petersburg Beach, by Francis P. Ho and Robert J. Tracey, Office of Hydrology, Silver Spring, MD, April U.S. Department of Commerce, National Oceanic and Atmospheric Administration; SPLASH (Special Program to List Amplitudes of Surges From Hurricanes Part 2) General Track and Variant Storm Conditions, by C.P. Jelesnianski, Technical Memorandum NWS TDL-52, Techniques Development Laboratory, Silver Spring, MD, March U.S. Department of Commerce, Weather Bureau, Meteorological Considerations Pertinent to Standard Project Hurricane Atlantic and Gulf Coasts of the United States by Howard E. Graham and Dwight E. Nunn, National Hurricane Research Project Report No. 33, November U.S. Department of Commerce, Weather Bureau, Survey of Meteorological Factors Pertinent to Reduction of Loss of Life and Property in Hurricane Situations, National Hurricane Research Project Report No. 5, Washington, D.C., March 1957.
44 U.S. Department of Housing and Urban Development Coastal Flooding Storm Surge Model, Part I, Methodology, May 1978, Revised March U.S. Department of Housing and Urban Development, Coastal Flooding Storm Surge Model, Part II Code and Users Guide, February 1979, Revised April U.S. Department of the Interior, Geological Survey, 2-Degree Series, Topographic Maps, Scale 1:250,000, Contour Interval 50 feet with supplementary contours at 5 feet intervals. U.S. Department of the Interior, Geological Survey, 7.5-Minute Series Topographic Maps, Scale I"=2000', Contour Intervals 5 feet. U.S. Water Resources Council, "Guidelines for Determining Flood Flow Frequency", Bulletin #17A, Washington, D.C., revised June University of Florida, Bureau of Economic and Business Research, Population Division, Florida Estimates of Population, April 1, University of Florida, Review of Beach Erosion and Storm Tide Conditions in Florida, by P. Bruun. University of Florida, Storm Tides in Florida as Related to Coastal Topography, by P. Bruun, T.Y. Chiu, F. Gerritsen and W.H. Morgan, Bulletin No. 109, Coastal Engineering Laboratory, Gainesville, Florida, January 1962.

45
46
47
48
LOMR SUBMITTAL LOWER NEHALEM RIVER TILLAMOOK COUNTY, OREGON
 LOMR SUBMITTAL LOWER NEHALEM RIVER TILLAMOOK COUNTY, OREGON Prepared for: TILLAMOOK COUNTY DEPARTMENT OF COMMUNITY DEVELOPMENT 1510-B THIRD STREET TILLAMOOK, OR 97141 Prepared by: 10300 SW GREENBURG ROAD,
CAMDEN COUNTY, GEORGIA
 CAMDEN COUNTY, GEORGIA AND INCORPORATED AREAS COMMUNITY NAME COMMUNITY NUMBER CAMDEN COUNTY 130262 (UNINCORPORATED AREAS) KINGSLAND, CITY OF 130238 ST. MARYS, CITY OF 130027 WOODBINE, CITY OF 130241 CAMDEN
UPPER COSUMNES RIVER FLOOD MAPPING
 UPPER COSUMNES RIVER FLOOD MAPPING DRAFT BASIC DATA NARRATIVE FLOOD INSURANCE STUDY SACRAMENTO COUTY, CALIFORNIA Community No. 060262 November 2008 Prepared By: CIVIL ENGINEERING SOLUTIONS, INC. 1325 Howe
LOMR SUBMITTAL LOWER NESTUCCA RIVER TILLAMOOK COUNTY, OREGON
 LOMR SUBMITTAL LOWER NESTUCCA RIVER TILLAMOOK COUNTY, OREGON Prepared for: TILLAMOOK COUNTY DEPARTMENT OF COMMUNITY DEVELOPMENT 1510-B THIRD STREET TILLAMOOK, OR 97141 Prepared by: 10300 SW GREENBURG ROAD,
Appendix E Guidance for Shallow Flooding Analyses and Mapping
 Appendix E Guidance for Shallow Flooding Analyses and Mapping E.1 Introduction Different types of shallow flooding commonly occur throughout the United States. Types of flows that result in shallow flooding
YELLOWSTONE RIVER FLOOD STUDY REPORT TEXT
 YELLOWSTONE RIVER FLOOD STUDY REPORT TEXT TECHNICAL REPORT Prepared for: City of Livingston 411 East Callender Livingston, MT 59047 Prepared by: Clear Creek Hydrology, Inc. 1627 West Main Street, #294
Storm Surge Analysis Update Meeting Cross City, Florida June 17, 2014
 Big Bend Coastal Storm Surge Study Storm Surge Analysis Update Meeting Cross City, Florida June 17, 2014 Introductions Risk MAP Project Team FEMA Region IV Florida Division of Emergency Management (FDEM)
ARMSTRONG COUNTY, PA
 ARMSTRONG COUNTY, PA Revised Preliminary DFIRM Mapping March 31, 2013 Kevin Donnelly, P.E., CFM GG3, Greenhorne & O Mara, Inc. Presentation Agenda Armstrong County DFIRM Overview - June 25, 2010 DFIRM
TOWN OF FORT KENT, MAINE AROOSTOOK COUNTY
 TOWN OF FORT KENT, MAINE AROOSTOOK COUNTY PRELIMINARY: 01/07/2013 Federal Emergency Management Agency COMMUNITY NUMBER 230019V000A NOTICE TO FLOOD INSURANCE STUDY USERS Communities participating in the
PENNSYLVANIA DEPARTMENT OF TRANSPORTATION ENGINEERING DISTRICT 3-0
 PENNSYLVANIA DEPARTMENT OF TRANSPORTATION ENGINEERING DISTRICT 3-0 LYCOMING COUNTY S.R.15, SECTION C41 FINAL HYDROLOGIC AND HYDRAULIC REPORT STEAM VALLEY RUN STREAM RELOCATION DATE: June, 2006 REVISED:
Coastal Flood Risk Study Project for East Coast Central Florida Study Area
 Coastal Flood Risk Study Project for East Coast Central Florida Study Area St Lucie County, Florida Flood Risk Review Meeting March 28, 2017 Introductions Risk MAP Project Team FEMA Region IV BakerAECOM,
Chapter 5 CALIBRATION AND VERIFICATION
 Chapter 5 CALIBRATION AND VERIFICATION This chapter contains the calibration procedure and data used for the LSC existing conditions model. The goal of the calibration effort was to develop a hydraulic
VOLUME 3 OF 3 FAIRFIELD COUNTY, OHIO AND INCORPORATED AREAS COMMUNITY NAME NUMBER COMMUNITY NAME NUMBER
 VOLUME 3 OF 3 FAIRFIELD COUNTY, OHIO AND INCORPORATED AREAS COMMUNITY NAME NUMBER COMMUNITY NAME NUMBER AMANDA, VILLAGE OF * 390688 PICKERINGTON, CITY OF 390162 BALTIMORE, VILLAGE OF 390159 PLEASANTVILLE,
3.11 Floodplains Existing Conditions
 Other stormwater control practices may be needed to mitigate water quality impacts. In addition to detention facilities, other practices such as vegetated basins/buffers, infiltration basins, and bioswales
Application #: TEXT
 TOWN OF FORT MYERS BEACH 2008 PROPOSED COMPREHENSIVE PLAN AMENDMENTS Application #: 2008-13-TEXT Description: Modify the Coastal Management and Future Land Use Elements to reflect the state s new definition
GREENE COUNTY, PA. Revised Preliminary DFIRM Mapping FEMA. Kevin Donnelly, P.E., CFM GG3, Greenhorne & O Mara, Inc. April 10, 2013
 GREENE COUNTY, PA Revised Preliminary DFIRM Mapping April 10, 2013 Kevin Donnelly, P.E., CFM GG3, Greenhorne & O Mara, Inc. Presentation Agenda Greene County DFIRM Overview September 30, 2010 DFIRM Countywide
Location: Jacksonville, FL December 11, 2012
 Technical Update Meeting Northeast Florida Surge Study Location: Jacksonville, FL December 11, 2012 Agenda 2:00 2:15 Welcome/Introductions Tucker Mahoney, FEMA Region IV Michael DelCharco, BakerAECOM 2:15
YANKTON COUNTY, SOUTH DAKOTA
 YANKTON COUNTY, SOUTH DAKOTA AND INCORPORATED AREAS Community Name Community Number GAYVILLE, TOWN OF* 460205 IRENE, TOWN OF 460120 LESTERVILLE, TOWN OF* 460206 MISSION HILL, TOWN OF 460091 UTICA, TOWN
Section 4: Model Development and Application
 Section 4: Model Development and Application The hydrologic model for the Wissahickon Act 167 study was built using GIS layers of land use, hydrologic soil groups, terrain and orthophotography. Within
Ground Water Protection Council 2017 Annual Forum Boston, Massachusetts. Ben Binder (303)
") Ground Water Protection Council 2017 Annual Forum Boston, Massachusetts Protecting Groundwater Sources from Flood Borne Contamination Ben Binder (303) 860-0600 Digital Design Group, Inc. The Problem Houston
Ground Water Protection Council 2017 Annual Forum Boston, Massachusetts Protecting Groundwater Sources from Flood Borne Contamination Ben Binder (303) 860-0600 Digital Design Group, Inc. The Problem Houston
MASON COUNTY, MICHIGAN
 MASON COUNTY, MICHIGAN (ALL JURISDICTIONS) MASON COUNTY Community Community Community Community Name Number Name Number AMBER, TOWNSHIP OF 261271 LOGAN, TOWNSHIP OF 260811 BRANCH, TOWNSHIP OF 261272 LUDINGTON,
JOURNAL OF ENVIRONMENTAL HYDROLOGY The Electronic Journal of the International Association for Environmental Hydrology VOLUME
 JOURNAL OF ENVIRONMENTAL HYDROLOGY The Electronic Journal of the International Association for Environmental Hydrology VOLUME 18 2010 REDUCED CHANNEL CONVEYANCE ON THE WICHITA RIVER AT WICHITA FALLS, TEXAS,
Dealing with Zone A Flood Zones. Topics of Discussion. What is a Zone A Floodplain?
 Dealing with Zone A Flood Zones Topics of Discussion Overview of Zone A Floodplains Permitting Development in Zone A Floodplains Estimating Flood Elevations in Zone A Flood Insurance Implications Letters
McINTOSH COUNTY, GEORGIA
 McINTOSH COUNTY, GEORGIA AND INCORPORATED AREAS Community Name Community Number Darien, City of 130131 McIntosh County 130130 (Unincorporated Areas) Preliminary: McIntosh County FLOOD INSURANCE STUDY NUMBER
CLAY COUNTY, MINNESOTA AND INCORPORATED AREAS
 CLAY COUNTY, MINNESOTA AND INCORPORATED AREAS Community Name Community Number BARNESVILLE, CITY OF 270078 CLAY COUNTY 275235 (UNINCORPORATED AREAS) *COMSTOCK, CITY OF 270079 DILWORTH, CITY OF 270080 *FELTON,
LIBERTY COUNTY, GEORGIA
 LIBERTY COUNTY, GEORGIA AND INCORPORATED AREAS Liberty County Community Name Community Number ALLENHURST, TOWN OF 130350 FLEMINGTON, CITY OF 130124 GUMBRANCH, CITY OF 130610 HINESVILLE, CITY OF 130125
 Red River Flooding June 2015 Caddo and Bossier Parishes Presented by: Flood Technical Committee Where the Rain Falls Matters I-30 versus I-20 I-20 Backwater and Tributary Floods (Localized) 2016 Flood
PLYMOUTH COUNTY, MASSACHUSETTS (ALL JURISDICTIONS)
") PLYMOUTH COUNTY, MASSACHUSETTS Volume 2 of 3 COMMUNITY NAME COMMUNITY NUMBER ABINGTON, TOWN OF 250259 BRIDGEWATER, TOWN OF 250260 BROCKTON, CITY OF 25026 CARVER, TOWN OF 250262 DUXBURY, TOWN OF 250263
PLYMOUTH COUNTY, MASSACHUSETTS Volume 2 of 3 COMMUNITY NAME COMMUNITY NUMBER ABINGTON, TOWN OF 250259 BRIDGEWATER, TOWN OF 250260 BROCKTON, CITY OF 25026 CARVER, TOWN OF 250262 DUXBURY, TOWN OF 250263
LOCATED IN INDIAN RIVER COUNTY PREPARED FOR S.J.R.W.M.D. AND F.W.C.D. DECEMBER, 2003 Updated 2007 Updated May 2014 PREPARED BY
 FELLSMERE WATER CONTROL DISTRICT EAST MASTER DRAINAGE PLAN AND STORMWATER HYDROLOGIC ANALYSIS OF THE GRAVITY DRAINAGE SYSTEM LOCATED BETWEEN THE EAST BOUNDARY, LATERAL U, THE MAIN CANAL, AND DITCH 24 LOCATED
Issue 44: Phase II & III H&H Issues Date: 07/03/2006 Page 1
 Background Phase I of the NCFMP studies have primarily focused on the coastal plain and sandhills physiographic regions in of the State. Phase II and III study areas will focus on the piedmont, foothills,
2016 NC Coastal Local Governments Annual Meeting
 6 NC Coastal Local Governments Annual Meeting NCFMP Coastal Map Maintenance Flood Study Updates and Changes April, 6 Tom Langan, PE, CFM Engineering Supervisor NCEM-Risk Management - Floodplain Mapping
Miami-Dade County Technical Update Meeting South Florida Coastal Study. May 11, 2016
 Miami-Dade County Technical Update Meeting South Florida Coastal Study May 11, 2016 Welcome and Introductions FEMA Region IV Christina Lindemer Technical Lead Production and Technical Services (PTS) Contractor
Storm Induced Coastal Erosion for Flood Insurance Studies and Forecasting Coastal Flood Damage Impacts: Erosion, Runup & Overtopping
 Storm Induced Coastal Erosion for Flood Insurance Studies and Forecasting Coastal Flood Damage Impacts: Erosion, Runup & Overtopping Jeff Gangai- Dewberry Tucker Mahoney FEMA HQ Introduction Background
Coastal Flood Risk Study Project for Northeast Florida Study Area
 Coastal Flood Risk Study Project for Northeast Florida Study Area Duval County, Florida Flood Risk Review Meeting September 22, 2015 Introductions Risk MAP Project Team FEMA Region IV BakerAECOM, FEMA
MORGAN COUNTY COLORADO, AND INCORPORATED AREAS
 MORGAN COUNTY COLORADO, AND INCORPORATED AREAS VOLUME 1 OF 1 Morgan County COMMUNITY NAME COMMUNNITY NUMBER BRUSH, CITY OF 080130 FORT MORGAN, CITY OF 080131 LOG LANE VILLAGE, TOWN OF* 080217 MORGAN COUNTY
Quick Response Report #126 Hurricane Floyd Flood Mapping Integrating Landsat 7 TM Satellite Imagery and DEM Data
 Quick Response Report #126 Hurricane Floyd Flood Mapping Integrating Landsat 7 TM Satellite Imagery and DEM Data Jeffrey D. Colby Yong Wang Karen Mulcahy Department of Geography East Carolina University
Technical Notes: Magnitude and Return Period of 2004 Hurricane Rainfall in Florida
 Journal of Floodplain Management Floodplain Management Association NOV. 2005 Vol. 5, No. 1 Glenn Tootle 1 Thomas Mirti 2 Thomas Piechota 3 Technical Notes: Magnitude and Return Period of 2004 Hurricane
Pequabuck River Flooding Study and Flood Mitigation Plan The City of Bristol and Towns of Plainville and Plymouth, CT
 Pequabuck River Flooding Study and Flood Mitigation Plan The City of Bristol and Towns of Plainville and Plymouth, CT Raymond Rogozinski and Maged Aboelata The City of Bristol and Towns of Plainville and
Appendix C Fluvial Flood Hazards
 Appendix C Fluvial Flood Hazards Sea Level Rise Vulnerability Assessment and Adaptation Project March 2019 Contents Contents... i Figures... i Tables... i Definitions, Acronyms, & Abbreviations... ii
New Jersey Department of Transportation Extreme Weather Asset Management Pilot Study
 New Jersey Department of Transportation Extreme Weather Asset Management Pilot Study Overview Prepared for: June 26, 2018 Introduction Overview of Pilot Study New Jersey s Climate New Jersey s Transportation
MEMORANDUM FOR SWG
 MEMORANDUM FOR SWG-2007-1623 Subject: Jurisdictional Determination (JD) for SWG-2007-1623 on Interdunal Wetlands Adjacent to Traditional Navigable Waters (TNWs) Summary The U.S. Environmental Protection
FLOOD INSURANCE STUDY
 FLOOD INSURANCE STUDY CHARLES CITY COUNTY, VIRGINIA AND INCORPORATED AREAS COMMUNITY NAME COMMUNITY NUMBER CHARLES CITY COUNTY (UNINCORPORATED AREAS) 510198 Charles City County REVISED DATE Preliminary
HURRICANE IVAN CHARACTERISTICS and STORM TIDE EVALUATION
 HURRICANE IVAN CHARACTERISTICS and STORM TIDE EVALUATION By Robert Wang and Michael Manausa Sponsored by Florida Department of Environmental Protection, Bureau of Beaches and Coastal Systems Submitted
U.S. ARMY CORPS OF ENGINEERS
 CORPS FACTS Regulating Mississippi River Navigation Pools U.S. ARMY CORPS OF ENGINEERS BUILDING STRONG Historical Background Federal improvements in the interest of navigation on the Mississippi River
SOMERSET COUNTY, MARYLAND
 SOMERSET COUNTY, MARYLAND AND INCORPORATED AREAS COMMUNITY NAME CID NUMBER CRISFIELD, CITY OF 240062 PRINCESS ANNE, TOWN OF 240063 SOMERSET COUNTY (UNINCORPORATED AREAS) 240061 Somerset County PRELIMINARY:
L OWER N OOKSACK R IVER P ROJECT: A LTERNATIVES A NALYSIS A PPENDIX A: H YDRAULIC M ODELING. PREPARED BY: LandC, etc, LLC
 L OWER N OOKSACK R IVER P ROJECT: A LTERNATIVES A NALYSIS A PPENDIX A: H YDRAULIC M ODELING PREPARED BY: LandC, etc, LLC TABLE OF CONTENTS 1 Introduction... 1 2 Methods... 1 2.1 Hydraulic Model... 1 2.2
Analysis of Tides and Storm Surge from Observational Records in the Delaware Inland Bays
 Analysis of Tides and Storm Surge from Observational Records in the Delaware Inland Bays John Callahan Delaware Geological Survey Coastal GeoTools Conference March 30 April 2, 2015 Charleston, SC Outline
PRINCE GEORGE COUNTY, VIRGINIA AND INCORPORATED AREAS
 PRINCE GEORGE COUNTY, VIRGINIA AND INCORPORATED AREAS COMMUNITY NAME COMMUNITY NUMBER PRINCE GEORGE COUNTY (UNINCORPORATED AREAS) 510204 Prince George County Federal Emergency Management Agency FLOOD INSURANCE
A More Comprehensive Vulnerability Assessment: Flood Damage in Virginia Beach
 A More Comprehensive Vulnerability Assessment: Flood Damage in Virginia Beach By Raj Shah GIS in Water Resources Fall 2017 Introduction One of the most obvious effects of flooding events is death. Humans
5.2 IDENTIFICATION OF HAZARDS OF CONCERN
 5.2 IDENTIFICATION OF HAZARDS OF CONCERN 2016 HMP Update Changes The 2011 HMP hazard identification was presented in Section 3. For the 2016 HMP update, the hazard identification is presented in subsection
Evaluation of Storm Tide Measurements at Panama City Beach, FL
 Evaluation of Storm Tide Measurements at Panama City Beach, FL 1993-2007 Prepared by Mark E. Leadon Beaches and Shores Resource Center Florida State University May 2009 Prepared for Florida Department
PRELIMINARY CULVERT ANALYSIS REPORT FOR CULVERT NO. 008-C OREGON AVENUE OVER PINEHURST CREEK
 PRELIMINARY CULVERT ANALYSIS REPORT FOR CULVERT NO. 008-C OREGON AVENUE OVER PINEHURST CREEK Prepared for The District of Columbia Department of Transportation Washington, D.C. Prepared by Parsons Transportation
Mapping of Future Coastal Hazards. for Southern California. January 7th, David Revell, Ph.D. E.
 Mapping of Future Coastal Hazards for Southern California January 7th, 2014 David Revell, Ph.D. drevell@esassoc.com E. Vandebroek, 2012 Outline Coastal erosion hazard zones Flood hazard zones: Coastal
Red River Levee Panel
 Red River Levee Panel Mississippi River Commission Monday, August 9, 2017 Red River Levees in LA & AR NONE along TX & OK Boarder Red River Levee Issues Caddo Levee Cherokee Park Authorization Bossier Levee
HURRICANE FRANCES CHARACTERISTICS and STORM TIDE EVALUATION
 HURRICANE FRANCES CHARACTERISTICS and STORM TIDE EVALUATION ((DRAFT)) By Robert Wang and Michael Manausa Sponsored by Florida Department of Environmental Protection, Bureau of Beaches and Coastal Systems
SLOSH New Orleans Basin 2012 Update
 SLOSH New Orleans Basin 2012 Update Michael Koziara Science and Operations Officer National Weather Service Slidell, LA The Basics What is storm surge? What is SLOSH? Details Assumptions Inundation = Storm
5.2 IDENTIFICATION OF HAZARDS OF CONCERN
 5.2 IDENTIFICATION OF HAZARDS OF CONCERN 2015 HMP Update Changes The 2010 HMP hazard identification was presented in Section 6. For the 2015 HMP update, the hazard identification is presented in subsection
JOSEPHINE COUNTY, OREGON AND INCORPORATED AREAS VOLUME 1 OF 2
 JOSEPHINE COUNTY, OREGON AND INCORPORATED AREAS VOLUME 1 OF 2 COMMUNITY NAME COMMUNITY NUMBER CAVE JUNCTION, CITY OF 410107 GRANTS PASS, CITY OF 410108 JOSEPHINE COUNTY UNINCORPORATED AREAS 415590 Effective:
Final Results and Outreach Lessons Learned
 FEMA REGION III COASTAL HAZARD STUDY Final Results and Outreach Lessons Learned June 4, 2014 Mari Radford Christine Worley Robin Danforth David Bollinger FEMA Region III RAMPP FEMA Region III FEMA Region
Background on the March 13-14, 2007 Flooding in Browns Valley (Traverse County), Minnesota
, Minnesota") Background on the March 13-14, 2007 Flooding in Browns Valley (Traverse County), Minnesota Report to the Minnesota Governor s Office Prepared by: Minnesota Department of Natural Resources Waters Division
Background on the March 13-14, 2007 Flooding in Browns Valley (Traverse County), Minnesota Report to the Minnesota Governor s Office Prepared by: Minnesota Department of Natural Resources Waters Division
5.2. IDENTIFICATION OF NATURAL HAZARDS OF CONCERN
 5.2. IDENTIFICATION OF NATURAL HAZARDS OF CONCERN To provide a strong foundation for mitigation strategies considered in Sections 6 and 9, County considered a full range of natural hazards that could impact
Draft for Discussion 11/11/2016
 Coastal Risk Consulting (CRC) Climate Vulnerability Assessment for Village of Key Biscayne Deliverable 1.1 in Statement of Work. Preliminary Vulnerability Assessment Identifying Flood Hotspots Introduction...
USGS Flood Inundation Mapping of the Suncook River in Chichester, Epsom, Pembroke and Allenstown, New Hampshire
 USGS Flood Inundation Mapping of the Suncook River in Chichester, Epsom, Pembroke and Allenstown, New Hampshire NH Water & Watershed Conference Robert Flynn, USGS NH-VT Water Science Center March 23, 2012
FLOOD INSURANCE STUDY
 FLOOD INSURANCE STUDY NEW KENT COUNTY, VIRGINIA AND INCORPORATED AREAS COMMUNITY NAME COMMUNITY NUMBER NEW KENT COUNTY (UNINCORPORATED AREAS) 510306 New Kent REVISED DATE Preliminary Date: January 31,
Highland Lake Bathymetric Survey
 Highland Lake Bathymetric Survey Final Report, Prepared For: The Town of Highland Lake 612 Lakeshore Drive Oneonta, AL 35121 Prepared By: Tetra Tech 2110 Powers Ferry Road SE Suite 202 Atlanta, GA 30339
COASTAL FLOODING IMPACT REPORT (100-YEAR RETURN PERIOD EVENT) CORDECO DISCOVERY BAY RESORT & MARINA BO. ESPINAL, AGUADA, P.R.
 CORDECO DISCOVERY BAY RESORT & MARINA BO. ESPINAL, AGUADA, P.R.") COASTAL FLOODING IMPACT REPORT (100-YEAR RETURN PERIOD EVENT) CORDECO DISCOVERY BAY RESORT & MARINA BO. ESPINAL, AGUADA, P.R. submitted to CORDECO NORTHWEST CORP. 2305 LAUREL ST. SAN JUAN, P.R. 00913 by
COASTAL FLOODING IMPACT REPORT (100-YEAR RETURN PERIOD EVENT) CORDECO DISCOVERY BAY RESORT & MARINA BO. ESPINAL, AGUADA, P.R. submitted to CORDECO NORTHWEST CORP. 2305 LAUREL ST. SAN JUAN, P.R. 00913 by
DRAFT Design Hydraulic Study. Bridge 04C-0055, Mattole Road Bridge over Mattole River at Honeydew. Humboldt County. Prepared for:
 DRAFT Design Hydraulic Study Bridge 04C-0055, Mattole Road Bridge over Mattole River at Honeydew Humboldt County Prepared for: Morrison Structures Incorporated 1890 Park Marina Drive, Suite 104 Redding,
SANDUSKY COUNTY, OHIO (AND INCORPORATED AREAS)
") SANDUSKY COUNTY, OHIO (AND INCORPORATED AREAS) COMMUNITY NAME COMMUNITY NUMBER BURGOON, VILLAGE OF 390488 CLYDE, CITY OF 390489 FREMONT, CITY OF 390490 GIBSONBURG, VILLAGE OF 390491 GREEN SPRINGS, VILLAGE
SANDUSKY COUNTY, OHIO (AND INCORPORATED AREAS) COMMUNITY NAME COMMUNITY NUMBER BURGOON, VILLAGE OF 390488 CLYDE, CITY OF 390489 FREMONT, CITY OF 390490 GIBSONBURG, VILLAGE OF 390491 GREEN SPRINGS, VILLAGE
THE NEED FOR AN ADDITIONAL SPILLWAY AT THE SANFORD DAM BOILING SPRING LAKES, NC. Presentation for The Brunswick County Commissioners April 20, 2015
 THE NEED FOR AN ADDITIONAL SPILLWAY AT THE SANFORD DAM BOILING SPRING LAKES, NC Presentation for The Brunswick County Commissioners April 20, 2015 The Sanford Dam Earth Dam constructed in 1961 Drainage
McHenry County Property Search Sources of Information
 Disclaimer: The information in this system may contain inaccuracies or typographical errors. The information in this system is a digital representation of information derived from original documents; as
Analysis of Hydraulic Impacts on the Schuylkill River
 Analysis of Hydraulic Impacts on the Schuylkill River Manayunk Sewer Basin Construction Project and the Venice Island Recreation Center Reconstruction Project Venice Island, Manayunk, Philadelphia, PA
SECTION 5: RISK ASSESSMENT FLOOD. Table of Contents
 Table of Contents SECTION 5 Risk Assessment... 5-1 5.1 Hazard Profile... 5-1 5.2 Hazard Description... 5-1 Previous Occurrences and Losses... 5-39 Probability of Future Occurrences... 5-56 Climate Change
3301 Rickenbacker Causeway, Miami, FL 33149
 Virginia Key and Miami Beach 2016 King Tide Report and Projections (to 2045) using: 3301 Rickenbacker Causeway, Miami, FL 33149 *THIS REPORT IS PROVIDED SUBJECT TO THE COASTAL RISK CONSULTING, LLC, PRINTED
Draft exercise for share fair at Bozeman workshop only. This exercise is not ready for distribution. Please send helpful suggestions to
 Draft exercise for share fair at Bozeman workshop only. This exercise is not ready for distribution. Please send helpful suggestions to foleyd@plu.edu Figure list 1. Trailer photograph 2. Location map
4.1 Hazard Identification: Natural Hazards
 data is provided in an annex, it should be assumed that the risk and potential impacts to the affected jurisdiction are similar to those described here for the entire Sacramento County Planning Area. This
Local Flood Hazards. Click here for Real-time River Information
 Local Flood Hazards Floods of the White River and Killbuck Creek are caused by runoff from general, and/or intense rainfall. Other areas of flooding concern are from the Boland Ditch and Pittsford Ditch.
CITY OF TUSCALOOSA ORGANIZATION OF 2015 FMP FLOODPLAIN MANAGEMENT PLAN
 CITY OF TUSCALOOSA FLOODPLAIN MANAGEMENT PLAN FMPC Meeting #2 July 8, 2015 ORGANIZATION OF 2015 FMP 2015 Floodplain Management Plan Structure Chapter 1 Introduction Chapter 2 Community Profile Chapter
OKALOOSA COUNTY, FLORIDA AND INCORPORATED AREAS
 VOLUME 1 OF 1 OKALOOSA COUNTY, FLORIDA AND INCORPORATED AREAS COMMUNITY NAME CINCO BAYOU, TOWN OF 120596 CRESTVIEW, CITY OF 120597 DESTIN, CITY OF 125158 FORT WALTON BEACH, CITY OF 120174 LAUREL HILL,
Climate. Annual Temperature (Last 30 Years) January Temperature. July Temperature. Average Precipitation (Last 30 Years)
 January Temperature. July Temperature. Average Precipitation (Last 30 Years)") Climate Annual Temperature (Last 30 Years) Average Annual High Temp. (F)70, (C)21 Average Annual Low Temp. (F)43, (C)6 January Temperature Average January High Temp. (F)48, (C)9 Average January Low Temp.
Climate Annual Temperature (Last 30 Years) Average Annual High Temp. (F)70, (C)21 Average Annual Low Temp. (F)43, (C)6 January Temperature Average January High Temp. (F)48, (C)9 Average January Low Temp.
Great Lakes Update. Volume 194: 2015 Annual Summary
 Great Lakes Update Volume 194: 2015 Annual Summary Background The U.S. Army Corps of Engineers (USACE) tracks and forecasts the water levels of each of the Great Lakes. This report summarizes the hydrologic
Appendix A STORM SURGE AND WAVE HEIGHT ANALYSIS
 Appendix A STORM SURGE AND WAVE HEIGHT ANALYSIS Memo To: Jeff Robinson, P.E., GEC, Inc. From: Silong Lu, Ph.D., P.E., D.WRE, Dynamic Solutions, LLC. Date: 1/9/2014 CC: Re: Chris Wallen, Vice President,
StreamStats: Delivering Streamflow Information to the Public. By Kernell Ries
 StreamStats: Delivering Streamflow Information to the Public By Kernell Ries U.S. Department of the Interior U.S. Geological Survey MD-DE-DC District 410-238-4317 kries@usgs.gov StreamStats Web Application
Flooding in Western North Carolina: Some Spatial, Hydrologic, and Seasonal Characteristics CAUTION!! Outline. Basic Flood Facts.
 Flooding in Western North Carolina: Some Spatial, Hydrologic, and Seasonal Characteristics J. Greg Dobson CAUTION!! National Environmental Modeling and Analysis Center RENCI at UNC-Asheville Engagement
Hydrologic Forecast Centre. Manitoba Infrastructure. Winnipeg, Manitoba FEBRUARY FLOOD OUTLOOK REPORT FOR MANITOBA.
 Page 1 of 20 Hydrologic Forecast Centre Manitoba Infrastructure Winnipeg, Manitoba FEBRUARY FLOOD OUTLOOK REPORT FOR MANITOBA February 28, 2019 Overview The February Outlook Report prepared by the Hydrologic
ASFPM - Rapid Floodplain Mapping
 ASFPM - Nicole Cominoli Hydraulic Engineer USACE - Omaha District mary.n.cominoli@usace.army.mil June 3, 2015 US Army Corps of Engineers Mitigation = Risk Informed Decisions 2 The National Flood Insurance
McHenry County Property Search Sources of Information
 Disclaimer: The information in this system may contain inaccuracies or typographical errors. The information in this system is a digital representation of information derived from original documents; as
HYDROLOGIC AND HYDRAULIC REPORT FOR SR. 0522, SECTION 5BN ALONG BLACKLOG CREEK CROMWELL TOWNSHIP HUNTINGDON COUNTY. Prepared for:
 HYDROLOGIC AND HYDRAULIC REPORT FOR SR. 0522, SECTION 5BN ALONG BLACKLOG CREEK CROMWELL TOWNSHIP Prepared for: KCI Technologies, Inc. Mechanicsburg, PA and Pennsylvania Department of Transportation Engineering
SAN FRANCISCO DISTRICT INFORMATION REQUESTED FOR VERIFICATION OF CORPS JURISDICTION
 DEPARTMENT OF THE ARMY SAN FRANCISCO DISTRICT, U.S. ARMY CORPS OF ENGINEERS 1455 MARKET STREET SAN FRANCISCO, CALIFORNIA 94103-1398 SAN FRANCISCO DISTRICT INFORMATION REQUESTED FOR VERIFICATION OF CORPS
Hydrology and Hydraulics Design Report. Background Summary
 To: National Park Services Montezuma Castle National Monument Richard Goepfrich, Facility Manager From: Multicultural Technical Engineers Date: Tuesday - February 13, 2018 Subject: 30% Hydrology and Hydraulics
Base Level Engineering FEMA Region 6
 Base Level Engineering Over the past five years, has been evaluating its investment approach and data preparation work flow to establish an efficient and effective change in operation, generating an approach
Natural Disasters. in Florida. Severe Thunderstorms
 Natural Disasters in Florida SC.6.E.7.7 Investigate how natural disasters have affected human life in Florida. Severe Thunderstorms While the typical afternoon thunderstorm in Florida may not appear to
STATUS OF HAZARD MAPS VULNERABILITY ASSESSMENTS AND DIGITAL MAPS
 JapanInternational Cooperation Agency STATUS OF HAZARD MAPS VULNERABILITY ASSESSMENTS AND DIGITAL MAPS ANGUILLA REPORT THE CARIBBEAN DISASTER EMERGENCY RESPONSE AGENCY () Table of Contents Page Preface
HYDROLOGIC AND WATER RESOURCES EVALUATIONS FOR SG. LUI WATERSHED
 HYDROLOGIC AND WATER RESOURCES EVALUATIONS FOR SG. LUI WATERSHED 1.0 Introduction The Sg. Lui watershed is the upper part of Langat River Basin, in the state of Selangor which located approximately 20
Chapter 7 Mudflow Analysis
 Chapter 7 Mudflow Analysis 7.0 Introduction This chapter provides information on the potential and magnitude of mud floods and mudflows that may develop in Aspen due to rainfall events, snowmelt, or rain
MISSOURI LiDAR Stakeholders Meeting
 MISSOURI LiDAR Stakeholders Meeting East-West Gateway June 18, 2010 Tim Haithcoat Missouri GIO Enhanced Elevation Data What s different about it? Business requirements are changing.fast New data collection
Marine Analysis. LA 23 New. Louisiana. Prepared by:
 Gulf Intracoastal Waterway (GIWW) Marine Vessel Trafficc Analysis LA 23 New Orleans Gulf Coastt Railway Relocation PE/NEPA Project Jefferson and Plaquemines Parishes, Louisiana RPC Task LA23RR1 RPC/FRA
THC-T-2013 Conference & Exhibition
 Modeling of Shutter Coastal Protection against Storm Surge for Galveston Bay C. Vipulanandan, Ph.D., P.E., Y. Jeannot Ahossin Guezo and and B. Basirat Texas Hurricane Center for Innovative Technology (THC-IT)
SUSSEX COUNTY, DELAWARE AND INCORPORATED AREAS
 VOLUME 1 OF 3 SUSSEX COUNTY, DELAWARE AND INCORPORATED AREAS COMMUNITY COMMUNITY NUMBER COMMUNITY COMMUNITY NUMBER BETHANY BEACH, TOWN OF 105083 LAUREL, TOWN OF 100040 BETHEL, TOWN OF 100055 LEWES, CITY
FEMA REGION III COASTAL HAZARD STUDY
 FEMA REGION III COASTAL HAZARD STUDY Impacts and Rollout June 11, 2013 Robin Danforth, FEMA Region III David Bollinger, FEMA Region III Jeff Gangai, RAMPP Christine Worley, RAMPP 1 Today s Discussion Overview
Design Hydraulic Study. Bridge 09C-0134, Blairsden-Graeagle Road over Middle Fork Feather River. Plumas County. Prepared for:
 Design Hydraulic Study Bridge 09C-0134, Blairsden-Graeagle Road over Middle Fork Feather River Plumas County Prepared for: Quincy Engineering, Inc 3247 Ramos Circle Sacramento, CA 95827-2501 Prepared by: