GSA DATA REPOSITORY D. Livsey and A.R. Simms
|
|
|
- Lesley Nash
- 5 years ago
- Views:
Transcription
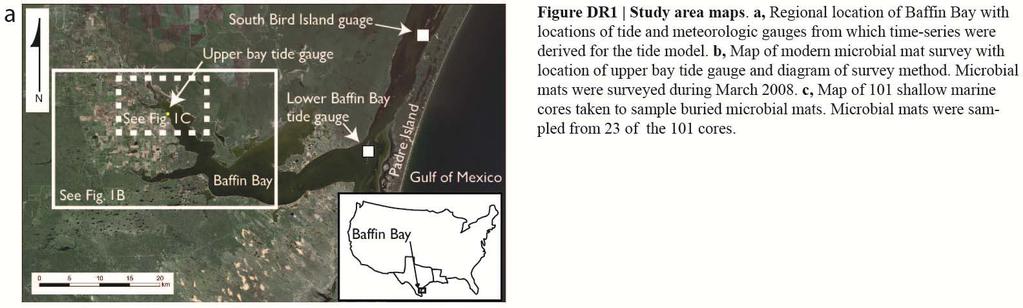
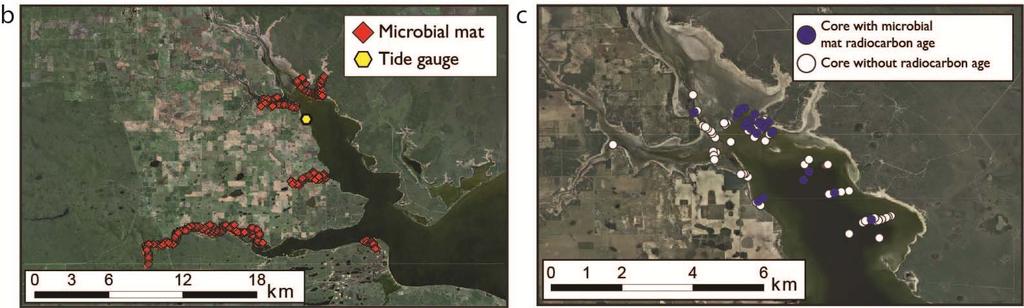
1 GSA DATA REPOSITORY D. Livsey and A.R. Simms Supplementary Information The supplementary information is divided into three sections: (1) Tide model and datums, (2) Vertical error calculation, and (3) Supplementary Figures and Tables. The section, Tide model and datums, addresses how the tide model was implemented, tidal datum definitions, and comparison of tidal datums computed from the tide model data and from the method outlined in National Ocean Service (NOS) (2003). The Vertical error calculation section details calculation of vertical error defined in equation 2 of the main text. Data repository Figure 1 (Fig. DR1) contains 3 study maps: (1) a map of the regional location of Baffin Bay and tide gauges, (2) a map of the modern microbial mat survey, and (3) a map of core locations. Figure DR2 plots the observed tide data and tide model. Figures DR3 and DR4 plot the principal component analysis and correlation matrix of factors affecting upper Baffin Bay water levels respectively. Table DR1contains coordinate information for cores, core top elevations, basal microbial mat elevation data, vertical error tabulations, and microbial mat radiocarbon data. Table DR2 contains tidal datums computed from the 10-year tide model and tidal datums estimated by the method of NOS (2003). Tide Model and Datums Establishing the indicative range of microbial mats in upper Baffin Bay requires not only the elevation distribution of modern microbial mats (Fig. 3) but also the long-term (annual to decadal) in-situ water-level measurements capturing the yearly to decadal tidal fluctuations. In the absence of a permanent tide gauge in upper Baffin Bay we deployed a Valeport 740 tide gauge set to measure water levels every 5 minutes for 6 months (Fig. DR2A). The gauge was calibrated to the salinity and temperature of the bay water at the time of deployment on November 21, The tide gauge data were not calibrated for changes in temperature or salinity with time, as no salinity or water temperature time-series are available for upper Baffin Bay. We implemented a model to predict upper bay water levels from a 10-year time-series of modeled astronomic tides, a tide gauge at the bay-mouth, and meteorological data. The 1
2 astronomic tide was modeled for 10 years using a MATLAB routine Secrets of the Tide: Tide & Tidal Current Analysis (Boon, 2004). Data from a permanent gauge at the bay-mouth of Baffin Bay provided a nearly continuous record of water level observations for the last 10 years (Fig. DR1A). Another permanent station, South Bird Island, located 20 km northeast of the baymouth (Fig. DR1A) recorded 10 years of meteorological data including: wind direction, wind speed, water temperature, atmospheric pressure, and air temperature. Principal component analysis (Fig DR3) and a correlation matrix (Fig DR4) were utilized to determine which factors correlated with the upper bay tide data. Time-series that correlated most with the 6 months of upper bay tide gauge data are: the upper bay modeled astronomic tide data, lower Baffin Bay water level, water temperature, wind direction, and air pressure. The tide model was created by a recursive technique by the following steps: 1. The initial residual was calculated between the observed upper bay tide data and predicted astronomic tide data. 2. The linear relationship between the upper bay residual calculated in step 1 and lower bay water levels was found thereby establishing Upper bay water levels as a function of lower bay water levels. 3. The linear coefficients calculated in step 2 were used to calculate an estimate of the remaining upper bay water level residuals. 4. The predictions calculated in step 3 were added to the initial astronomic model. 5. A second (and reduced) residual was calculated from subtracting the new model (now a function of astronomic tides and lower bay-water levels) from the observed upper bay tide data. 6. Steps 2 through 5 were then repeated with successive time-series (e.g. wind direction) reducing the residual between the new models and observed upper bay tide data. 7. Using the above technique, upper bay water levels as a function of predicted astronomic tides, lower bay water levels, water temperature, wind direction, and air pressure were found and have an R 2 fit of 0.66 with the observed upper bay water-level data (Fig. DR2A). With the upper bay water level as a function of these time-series we modeled the upper bay-water level for 10 years (Fig. DR2B) and calculated yearly mean tidal datums. NOS (2003) provides a method of estimating long-term tidal datums by tying short-term tidal records to nearby longer-term tide records. Tidal datums termed herein as NOS estimated tidal datums were computed from tying the 6-month upper bay tide gauge record to the 10-year lower bay tide gauge record. NOS estimated tidal datums and tidal datums computed from the 10-year tide model are within 0.00 m to 0.07 m (Table DR2). We interpret this close agreement between 2
3 tidal datums to support the validity of tide model. For definition and calculation methods for tidal datums the reader is referred to NOS 2001 and Vertical Error Calculation The vertical range (VR) to paleo mean sea level for each buried microbial mat sample is calculated by: VR = E m ± (δ + VE) (1) 2 2 VE = [e 1 + e 2 + e 2 n ] 0.5 (2) E m is the elevation of a buried microbial mat derived from the core tope elevation minus the midpoint depth of the buried microbial mat sample thickness. E m is taken as the midpoint of a buried microbial mat sample thickness because microbial mats found in upper Baffin Bay vary in thickness from 2 mm to ~ 5 cm and exhibit wavy lamination (Fig 2A). δ is the indicative range of the microbial mats and VE is vertical error from additional sources of e i errors. The upper vertical range (VR+) and lower vertical range (VR-) are computed by: VR+ = E m + (δ*0.5 + VE+) (3) VE+ = [(D 2 + (0.5*L) 2 + T 2 + Ac 2 )] 0.5 (4) VR- = E m + (δ*0.5 + VE-) (5) VE- = [(D 2 + (0.5*L) 2 + T 2 )] 0.5 (6) Where VE+ is the upper vertical error and VE- is the lower vertical error. D is the error from the differential GPS survey. L is the loss or compaction of sediment during coring. L is the difference between core penetration and core recovery. L may be from loss of sediment from the core barrel or additional compaction during core recovery. T is the buried microbial mat sample thickness. Ac is error from non-normal coring. The differential GPS observations were collected using a Topcon Hiper Lite GPS composed of a fixed GPS base station and GPS rover. D, error from the differential GPS survey, and the vertical precision of the modern microbial mat survey includes base station elevation error and error from the observation between the base station and rover (henceforth referred to as base to rover error). Each GPS base station was deployed between 4 and 8 hours. Base station elevations and elevation error were calculated from base station observations using the Online Positioning User Service (OPUS) provided by the National Geodetic Survey. Base to rover errors were computed using Topcon Tools software. The absolute depth of the microbial mat down-core will be underestimated if the core barrel is non-normal to the sea floor. An estimate of Ac is computed from: 3
4 Ac = sin(θ)*sd (7) Where Θ is the angle of coring in degrees from normal (a maximum of 15 in this study) and SD is the down-core sample depth. Ac is only included in VE+ because these errors will only act to decrease sample elevation. All vertical error calculations may be found in Table DR1. References Boon, J.D., 2004, Secrets of the Tide: Tide and Tidal Current analysis and Predictions, Storm surges and Sea Level Trends: Horwood Publishing, Chichester, U.K. 212 pp. NOS, National Ocean Service, 2003, Computational Techniques for tidal datums handbook: NOAA Technical Report NOS COOPS, no. 2 NOS, National Ocean Service, 2000, Tide and Current Glossary: Center For Operational Oceanographic Products and Services. Trauth, M., 2010, Matlab recipes for the Earth sciences: New York, Springer-Verlag Berlin Heidelbeg, 336 p. 4
5 5
6 a 0.4 Observations Model U(Upwl,Lwl,Wt,Wd,Ap) R = b Model Observations Elevation (m, MSL) Elevation (m, MSL) /12/ /05/ /28/ /20/ /11/ /06/ /29/2011 Month/Day/Year (mm/dd/yy) -1 02/02 01/03 01/04 01/05 01/06 01/07 01/08 01/09 01/10 01/11 01/12 Month/Year (mm/yy) Figure DR2 Tide data and model. a, Comparison of 6 months of upper bay tide gauge data and the tide model. The tide model is a function of modeled astronomic tide (Upwl), lower bay water level (Lwl), water temperature (Wt), wind direction (Wd), and barometric pressure (AP). Note model fit with R 2 of b, 10 year projection of tide model from a and 6 months of upper bay tide gauge data.
7 Principal component load PC1 47.2% PC2 21.1% PC3 14.5% PC4 8.7% Water temp. (C) Air temp. (C) Atmospheric pressure (mbars) Wind speed (m/s) Bay-mouth water level (m) Upper-bay water level (m) Wind direction Modeled astronomic tide (m) Figure DR3 Factors affecting upper Baffin Bay water level. Principal component (PC) loadings of 6 months of meteorological and modeled astronomical timeseries data that affect upper Baffin Bay water levels. Percentages of each nth PC indicates percent of data variance described by nth PC. First four PC plotted describe 91.5% of data variance Loadings indicate amount that given variable contributes to nth PC. Note predicted astronomic tides and bay-mouth water levels exhibit the greatest loadings in PC1 that explains 47% of data variance. Wind direction has the greatest loadings of PC2 that explains 21% of data variance. Wind speed only has the greatest loadings in PC3 that only explains 14.5% of data variance. Therefore astronomic tidal forcing is interpreted to have the strongest influence on upper-bay water levels followed by wind direction having moderate influence, and wind speed having the least influence upon upper-bay water levels. All time-series data, except for the upper-bay water levels and modeled astronomic tides, obtained from the Division of Nearshore Research, Conrad Blucher Institute for Surveying and Science, Texas A&M University-Corpus Christi. See Trauth (2010) for further description of principal component analysis. Astronomic tides were modeled from the 6 months of upper bay tide gauge data using the MATLAB routine` Secrets of the Tide: Tide & Tidal Current Analysis 2 available at
8 1 Upwl 0.8 Lwl 0.6 Wt 0.4 At 0.2 Ap 0 Wd -0.2 Ws -0.4 Uwl Upwl Lwl Wt At Ap Wd Ws Uwl -0.6 Figure DR4 Correlation analysis. Correlation matrix of meteorologic and modeled astronomic tide time-series data that affect upper Baffin Bay water levels. Abbreviations are as follow: upper bay modeled astronomic tide (Upwl), lower bay water level (Lwl), water temperature (Wt), air temperature (At), barometric pressure (Ap), wind direction (Wd), wind speed (Ws), and 6 months upper bay water-level data (Uwl). A correlation coefficient of 1 indicates a given variable is positively correlated with another variable. Conversely a correlation coefficient of -1 indicates a given variable is inversely correlated with another variable. A correlation coefficient near 0 indicates that two variables are not related. Note that lower bay water level, water temperature, and upper bay modeled astronomic tide have the greatest positive correlation with upper bay water-level data while wind speed exhibits a correlation coefficient of ca. 0. Wind direction exhibits an inverse correlation with upper-bay water levels. This is expected as greater azimuths would indicate more northerly winds forcing water from Baffin Bay and decreasing upper-bay water levels. All time-series data, except for the observed upper-bay water levels and modeled astronomic tide, obtained from the Division of Nearshore Research, Conrad Blucher Institute for Surveying and Science, Texas A&M University-Corpus Christi. See Trauth (2010) for further description of correlation coefficient calculations. Astronomic tides were modeled from the 6 months of upper bay tide gauge data using the MATLAB routine` Secrets of the Tide: Tide & Tidal Current Analysis 2 available for free at
9 Table DR1 Buried microbial mat elevation, error, and age data Sample ID Latitude (WGS84) Longitude (WGS84) Core Top Elevation Sample (m) depth (m) Sample elevation (m) Sample elevation (NAVD88) a (m) (MSL) b Positive range (VE+) c to mean sea level (m) Negative range (VR-) c to mean sea level (m) Error of DGPS survey (m) (D) c Loss (m) (L) c Non-normal coring (m) (Ac) c Depth between sample and Pleistocene (m) Depth between sample and incompressible substrate d (m) Sample type e Total Holocene thickness (m) 14C age f Age Error (+/-) f d13c f Radiocarbon reservoir g AM 11_02 16 cm Basal / AM 10_08 19 cm Intercalated / AM10_07 24 cm Intercalated / AM 11_13 34 cm Intercalated / AM10_18 53 cm Intercalated / AM 11_17 51 cm Intercalated / AM 11_09 34 cm Intercalated / AM 11_16 58 cm Intercalated / AM 11_17 27 cm Intercalated / AM 11_18 57 cm Intercalated / AM 11_15 47cm Basal of basal / AM 10_19 47 cm Intercalated / AM10_06 43 cm * * Intercalated * / AM 11_10 60 cm Basal / AM10_16 58 cm Intercalated / AM 10_ cm Intercalated / AM 11_ cm Intercalated / AM10_ cm Basal of basal / AM10_ cm Intercalated / AM10_ cm Basal / AM 09_05_16' 62 cm * * Intercalated * / AM10_20_20' 15 cm Intercalated / a Reference datum: North American Vertical Datum 88 (NAVD88) calculated using the Geoid03 model b Elevation plotted in figure 4 of paper; sample elevation below modern yearly mean sea level (MSL) calculated from 10 year tide model c See the "Vertical error calculations" section of supplemental information for further explanation of VR+,VR-, D, L, and Ac d Thickness of sediment between sample and incompressible substrate below. Incompressible substrate is taken as either the compacted Pleistocene sediments or the relatively incompressible sands 9 overlying the Pleistocene sediments. e See main text for explanation of sample type f The 14C dates of buried microbial mat samples were measured by accelerator mass spectrometry (AMS) at the National Ocean Sciences AMS facility (NOSAMS), Woods Hole Oceanographic Institution, MA g See the "Sampling and radiocarbon dating" section of supplemental information for details on radiocarbon reservoir h Ages calibrated using the mixed marine/northern hemisphere terrestrial curve of CALIB 6.0 (Reimer et al., 2009) * Pleistocene was not encountered in core; Holocene thickness is unknown Calibrated median age (yr BP) h 2 sigma calibrated younger age (yr BP) h 2 sigma calibrated older age (yr BP) h
10 Table DR2 I Tidal datums derived from tieing 6-month upper bay tide gauge record to 10-year lower bay tide gauge record and tidal datums derived from 10-year upper bay tide model. Tidal datum a Datums calculated after method of NOS b (UBT) Datums calculated from 10 year upper bay tide model b (UBM) Difference between tide datums (UBT - UBM) Highest astronomical tide (HAT) * 0.66 * Mean high water spring (MHWS) * 0.28 * Mean high water neap (MHWN) * 0.08 * Mean higher high water level (MHWL) Mean high water (MHW) Diurnal tide level (DTL) Mean tide level (MTL) Mean sea level (MSL) * 0.00 * Mean low water (MLW) Mean lower low water (MLLW) Mean low water neap (MLWN) * * Mean low water spring (MLWS) * * Lowest astronomical tide (LAT) * * Great diurnal range (GT) GT = MHHW - MLLW Mean tidal range (Mn) Mn = MHW - MLW Mean spring tidal range (MSTR) * 0.58 * a See NOS (2000) for tidal datum definitions. All elevations reference to yearly MSL calculated from 10-year upper bay tide model. MSL is m from NAVD88 b 10-year upper bay tidal datums estimated from extrapolating 6-month upper bay tide gauge record to 10 year lower bay tide gauge record. Method for estimating tidal datums from short-term tide gauges from NOS (2003). c 10 year upper bay tidal datums calculated from upper bay tide model implemented in this study. Datums calculated from upper bay tide model reference herein as upper bay modeled (UBM) datums. * Indicates where NOS (2003) did not provide method for extrapolating long-term tide datum from short-term tide gauge record.
Location. Datum. Survey. information. Etrometa. Step Gauge. Description. relative to Herne Bay is -2.72m. The site new level.
 Tide Gauge Location OS: 616895E 169377N WGS84: Latitude: 51 o 22.919196 N Longitude: 01 o 6.9335907 E Instrument Type Etrometa Step Gauge Benchmarks Benchmark TGBM = 5.524m above Ordnance Datum Newlyn
Scarborough Tide Gauge
 Tide Gauge Location OS: 504898E 488622N WGS84: Latitude: 54 16' 56.990"N Longitude: 00 23' 25.0279"W Instrument Valeport 740 (Druck Pressure Transducer) Benchmarks Benchmark Description TGBM = 4.18m above
Arun Platform Tide Gauge
 Arun Platform Tide Gauge Location OS: 506423E 97778N WGS84: Latitude: 50 46 11.39042"N Longitude: 00 29 31.73595"W Instrument Valeport 730 (Druck Pressure Transducer) TGBM Benchmarks Benchmark Description
In this module we will be looking at the factors which cause the tides and how to calculate their effects. At first
 LESSON 5.1 Tides and How To Allow for Them In this module we will be looking at the factors which cause the tides and how to calculate their effects. At first this subject might seem a little daunting,
NOAA s National Ocean Service. Center for Operational Oceanographic Products and Services
 NOAA s National Ocean Service Center for Operational Oceanographic Products and Services Richard Edwing, CO-OPS Acting Director January 27, 2010 Outline CO-OPS Overview Programs Observing Systems PORTS
IRENE: Visitor from the Extratidal World
 IRENE: Visitor from the Extratidal World John Boon Professor Emeritus Virginia Institute of Marine Science School of Marine science College of William and Mary Hurricane Irene did not come to Hampton Roads
SOUTH AFRICAN TIDE TABLES
 SAN HO-2 2018 SOUTH AFRICAN TIDE TABLES PUBLISHED BY THE HYDROGRAPHER SOUTH AFRICAN NAVY PRIVATE BAG X1 TOKAI, 7966 COPYRIGHT RESERVED ISBN 978-0-9869717-9-2 CONTENTS Preface.... (iii) Tidal Levels......(iv)
SOUTH AFRICAN TIDE TABLES
 SAN HO-2 2019 SOUTH AFRICAN TIDE TABLES PUBLISHED BY THE HYDROGRAPHER SOUTH AFRICAN NAVY PRIVATE BAG X1 TOKAI, 7966 COPYRIGHT RESERVED ISBN 978-0-9947002-0-9 Intentionally left blank CONTENTS Preface....
Integrating Climate Adaptation in Hawaii Disaster Risk Management
 Integrating Climate Adaptation in Hawaii Disaster Risk Management Building Resilient Communities HCPO/HIGICC 2009 Conference September 23-25 Sheraton Waikiki Introduction What are weather/climate-related
Shape of the Earth. Data Output by the Receiver
 It is quite common for confusion to arise about the process used during a hydrographic survey when GPS-derived water surface elevation is incorporated into the data as an RTK Tide correction. This article
UNDERSTANDING STORM TIDES
 UNDERSTANDING STORM TIDES Run from the water, hide from the wind.. CATEGORY CATEGORY CATEGORY CATEGORY CATEGORY 1 2 3 4 5 WIND 74-95 mph 64-82 knots 96-110 mph 83-95 knots 111-130 mph 96-113 knots 131-155
2 nd Tidal and Water Level Working Group Meeting
 2 nd Tidal and Water Level Working Group Meeting Norwegian Hydrographic Service, Stavanger, Norway 27 29 April 2010 Vertical Offshore Reference Framework (VORF) Chris Jones United Kingdom Hydrographic
10/24/2017. Determining Location. Where in the World are We Geodetically Speaking. Meades Ranch
 Determining Location Where in the World are We Geodetically Speaking Meades Ranch 1 How do we find the Mark? KG0640 DESCRIBED BY COAST AND GEODETIC SURVEY 1948 (MZB) KG0640 STATION IS LOCATED ABOUT 12
Progress towards Establishment of a Unique Vertical Datum for Hydrography and Land Surveying in the Emirate of Dubai-Case Study
 Progress towards Establishment of a Unique Vertical Datum for Hydrography and Land Surveying in the Emirate of Dubai-Case Study Yousuf AL MARSOOQI, Amira ALZAROUNI, Satheesh GOPI, United Arab Emirates
Analysis of Tides and Storm Surge from Observational Records in the Delaware Inland Bays
 Analysis of Tides and Storm Surge from Observational Records in the Delaware Inland Bays John Callahan Delaware Geological Survey Coastal GeoTools Conference March 30 April 2, 2015 Charleston, SC Outline
HARMONIC CONSTANTS Product Specification
 HARMONIC CONSTANTS Product Specification Edition 1.0 Edition 1 November 2006 1 Contents 1. Introduction 1.1 General 1.2 Definitions 2. General Information 2.1 Observation of the Tide 2.2 Harmonic Analysis
Sea Level Variability in the East Coast of Male, Maldives
 Sea Level Variability in the East Coast of Male, Maldives K.W. Indika 1 *, E.M.S. Wijerathne 2, G. W. A. R. Fernando 3, S.S.L.Hettiarachchi 4 1 National Aquatics Resources Research and Development Agency,
THE OPEN UNIVERSITY OF SRI LANKA
 THE OPEN UNIVERSITY OF SRI LANKA Extended Abstracts Open University Research Sessions (OURS 2017) 16 th & 17 th November, 2017 The Open University of Sri Lanka - 2017 All rights reserved. No part of this
Boston Coastal Flooding Analysis and Mapping
 Boston Coastal Flooding Analysis and Mapping Philip Orton, Dara Mendeloff, Jane Mills, Malgosia Madajewicz Funding This research was funded by the National Oceanic and Atmospheric Administration (NOAA)
8.1 Attachment 1: Ambient Weather Conditions at Jervoise Bay, Cockburn Sound
 8.1 Attachment 1: Ambient Weather Conditions at Jervoise Bay, Cockburn Sound Cockburn Sound is 20km south of the Perth-Fremantle area and has two features that are unique along Perth s metropolitan coast
MLLW and the NAD83 Ellipsoid: An Investigation of Local Offsets and Trends Using PPK and Gauge Derived Water Surfaces.
 MLLW and the NAD83 Ellipsoid: An Investigation of Local Offsets and Trends Using PPK and Gauge Derived Water Surfaces. Abstract: Authors Doug Lockhart, Fugro Pelagos, Inc. Andy Orthmann, Fugro Pelagos,
Texas Coastal Ocean Observation Network. Richard Edwing Director, Center for Operational Oceanographic Products and Services November 2016
 Texas Coastal Ocean Observation Network Richard Edwing Director, Center for Operational Oceanographic Products and Services November 2016 What is CO-OPS? Meaningful oceanographic data for the Nation CO-OPS
Appendix F: Projecting Future Sea Level Rise with the SLRRP Model
 Appendix F: Projecting Future Sea Level Rise with the SLRRP Model The Sea Level Rise Rectification Program (SLRRP) is a software package designed with a user-friendly interface to generate a suite of future
Town of Chino Valley. Survey Control Network Report. mgfneerhg mc N. Willow Creek Road Prescott AZ
 Town of Chino Valley Survey Control Network Report mgfneerhg mc. 2050 N. Willow Creek Road Prescott AZ 86301 928-771-2376 Page 1 of 70 Table of Contents Town of Chino Valley Survey Datum Outline A short
Preliminary Data Release for the Humboldt Bay Sea Level Rise Vulnerability Assessment: Humboldt Bay Sea Level Rise Inundation Mapping
 Preliminary Data Release for the Humboldt Bay Sea Level Rise Vulnerability Assessment: Humboldt Bay Sea Level Rise Inundation Mapping Prepared by: Jeff Anderson, Northern Hydrology & Engineering (jeff@northernhydrology.com)
H.A.R.S. PRA #1 (Historic Area Remediation Site)
") H.A.R.S. PRA #1 (Historic Area Remediation Site) 2009 Multibeam Bathymetry TABLE OF CONTENTS Page LIST OF TABLES 2 LIST OF FIGURES 3 1.0 INTRODUCTION 4 2.0 OBJECTIVE 4 3.0 PROCEDURE 4 3.1 DATA ACQUISITION
H.A.R.S. PRA #1 (Historic Area Remediation Site) 2009 Multibeam Bathymetry TABLE OF CONTENTS Page LIST OF TABLES 2 LIST OF FIGURES 3 1.0 INTRODUCTION 4 2.0 OBJECTIVE 4 3.0 PROCEDURE 4 3.1 DATA ACQUISITION
GLNG PROJECT - ENVIRONMENTAL IMPACT STATEMENT
 8 Management of Impacts J:\Jobs\42626220\07 Deliverables\EIS\FINAL for Public Release\8. Management of Impacts\8-2 Climate\08 02 Climate (Section 8.2) FINAL Public.doc GLNG Project - Environmental Impact
North Slope Trends in Sea Level, Storm Frequency, Duration and Intensity
 North Slope Trends in Sea Level, Storm Frequency, Duration and Intensity Nels J. Sultan, Kenton W. Braun and Dempsey S. Thieman PND Engineers, Inc. Anchorage, Alaska, USA nsultan@pndengineers.com ABSTRACT
Mediterranean Sea Level Changes over the Period
 Mediterranean Sea Level Changes over the Period 1961-2 Boris SHIRMAN and Yossi MELZER, Israel Key words: Sea level monitoring, Tide gauge operation, Tide gauge Bench Marks. ABSTRACT The mean value of the
SUWANNEE RIVER WATER MANAGEMENT DISTRICT 9225 CR 49 LIVE OAK FLORIDA DECEMBER 2015
 HYDRODYNAMIC MODEL DEVELOPMENT, CALIBRATION, AND MFL FLOW REDUCTION AND SEA LEVEL RISE SIMULATION FOR THE TIDAL PORTION OF THE ECONFINA RIVER ECONFINA RIVER, FLORIDA SUWANNEE RIVER WATER MANAGEMENT DISTRICT
Package TideHarmonics
 Version 0.1-1 Date 2017-05-04 Title Harmonic Analysis of Tides Author Alec Stephenson. Package TideHarmonics May 4, 2017 Maintainer Alec Stephenson Depends R (>= 2.10) Implements
Tides at Carrie Bow Cay, Belize
 Tides at Carrie Bow Cay, Belize Bjorn Kjerfve, Klaus Riitzler, and George H. Kierspe ABSTRACT The tide at Carrie Bow Cay, Belize, is microtidal (mean range of 15 cm) and is of the mixed semidiurnal type.
Explained by Dr CJC Rees (York)
") HOW THE TIDES WORK Explained by Dr CJC Rees (York) TIDES AND WATER MARKS TIDES and the - SYSTEM The earth-moon system rotates in space about its common centre of mass, there being a stabilising balance
HOW THE TIDES WORK Explained by Dr CJC Rees (York) TIDES AND WATER MARKS TIDES and the - SYSTEM The earth-moon system rotates in space about its common centre of mass, there being a stabilising balance
The National Spatial Reference System of the Future
 The National Spatial Reference System of the Future William Stone Southwest Region (AZ, NM, NV, UT) Geodetic Advisor william.stone@noaa.gov NOAA s National Geodetic Survey geodesy.noaa.gov Salt Lake City
What s Up? Tidal and Vertical Datums. Noel Zinn Hydrometronics LLC July 2011, revised November 2013
 What s Up? Tidal and Vertical Datums Noel Zinn Hydrometronics LLC www.hydrometronics.com July 2011, revised November 2013 1 Motivation The real world is three-dimensional, therefore, coordinates are necessarily
SLR: Nuisance flooding patterns along the Coastal Bend
 SLR: Nuisance flooding patterns along the Coastal Bend Philippe Tissot Conrad Blucher Institute Resilient Texas: Planning for Sea Level Rise August 8, 2017 Hurricane Ike - 9/13/2008 Marina Photos Courtesy
Long Term Monitoring of the Mediterranean and Red Sea Levels in Israel
 Long Term Monitoring of the Mediterranean and Red Sea Levels in Israel Boris SHIRMAN and Yossi MELZER, Israel Key words: tide-gauge station, mean sea level, geoid, meteorological factors. SUMMARY The Survey
Sea Level Rise in Connecticut A Risk-Informed Approach
 GZA GeoEnvironmental, Inc. CAFM Conference October 25, 2017 Proactive By Design. Our Company Commitment Proactive By Design. Our Company Commitment Sea Level Rise in Connecticut A Risk-Informed Approach
METOCEAN CRITERIA FOR VIRGINIA OFFSHORE WIND TECHNOLOGY ADVANCEMENT PROJECT (VOWTAP)
") METOCEAN CRITERIA FOR VIRGINIA OFFSHORE WIND TECHNOLOGY ADVANCEMENT PROJECT (VOWTAP) Report Number: C56462/7907/R7 Issue Date: 06 December 2013 This report is not to be used for contractual or engineering
METOCEAN CRITERIA FOR VIRGINIA OFFSHORE WIND TECHNOLOGY ADVANCEMENT PROJECT (VOWTAP) Report Number: C56462/7907/R7 Issue Date: 06 December 2013 This report is not to be used for contractual or engineering
WIND DATA REPORT FOR THE YAKUTAT JULY 2004 APRIL 2005
 WIND DATA REPORT FOR THE YAKUTAT JULY 2004 APRIL 2005 Prepared on July 12, 2005 For Bob Lynette 212 Jamestown Beach Lane Sequim WA 98382 By John Wade Wind Consultant LLC 2575 NE 32 nd Ave Portland OR 97212
Tides. Tides are the slow, periodic vertical rise and fall of the ocean surface.
 PART 2 Tides Tides are the slow, periodic vertical rise and fall of the ocean surface. Tide is a giant wave caused by gravitational pull of the Moon and Sun on the rotating Earth. The gravitational pull
Evaluation of Storm Tide Measurements at Panama City Beach, FL
 Evaluation of Storm Tide Measurements at Panama City Beach, FL 1993-2007 Prepared by Mark E. Leadon Beaches and Shores Resource Center Florida State University May 2009 Prepared for Florida Department
CALCULATION OF THE SPEEDS OF SOME TIDAL HARMONIC CONSTITUENTS
 Vol-3 Issue- 07 IJARIIE-ISSN(O)-395-396 CALCULATION OF THE SPEEDS OF SOME TIDAL HARMONIC CONSTITUENTS Md. Towhiduzzaman, A. Z. M Asaduzzaman d. Amanat Ullah 3 Lecturer in Mathematics, Department of Electrical
NSW Ocean Water Levels
 NSW Ocean Water Levels B Modra 1, S Hesse 1 1 Manly Hydraulics Laboratory, NSW Public Works, Sydney, NSW Manly Hydraulics Laboratory (MHL) has collected ocean water level and tide data on behalf of the
Sea Level Variations at Jeddah, Eastern Coast of the Red Sea
 JKAU: Mar. Sci., Vol. 21, No. 2, pp: 73-86 (21 A.D. / 1431 A.H.) DOI : 1.4197/Mar. 21-2.6 Sea Level Variations at Jeddah, Eastern Coast of the Red Sea Khalid M. Zubier Marine Physics Department, Faculty
SLR Calculator: Sea Level Rise (SLR) Inundation Surface Calculator Add-in for ArcGIS Desktop & 10.4
 Inundation Surface Calculator Add-in for ArcGIS Desktop & 10.4") 1 SLR Calculator: Sea Level Rise (SLR) Inundation Surface Calculator Add-in for ArcGIS Desktop 10.3.1 & 10.4 Florida Sea Level Scenario Sketch Planning Tool Version 1.6, July 2016 University of Florida
1 SLR Calculator: Sea Level Rise (SLR) Inundation Surface Calculator Add-in for ArcGIS Desktop 10.3.1 & 10.4 Florida Sea Level Scenario Sketch Planning Tool Version 1.6, July 2016 University of Florida
Storm surge forecasting and other Met Office ocean modelling
 Storm surge forecasting and other Met Office ocean modelling EMODnet stakeholder meeting Clare O Neill + many others Outline Ocean modelling at the Met Office Storm surge forecasting Current operational
NOAA Inundation Dashboard
 NOAA Inundation Dashboard Audra Luscher & Paul Fanelli NOS Center for Operational Oceanographic Products & Services (CO-OPS) Hampton Roads Sea Level Rise/Flooding Adaptation Forum July 29, 2016 http://tidesandcurrents.noaa.gov/inundationdb/newyork.html
A Perfect Storm: The Collision of Tropical Cyclones, Climate Change and Coastal Population Growth. Jeff Donnelly Woods Hole Oceanographic Institution
 A Perfect Storm: The Collision of Tropical Cyclones, Climate Change and Coastal Population Growth Jeff Donnelly Woods Hole Oceanographic Institution Recent Hurricane Trends What Might the Future Hold?
Characterizing Tidal Inundation of Wetlands in the Murderkill Estuary (Kent County, DE)
") Characterizing Tidal Inundation of Wetlands in the Murderkill Estuary (Kent County, DE) Tom McKenna Delaware Geological Survey University of Delaware Thermal Imaging Can temperature be used as an indicator
Characterizing Tidal Inundation of Wetlands in the Murderkill Estuary (Kent County, DE) Tom McKenna Delaware Geological Survey University of Delaware Thermal Imaging Can temperature be used as an indicator
Earth Observation in coastal zone MetOcean design criteria
 ESA Oil & Gas Workshop 2010 Earth Observation in coastal zone MetOcean design criteria Cees de Valk BMT ARGOSS Wind, wave and current design criteria geophysical process uncertainty modelling assumptions
GPS Surveying Dr. Jayanta Kumar Ghosh Department of Civil Engineering Indian Institute of Technology, Roorkee. Lecture 06 GPS Position
 GPS Surveying Dr. Jayanta Kumar Ghosh Department of Civil Engineering Indian Institute of Technology, Roorkee Lecture 06 GPS Position Friends! Welcome you to sixth class on GPS surveying. Today, I am going
Pablo Bay in Sonoma, Solano, and Napa Counties. It is owned and managed by the U.S. Fish and Wildlife
 Appendix L San Pablo Bay Marsh Introduction San Pablo Bay National Wildlife Refuge marsh (hereafter San Pablo) is located on the north shore of San Pablo Bay in Sonoma, Solano, and Napa Counties. It is
GISC3325 Spring 2011 Final Exam
 GISC3325 Spring 2011 Final Exam Name: Carefully read each question. Identify the important elements and the question being asked. Show your work for partial credit. No credit for undocumented wrong answers.
Ellipsoid Hydro Datum Geoid Errors
 Ellipsoid Hydro Datum Geoid Errors Jack L. Riley Office of Coast Survey Hydrographic Systems & Technology Branch Geoid Errors via Ellipsoid Hydrography? Per datum hydro Traditional & ellipsoid referenced
Charts and Chart Work with Poole Sailing
 with Poole Sailing Nautical charts are a mine of information but they need to be up to date. Corrections to charts are published by the Hydrographic Office monthly as Notices to Mariners both in print
Exploring extreme sea level events
 PSMSL 80 th Anniversary Workshop on Sea Level Science Exploring extreme sea level events Melisa Menéndez Environmental Hydraulics Institute (IH-Cantabria), Universidad de Cantabria, Spain menendezm@unican.es
5 Coordinate Reference Systems
 5 Coordinate Reference Systems 5.1 Overview The INSPIRE theme Coordinate reference systems (CRS) provides a harmonised specification for uniquely referencing spatial information, either using three-dimensional,
Draft for Discussion 11/11/2016
 Coastal Risk Consulting (CRC) Climate Vulnerability Assessment for Village of Key Biscayne Deliverable 1.1 in Statement of Work. Preliminary Vulnerability Assessment Identifying Flood Hotspots Introduction...
Assessing marsh response from sea-level rise applying local site conditions: Humboldt Bay wetlands
 Assessing marsh response from sea-level rise applying local site conditions: Humboldt Bay wetlands U. S. Geological Survey, Western Ecological Research Center Addendum - Data Summary Report February 23,
2017 State of U.S. High Tide Flooding with a 2018 Outlook
 2017 State of U.S. High Tide Flooding with a 2018 Outlook William V. Sweet 1, Doug Marcy 2, Gregory Dusek 1, John J. Marra 3, Matt Pendleton 4 National Oceanic and Atmospheric Administration (NOAA) Center
Planning for Annapolis Sea Level Rise and Future Extreme Water Levels
 Planning for Annapolis Sea Level Rise and Future Extreme Water Levels U.S. Naval Academy Sea Level Rise Advisory Council 31 October 2017 CAPT Emil Petruncio, USN (Ret.), PhD Associate Professor Gina Henderson
Long-term estuary processes and morphological change
 Long-term estuary processes and morphological change Professor Ken Pye with contributions from Dr. Simon Blott and Dr. Daphne van der Wal Department of Geology Available top-down methods relying on data
GSA DATA REPOSITORY
 GSA DATA REPOSITORY 2009206 Miner et al. Supplemental Material Bathymetric Survey Methods The bathymetric data for the area were gathered using a single-beam bathymetric survey rig mounted aboard a 21-foot
National Report of New Zealand
 National Report of New Zealand Prepared for GLOSS Training Course Tokyo May 2006 Glen Rowe Data Analyst Hydrographic Services Land Information New Zealand National Office 160 Lambton Quay Wellington New
IMPACT OF CLOBAL CHANGE ON THE COASTAL AREAS OF THE RIO DE LA PLATA
 IMPACT OF CLOBAL CHANGE ON THE COASTAL AREAS OF THE RIO DE LA PLATA Vicente Barros*, Inés Camilloni* ** and Angel Menendez* *AIACC Project LA 26, University of Buenos Aires ** CIMA Introduction The Rio
Hurricanes in a Warming World. Jeff Donnelly Woods Hole Oceanographic Institution
 Hurricanes in a Warming World Jeff Donnelly Woods Hole Oceanographic Institution Hurricanes impacting the NE US Hurricane Sandy Was Hurricane Sandy a freak of nature? Or had we just been lucky? What are
REPORT ON SEA LEVEL STATION IN THE PHILIPPINES
 NATIONAL MAPPING AND RESOURCE INFORMATION AUTHORITY HYDROGRAPHY BRANCH REPORT ON SEA LEVEL STATION IN THE PHILIPPINES ENGR. RAUL S. CAPISTRANO PHYSICAL OCEANOGRAPHY DIVISION OCEANOGRAPHIC SURVEY SECTION
Forecasts include: Temperature. Barometric (air) Pressure. Wind direction/speed Humidity
 Pressure. Wind direction/speed Humidity") Meteorology I Intro. to Weather 1. What is Weather? A) Weather is the state of the atmosphere at a given time and place. B) Weather changes on a regular basis. C) Meteorologists forecast weather conditions
Meteorology I Intro. to Weather 1. What is Weather? A) Weather is the state of the atmosphere at a given time and place. B) Weather changes on a regular basis. C) Meteorologists forecast weather conditions
Vertical Reference Frame Pacific
 Vertical Reference Frame Pacific Andrick Lal SPC Geoscience Division GIS&RS User Conference 29 th November 2016 USP, Fiji. What does it mean? All buildings and features have a height. But what is it relative
ASSESSING FUTURE EXPOSURE: GLOBAL AND REGIONAL SEA LEVEL RISE SCENARIOS FOR THE UNITED STATES
 ASSESSING FUTURE EXPOSURE: GLOBAL AND REGIONAL SEA LEVEL RISE SCENARIOS FOR THE UNITED STATES Chesapeake Bay Program Climate Resiliency Workgroup Conference Call May 15, 2017 William Sweet NOAA CO-OPS
USING MIKE TO MODEL COASTAL CATASTROPHE RISK
 USING MIKE TO MODEL COASTAL CATASTROPHE RISK Nicola Howe, Christopher Thomas, Joss Matthewman, John Maskell* 1 SUMMARY About RMS Who are we and what do we do? How do we use MIKE in our workflow? Case study:
2013 Tide Newsletter and occasionally by much more. What's more,
 The Official Newsletter for the Nor easters Metal Detecting Club! Tide s Ed it io n HTTP://WWW.NOR EASTER S.NET Year ly Ti des for 2013 The Metal Detecting Creed By Jessie Thompson We are Metal Detectorists.
Tidal stream atlases Reprinted by PC Maritime with kind permission of Proudman Laboratory
 The generation of UK tidal stream atlases from regularly gridded hydrodynamic modelled data by Colin Bell and Lisa Carlin Proudman Oceanographic Laboratory http://www.pol.ac.uk http://www.pcmaritime.co.uk
GSA DATA REPOSITORY
 GSA DATA REPOSITORY 2011084 Anderson Data Repository Table DR1: Bison Lake Geochronological Data Core Depth (cm) Material Lab number Measured age ( 14 C yr B.P.) Calibrated 1-sigma age ranges & (relative
Modern Navigation. Thomas Herring
 12.215 Modern Navigation Thomas Herring Review of Last Class Almanacs: Paper and electronics Paper Almanacs: Nautical Almanac Electronic: Available on many web sites Homework #1 solutions 10/17/2006 12.215
Appendix B. Contents. Elliston instrument deployment data report. Olympic Dam Expansion Supplementary Environmental Impact Statement 2010
 Project Alternatives Appendix B Contents B1 Elliston instrument deployment data report 1 Olympic Dam Expansion Supplementary Environmental Impact Statement 2010 Appendix B1 Elliston instrument deployment
Final Report. January Prof. Dr. Olivier Francis
 ABSOLUTE AND RELATIVE GRAVITY MEASUREMENTS IN NUUK (GREENLAND) IN JULY 2005 Final Report January 2006 Prof. Dr. Olivier Francis University of Luxembourg Faculty of Sciences, Technology and Communication
GSA DATA REPOSITORY Swanson et al.
 GSA DATA REPOSITORY2014233 Swanson et al. Figure DR1. Calendar-calibrated ages for lava flows younger than 500 BCE relative to ages of the Uwēkahuna Ash and Keakakāko i Tephra. Several flows have multiple
GEOID UNDULATIONS OF SUDAN USING ORTHOMETRIC HEIGHTS COMPARED WITH THE EGM96 ANG EGM2008
 GEOID UNDULATIONS OF SUDAN USING ORTHOMETRIC HEIGHTS COMPARED Dr. Abdelrahim Elgizouli Mohamed Ahmed* WITH THE EGM96 ANG EGM2008 Abstract: Positioning by satellite system determine the normal height above
Water Level Prediction with Artificial Neural Network Models
 Water Level Prediction with Artificial Neural Network Models CARL STEIDLEY, ALEX SADOVSKI, PHILLIPE TISSOT, RAY BACHNAK, ZACK BOWLES Texas A&M University Corpus Christi 6300 Ocean Dr. Corpus Christi, TX
John Callahan (Delaware Geological Survey) Kevin Brinson, Daniel Leathers, Linden Wolf (Delaware Environmental Observing System)
 Kevin Brinson, Daniel Leathers, Linden Wolf (Delaware Environmental Observing System)") John Callahan (Delaware Geological Survey) Kevin Brinson, Daniel Leathers, Linden Wolf (Delaware Environmental Observing System) Delaware is extremely vulnerable to the impacts of coastal flooding Tropical
John Callahan (Delaware Geological Survey) Kevin Brinson, Daniel Leathers, Linden Wolf (Delaware Environmental Observing System) Delaware is extremely vulnerable to the impacts of coastal flooding Tropical
Modern Navigation. Thomas Herring
 12.215 Modern Navigation Thomas Herring Review of Monday s Class Spherical Trigonometry Review plane trigonometry Concepts in Spherical Trigonometry Distance measures Azimuths and bearings Basic formulas:
Climate. Annual Temperature (Last 30 Years) January Temperature. July Temperature. Average Precipitation (Last 30 Years)
 January Temperature. July Temperature. Average Precipitation (Last 30 Years)") Climate Annual Temperature (Last 30 Years) Average Annual High Temp. (F)70, (C)21 Average Annual Low Temp. (F)43, (C)6 January Temperature Average January High Temp. (F)48, (C)9 Average January Low Temp.
Climate Annual Temperature (Last 30 Years) Average Annual High Temp. (F)70, (C)21 Average Annual Low Temp. (F)43, (C)6 January Temperature Average January High Temp. (F)48, (C)9 Average January Low Temp.
Field Research Facility
 Field Research Facility Sea Level Rise Observations of Sea Level rise Forces driving change Predicting future Sea Level rise Response of land surface Storm inundation coupled with Sea Level Dr. Jesse McNinch
J.B. Shaw and D. Mohrig
 GSA DATA REPOSITORY 2014008 J.B. Shaw and D. Mohrig Supplementary Material Methods Bathymetric surveys were conducted on 26 June- 4 July, 2010 (Fig. 2A), 7 March, 2011 (Fig. 2B), 11-12 August, 2011 (Figs.
ABSOLUTE GRAVITY MEASUREMENTS
 ABSOLUTE GRAVITY MEASUREMENTS AT THE CONRAD OBSERVATORIUM IN AUSTRIA IN JUNE 2012 Final Report August 2012 Prof. Dr. Olivier Francis University of Luxembourg Faculty of Sciences, Technology and Communication
POLCOMS Metadata for the ARCoES project Keywords: POLCOMS, WAM, residual circulation, waves, Liverpool Bay, UK shelf
 POLCOMS Metadata for the ARCoES project Keywords: POLCOMS, WAM, residual circulation, waves, Liverpool Bay, UK shelf POLCOMS is the Proudman Oceanographic Laboratory Coastal Ocean Modelling System. It
Latest trends in sea level rise and storm surges in Maine Peter A. Slovinsky, Marine Geologist
 Latest trends in sea level rise and storm surges in Maine Peter A. Slovinsky, Marine Geologist Image from Chebeague.org Maine s glacial geology and historic sea level rise trends Current sea level trends
Crystal Goodison & Alexis Thomas University of Florida GeoPlan Center
 Crystal Goodison & Alexis Thomas University of Florida GeoPlan Center A1A Fort Lauderdale, Hurricane Sandy, October 2012 Photo Credits: Susan Stocker, Sun Sentinel FAU s Research Report (completed Jan
VT State Plane. Daniel J. Martin National Geodetic Survey VT Geodetic Advisor. VSLS Conference Rutland VT April 11, 2008
 VT State Plane Daniel J. Martin National Geodetic Survey VT Geodetic Advisor VSLS Conference Rutland VT April 11, 2008 Today s Outline Define the problem Review of VT State Plane System Relationship
Mapping Predicted Tidal Exposure Durations Using a MLLW-Referenced LiDAR Terrain Model
 Mapping Predicted Tidal Exposure Durations Using a MLLW-Referenced LiDAR Terrain Model for Management of Spartina alterniflora in Willapa Bay, Washington Meeting the Challenge: Invasive Plants in PNW Ecosystems
Geophysical Correction Application in Level 2 CryoSat Data Products
 ESRIN-EOP-GQ / IDEAS IDEAS-VEG-IPF-MEM-1288 Version 2.0 29 July 2014 Geophysical Correction Application in Level 2 CryoSat Data Products TABLE OF CONTENTS 1 INTRODUCTION... 3 1.1 Purpose and Scope... 3
Updated Results from the In Situ Calibration Site in Bass Strait, Australia
 Updated Results from the In Situ Calibration Site in Bass Strait, Australia Christopher Watson 1, Neil White 2,, John Church 2 Reed Burgette 1, Paul Tregoning 3, Richard Coleman 4 1 University of Tasmania
Between 6 am to 4 pm the next day approximately 7.5 inches fell. Chesapeake Bay Bridge Tunnel NOAA Tide Gage
 Ocean Park Alternative Drainage Route Analysis February, 2012 November 11 14, 2009 Between 6 am to 4 pm the next day approximately 7.5 inches fell Chesapeake Bay Bridge Tunnel NOAA Tide Gage Hurricane
BUILDING AN ACCURATE GIS
 BUILDING AN ACCURATE GIS 2006 GIS in the Rockies Denver, Colorado September 13, 2006 William E. Linzey United States Department of Commerce National Oceanic and Atmospheric Administration National Geodetic
Modeling the North West European Shelf using Delft3D Flexible Mesh
 Modeling the North West European Shelf using Delft3D Flexible Mesh 2nd JCOMM Scientific and Technical Symposium on Storm Surges, 8-13 Nov. 2015, Key West, USA; Firmijn Zijl Outline of this presentation
Evaluating Hydrodynamic Uncertainty in Oil Spill Modeling
 Evaluating Hydrodynamic Uncertainty in Oil Spill Modeling GIS in Water Resources (CE 394K) Term Project Fall 2011 Written by Xianlong Hou December 1, 2011 Table of contents: Introduction Methods: Data
CHAPTER 27 AN EVALUATION OF TWO WAVE FORECAST MODELS FOR THE SOUTH AFRICAN REGION. by M. Rossouw 1, D. Phelp 1
 CHAPTER 27 AN EVALUATION OF TWO WAVE FORECAST MODELS FOR THE SOUTH AFRICAN REGION by M. Rossouw 1, D. Phelp 1 ABSTRACT The forecasting of wave conditions in the oceans off Southern Africa is important