Production System Analysis
|
|
|
- Dorthy Sullivan
- 5 years ago
- Views:
Transcription
1 Production System Analysis
2 Production System Analysis Nodal Analysis An analytical tool used in forecasting the performance of the various elements comprising the completion and production system. This concept is based on the a well having one flow rate implied by fixed end pressures.
3 Nodal Analysis This procedure consist of selecting a division point (node) in the well and dividing the system at this point. The locations of the most commonly used nods are shown:
4 Nodal Analysis Once a node is selected, i.e. bottom hole pressure, the pressure is calculated from both directions (upstream and downstream from the node). Inflow to the node: p p (upstream components) = r p node Outflow from the node: p + p (downstrea m components) = FWH p node
5 Nodal Analysis The pressure drop, Δp, in any component varies with flow rate, q. Therefore, a plot of node pressure versus flow rate will produce two curves, the intersection of which will give the conditions satisfying requirements 1 and 2, given previously. The procedure is illustrated graphically in Fig. 1-3.
6 Determination of Flowing Capacity
7 Nodal Analysis Using a simple producing system and selecting the wellheadas the node Inflow to the node: p r p res p tbg = p wh Outflow from the node: p sep + p flowline = p wh

8 node
9 The effect of the flow capacity of changing the tubing size and the effect of a change in flowline size.
10 Nodal Analysis Frequently used is the procedure to select the node between the reservoir and the piping system. Inflow to the node: p r p res = p wh Outflow from the node: p sep + p flowline + p tbg = p wf
11 The effect of a change in tubing size on the total system producing capacity when p wf is the node pressure.
12 A case in which the well performance is controlled by the inflow is below. In this case, the excessive pressure drop could be caused by formation damage or inadequate perforations.
13 A qualitative example of selecting the optimum tubing size for a wellthat is producing both gas and liquids is shown below
14 Procedure for Apply Nodal Analysis 1. Determine which components in the system can be changed. Changes are limited in some cases by previous decisions. For example, once a certain hole size is drilled, the casing size and, therefore, the tubing size is limited. 2. Select one component to be optimized. 3. Select the node location that will best emphasize the effect of the change in the selected component. This is not critical because the same overall result will be predicted regardless of the node location.
15 Procedure for Apply Nodal Analysis 4. Develop expressions for the inflow and outflow. 5. Obtain required data to calculate pressure drop versus rate for all the components. This may require more data than is available, which may necessitate per- the analysis over possible ranges of conditions. 6. Determine the effect of changing the characteristics of the selected component by plotting inflow versus outflow and reading the intersection. 7. Repeat the procedure for each component that is to be optimized.
16 Reservoir Performance
17 WELL PERFORMANCE EQUATIONS To calculate the pressure drop occurring in a reservoir, an equation that expresses the energy or pressure losses due to viscous shear or friction forces as a function of velocity or flow rate is required. Although the form of the equation can be quite different for various types of fluids, the basic equation on which all of the various forms are based is Darcy's law.
18 Linear Flow (constant area flow) Oil p 1 p 2 = q o µ obol q 3 o koa A 13 2 B 2 o βρ L o Gas p 2 1 p 2 2 = q sc Zµ glt βztlγ L 2 g + q sc 2 kga A p 1 = upstream pressure, psia Z = gas deviation factor p 2 = downstream pressure, psia T = flowing temperature, o R μ o = oil viscosity, cp γ g = gas gravity (air=1) B o = oil formation volume factor, bbl/stb q sc = gas flow rate, scf/day L = Length of flow path, ft μ g = gas viscosity, cp K o = permeability of oil, md K g = permeability of gas, md = velocity coefficient, ft -1 A = area open to flow, ft 2 q o = oil flow rate, stb/day β
19 Radial Flow Oil q o = k µ B o o o ln( r h( e / p r e w p wf ) + S ) Gas q sc = µ ZT 6 k g h( p p e = pressure at r=r e, psia Z = gas deviation factor p wf = well flowing pressure, psia T = flowing temperature, o R μ o = oil viscosity, cp p R = avg. reservoir pressure, psia B o = oil formation volume factor, bbl/stb q sc = gas flow rate, scf/day k o = permeability of oil, md μ g = gas viscosity, cp r w = wellbore radius, ft K g = permeability of gas, md r e = well drainage area, ft h = reservoir thickness, ft q o = oil flow rate, stb/day q sc = gas flow rate, Mscfd S = skin factor g R ln(. 472r e / r p w wf ) )

20 Linear Flow Radial flow
21 Productivity Index (J) The relationship between well inflow rate and pressure drawdown has often been expressed in the form of a Productivity Index J, J = p R q o p wf q o = oil flow rate, stb/day p R = avg. reservoir pressure, psia p wf = well flowing pressure, psia
22 Permeability Alteration and Turbulence The magnitude of the pressure change due to the skin and turbulence, defined as: p skin = q µ B S A value for S (skin factor due to permeability change) can be obtained from analysis of various types of pressure transient tests. k o o h o o
23 Factors Affect Productivity Index Phase Behavior in Reservoirs Relative Permeability Behavior Oil Viscosity Behavior Oil Formation Volume Factor Behavior B o = Volume of oil plus its dissolved gas at p, T Volume of oil at stock tank conditions, psc, T sc
24 Phase Behavior Diagram


25 Relative Permeability Behavior
26 Oil Viscosity Behavior
27 Oil Formation Volume Factor Behavior
28 Factors Affecting Inflow Performance For oil reservoirs 1. Decrease in k ro as gas saturation increases. 2. Increase in μ o as pressure decreases and gas is evolved. 3. Shrinkage of the oil as gas is evolved when pressure on the oil decreases. 4. Formation damage or stimulation around the well bore 5. An increase in the turbulence as oil flow rate increases.
29 Drive Mechanisms The source of pressure energy to cause the oil and gas to flow into the well bore has a substantial effect on both the performance of the reservoir and the total production system
30 Dissolved Gas Drive A dissolved-gas-d rive reservoir is closed from any outside source of energy, such as water encroachment. Its pressure is initially above bubblepointpressure, and, therefore, no free gas exists. The only source of material to replace the produced fluids is the expansion of the fluids remaining in the reservoir.
31 Dissolved Gas Drive
32 Gas Cap Drive A dissolved-gas-d rive reservoir is closed from any outside source of energy, such as water encroachment. Its pressure is initially above bubblepointpressure, and, therefore, no free gas exists. The only source of material to replace the produced fluids is the expansion of the fluids remaining in the reservoir. Some small but usually negligible expansion of the connate water and rock may also occur.
33 Gas Cap Drive
34 Water Drive A dissolved-gas-d rive reservoir is closed from any outside source of energy, such as water encroachment. Its pressure is initially above bubblepointpressure, and, therefore, no free gas exists. The only source of material to replace the produced fluids is the expansion of the fluids remaining in the reservoir. Some small but usually negligible expansion of the connate water and rock may also occur.
35 Water Drive
36 Combination Drive In many cases, an oil reservoir will be both saturated and in contact with an aquifer. In this case, all three of the previously described mechanisms may be contributing to the reservoir drive. As oil is produced, both the gas cap and aquifer will expand and the gas/oil contact will drop as the oil/water contact rises, which can cause complex production problems.
37 Drawdown The difference between the average reservoir pressure and the flowing bottomhole pressure. The effects of drawdown on inflow performance differs for a well with zero skin factor. The effects of both positive and negative skin factors will then be discussed.
38 Positive Skin
39 Negative Skin
40 Effect of Depletion In any reservoir in which the average reservoir pressure is not maintained above the bubble point pressure, gas saturation will increase in the entire drainage volume of the wells. This will cause a decrease in the pressure function in the form of decreased k ro, which will cause an increase in the slope of the pressure profile and the IPR. Therefore to maintain a constant inflow rate to a well, it will be necessary to increase the drawdown as p R declines from depletion
41 Depletion on the Pressure Profile
42 Depletion on the IPR
43 Predicting Present Time IPR s Vogel Method Vogel developed and empirical equation for the case of a depletion drive reservoir, in which the reservoir pressure is everywhere below the bubble point pressure. He arrived at the the following relationship between dimensionless flow rate and pressure: 2 q q o o(max) = p p wf R 0.8 p p wf R
44 Vogel s Equation q q o o(max) = p p wf R 0.8 p p wf R 2 p wf = well flowing pressure, psia p R = avg. reservoir pressure, psia q o = oil flow rate, stb/day Note: q o(max) is a fictitious value of production representing a maximum drawdown, corresponding to p wf =0.


45
46 Constant Productivity Index The dimensionless IPR for a well with a constant productivity index can be calculated from: q q o o(max) = 1 p p p wf R
47 Vogel Method The tangent of the curve represents 1/J. Therefore, the Jis the negative derivative of q with respect to P. The negative sign is due to the fact that the slope of the curve is negative but the Jis a positive quantity. (At P wf =P r ) J q = 1.8 max P r Vogel s equation should approximate Darcy s equation at very low flow rates. = K µ o o H B o
48 Vogel Method One may want to predict a well s behavior at some future time when the reservoir pressures deplete. future o o o future r future B K P q J = = µ max 1.8 Simply solving for (q max ) future we obtain present o o o present r present B K P q J = = µ max 1.8 ( ) ( ) ( ) ( ) = present r future r present o o o future o o o present future P P k B B k q q µ µ max max
49 Predicting Future IPR s for Oil Wells As the pressure in an oil reservoir declines from depletion, the ability of the reservoir to transport oil will also decline. This is caused from the decrease in the pressure function as relative permeability to oil is decreased due to increasing gas saturation. Planning the development of a reservoir with respect to sizing equipment and planning for artificial lift, as well as evaluating the project from an economics standpoint, requires the ability to predict reservoir performance in the future.
50 Standing Method Standing published a procedure that can be used to predict the decline in the value of q o(max) as gas saturation in the reservoir increases from depletion. q = q wf 0. 8 o( F ) o(max) F p p RF p p wf RF 2
51 FetkovichMethod The method proposed by Fetkovichto construct future IPR's consists of adjusting the flow coefficient C for changes in ( ) 2 2 p p n for changes in f(p r ). He assumed that f(p r )was a linear function of p r and, therefore, the value of C can be adjusted as C =C F q o = C p R wf ( prf / prp )
52 FetkovichMethod A value of C p is obtained from present time production tests, that is, tests conducted when p R = p RP. Fetkovichassumed that the value of the exponent nwould not change. Future IPR's can thus be generated from q = o( F ) C p ( p RF / p RP )( p 2 RF / p 2 RP ) n
53 Well Completion Effects There are basically three types of completions that may be made on a well depending on the type of well, well depth, and type of reservoir or formation. Open Hole Completions Perforated Completions Perforated, Gravel Packed Completions
54 Open Hole Completions The casing is set at the top of the producing formation and the formation is not exposed to cement. Also, no perforations are required The only effect of the completion on inflow The only effect of the completion on inflow performance of an open hole completion will be caused by alteration of the reservoir permeability by damage or stimulation.
55 Perforated Completions The most widely used completion method is one in which the pipe is set through the formation, and cement is used to fill the annulus between the casing and the hole. This, of course, requires perforating the well to establish communication with the producing formation. This type of completion permits selection of the zones that are to be opened.


56 Perforation
57 Perforated, Gravel Packed Completions In some reservoirs, the lack of cementing material in the reservoir allows sand to be produced into the well. When completing wells in which the formation is incompetent or unconsolidated, a gravel pack completion scheme is frequently employed. In this type of completion, a perforated or slotted liner or a screen liner is set inside the casing opposite the producing formation.

58 Gravel-Pack
59 Well Flow Correlations One of the most important components in the total well system is the well tubing. As much as 80 percent of the total pressure loss can be consumed in lifting the fluids from the bottom of the hole to the surface. The flow may exist in tubing or in the annulus between the tubing and the casing. The wells may be vertical of can be drilled at large deviation angles, especially in the case of offshore wells or wells drilled in urban areas.
60 Well Flow Correlations Many correlations have been developed over the years to evaluate the pressure drop resulting from the multiphase flow of fluids in a vertical or deviated well.
61 Well Flow Correlations 1. Establish stable flow conditions at particular values of q L, q g, pipe diameter, pipe angle, etc. 2. In a test section of length ΔL, measure H and 2. In a test section of length ΔL, measure H L and Δp. Methods for measuring H L include nuclear densitometers, capacitance devices, quick closing valves, etc. Flow pattern may be observed if the test sectionis transparent.
62 Well Flow Correlations 3. Calculate mixture density and elevation component. ρ = ρ H + ρ (1 H ) s dp dl L L g ρ g sin Θ 4. Calculate and acceleration and friction component. dp p dp dp = dl L dl dl el el = s g c el L acc
63 Well Flow Correlations 5. Calculate a two phase friction factor 2gcd dp ftp = 2 ρvm dl f 6. Change test conditions and return to step 2.H L, f TP, and flow pattern should be obtained over a wide range of conditions. 7. Develop empirical correlations for H L, F TP and flow pattern as a function of variables that will be known for design cases. These variables include v sl, v sg, d, fluid properties, pipe angle, etc.
64 Choke Sizing
65 Choke Sizing for Liquid Flow Critical velocity is the velocity of sound in that medium. This velocity is a limiting factor, so the fluid cannot be accelerated to a large velocity. The critical of any fluid is given by: V = 68.1 ρc ρ= fluid density, lbm/ft 3 C = isothermal compressibility of the fluid, psi
66 Choke Sizing Single Phase Liquid Flow Calculating the pressure drop across a choke is relatively easy. However, flow through the choke is liquid and gas since tubing pressure is usually below the bubble point. If the exit velocity is below critical, the flow is: q = 22800Cd c P ρ d c = choke throat diameter, in ΔP = differential pressure across the choke, psi C is given from the Flow Coefficient Graph
67 Graph of Flow Coefficients for flow through chokes (Crane, 1957) h-valves-pipes-and-fittings Accessed Feb 24, 2010 Reynolds number is given by Re = 928ρVd µ
68 Choke Sizing In the case of gas exiting an open-ended flow line, the sonic velocity is given by: V g = 41.4 kzt γ g T = temperature, o R γ g = gas specific gravity relative to air Z = compressibility factor k = ratio of gas specific heat at constant volume to constant pressure (k=c p /c v ) or obtained from Specific Heat Ratios for Hydrocarbon Vapors Graph
69 Choke Sizing The gas flow rate at critical velocity is given by Q = g V g d 2 PT e e sc 2122TZP sc Q = Gas flow rate, MMSCFD T = Gas temperature, o R P = Pressure, pisa D = Pipe diameter, in V * g= Sonic velocity in gas at P and T, ft/s Z = Gas compressibility factor at P and T
70 Choke Sizing for Gas Flow Gas flow through a small diameter exit can be described by below. q 155.5C AP k + γ T k 1 d up 2/ k ( k 1)/ k = 2 g [ r r ] g C d = Choke discharge coefficient A = Choke throat area, in 2 T = Inlet temperature, o R P up = Upstream gas pressure, psia k = gas specific heat ratio, c p /c v r = P dn /P up if r o
71 Choke Sizing for Two Phase Flow Choked flow for a gas liquid mixture is difficult to mode, and only empirical correlations are available. Two presently available are the Gilbert and the Ros correlations, give as P up = Aq ( R ) L d C 64 P up = upstream pressure, psig (Gilbert), psia(ros) q L = liquid flow rate, bbl/day d 64 = choke diameter in 64ths Correlation A B C Gilbert Ross p B
72 Choke Sizing To ensure the flow is critical, the equation by Wallis can be used to calculate the critical velocity. 2 1/ ( ) 2 * *2 + + = L L L g g g g g L L V V V ρ λ ρ λ λ ρ λ ρ V* = critical velocity γ = in-situ volume fraction of each phase ρ = density of gas and liquid, lbm/ft 3
73 Flow in Pipes and Restrictions (vertical wells)
74 Two Phase Flow Variables Liquid Holdup-fraction of an element of pipe that is occupied by liquid at some instant. H L = volume of liquid in a pipe element volume of the pipe element Gas Holdup-relative in-situ volume of liquid and gas expressed in terms of the volume fraction. H g = 1-H L
75 Two Phase Flow Variables No-Slip Liquid Holdup-the ratio of the volume of liquid in a pipe element that would exist if the gas and liquid traveled at the same velocity (no slippage) divided by the volume of the pipe element.. γ L = q L ql +q g q L = sum of the in-situ oil and water q g = the in-situ gas flow rate
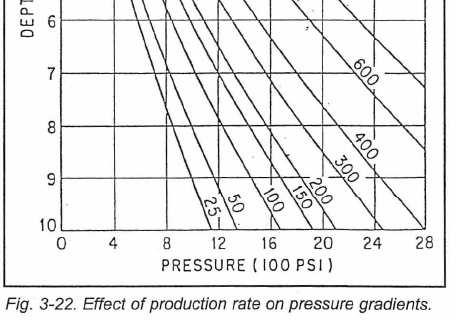
76 Two Phase Flow Variables No-Slip Gas-gas void fraction can be defined as γ g = 1 λ L = q L q g +q g q L = sum of the in-situ oil and water q g = the in-situ gas flow rate
77 Two Phase Flow Variables Density-The density of an oil/water mixture may be calculated from the oil and water densities and flow rates if no slippage between the oil and water phases is assumed. ρ = ρ f + ρ L o o w f w where f o = q o q + o q w and f w = 1-f o
78 Two Phase Flow Variables Velocity-the velocity that phase would exhibit if it flowed through the total cross sectional area of the pipe alone. v L = qg The actual area through which the gas flows is reduced by the presence of the liquid to AH g. Therefore, the actual gas velocity is calculated from: v g = q g AH g A
79 Two Phase Flow Patterns Whenever two fluids with different physical properties flow simultaneously in a pipe, there is a wide range of possible flow patterns. By flow pattern, reference is made to the distribution of each phase in the pipe relative to the other phase.


80 Two phase vertical flow patterns
81 93-96 Effects of Variables on Well Performance During the producing life of a well or field many conditions can change that will affect the well's flowing performance. Also, conditions can change from well to well in a field at a given time, and conditions can certainly vary among fields.
82 Effects of Variables on Well Performance Some of these variables that can change are 1. Liquid Flow Rate 2. Gas/Liquid Ratio 3. Water/Oil Ratio or Water Cut 4. Liquid Viscosity 5. Tubing Diameter and Slippage
83 Liquid Flow Rate The effect of increasing liquid rate will be an increase in both H L and fluid velocity. This will cause an increase in both the hydrostatic and friction. The effect may be seen graphically in Figure 3-22 that was constructed by choosing some general well conditions and holding everything constant except q L.
84
85 Gas/Liquid Ratio The GLR has more effect on two-phase flowing pressure gradients than any other variable. In a depletion-type field the gas/oil ratio will usually increase with time until late in the life of the reservoir. The GLR may decrease if water cut increases. The GLR has the most effect on the hydrostatic component of the pressure gradient equation because H L will decrease as GLR increases. However, the total flow rate will increase, and the friction loss depends on the flow rate squared.

86
87 Water/Oil Ratio or Water Cut The total pressure gradient in the well will increase as f w increases. This results from an increase in liquid density if the water is heavier than the oil and also from a decreasing GLR, since the free gas in the tubing comes primarily from the oil only. The effect may be expressed graphically in Figures 3-25 and 3-26.
88 Figure 3-25 shows only the effect of increased liquid density while the total effect is shown in Figure 3-26.
89 Liquid Viscosity The effects of liquid viscosity on pressure drop are very difficult to isolate. This results from the fact that the concept of a gas/liquid mixture viscosity has no physical meaning. The liquid viscosity will affect H L to some degree and will also increase the shearing stresses in the liquid and, therefore, the friction pressure drop. If an oil/water mixture is present, dispersions or emulsions may form and cause a very large increase in the pressure gradient. At the present time, there is no method to accurately predict the viscosity of an oil/water mixture, much less the viscosity of a gas/oil/water mixture.
90 Liquid Viscosity The combined effects of decreasing API gravity and increasing viscosity for a gas/oil mixture are shown qualitatively in Figure If water were present, the effects would probably be even more pronounced.
91 Tubing Diameter and Slippage The selection of the proper tubing size to install in a well is one of the most critical and the most neglected functions of a production engineer. In many cases the tubing size will be selected based on such criteria as what has been used in the past or what is available on the pipe rack. A total system analysis, which combines the reservoir and piping system performance, is required to select the proper tubing size, but the effects of tubing size on velocity and slippage will be discussed.
92 As the tubing size increases, the velocity of the mixture decreases and eventually the velocity will be too low to lift the liquids to the surface. The well will then begin to load up with liquids and may eventually die. The tubing size at which a well will begin to load or the maximum tubing size which will sustain flow can be determined from a plot such as Figure 3-29.
93 Tubing Diameter and Slippage The effect of declining production rate and, therefore, velocity for a particular tubing size can be shown qualitatively in Figure For a particular tubing size, well depth, wellhead pressure and as/liquid ratio, there will exist a minimum production rate that will keep the well unloaded. Figure 3-31 shows the effect of tubing diameter on the minimum rate. This type of information is valuable in determining at what rate a well will begin to load for various tubing sizes.
94 Use of Prepared Pressure Traverse Curves In some cases it is not feasible for the field engineer to conduct an involved computer study to calculate a traverse or to calculate the pressure drop in a tubing string for give field conditions. In some cases, it may be advantageous to construct a set of pressure traverse curves for hypothetical values of the variables such as q L,GLR, d, f w, etc. These curves can then be used to estimate the pressure drop that would occur in a well producing under similar conditions.


95
Reservoir Flow Properties Fundamentals COPYRIGHT. Introduction
 Reservoir Flow Properties Fundamentals Why This Module is Important Introduction Fundamental understanding of the flow through rocks is extremely important to understand the behavior of the reservoir Permeability
Oil and Gas Well Performance
 Oil and Gas Well Performance Presented By: Jebraeel Gholinezhad Agenda 1. Introduction 2. Fandamentals 3. Oil Well Performance 4. Gas Well Performance 5. Tubing Flow Performance 6. Artificial Lift Systems
Inflow Performance 1
 1 Contents 1. Introduction 2. The Radial Flow Equation 3. Straight Line Inflow Performance Relationship 4. Vogel Inflow Performance Relationship 5. Other Inflow Performance Relationship 6. Establishing
2. Standing's Method for Present IPR
 Koya University College of Engineering School of Chemical and Petroleum Engineering Petroleum Engineering Department Petroleum Production Engineering II Predicting Present and Future IPRs (Standing Method).
Rate Transient Analysis COPYRIGHT. Introduction. This section will cover the following learning objectives:
 Learning Objectives Rate Transient Analysis Core Introduction This section will cover the following learning objectives: Define the rate time analysis Distinguish between traditional pressure transient
Well Performance and Nodal TM Analysis Fundamentals COPYRIGHT. Session #1 Virtual Instructor Led
 Well Performance and Nodal Analysis Fundamentals Well Performance and Nodal TM Analysis Fundamentals Session #1 Virtual Instructor Led Overview - This 90 Minute Session #1 of 2 Session #1 a) General SNAP
Chapter Seven. For ideal gases, the ideal gas law provides a precise relationship between density and pressure:
 Chapter Seven Horizontal, steady-state flow of an ideal gas This case is presented for compressible gases, and their properties, especially density, vary appreciably with pressure. The conditions of the
The SPE Foundation through member donations and a contribution from Offshore Europe
 Primary funding is provided by The SPE Foundation through member donations and a contribution from Offshore Europe The Society is grateful to those companies that allow their professionals to serve as
New multiphase choke correlations for a high flow rate Iranian oil field. Correspondence to: M. Safar Beiranvand
 Mech. Sci., 3, 43 47, 2012 doi:10.5194/ms-3-43-2012 Author(s) 2012. Attribution 3.0 License. Mechanical Sciences Open Access New multiphase choke correlations for a high flow rate Iranian oil field M.
Coalbed Methane Properties
 Coalbed Methane Properties Subtopics: Permeability-Pressure Relationship Coal Compressibility Matrix Shrinkage Seidle and Huitt Palmer and Mansoori Shi and Durucan Constant Exponent Permeability Incline
Pressure Transient Analysis COPYRIGHT. Introduction to Pressure Transient Analysis. This section will cover the following learning objectives:
 Pressure Transient Analysis Core Introduction to Pressure Transient Analysis This section will cover the following learning objectives: Describe pressure transient analysis (PTA) and explain its objectives
WATER INFLUX. Hassan S. Naji, Professor,
 WATER INFLUX Many reservoirs are bound on a portion or all of their peripheries by water-bearing rocks called aquifers. The aquifer may be so large compared to the reservoir size as to appear infinite,
Optimization of Gas Injection Allocation in Multi Gas Lift Wells System
 EngOpt 2008 - International Conference on Engineering Optimization Rio de Janeiro, Brazil, 01-05 June 2008. Optimization of Gas Injection Allocation in Multi Gas Lift Wells System Deni Saepudin 1,4, Pudjo
National Exams May 2016
 National Exams May 2016 98-Pet-A3, Fundamental Reservoir Engineering 3 hours duration NOTES: I. If doubt exists as to the interpretation of any question, the candidate is urged to submit with tile answer
Flow equations The basic equation, on which all flow equations are based, is Darcy s Law for radial flow is given by: p
 IJESRT INTERNATIONAL JOURNAL OF ENGINEERING SCIENCES & RESEARCH TECHNOLOGY Evaluating Productivity Index in a Gas Well Using Regression Analysis Tobuyei Christopher and Osokogwu Uche Department of Petroleum
CVE 372 HYDROMECHANICS EXERCISE PROBLEMS
 VE 37 HYDROMEHNIS EXERISE PROLEMS 1. pump that has the characteristic curve shown in the accompanying graph is to be installed in the system shown. What will be the discharge of water in the system? Take
Introduction to Well Stimulation
 Introduction to Well Stimulation PNGE 691A Ali Takbiri-Borujeni West Virginia University Fall 2018 Ali Takbiri-Borujeni PNGE 691A: Introduction to Well Stimulation 1 / 46 What is well stimulation? Main
National yams May Pet-B2, Nahiral Gas Engineering. 3 hours duration NOTES:
 ational yams May 2015 98-Pet-B2, ahiral Gas Engineering 3 hours duration OTES: 1. If doubt exists as to the interpretation of any question, the candidate is urged to submit with the answer paper, a clear
Chapter 3 Permeability
 3.2 Darcy s Law In 1856, Darcy investigated the flow of water through sand filters for water purification. His experimental apparatus is shown in Figure 3.11. By empirical observation Figure 3.11 Schematic
A New Correlation for Calculating Wellhead Production Considering Influences of Temperature, GOR, and Water-Cut for Artificially Lifted Wells
 See discussions, stats, and author profiles for this publication at: https://www.researchgate.net/publication/254516357 A New Correlation for Calculating Wellhead Production Considering Influences of Temperature,
Lesson 6 Review of fundamentals: Fluid flow
 Lesson 6 Review of fundamentals: Fluid flow The specific objective of this lesson is to conduct a brief review of the fundamentals of fluid flow and present: A general equation for conservation of mass
 WORKBOOK FOR CHEMICAL REACTOR RELIEF SYSTEM SIZING ANNEX 10 NOMENCLATURE A cross-sectional flow area of relief system (m 2 ) A actual actual cross-sectional area of safety valve nozzle (m 2 ) A approx
Darcy's Law. Laboratory 2 HWR 531/431
 Darcy's Law Laboratory HWR 531/431-1 Introduction In 1856, Henry Darcy, a French hydraulic engineer, published a report in which he described a series of experiments he had performed in an attempt to quantify
Assuming that the well s productivity index is constant, the oil flow rate can be calculated as follows:
 SPE 404 New Inflow Performance Relationship for Solution-Gas Drive Oil Reservoirs Mohamed Elias, SPE, H. Ahmed El-Banbi, SPE, K.A. Fattah, and El-Sayed Ahmed Mohamed El-Tayeb, SPE, Cairo University Copyright
Piping Systems and Flow Analysis (Chapter 3)
") Piping Systems and Flow Analysis (Chapter 3) 2 Learning Outcomes (Chapter 3) Losses in Piping Systems Major losses Minor losses Pipe Networks Pipes in series Pipes in parallel Manifolds and Distribution
Piping Systems and Flow Analysis (Chapter 3) 2 Learning Outcomes (Chapter 3) Losses in Piping Systems Major losses Minor losses Pipe Networks Pipes in series Pipes in parallel Manifolds and Distribution
Scale Flow Assurance Workflows in Multiphase Flow Simulation
 Scale Flow Assurance Workflows in Multiphase Flow Simulation Mack Shippen - Schlumberger PIPESIM Product Champion OLI Simulation Conference November 17, 2010 Abstract Multiphase flow simulation is critical
Analysis of Frictional Pressure Drop based on Flow Regimes of Oil-water Flow in Pipeline
 Journal of Scientific & Industrial Research Vol. 74, March 2015, pp. 180-184 Analysis of Frictional Pressure Drop based on Flow Regimes of Oil-water Flow in Pipeline K R Naidu 1, T K Mandal 2 and S K Majumder
PROPERTIES OF FLUIDS
 Unit - I Chapter - PROPERTIES OF FLUIDS Solutions of Examples for Practice Example.9 : Given data : u = y y, = 8 Poise = 0.8 Pa-s To find : Shear stress. Step - : Calculate the shear stress at various
Lecture-2. One-dimensional Compressible Fluid Flow in Variable Area
 Lecture-2 One-dimensional Compressible Fluid Flow in Variable Area Summary of Results(Cont..) In isoenergetic-isentropic flow, an increase in velocity always corresponds to a Mach number increase and vice
Pressure and Flow Characteristics
 Pressure and Flow Characteristics Continuing Education from the American Society of Plumbing Engineers August 2015 ASPE.ORG/ReadLearnEarn CEU 226 READ, LEARN, EARN Note: In determining your answers to
Visualization of flow pattern over or around immersed objects in open channel flow.
 EXPERIMENT SEVEN: FLOW VISUALIZATION AND ANALYSIS I OBJECTIVE OF THE EXPERIMENT: Visualization of flow pattern over or around immersed objects in open channel flow. II THEORY AND EQUATION: Open channel:
A BENCHMARK CALCULATION OF 3D HORIZONTAL WELL SIMULATIONS
 INTERNATINAL JURNAL F NUMERICAL ANALYSIS AND MDELING Volume 1, Number 2, Pages 189 201 c 2004 Institute for Scientific Computing and Information A BENCHMARK CALCULATIN F 3D HRIZNTAL WELL SIMULATINS ZHANGIN
Hydraulics! 10 An Overview!
 Hydraulics! 10 An Overview! Introduction to Well Engineering - 10 - Hydraulics 1 Contents 1. Introduction 3 2. Flow Regime & Reynolds Number 9 2.1 Introduction 9 2.2 Laminar / Turbulent Boundary in a Newtonian
PET467E-Analysis of Well Pressure Tests 2008 Spring/İTÜ HW No. 5 Solutions
 . Onur 13.03.2008 PET467E-Analysis of Well Pressure Tests 2008 Spring/İTÜ HW No. 5 Solutions Due date: 21.03.2008 Subject: Analysis of an dradon test ith ellbore storage and skin effects by using typecurve
Determining Liquid Capacity 4 th Annual Pipeline Knowledge Retention Chris Sonneborn November 7, 2013
 Determining Liquid Capacity 4 th Annual Pipeline Knowledge Retention Chris Sonneborn November 7, 2013 Outline What is important? Liquid Properties Thermal Conditions Hydraulic Gradient Flow Regime in Liquids
dynamics of f luids in porous media
 dynamics of f luids in porous media Jacob Bear Department of Civil Engineering Technion Israel Institute of Technology, Haifa DOVER PUBLICATIONS, INC. New York Contents Preface xvii CHAPTER 1 Introduction
Reservoir Rock Properties COPYRIGHT. Sources and Seals Porosity and Permeability. This section will cover the following learning objectives:
 Learning Objectives Reservoir Rock Properties Core Sources and Seals Porosity and Permeability This section will cover the following learning objectives: Explain why petroleum fluids are found in underground
FLOW MEASUREMENT IN PIPES EXPERIMENT
 University of Leicester Engineering Department FLOW MEASUREMENT IN PIPES EXPERIMENT Page 1 FORMAL LABORATORY REPORT Name of the experiment: FLOW MEASUREMENT IN PIPES Author: Apollin nana chaazou Partner
The Bernoulli Equation
 The Bernoulli Equation The most used and the most abused equation in fluid mechanics. Newton s Second Law: F = ma In general, most real flows are 3-D, unsteady (x, y, z, t; r,θ, z, t; etc) Let consider
XYZ COMPANY LTD. Prepared For: JOHN DOE. XYZ et al Knopcik 100/ W5/06 PAS-TRG. Dinosaur Park Formation
 All depths reported in mkb TVD per EUB requirements. All pressures reported in (a) per EUB requirements. 9.01 used as atmospheric pressure adjustment to convert from gauge to absolute pressure. XYZ COMPANY
Considerations for Infill Well Development in Low Permeability Reservoirs
 Considerations for Infill Well Development in Low Permeability Reservoirs George Waters Technical Manager Unconventional Completions September 9, 2014 Topics Continuous Improvement in Field Development
Mechanistic Modeling of Upward Gas-Liquid Flow in Deviated Wells
 Advances in Petroleum Exploration and Development Vol. 9, No., 015, pp. 53-57 DOI:10.3968/6659 ISSN 195-54X [Print] ISSN 195-5438 [Online] www.cscanada.net www.cscanada.org SUN Shihui [a],* ; YAN Tie [a]
NEURAL NETWORKS PREDICT WELL INFLOW PERFORMANCE. A Thesis MUHAMMAD ALRUMAH
 NEURAL NETWORKS PREDICT WELL INFLOW PERFORMANCE A Thesis by MUHAMMAD ALRUMAH Submitted to the Office of Graduate Studies of Texas A&M University in partial fulfillment of the requirements for the degree
Sand Control Rock Failure
 Sand Control Rock Failure Why? A bit of Mechanics on rock failure How? Some choices that depend on the rock What is moving? Sand grains? Fines? 3/14/2009 1 Young s Modulus, E Young s Modulus is a material
Reservoir Management Background OOIP, OGIP Determination and Production Forecast Tool Kit Recovery Factor ( R.F.) Tool Kit
 Tool Kit") Reservoir Management Background 1. OOIP, OGIP Determination and Production Forecast Tool Kit A. Volumetrics Drainage radius assumption. B. Material Balance Inaccurate when recovery factor ( R.F.) < 5 to
Reservoir Management Background 1. OOIP, OGIP Determination and Production Forecast Tool Kit A. Volumetrics Drainage radius assumption. B. Material Balance Inaccurate when recovery factor ( R.F.) < 5 to
85. An improved numerical simulation research for plunger pump in the condition of Newtonian fluid
 8. An improved numerical simulation research for plunger pump in the condition of Newtonian fluid Mingming Xing School of Mechanical Engineering, Linyi University, Linyi 276, China E-mail: xingmingming9@126.com
GREEN WELL TESTING A REPORT SUBMITTED TO THE DEPARTMENT OF PETROLEUM ENGINEERING OF STANFORD UNIVERSITY
 GREEN WELL TESTING A REPORT SUBMITTED TO THE DEPARTMENT OF PETROLEUM ENGINEERING OF STANFORD UNIVERSITY IN PARTIAL FULFILLMENT OF THE REQUIREMENTS FOR THE DEGREE OF MASTER OF SCIENCE By Ashish Dabral June
ME 309 Fluid Mechanics Fall 2010 Exam 2 1A. 1B.
 Fall 010 Exam 1A. 1B. Fall 010 Exam 1C. Water is flowing through a 180º bend. The inner and outer radii of the bend are 0.75 and 1.5 m, respectively. The velocity profile is approximated as C/r where C
INTRODUCTION TO FLUID MECHANICS June 27, 2013
 INTRODUCTION TO FLUID MECHANICS June 27, 2013 PROBLEM 3 (1 hour) A perfect liquid of constant density ρ and constant viscosity µ fills the space between two infinite parallel walls separated by a distance
Compressible Duct Flow with Friction
 Compressible Duct Flow with Friction We treat only the effect of friction, neglecting area change and heat transfer. The basic assumptions are 1. Steady one-dimensional adiabatic flow 2. Perfect gas with
Dimensionless Wellbore Storage Coefficient: Skin Factor: Notes:
 This problem set considers the "classic" Bourdet example for a pressure buildup test analyzed using derivative type curve analysis. For completeness, the Bourdet, et al. paper is also attached however,
Instructor : Dr. Jehad Hamad. Chapter (7)
") Instructor : Dr. Jehad Hamad Chapter (7) 2017-2016 Soil Properties Physical Properties Mechanical Properties Gradation and Structure Compressibility Soil-Water Relationships Shear Strength Bearing Capacity
Instructor : Dr. Jehad Hamad Chapter (7) 2017-2016 Soil Properties Physical Properties Mechanical Properties Gradation and Structure Compressibility Soil-Water Relationships Shear Strength Bearing Capacity
FACULTY OF CHEMICAL & ENERGY ENGINEERING FLUID MECHANICS LABORATORY TITLE OF EXPERIMENT: MINOR LOSSES IN PIPE (E4)
") FACULTY OF CHEMICAL & ENERGY ENGINEERING FLUID MECHANICS LABORATORY TITLE OF EXPERIMENT: MINOR LOSSES IN PIPE (E4) 1 1.0 Objectives The objective of this experiment is to calculate loss coefficient (K
FACULTY OF CHEMICAL & ENERGY ENGINEERING FLUID MECHANICS LABORATORY TITLE OF EXPERIMENT: MINOR LOSSES IN PIPE (E4) 1 1.0 Objectives The objective of this experiment is to calculate loss coefficient (K
Yutaek Seo. Subsea Engineering
 Yutaek Seo Subsea Engineering Fluid characterization Fluid characterization Bottom hole sampling DST Separator analysis Constituents of reservoir fluids Defined components TBP fractions TBP residue Defined
Pressure Head: Pressure head is the height of a column of water that would exert a unit pressure equal to the pressure of the water.
 Design Manual Chapter - Stormwater D - Storm Sewer Design D- Storm Sewer Sizing A. Introduction The purpose of this section is to outline the basic hydraulic principles in order to determine the storm
Hydraulic Design Of Polyethylene Pipes
 Hydraulic Design Of Polyethylene Pipes Waters & Farr polyethylene pipes offer a hydraulically smooth bore that provides excellent flow characteristics. Other advantages of Waters & Farr polyethylene pipes,
Gas Pipeline Hydraulics: Pressure Drop
 COURSE NUMBER: ME 423 Fluids Engineering Gas Pipeline Hydraulics: Pressure Drop Course teacher Dr. M. Mahbubur Razzaque Professor Department of Mechanical Engineering BUET 1 FLOW EQUATIONS Several equations
Civil Engineering Department College of Engineering
 Civil Engineering Department College of Engineering Course: Soil Mechanics (CE 359) Lecturer: Dr. Frederick Owusu-Nimo FREQUENCY CE 260 Results (2013) 30 25 23 25 26 27 21 20 18 15 14 15 Civil Geological
BERNOULLI EQUATION. The motion of a fluid is usually extremely complex.
 BERNOULLI EQUATION The motion of a fluid is usually extremely complex. The study of a fluid at rest, or in relative equilibrium, was simplified by the absence of shear stress, but when a fluid flows over
Managing Thermal Gradients on a Supercritical Carbon Dioxide Radial Inflow Turbine. David W. Stevens
 Managing Thermal Gradients on a Supercritical Carbon Dioxide Radial Inflow Turbine David W. Stevens dstevens@, Turbine Cooling Historically, a consistent engineering challenge Machine durability Traditional
Critical Velocity/ Nodal Stability Gas Well Predictions
 Gas Well De-Liquification Workshop Adams Mark Hotel, March 5-7, 2007 Critical Velocity/ Nodal Stability Gas Well Predictions By J F Lea, PLTech LLC Lynn Rowlan, Echometer Co. Charlie Reed, Devon Gas Well
Perforation Inflow Test Analysis (PITA)
") PETROLEUM SOCIETY CANADIAN INSTITUTE OF MINING, METALLURGY & PETROLEUM PAPER 2005-031 Perforation Inflow Test Analysis (PITA) N. M. A. RAHMAN Fekete Associates Inc. M. POOLADI-DARVISH University of Calgary
PETROLEUM SOCIETY CANADIAN INSTITUTE OF MINING, METALLURGY & PETROLEUM PAPER 2005-031 Perforation Inflow Test Analysis (PITA) N. M. A. RAHMAN Fekete Associates Inc. M. POOLADI-DARVISH University of Calgary
Hydraulics for Urban Storm Drainage
 Urban Hydraulics Hydraulics for Urban Storm Drainage Learning objectives: understanding of basic concepts of fluid flow and how to analyze conduit flows, free surface flows. to analyze, hydrostatic pressure
Petrophysics. Theory and Practice of Measuring. Properties. Reservoir Rock and Fluid Transport. Fourth Edition. Djebbar Tiab. Donaldson. Erie C.
 Petrophysics Theory and Practice of Measuring Reservoir Rock and Fluid Transport Properties Fourth Edition Djebbar Tiab Erie C. Donaldson ELSEVIER AMSTERDAM BOSTON HEIDELBERG LONDON NEW YORK OXFORD PARIS
Petroleum Engineering 324 Reservoir Performance. Objectives of Well Tests Review of Petrophysics Review of Fluid Properties 29 January 2007
 Petroleum Engineering 324 Reservoir Performance Objectives of Well Tests Review of Petrophysics Review of Fluid Properties 29 January 2007 Thomas A. Blasingame, Ph.D., P.E. Department of Petroleum Engineering
10.52 Mechanics of Fluids Spring 2006 Problem Set 3
 10.52 Mechanics of Fluids Spring 2006 Problem Set 3 Problem 1 Mass transfer studies involving the transport of a solute from a gas to a liquid often involve the use of a laminar jet of liquid. The situation
STEADY FLOW THROUGH PIPES DARCY WEISBACH EQUATION FOR FLOW IN PIPES. HAZEN WILLIAM S FORMULA, LOSSES IN PIPELINES, HYDRAULIC GRADE LINES AND ENERGY
 STEADY FLOW THROUGH PIPES DARCY WEISBACH EQUATION FOR FLOW IN PIPES. HAZEN WILLIAM S FORMULA, LOSSES IN PIPELINES, HYDRAULIC GRADE LINES AND ENERGY LINES 1 SIGNIFICANCE OF CONDUITS In considering the convenience
Design and Modeling of Fluid Power Systems ME 597/ABE Lecture 7
 Systems ME 597/ABE 591 - Lecture 7 Dr. Monika Ivantysynova MAHA Professor Fluid Power Systems MAHA Fluid Power Research Center Purdue University Content of 6th lecture The lubricating gap as a basic design
1 One-dimensional analysis
 One-dimensional analysis. Introduction The simplest models for gas liquid flow systems are ones for which the velocity is uniform over a cross-section and unidirectional. This includes flows in a long
Petroleum Engineering 324 Reservoir Performance. Objectives of Well Tests Review of Petrophysics Review of Fluid Properties 19 January 2007
 Petroleum Engineering 324 Reservoir Performance Objectives of Well Tests Review of Petrophysics Review of Fluid Properties 19 January 2007 Thomas A. Blasingame, Ph.D., P.E. Department of Petroleum Engineering
Compressible Gas Flow
 Compressible Gas Flow by Elizabeth Adolph Submitted to Dr. C. Grant Willson CHE53M Department of Chemical Engineering The University of Texas at Austin Fall 008 Compressible Gas Flow Abstract In this lab,
Reservoir Eng FOB :18 Page i Second Edition
 Second Edition C H A P T E R 1 FUNDAMENTALS OF RESERVOIR FLUID BEHAVIOR Naturally occurring hydrocarbon systems found in petroleum reservoirs are mixtures of organic compounds which exhibit multiphase
Experiment (4): Flow measurement
: Flow measurement") Experiment (4): Flow measurement Introduction: The flow measuring apparatus is used to familiarize the students with typical methods of flow measurement of an incompressible fluid and, at the same time
Experiment (4): Flow measurement Introduction: The flow measuring apparatus is used to familiarize the students with typical methods of flow measurement of an incompressible fluid and, at the same time
Flow of Non-Newtonian Fluids within a Double Porosity Reservoir under Pseudosteady State Interporosity Transfer Conditions
 SPE-185479-MS Flow of Non-Newtonian Fluids within a Double Porosity Reservoir under Pseudosteady State Interporosity Transfer Conditions J. R. Garcia-Pastrana, A. R. Valdes-Perez, and T. A. Blasingame,
Annubar Primary Element Flow Calculations
 Rosemount 485 Annubar Annubar Primary Element Flow Calculations ANNUBAR PRIMARY ELEMENT FLOW EQUATIONS The Annubar primary element flow equations are all derived from the hydraulic equations which are
Principles of Convection
 Principles of Convection Point Conduction & convection are similar both require the presence of a material medium. But convection requires the presence of fluid motion. Heat transfer through the: Solid
Again we will consider the following one dimensional slab of porous material:
 page 1 of 7 REVIEW OF BASIC STEPS IN DERIVATION OF FLOW EQUATIONS Generally speaking, flow equations for flow in porous materials are based on a set of mass, momentum and energy conservation equations,
FE Fluids Review March 23, 2012 Steve Burian (Civil & Environmental Engineering)
") Topic: Fluid Properties 1. If 6 m 3 of oil weighs 47 kn, calculate its specific weight, density, and specific gravity. 2. 10.0 L of an incompressible liquid exert a force of 20 N at the earth s surface.
Topic: Fluid Properties 1. If 6 m 3 of oil weighs 47 kn, calculate its specific weight, density, and specific gravity. 2. 10.0 L of an incompressible liquid exert a force of 20 N at the earth s surface.
CVR System. Critical Velocity Reduction A Combination of Dead Strings, Capillary Injection Foamer and Plunger Lift
 CVR System Critical Velocity Reduction A Combination of Dead Strings, Capillary Injection Foamer and Plunger Lift Presented By: Scott Campbell - Weatherford - Denver, Colorado Petey Erwin Newfield Exploration
Petroleum Engineering 324 Well Performance PRACTICE Final Examination (Well "B") 05 May 2003 (08:00-10:00 a.m. RICH 302)
 05 May 2003 (08:00-10:00 a.m. RICH 302)") Protocol: 1. The problems in this exam are to be worked completely and independently. 2. The exam is "CLOSED NOTES," students are limited to the following resources: You are permitted the use of 3 (three)
Protocol: 1. The problems in this exam are to be worked completely and independently. 2. The exam is "CLOSED NOTES," students are limited to the following resources: You are permitted the use of 3 (three)
150A Review Session 2/13/2014 Fluid Statics. Pressure acts in all directions, normal to the surrounding surfaces
 Fluid Statics Pressure acts in all directions, normal to the surrounding surfaces or Whenever a pressure difference is the driving force, use gauge pressure o Bernoulli equation o Momentum balance with
Signature: (Note that unsigned exams will be given a score of zero.)
") Neatly print your name: Signature: (Note that unsigned exams will be given a score of zero.) Circle your lecture section (-1 point if not circled, or circled incorrectly): Prof. Dabiri Prof. Wassgren Prof.
Neatly print your name: Signature: (Note that unsigned exams will be given a score of zero.) Circle your lecture section (-1 point if not circled, or circled incorrectly): Prof. Dabiri Prof. Wassgren Prof.
I am grateful for love, support and understanding from my dear husband Marius Fossmark and my loving parents Ann Elin Gilje and Dag Bergslien.
 ii Abstract The Statfjord Field has entered a drainage strategy where the reservoir will be depleted such that gas liberates from the remaining oil in the reservoirs. Adequate modelling of vertical lift
FE Exam Fluids Review October 23, Important Concepts
 FE Exam Fluids Review October 3, 013 mportant Concepts Density, specific volume, specific weight, specific gravity (Water 1000 kg/m^3, Air 1. kg/m^3) Meaning & Symbols? Stress, Pressure, Viscosity; Meaning
Opportunities in Oil and Gas Fields Questions TABLE OF CONTENTS
 TABLE OF CONTENTS A. Asset... 3 1. What is the size of the opportunity (size the prize)?... 3 2. Volumetric Evaluation... 3 3. Probabilistic Volume Estimates... 3 4. Material Balance Application... 3 5.
Unit C-1: List of Subjects
 Unit C-: List of Subjects The elocity Field The Acceleration Field The Material or Substantial Derivative Steady Flow and Streamlines Fluid Particle in a Flow Field F=ma along a Streamline Bernoulli s
Chapter 3 Pressure-Volume-Temperature for Oil
 Chapter 3 Pressure-Volume-Temperature for Oil PVT analysis PVT relationship Gas Oil scf condition underground condition simple complex ( because of bubble point) 1 Three main oil PVT parameters The three
Optimization of Plunger Lift Performance in Stripper Gas Wells during the Period 05/15/2001 to 11/30/2002
 Optimization of Plunger Lift Performance in Stripper Gas Wells during the Period 05/15/2001 to 11/30/2002 March 2003 By Erdal Ozkan Colorado School of Mines Work Performed Under Prime Award No. DE-FC26-00NT41025
Chapter 6 Pneumatic Transport
 Chapter 6 Pneumatic Transport 6.1 Pneumatic Transport Use of a gas to transport a particulate solid through pipeline Powder Rotary valve Blower Three major variables for pneumatic conveying - solid mass
Drilling in depleted reservoirs
 Classification: Internal Status: Draft Drilling in depleted reservoirs ESRA seminar, 5 th of March 2009 Line Hoff Nilsen, Leading adviser Well integrity drilling 2 Content Drilling in depleted reservoirs
Petroleum Engineering 613 Natural Gas Engineering. Texas A&M University. Lecture 07: Wellbore Phenomena
 Petroleum Engineering 613 Natural Gas Engineering Texas A&M University Lecture 07: T.A. Blasingame, Texas A&M U. Department of Petroleum Engineering Texas A&M University College Station, TX 77843-3116
Comparative Analysis of Multiphase Pressure Drop Equations
 Comparative Analysis of Multiphase Pressure Drop Equations Okologume Chinedu Wilfred Department of Petroleum and Natural Gas Engineering Federal University of Petroleum Resources, Effurun, Nigeria. wilfredokologume@yahoo.com
1-Reynold s Experiment
 Lect.No.8 2 nd Semester Flow Dynamics in Closed Conduit (Pipe Flow) 1 of 21 The flow in closed conduit ( flow in pipe ) is differ from this occur in open channel where the flow in pipe is at a pressure
2. Modeling of shrinkage during first drying period
 2. Modeling of shrinkage during first drying period In this chapter we propose and develop a mathematical model of to describe nonuniform shrinkage of porous medium during drying starting with several
STAR SHIELD 500. Ultra Low Invasion Additive and Wellbore Stabiliser
 STAR SHIELD 500 Ultra Low Invasion Additive and Wellbore Stabiliser Sealing Capacity and Key Benefits STAR SHIELD 500 An Expansion of Impact s FLC 2000 Technology 2 STAR SHIELD 500 Seals up to 500um fractures
Mass flow determination in flashing openings
 Int. Jnl. of Multiphysics Volume 3 Number 4 009 40 Mass flow determination in flashing openings Geanette Polanco Universidad Simón Bolívar Arne Holdø Narvik University College George Munday Coventry University
Basic Production Engineering and Well Performance
 Basic Production Engineering and Well Performance Dr. Hemanta Mukherjee ipoint LLC Westminster, CO. 80031 January 2011 Texts and References 1. Brown, K.E. et al.: The Technology of Artificial Lift Methods,
Hydraulics and hydrology
 Hydraulics and hydrology - project exercises - Class 4 and 5 Pipe flow Discharge (Q) (called also as the volume flow rate) is the volume of fluid that passes through an area per unit time. The discharge
Fluid Mechanics Prof. S.K. Som Department of Mechanical Engineering Indian Institute of Technology, Kharagpur
 Fluid Mechanics Prof. S.K. Som Department of Mechanical Engineering Indian Institute of Technology, Kharagpur Lecture - 42 Flows with a Free Surface Part II Good morning. I welcome you to this session
Effect of Turbulence Flow on Pressure Drop in a Single Phase Vertical Pipe
 The Open Petroleum Engineering Journal, 2011, 4, 1-8 1 Open Access Effect of Turbulence Flow on Pressure Drop in a Single Phase Vertical Pipe Adekomaya A. Olufemi*,a, Adewuyi Ademola a and Olafuyi Olalekan