ABSTRACT 1. INTRODUCTION 1 2. THEORETICAL BACKGROUND 3 3. POSITIVE DISPLACEMENT PROVERS MEASUREMENT PRINCIPLE CALIBRATION PROCEDURE 6
|
|
|
- Hubert Rose
- 5 years ago
- Views:
Transcription
1

2
3
4
5 TABLE OF CONTENTS ABSTRACT vi 1. INTRODUCTION 1 2. THEORETICAL BACKGROUND 3 3. POSITIVE DISPLACEMENT PROVERS MEASUREMENT PRINCIPLE CALIBRATION PROCEDURE PISTON PROVER BELL PROVER 7 4. SOURCES OF UNCERTAINTY 7 5. COMPONENTS OF UNCERTAINTY UNCERTAINTY OF THE PISTON PROVERS GAS DENSITY TEMPERATURE CALIBRATION TEMPERATURE SAMPLING PRESSURE CALIBRATION PRESSURE SAMPLING GAS DENSITY FUNCTION FIT GAS DENSITY EXPERIMENTAL DATA COLLECTION VOLUME, V c CYLINDER DIAMETER COLLECTION LENGTH THERMAL EXPANSION COLLECTION TIME, t 14 iii
6 TIMER CALIBRATION TIMER ACTUATION PISTON ROCKING STORAGE EFFECTS LEAKAGE AND SEALANT VAPOR PRESSURE PISTON PROVER UNCERTAINTY STATEMENT UNCERTAINTY OF THE BELL PROVERS GAS DENSITY TEMPERATURE PRESSURE CALIBRATION PRESSURE SAMPLING GAS DENSITY FUNCTION FIT AND EXPERIMENTAL DATA COLLECTION VOLUME, V c BELL AREA BELL WALL SECTIONAL AREA COLLECTION LENGTH THERMAL EXPANSION OIL LEVEL OIL FILM ADHERENCE COLLECTION TIME, t TIMER CALIBRATION TIMER ACTUATION BELL ROCKING STORAGE EFFECTS 25 iv
7 LEAKAGE AND SEALANT VAPOR PRESSURE BELL PROVER UNCERTAINTY STATEMENT SUMMARY REFERENCES 27 APPENDIX A - SAMPLE CALIBRATION REPORT 33 APPENDIX B - ESTIMATE OF EFFECT OF ELLIPTICITY OF BELL 38 APPENDIX C - DETERMINATION OF BELL-WALL VOLUME BY IMMERSION 40 v
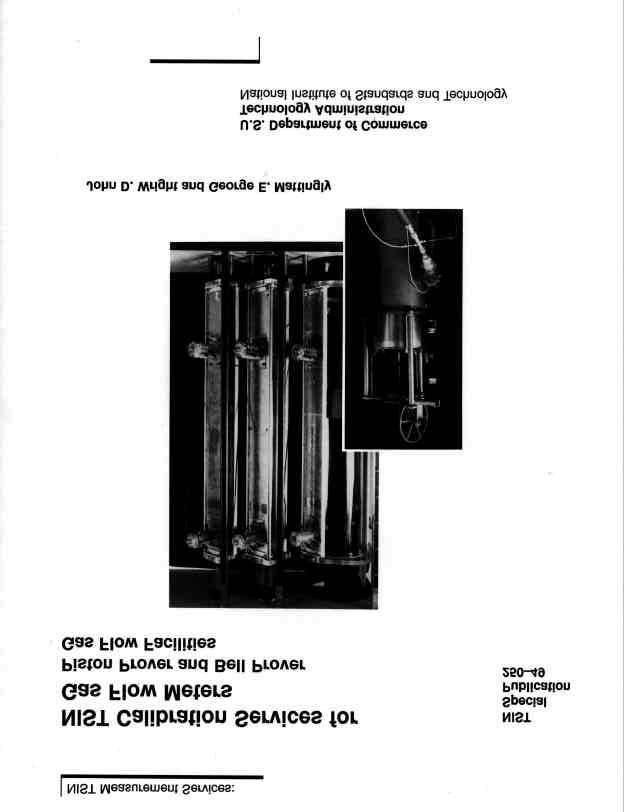
8 ABSTRACT This document provides a description of the small and medium range gas flow calibration facilities at the National Institute of Standards and Technology (NIST) Fluid Flow Group, as reported in NIST Special Publication 250 [1] for Test Nos C-18040C and 18050S, Flow Rate Measurements. The Fluid Flow Group can perform gas meter calibrations and special tests at flows between 3.7 x 10⁻⁵ m 3 /min and 1.4 m 3 /min (0.001 standard cubic feet per minute (scfm) and 51 scfm, reference temperature and pressure are K and Pa) using positive displacement techniques. The flow rate of gas passing through the meter under test is determined from pressure, temperature, volume, and transit time measurements of a displaced volume of gas. Two types of displacement devices are used: mercury-sealed piston provers and bell gasometers, or bell provers. This report describes the techniques used for calibrating meters and presents the uncertainty analysis associated with such calibrations. Key Words: air flow; bell prover; calibration; conservation of mass; density; flow meter; flow rate; piston prover; standards; uncertainty; volume. vi
9 1. INTRODUCTION In fluid flow rate measurements, no "standard" devices or artifacts are available comparable to those for length or mass measurements. Instead, reference flow rates must be derived from measurements that can be related to more fundamental standards, such as length, mass, and time standards. For primary flow rate calibrations, this is accomplished by collecting, under conditions of steady flow and fluid properties, a measured mass or volume of the flowing fluid over a measured time interval, with all measured quantities (i.e., temperature and pressure) referenced to established standards. A gas calibration flow facility consists of a fluid source (e.g., air compressor or another compressed gas source), sufficient conduit length for insertion of the test flowmeter under accepted and controllable conditions, and a means for diverting and timing the collection of a quantity of fluid, all appropriately instrumented. The Fluid Flow Group of the Process Measurements Division (part of the Chemical Science and Technology Laboratory) at the National Institute of Standards and Technology provides air flow rate calibration services over a range of 3.7 x 10⁻⁵ m 3 /min to 78 m 3 /min (0.001 scfm to 2740 scfm) [2]. Reference conditions of 20 C and Pa are used throughout this document for standard volumetric flows. Three different measurement systems are used to cover this range, as shown in Table 1, with some overlap of capability between them. The lowest flows, from 3.7 x 10⁻⁵ m 3 /min to 2.2 x 10⁻² m 3 /min (0.001 scfm to 0.79 scfm), are measured with piston provers, using a "dynamic" procedure [3-6]. A similar dynamic procedure is used to cover the intermediate range, from 2.2 x 10⁻² m 3 /min to 1.1 m 3 /min (0.79 scfm to 38.2 scfm), using bell provers. The highest flow rates are calibrated by a "static" method [3-6], employing a timed diversion into a large constant volume tank that is initially at near vacuum pressure (PVTt). This report details the performance capability of the positive displacement provers at NIST: the piston and bell provers, used for low and intermediate flow rates. The system used for calibration at high flow rates is described in a separate report. Three piston provers are used for flowmeter calibrations at NIST. The small, medium, and large piston provers have effective collection volumes of approximately 130 cm 3, 700 cm 3, and 7400 cm 3 (7.9 in 3, 43 in 3, and 450 in 3 ) respectively. The corresponding inside diameters of the prover tubes are 1.90 cm, 4.44 cm, and cm (0.75 in, 1.75 in, and 5.66 in). The three provers are mounted together in 1
10 a console and connected by a manifold to a single air source and inflow line. This arrangement allows more than one prover to be used for calibration of a flowmeter if its range so requires, and facilitates intercomparison between piston provers. Three bell provers are available at NIST with usable displacement volumes of m 3, m 3, and m 3 (2 ft 3, 4 ft 3, and 12.7 ft 3 ). Table 1. Air flow rate calibration facilities and flow range capabilities in the NIST Fluid Flow Group. (Collection times of 15 s and 210 s were used for the pistons and bells, 1800 s to 100 kpa and 40 s to 200 kpa used for the PVTt system. Reference temperature and pressure are K, kpa.) Facility Volume (m 3 ) Min. Flow (m 3 /min) Max. Flow (m 3 /min) Volume (ft 3 ) Min. Flow (ft 3 /min) Max. Flow (ft 3 /min) Small Piston x x x x x x 10-2 Med. Piston x x x x x Large Piston x x x x Small Bell x x Med. Bell x Large Bell PVTt This report describes procedures for the use of the piston and bell provers and presents detailed uncertainty analyses for these two calibration systems. Note that this report documents the uncertainty of the flow measurements provided by the piston and bell provers only. The uncertainty of the calibration coefficients for a meter under test has components beyond those discussed herein due to the instrumentation associated with the meter. An example of a meter uncertainty analysis can be found in the sample report in Appendix A. 2
11 2. THEORETICAL BACKGROUND A typical system for measuring bulk flow rate is composed of inlet piping to the meter under test, the meter under test, piping connecting the meter under test to a collection volume (the approach volume), and a diverter valve which is used to direct flow into the collection volume. A long straight run of piping upstream and downstream are needed to provide the appropriate velocity profile through the meter under test to prevent errors due to installation effects. The calibration of meters using such a system is based on the equation of conservation of mass: v v 0 = ρ dv + ρ da t V A (1) where ρ is the fluid density, t is the partial derivative with respect to time, and V is the stationary control volume for the mass balance. The quantity v is the velocity of the fluid, and da v is the unit vectorial surface area element with direction outward and normal to the control surface which surrounds the control volume. As applied to the piston prover or bell prover, a convenient form of the continuity equation gives the mass flow rate, &m, into the system as: m& = ρ V t ρ V + t c c a a + m& l. (2) Here V c is the collection volume swept by the piston or bell displacement during the time interval, t. The quantity V a is the remaining volume in the system; it includes the volume of the flowmeter being tested, the approach piping connecting the meter under test to the calibrator, the tare volume in the prover, and tubing for pressure transducer connections. The mean density of the gas in the collection volume, ρ c, is calculated from pressure and temperature measurements made during the run, and ρ a is the change in mean density of the gas in the approach piping between the start and end of the run. 3
12 The second term on the right hand side of (2) accounts for storage effects in the connecting volume, V a : if the density of the gas in V a increases above some initial value (due to decreasing temperature or increasing pressure), then gas is effectively stored in the connecting piping and the piston (or bell) velocity is reduced. For example, if the temperature profile within the connecting piping had not reached steady state, then the density of the gas in the connecting pipe could be increasing, leading to an increasing total mass of gas in the connecting piping, and further meaning that less gas is reaching the collection volume than is passing through the meter under test at that moment. It is important to recognize that the gas does not have to attain the same temperature throughout the prover and piping to make the storage effects term zero, rather the temperature distribution within the system must have reached steady state so that changes in density with respect to time are zero throughout the system. Steady state can be attained by allowing the temperatures to stabilize at a given flow condition before final flow collections are made. These effects are made smaller by working with gas temperatures that are close to room temperature. Further, these effects can be quantified by making repeated flow collections and observing trends in the temperature and flow rate measurements over the time during which steady state is reached. There is no term in (2) to account for changes in the volume of the connecting piping or tare volume of the calibrator during a collection time as these effects are negligible (relative volume changes are 3α T 3 x 10⁻⁷ for our case since α 10-6 and T 01. K). The term &m l is included to represent leakage flows into or out of the system. Leaks out of the system are kept small since leakage checks are performed and leaks minimized before calibrations are begun. The only significant source of mass flow into the system, (which did not flow through the meter under test) is from evaporation of the sealing liquid (mercury for the pistons, oil for the bells) during a gas collection. 4
13 3. POSITIVE DISPLACEMENT PROVERS 3.1. Measurement Principle The use of the piston prover is based on the principle of measuring the time interval required to collect a known volume of gas at measured temperature and pressure. It is designed to operate at or near ambient pressure and temperature. The device, shown in figure 1, consists of a precision bore glass tube in which is placed a plastic piston slightly smaller in diameter. A horizontal groove retains mercury which forms a low friction seal between the piston and the tube. The system is termed a dynamic one because the fluid collection is initiated and terminated by the moving piston as it passes through a light beam used for timing purposes. As the piston rises by virtue of the small excess pressure (0.5 kpa) of the gas introduced at the bottom of the tube, it successively starts and stops a timer by blocking a pair of light beams, each beam passing through machined slits at the extremes of the measuring volume. Each light beam is produced by a 6 V miniature lamp. The light from these lamps passes through a collimating lens, and the light sensor is a silicon photo diode. The bell prover system is based on the same principles described above. The bell prover (fig. 2) consists of a cylindrical tank open at the top and a central "dry well", which together form an annulus that is nearly filled with sealing oil. Into this annulus is placed an inverted cylindrical tank, i.e., the bell, open at the bottom and having a dome-shaped top. Its weight is nearly balanced by counterweights so that it can be raised or lowered by a small differential pressure (0.3 kpa) to collect and measure a volume of gas. A smaller counterweight is mounted on a cam so that it provides a correction for buoyancy effects as the bell immersion in the sealing liquid changes. Imperfection of the cam and counterweight system leads to variation in the pressure under the bell during the collection interval. This pressure variation contributes to the flow measurement uncertainty and is treated in a later section. Rollers and guide rods provide lateral stability in the bell position as it moves upwards. 5
14 3.2. Calibration Procedure Piston Prover Before performing a flowmeter calibration, the meter and associated instrumentation (for measuring temperatures and pressures) are installed upstream from the piston prover. To obtain a flow measurement, flow is established through the approach piping and the flowmeter and a bypass valve (fig. 1) is adjusted so that the piston is "floated" off its bottom support. Filtered dry air is available from an air compressor and other gases from pressurized cylinders may be used (nitrogen, carbon dioxide, and argon). The bypass valve is closed so that all of the flow is diverted into the prover causing the piston to rise, attain a constant speed, and pass into the collection volume. The piston is cycled up and down in the cylinder several times (by closing and opening the bypass valve) in order to attain better thermal equilibrium between the flowing gas and the prover system prior to a formal flow measurement. After cycling the piston several times, the bypass valve is closed and the calibration process begins, during which data for the meter under test are recorded, and the piston passage between the start and stop photo-detectors is electronically timed. The gas temperature is measured with a temperature sensor inserted at the entrance of the collection volume, and the gas pressure is measured with an absolute pressure transducer connected to a tap at the location shown in figure 1. The temperature and pressure of the gas entering the piston cylinder are measured during the entire gas collection period and averaged. Strictly, the temperature and pressure upon completion of the collection interval is the quantity needed, but for the piston prover, the changes in temperature and pressure over time are small, and the averaging process serves to filter instrument noise. A normal calibration test consists of five piston strokes (runs) for each of five flow rates performed on each of two different days. Details of the time, pressure and temperature measurements, along with the displaced volume determination, and their contributions to the total uncertainty of the system, are described in a later section. 6
15 Bell Prover To make a calibration measurement using the bell prover, the meter and its instrumentation are installed and the piping system is tested for leaks. Flow is established through the flowmeter and the bypass valve (fig. 2) is adjusted so that the bell is "floated" off its bottom support. Then the valve is closed so that all the flow is diverted into the bell. Like the piston prover, the bell prover is exercised in this manner in order to attain a steady temperature condition prior to the commencement of the calibration process. The bypass valve is then adjusted to float the bell as before. The valve is closed and following a brief period of acceleration and pressure transients, the bell attains a constant velocity and steady state conditions, and the bell passes through the collection interval. The collection interval for the bell is measured using photodiode optical switches which designate the start and stop positions. The temperature and pressure of the collected gas upon completion of the collection interval are needed. As for the piston prover, the pressure is measured and averaged over the entire period of the collection interval since the pressure variations due to the prover travel are small and the averaging serves to filter measurement noise. However, the last temperature measurement gathered before the completion of the collection is used. This is because at the highest flows, the temperature variations in the course of a collection are as large as 0.15 K (0.05 %). The collected gas temperature is measured with a sensor inserted into the upper part of the bell, the gas pressure under the bell is measured with an absolute pressure transducer connected to a tap in the inflow pipe (see fig. 2), and the collection is timed with an electronic timer. Details of these measurements and their contribution to the total uncertainty of the system are described in a later section. 4. SOURCES OF UNCERTAINTY The sources of uncertainty arising in the application of (2) are discussed generally in this section, and the uncertainties are further developed and quantified in section 5. 7
16 The first term on the right hand side of (2) is the largest term and represents the basic, uncorrected collection rate in the cylindrical volume of either prover. It is subject to potential errors in the determination of the collection volume, V c, the timing interval, t, and the density, ρ. The uncertainty of the gas density determination is due to uncertainties in the measurement of the pressure and mean temperature of the collected gas, as well as the goodness of fit of the best fit function used to calculate the density, and the quality of the experimental data used to determine the function. The uncertainties in temperature and pressure measurements are related to calibration quality, sampling errors, and sensor drift over time. For the piston prover, the uncertainty of the collection volume is due to uncertainties in measuring the mean diameter of the cylinder, in measuring the separation between the start and stop location (the collection length), and the effects of thermal expansion due to room temperature variations. For the bell prover, the collection volume uncertainty is derived from the uncertainties in the mean outside diameter of the bell, the wall thickness of the bell, the collection length, and the effects of thermal expansion. In addition, the effects of the oil seal on the volume must be accounted for as these can also contribute to the volume uncertainty. Therefore, the change in oil level due to the bell displacement, and the adherence of oil to the walls of the bell as it rises must be considered. The uncertainty of the timing interval measurement is due to the accuracy of the timer calibration, the uncertainties of its actuation by the start and stop switches, and any rocking of the piston or bell as it passes the switches. The second term on the right hand side of (2) (storage effects) becomes an error source if a change in density within the connecting piping is non-zero during the collection period due to changes in the temperature and pressure in the connecting piping. It should be noted that V a can be a substantial term relative to V c, so that amplification of the density change effect is possible. Leakage out of the prover at significant rates is avoided by pressurizing the closed system with the piston or bell balanced in a raised position and monitoring the constancy of its vertical position for an extended period when corrected for temperature and atmospheric pressure variations in the environment. 8
17 Uncertainty due to extra mass flow into the prover is calculated from vapor pressure data for the mercury or oil sealants. 5. COMPONENTS OF UNCERTAINTY The uncertainty analysis of this section uses the estimation approaches and the terminology suggested by Guidelines for Evaluating and Expressing the Uncertainty of NIST Measurement Results [7]. Uncertainty components have been quantified by statistical analysis of experimental data or by informed engineering estimates to obtain relative standard uncertainties with an approximate level of confidence of 67 %. These relative standard uncertainties are then used to calculate a relative combined uncertainty by taking the root-sum-squares (RSS) of the components. The combined uncertainty is multiplied by a coverage factor of 2 to obtain a relative expanded uncertainty, a two standard deviation or 95 % approximate level of confidence uncertainty. The classification of the uncertainties into type A and type B components has been done based on the examples in [7] and the designation for each uncertainty component is given in brackets { }. Whenever a combined uncertainty is composed of subcomponents of both type A and type B, the combined uncertainty is taken to be type B. The instrument types used with the provers as well as their calibration records are available in the NIST Fluid Flow Group Uncertainty of the Piston Provers Gas Density The gas density used to convert the measured volumetric flow to a mass flow is obtained from best fit equations for a given temperature and pressure [8,9]. The relative uncertainty of the density value has components due to uncertainty in the gas temperature measurement, the gas pressure measurement, the best fit equation, and the experimental data used for the fit. Gas density uncertainty due to uncertainty in 9
18 molecular weight, the universal gas constant, and the purity of the gases used have been examined and found negligible when compared to the components covered below Temperature Calibration The temperature sensors used in the piston prover system are calibrated with a transfer standard thermometer that is periodically calibrated by the NIST Thermometry Group [1]. Accounting for the uncertainties of the transfer standard, temperature nonuniformities in the temperature cell used during calibration, calibration drift, and the residuals after a best fit of the temperature sensor calibration gives a standard uncertainty of 0.06 K (relative standard uncertainty %) or less {B} Temperature Sampling The location of the temperature sensor for each prover tube just upstream of the glass tube inlet introduces additional uncertainty. Heat transfer from the room through the glass cylinder walls can lead to temperature differences between gas at the temperature measurement location and the mean temperature of the gas in the full collection volume. It has been found experimentally that the gas temperature at the sensor location decreases once gas is directed into the collection volume by closing the bypass valve. This is because the gas entering the prover is normally cooler than room temperature due to the expansion at the pressure regulator used to control flow to the meter under test. The gas continues to warm after it passes the sensor location via heat transfer from the glass cylinder walls. When the gas is exhausted from the cylinder past the temperature sensor by opening the bypass valve, the temperature sensor shows an increasing value. Therefore in experimental measurements, a roughly sinusoidal temperature trace (0.03 K peak to peak) is observed coincident with the gas entering and leaving the prover. This temperature difference will be used as part of the temperature sampling uncertainty. Additional sampling uncertainty results when the following scenario is considered. Temperature stratification in the room housing the piston prover leads to temperature gradients in the vertical direction 10
19 within the cylinder walls. For long collection intervals, this temperature gradient is imposed on the gas collected within the cylinder as well. If the heat transfer coefficient is sufficiently large, the gas is cooled again by the lower, cooler portion of the cylinder as it is exhausted. Therefore the magnitude of the observed sinusoidal temperature trace described above is damped and the results of this experiment are an underestimation of the uncertainty due to temperature sampling. Measurements of the temperature stratification in the room leads to additional temperature sampling relative uncertainty of 0.06 K. Based on all of the temperature sampling experiments, a reasonable assumption for a standard uncertainty in the temperature due to sampling errors is 0.09 K (0.030 %) {B}. Additional temperature uncertainties due to frictional heating by the flowing gas, conduction through the temperature sensor sheath, Joule-Thomson effects, and other effects of the environment in which the sensor is used have been considered and found negligible. The combined standard uncertainty of the collection volume gas temperature, due to calibration and sampling errors, calculated by taking the RSS of the uncertainty components is K or % {B} Pressure Calibration The pressure of the gas collected is measured in the piping upstream from the collection volume with an absolute pressure transducer. The transducer is periodically calibrated within the Fluid Flow Group with a piston pressure gage (traceable to the NIST Pressure and Vacuum Group). Based on the standard deviation of the residuals between the fit and the calibration data for the pressure gage, calibration results for the piston pressure gage by the Pressure and Vacuum Group, and the difference between successive periodic calibrations (drift), the relative standard uncertainty of the pressure gage over the operating range of the piston prover is % {B} Pressure Sampling Between the pressure measurement location and the entrance to the prover tube there are approximately 91 cm (36 in) of 1.3 cm (1/2 in) copper tubing and several fittings, including several elbows. 11
20 For the highest flow rate (corresponding to a 15 s collection time) the pressure loss between the measurement point and the prover tube is estimated to be 6.0 x 10⁻⁴ kpa (based on standard handbook pressure loss calculations through elbows, etc.), resulting in a % pressure relative standard uncertainty due to the sampling location {B}. Additional pressure uncertainties due to the effects of flow across a pressure tap and other influences of the environment in which the sensor is used are considered negligible. The standard uncertainty of the collection volume gas pressure, due to calibration and sampling errors, calculated by taking the RSS of the uncertainty components is kpa or % {B} Gas Density Function Fit The density of the gas in the collection volume is calculated from the temperature and pressure measurements and a best fit function (based on a second order virial equation of state) to the experimental data documented in references [8] and [9]. Comparisons between the tabulated experimental data and the output of the best fit function show that the differences are bounded by 0.05 % (for air, nitrogen, carbon dioxide, and argon). Assuming a uniform probability distribution, the relative standard uncertainty of the best fit function is % {B} Gas Density Experimental Data The plots of uncertainty data in reference [8] for the gases used in the provers and for pressures near one atmosphere show that the uncertainty of the experimental data is bounded by 0.02 %. Assuming a uniform distribution, the relative standard uncertainty of the experimental density data used is % {B}. Gathering all of the density uncertainty components by taking the RSS results in a relative combined standard uncertainty of % {B}. 12
21 Collection Volume, V c Cylinder Diameter Cylinder diameters were measured at 3.8 cm (1.5 in) intervals along the 91 cm (36 in) length of the glass tubes using bore gages that were calibrated with NIST traceable prover rings. Four diameters were measured at each cross-section and averaged. The standard uncertainties of the average diameters of the cylinders are cm, ( in) for the small piston cylinder, cm ( in) for the medium piston, and cm ( in) for the large cylinder. These diameter uncertainties lead to collection volume relative standard uncertainties of %, %, and % for the three piston provers {B} Collection Length Three pairs of aluminum length plates with two cm (0.005 in) slits nominally 45.7 cm (18 in) apart, were machined in the NIST Fabrication Technology Division and the distances between the slit pairs were measured by the NIST Precision Engineering Division. The standard uncertainty of the length between the two slits in the plates is cm ( in), and this leads to a collection volume relative standard uncertainty of % {B} Thermal Expansion The laboratory in which the piston provers are located is temperature controlled at 296 ±1.5 K. Using the 1.5 K temperature uncertainty and a thermal expansion coefficient for glass of 9 x 10⁻⁶ cm/cm K, standard uncertainties in diameter due to thermal expansion are cm, cm, and cm, respectively, for the small, medium, and large cylinders {B}. For the length measurement, the temperature difference of 1.5 K will be used again. Using a thermal expansion coefficient for the aluminum plates of 25 x 10-6 cm/cm K, the corresponding standard uncertainty in length is cm {B}. 13
22 The effects of thermal expansion on the collection volume should be combined arithmetically rather than by RSS because an increase in temperature will cause length and diameter to both increase (correlated) and these uncertainties will never cancel each other. The effects of thermal expansion due to the 1.5 K temperature change will cause collection volume relative standard uncertainties of % for all three piston provers {B}. Combining the effects of the diameter, length, and thermal expansion uncertainties by RSS gives estimates of the collection volume standard uncertainty of cm 3 (0.053 %), cm 3 (0.011 %), and cm 3 (0.033 %) for the small, medium, and large cylinders respectively {B} Collection Time, t Timer Calibration The relative of the timers used to measure t is s. In a high flow rate run of 15 s duration, this introduces a relative standard uncertainty of at most % {B} Timer Actuation Additional uncertainty is introduced by the method of actuating the timer. As the leading edge of the piston passes the start light slit (fig. 1), the light source is blocked from the detector and the voltage output drops from a positive value to zero. A second voltage drop occurs when the piston passes the stop light slit. A period timer is triggered by the start and stop voltage step changes. The uncertainty in the collection time due to timer actuation is no greater than the time required for the voltage to change between the high and low values. The voltage traces input to the timer have been collected with a storage oscilloscope, and the time necessary for the voltage step change has been measured. Based on these experiments, the uncertainty due to timer actuation is s or % for the worst case (the shortest collection time, 15 s). Combining start and stop uncertainties by taking the RSS gives a timer actuation relative standard uncertainty of % {B}. 14
23 Piston Rocking There is room for a very slight "rocking" of the piston as shown in fig. 3 due to the slight differences in diameter between the cylinder and piston. This effect can be considered either a collection volume length uncertainty or a collection time measurement uncertainty. For the medium prover, the piston diameter is cm (1.747 in), the piston length is cm, (1.76 in) and the cylinder diameter is cm ( in). Figure 3 shows that this effect can cause standard uncertainties in slit interception amounting to cm ( in), or % at each end, for a RSS relative standard uncertainty of % {B}. The small piston also has a relative uncertainty due to piston rocking of % at each end leading to % when quadratically summed, while for the large piston the figures are % and %. Combining the uncertainties in timer actuation and piston rocking by taking the RSS leads to a combined time relative standard uncertainty of %, %, and % for a 15 s collection in the small, medium, and large piston provers respectively {B} Storage Effects Changes in the density of the gas in the meter under test and the connecting piping upstream of the collection volume during the collection time lead to the storage or release of mass flow to or from V a. The change in density within V a can be due to either pressure or temperature changes. Density changes due to pressure changes during the collection time are negligible since the resistance to flow, the piston mass, and the attractive forces between the piston or mercury seal and the glass cylinder wall remain constant during the collection time. Temperature changes within V a are a more valid concern. To attain a stable temperature profile within the meter and connecting piping, it is necessary to establish the flow through the meter under test for several minutes and then to cycle the piston up and down the cylinder at least three times before collecting flow data. Experimental temperature measurements made at several tap locations in the connecting piping show that the gas temperature in V a changes by less than K during a collection interval, which corresponds to a density change of %. The significance of the density change in V a 15
24 can be amplified or reduced depending on the ratio of the approach volume to the collection volume. For the small, medium, and large piston provers, V a / V c is 1.5, 0.5, and 0.1 respectively, resulting in relative standard uncertainties in mass flow due to storage effects of %, %, and % respectively {B} Leakage and Sealant Vapor Pressure Tests to measure any leakage out of the piston prover are conducted periodically or after any change in the piping is made, such as if a temperature sensor is removed for calibration and then re-installed. If a leak any larger than % of the minimum flow measured by that piston is detected, its source is ascertained and corrected. Reference data for the saturation vapor pressure of mercury at room temperature show that this source of mass flow is far less than % and hence this source of uncertainty will be neglected. Therefore, a reasonable value for the relative standard uncertainty due to leakage effects is % {B} Piston Prover Uncertainty Statement The flow rate relative uncertainty can be obtained by combining the uncertainties for density, volume, time, and storage effects as listed in Table 2. The RSS of all uncertainties in Table 2 yields the relative combined standard uncertainties for the small, medium, and large piston provers respectively of %, %, and %. Applying a coverage factor of 2 to provide a 95 % approximate level of confidence, gives a relative expanded uncertainty of %, %, and % for the small, medium, and large piston provers respectively. 16
25 Table 2. A summary of the piston prover uncertainties. The quantities in the column labeled value are standard uncertainties for each uncertainty category. The column labeled % gives the relative standard uncertainties for each uncertainty category expressed as a percentage. A coverage factor of 2 has been used to convert the combined standard uncertainty to the relative expanded uncertainty with a 95 % approximate level of confidence. Uncertainty Category Relative Standard Uncertainty Small Piston Prover Medium Piston Prover Large Piston Prover Value % Value % Value % Gas Density Temperature K K K Pressure kpa kpa kpa Fitting Function Experimental Data Collection Volume cm cm cm Cylinder Diameter 5.0 x 10-4 cm x 10-4 cm x 10-3 cm Collection Length 5.0 x 10-4 cm x 10-4 cm x 10-4 cm Thermal Expansion 8.0 x 10-3 cm x 10-2 cm x 10-1 cm Collection Time s s s Timer Calibration 1.0 x 10-4 s x 10-4 s x 10-4 s Timer Actuation 8.5 x 10-3 s x 10-3 s x 10-3 s Piston Rocking Storage Effects Leakage and Vapor Pressure Flow Combined Uncertainty Flow Expanded Uncertainty
26 5.2. Uncertainty of the Bell Provers The uncertainty analysis for the bell prover is based primarily on experimental measurements from the smallest bell. It is expected that the medium and large bell provers will have similar or better uncertainties than the small bell. Therefore, in what follows, the small bell prover will be assessed as the worst case situation Gas Density The uncertainty in the density of the gas collected in the bell provers has the same components as the piston provers. Uncertainty in density arises from: the temperature measurement, the pressure measurement, the density fitting function, and the density experimental data {B} Temperature The temperature sensor calibration data for the bell provers has a standard deviation of K or less. The sensor is installed near the center of the collection volume and due to the incoming flow there is ample mixing to ensure that the temperature measured is a good sample of the entire volume. Unlike the piston prover system, the bell prover temperature is taken as the last temperature measured before the completion of the collection interval. The response time of the pressure and temperature sensors is adequate to accurately reflect changes in temperature and pressure over time. Nevertheless, the bells are cycled up and down several times before a formal flow measurement is made to attain better temperature equilibration within the bell prover system. Based on experimental measurements, a reasonable temperature sampling standard uncertainty for the bells is 0.03 K (0.010 %). Additional temperature uncertainties due to frictional heating by the flowing gas, conduction through the temperature sensor sheath, and other effects of the environment in which the sensor is used are considered negligible. Combining the temperature calibration and sampling uncertainties by RSS results in a combined temperature standard uncertainty of K or a relative standard uncertainty of % {B}. 18
27 Pressure Calibration The same pressure transducers are used for both the piston and bell provers. The relative standard uncertainty of the pressure calibration is % {A} Pressure Sampling Between the pressure tap in the inflow pipe and the entrance to the small bell there are several fittings and approximately 120 cm (48 in) of pipe. For high flow rates the pressure losses between the measurement point and the bell can be estimated using the following relation: P loss = U λ l + k + k + ρ 1 2 K d 2 2 (3) where λ is the friction coefficient, l and d are the length and diameter of the pipe, respectively, the k terms are loss coefficients for the respective fittings, U is the average gas velocity in the pipe, and ρ is the gas density. For a high flow rate of 1800 cm 3 /s, the mean velocity in the 4.83 cm (1.9 in) diameter pipe is 98 cm/s (3.2 ft/s). The Reynolds number is 3000, for which λ = 0.02 from the Moody friction factor curves [10]. λ l d = (0.02)(120)/4.83 = elbows at k = 0.75 = enlargement = 1.00 Total
28 Substituting the above loss coefficients into the pressure loss equation above results in a pressure loss of kpa, or a % reduction {B}. In addition to the sampling location, there is an issue of changes in pressure in the collection volume during the course of a bell stroke. Unlike the piston prover where the force applied to the collected gas is for all practical purposes constant, the counterweight system of the bells is imperfect and leads to changes in the pressure during a run. The quantities of interest (for both the piston and bell provers) are the mean pressure and temperature of the gas at the same instant that the collection is completed. However, to reduce the effects of noise in sensor signals, average values over the entire collection interval are used instead. Experimental measurements (on all three bell provers) show that the difference between the final pressure and the average pressure over the collection interval is less than kpa, leading to relative standard uncertainties in the density of % {B}. Additional pressure uncertainties due to flow across the pressure taps and other influences of the environment in which the sensor is used are considered negligible. Using quadrature to combine all of the pressure uncertainty components gives a relative standard uncertainty of % or kpa {B} Gas Density Function Fit and Experimental Data These sources of uncertainty are the same as given in the piston prover section, % and %. Gathering all of the density uncertainty components by taking the RSS results in a combined density relative standard uncertainty of % {B} Collection Volume, V c The bell volume has traditionally been determined either by direct transfer of known air volumes from calibrated bottles or by methods involving direct dimensional measurement of the bell [11-13]. The preferred procedure at NIST is to "strap" the bell to obtain the outside volume via an average diameter, and to obtain the inner volume by subtracting the volume of metal in the bell wall. The volume of the bell wall is 20
29 measured by comparing the rise in oil level due to bell immersion with the rise observed due to the immersion of a known volume Bell Area The outside diameter measurements of the bell and dry well were made using strapping techniques with an NIST-calibrated pi tape at numerous vertical locations. Statistical techniques applied by the NIST Statistical Engineering Division provided the bell diameter as a function of vertical distance from top to bottom of the bell. The mean outside diameter is cm ( in) over the bell length corresponding to the timing distance. The dry well diameter is cm ( in). It is noteworthy that errors in the strapping measurements may occur due to ellipticity of the strap resulting from tape misalignment on the bell perimeters. Such misalignment of the tape gives rise to the interpretation that data points with lower values should approximate the "true" value. This approach results in an estimate of cm (0.002 in) standard uncertainty in the average diameter, or % relative standard uncertainty in the cross sectional area of the bell {B}. It is shown in Appendix B that ellipticity of the bell characterized by major and minor axes which differ from circular by 2ε introduces a relative error of 8(ε/D) 2. In a survey, the bell diameter was checked with calipers and the average ε was determined to be less than 0.02 cm (0.008 in), resulting in a negligibly small error of % Bell-wall Sectional Area The details of the determination of average bell-wall sectional area by immersion of a known volume are given in Appendix C, in which the relative standard uncertainty of this determination is estimated as 0.95 %. Since the bell-wall volume is only 0.78 % of the total, the contribution of this uncertainty is only % {B}. 21
30 Collection Length The length of the bell travel is determined by measuring the distance between two photodiode switches attached to the dry well. These are used to generate a rising and falling voltage edge which triggers a counter to start and stop. The distance between the switches was measured with a transfer standard calibrated by the NIST Precision Engineering Division using a laser interferometer [1]. The travel length for the bell, in a start and stop mode is cm ( in) with a standard uncertainty of ±0.013 cm (0.005 in), or a relative standard uncertainty less than 0.03 % {B} Thermal Expansion The laboratory in which the bell provers are located is temperature controlled at 296 ±1.5 K. Therefore, the bell could be used at a temperature approximately 1.5 K different from that at which it was strapped. Using thermal expansion coefficients of 19 x 10-6 and 12 x 10-6 cm/cm - K, for the brass bell and steel support for the photodiode switches respectively, gives a relative standard uncertainty of % {B} Oil Level The cm (0.237 in) change in oil level due to bell displacement over the collection distance is obtained from direct measurement. This oil level change results in a correction to the bell collection volume of % (see fig. 2). The uncertainty in the measurement of the drop in oil level stems primarily from the cm (0.010 in) standard uncertainty in setting the bell positions at the ends of the measurement stroke of cm ( in). This amounts to a % relative standard uncertainty in a quantity that is % of the collection volume, and therefore the oil level uncertainty is negligible Oil Film Adherence The oil film adherence is essentially the same on the inside and the outside of the bell wall. However, if the inside and outside oil surface areas are sufficiently different, the two oil-level depletions may be inconsistent with the pressure difference between the bell and atmosphere. A transfer of oil occurs between the inside and outside of the bell to balance this inconsistency, and a systematic error is 22
31 introduced. A theory to quantify this bias was developed by Smith [14]. The volume of liquid adhering to the bell, V L, is given as V L U = π υ hr D 3 g (4) where υ is the kinematic viscosity of the sealing oil, U is the bell rise velocity, g is the acceleration due to gravity, h r is the height through which the bell is raised, and D is the inside diameter of the bell. Evaluating this equation with υ = cm 2 /s, U = 1.65 cm/s (corresponding to a high flow rate), h r = 47 cm and D = 39 cm, we obtain, V L = cm 3. It is also shown in [14] that the net change in gas volume, V G, due to the oil films is ( 1 2 ) V V S b D S i + G = L S + S i o o (5) where S i is the inner surface area of the oil, i.e., between the inside of the bell and the dry well, S o is the outer surface area of the oil, i.e., between the outside of the bell and the tank, and b is the thickness of the bell wall. For S i = cm 2, S o = cm 2, and b = 0.76 mm, V G = 7.4 cm 3, giving a bias relative to the bell collection volume of % {B}; i.e., there is a smaller volume of gas collected than is accounted for by computations which include only the dimensions of the bell and the change in oil level due to bell immersion. This quantity will be considered the relative standard uncertainty due to oil film adherence. Using quadrature to total the previously listed uncertainty components for the bell collection volume, the relative combined standard uncertainty for the volume is % {B}. 23
32 Collection Time, t Timer Calibration The same timer is used for both the bells and the pistons, and its calibration standard uncertainty is 1 x 10⁻⁴ s, or less than % for the shortest collection time (15 s) {B} Timer Actuation The collection time is measured via photodiode switches as described in section Tests of the switches by the same methods previously described for the piston prover indicate a reasonable estimate of the timer actuation standard uncertainty is s, or % {B} Bell Rocking The bell provers have a source of uncertainty which is analogous to the piston rocking issue and can be considered a collection time measurement uncertainty. Tipping and lateral motion of the bell is restrained by sets of sheaved wheels which roll on three brass rods, but slight lateral displacements are still possible. Measurements with a dial gage of the bell position during its travel show lateral displacements of 0.05 cm (0.02 in) or less over the 45.7 cm (18 in) collection length. For a tipped position that generates 0.05 cm lateral displacement, geometry shows that the vertical displacement can be as large as mm ( in), or % of the bell collection length. If we allow for opposite displacements at the ends of the collection period by addition in quadrature, the total timing relative standard uncertainty due to bell rocking is % {B}. Combining all timing uncertainties by RSS gives a relative standard uncertainty of % {B}. 24
33 Storage Effects As for the piston prover, temperature and pressure changes in the gas within the approach volume result in V a being a source or sink of mass flow. Experimental measurements on all three bells show that the pressure within the approach volume increases by no more than kpa during the course of a collection which results in a density relative standard uncertainty in V a of %. Temperature changes within V a are minimized by running the flow through the meter under test and connecting piping for several minutes and by cycling the bell up and down at least three times before a formal flow measurement is made. In this way, temperature changes in V a during a collection are kept less than K, for a density relative standard uncertainty of %. Combining the uncertainties due to pressure and temperature by quadrature leads to a possible density change of %. As for the piston provers, this density uncertainty must be weighted by the ratio of the approach volume to the collection volume. The ratio V a / V c for the three bell provers is 0.1, 0.5, and 0.7 for the small, medium, and large bells respectively. Using the largest ratio of 0.7 leads to a storage effect relative standard uncertainty of % {B} Leakage and Sealant Vapor Pressure Tests to measure the leakage of gas from the bell prover are conducted periodically or after any piping change, such as the removal and re-installation of a temperature sensor. If leaks larger than % of the minimum flow measured by the prover are detected, the source of the leak is ascertained and corrected. The saturation vapor pressure of the oil used to seal the gas within the bell is less than 3 Pa. Therefore, if the rate of mass transfer from the oil surfaces under the bell to the gas collected is sufficient to achieve saturation, the percentage of the collected gas that is oil vapor would be less than (3 Pa / Pa) x 100 or % (using one atmosphere for the total pressure under the bell). Noting that these two uncertainties must be opposite in sign, % will be taken as the relative standard uncertainty due to leakage and the sealant vapor pressure together {B}. 25
Applied Fluid Mechanics
 Applied Fluid Mechanics 1. The Nature of Fluid and the Study of Fluid Mechanics 2. Viscosity of Fluid 3. Pressure Measurement 4. Forces Due to Static Fluid 5. Buoyancy and Stability 6. Flow of Fluid and
ME332 FLUID MECHANICS LABORATORY (PART II)
") ME332 FLUID MECHANICS LABORATORY (PART II) Mihir Sen Department of Aerospace and Mechanical Engineering University of Notre Dame Notre Dame, IN 46556 Version: April 2, 2002 Contents Unit 5: Momentum transfer
ME332 FLUID MECHANICS LABORATORY (PART II) Mihir Sen Department of Aerospace and Mechanical Engineering University of Notre Dame Notre Dame, IN 46556 Version: April 2, 2002 Contents Unit 5: Momentum transfer
Applied Fluid Mechanics
 Applied Fluid Mechanics 1. The Nature of Fluid and the Study of Fluid Mechanics 2. Viscosity of Fluid 3. Pressure Measurement 4. Forces Due to Static Fluid 5. Buoyancy and Stability 6. Flow of Fluid and
Applied Fluid Mechanics
 Applied Fluid Mechanics 1. The Nature of Fluid and the Study of Fluid Mechanics 2. Viscosity of Fluid 3. Pressure Measurement 4. Forces Due to Static Fluid 5. Buoyancy and Stability 6. Flow of Fluid and
Experiment (4): Flow measurement
: Flow measurement") Experiment (4): Flow measurement Introduction: The flow measuring apparatus is used to familiarize the students with typical methods of flow measurement of an incompressible fluid and, at the same time
Experiment (4): Flow measurement Introduction: The flow measuring apparatus is used to familiarize the students with typical methods of flow measurement of an incompressible fluid and, at the same time
AE 3051, Lab #16. Investigation of the Ideal Gas State Equation. By: George P. Burdell. Group E3
 AE 3051, Lab #16 Investigation of the Ideal Gas State Equation By: George P. Burdell Group E3 Summer Semester 000 Abstract The validity of the ideal gas equation of state was experimentally tested for
Differential Mobility Particle Sizer (Aerosol measurements)
") Institute for Atmospheric and Climate Science - IACETH Atmospheric Physics Lab Work Differential Mobility Particle Sizer (Aerosol measurements) Abstract A differential mobility particle sizer (DMPS) is
Institute for Atmospheric and Climate Science - IACETH Atmospheric Physics Lab Work Differential Mobility Particle Sizer (Aerosol measurements) Abstract A differential mobility particle sizer (DMPS) is
FE Fluids Review March 23, 2012 Steve Burian (Civil & Environmental Engineering)
") Topic: Fluid Properties 1. If 6 m 3 of oil weighs 47 kn, calculate its specific weight, density, and specific gravity. 2. 10.0 L of an incompressible liquid exert a force of 20 N at the earth s surface.
Topic: Fluid Properties 1. If 6 m 3 of oil weighs 47 kn, calculate its specific weight, density, and specific gravity. 2. 10.0 L of an incompressible liquid exert a force of 20 N at the earth s surface.
Piping Systems and Flow Analysis (Chapter 3)
") Piping Systems and Flow Analysis (Chapter 3) 2 Learning Outcomes (Chapter 3) Losses in Piping Systems Major losses Minor losses Pipe Networks Pipes in series Pipes in parallel Manifolds and Distribution
Piping Systems and Flow Analysis (Chapter 3) 2 Learning Outcomes (Chapter 3) Losses in Piping Systems Major losses Minor losses Pipe Networks Pipes in series Pipes in parallel Manifolds and Distribution
Laboratory 1: Calibration of a High-Volume Sampler
 Laboratory 1 Laboratory 1: Calibration of a High-Volume Sampler 1.1 To the User of this Manual This manual has been prepared to guide the students through a series of laboratory exercises developed to
S.E. (Mech.) (First Sem.) EXAMINATION, (Common to Mech/Sandwich) FLUID MECHANICS (2008 PATTERN) Time : Three Hours Maximum Marks : 100
 (First Sem.) EXAMINATION, (Common to Mech/Sandwich) FLUID MECHANICS (2008 PATTERN) Time : Three Hours Maximum Marks : 100") Total No. of Questions 12] [Total No. of Printed Pages 8 Seat No. [4262]-113 S.E. (Mech.) (First Sem.) EXAMINATION, 2012 (Common to Mech/Sandwich) FLUID MECHANICS (2008 PATTERN) Time : Three Hours Maximum
Total No. of Questions 12] [Total No. of Printed Pages 8 Seat No. [4262]-113 S.E. (Mech.) (First Sem.) EXAMINATION, 2012 (Common to Mech/Sandwich) FLUID MECHANICS (2008 PATTERN) Time : Three Hours Maximum
Eric G. Paterson. Spring 2005
 Eric G. Paterson Department of Mechanical and Nuclear Engineering Pennsylvania State University Spring 2005 Reading and Homework Read Chapter 3. Homework Set #2 has been posted. Due date: Friday 21 January.
The online of midterm-tests of Fluid Mechanics 1
 The online of midterm-tests of Fluid Mechanics 1 1) The information on a can of pop indicates that the can contains 460 ml. The mass of a full can of pop is 3.75 lbm while an empty can weights 80.5 lbf.
Chapter Four fluid flow mass, energy, Bernoulli and momentum
 4-1Conservation of Mass Principle Consider a control volume of arbitrary shape, as shown in Fig (4-1). Figure (4-1): the differential control volume and differential control volume (Total mass entering
PTB S 16.5 MN HYDRAULIC AMPLIFICATION MACHINE AFTER MODERNIZATION
 IMEKO 22 nd TC3, 15 th TC5 and 3 rd TC22 International Conferences 3 to 5 February, 2014, Cape Town, Republic of South Africa PTB S 16.5 MN HYDRAULIC AMPLIFICATION MACHINE AFTER MODERNIZATION R. Kumme
Hydraulics and hydrology
 Hydraulics and hydrology - project exercises - Class 4 and 5 Pipe flow Discharge (Q) (called also as the volume flow rate) is the volume of fluid that passes through an area per unit time. The discharge
Nicholas J. Giordano. Chapter 10 Fluids
 Nicholas J. Giordano www.cengage.com/physics/giordano Chapter 10 Fluids Fluids A fluid may be either a liquid or a gas Some characteristics of a fluid Flows from one place to another Shape varies according
Development of a 0.2 % High-Speed Dry Piston Prover
 Development of a 0.2 % High-Speed Dry Piston Prover Presented at 2003 Measurement Science Conference Harvey Padden Bios International Corporation 10 Park Place, Butler, NJ 07405, U.S.A. Phone: 973.492.8400
ME3560 Tentative Schedule Fall 2018
 ME3560 Tentative Schedule Fall 2018 Week Number 1 Wednesday 8/29/2018 1 Date Lecture Topics Covered Introduction to course, syllabus and class policies. Math Review. Differentiation. Prior to Lecture Read
CHAPTER 3 BASIC EQUATIONS IN FLUID MECHANICS NOOR ALIZA AHMAD
 CHAPTER 3 BASIC EQUATIONS IN FLUID MECHANICS 1 INTRODUCTION Flow often referred as an ideal fluid. We presume that such a fluid has no viscosity. However, this is an idealized situation that does not exist.
W 18e Heat Capacity Ratio γ
 Fakultät für Physik und Geowissenschaften Physikalisches Grundpraktikum W 8e Heat Capacity Ratio γ Tasks Determine the heat capacity ratio γ of air and carbon dioxide using the method of Clément and Desormes.
UNIT I FLUID PROPERTIES AND STATICS
 SIDDHARTH GROUP OF INSTITUTIONS :: PUTTUR Siddharth Nagar, Narayanavanam Road 517583 QUESTION BANK (DESCRIPTIVE) Subject with Code : Fluid Mechanics (16CE106) Year & Sem: II-B.Tech & I-Sem Course & Branch:
Mass of fluid leaving per unit time
 5 ENERGY EQUATION OF FLUID MOTION 5.1 Eulerian Approach & Control Volume In order to develop the equations that describe a flow, it is assumed that fluids are subject to certain fundamental laws of physics.
ME3560 Tentative Schedule Spring 2019
 ME3560 Tentative Schedule Spring 2019 Week Number Date Lecture Topics Covered Prior to Lecture Read Section Assignment Prep Problems for Prep Probs. Must be Solved by 1 Monday 1/7/2019 1 Introduction to
5 ENERGY EQUATION OF FLUID MOTION
 5 ENERGY EQUATION OF FLUID MOTION 5.1 Introduction In order to develop the equations that describe a flow, it is assumed that fluids are subject to certain fundamental laws of physics. The pertinent laws
CHAPTER 5 CONVECTIVE HEAT TRANSFER COEFFICIENT
 62 CHAPTER 5 CONVECTIVE HEAT TRANSFER COEFFICIENT 5.1 INTRODUCTION The primary objective of this work is to investigate the convective heat transfer characteristics of silver/water nanofluid. In order
Matter and Thermal Energy
 Section States of Matter Can you identify the states of matter present in the photo shown? Kinetic Theory The kinetic theory is an explanation of how particles in matter behave. Kinetic Theory The three
Experiment 1. Measurement of Thermal Conductivity of a Metal (Brass) Bar
 Bar") Experiment 1 Measurement of Thermal Conductivity of a Metal (Brass) Bar Introduction: Thermal conductivity is a measure of the ability of a substance to conduct heat, determined by the rate of heat flow
Experiment 1 Measurement of Thermal Conductivity of a Metal (Brass) Bar Introduction: Thermal conductivity is a measure of the ability of a substance to conduct heat, determined by the rate of heat flow
If there is convective heat transfer from outer surface to fluid maintained at T W.
 Heat Transfer 1. What are the different modes of heat transfer? Explain with examples. 2. State Fourier s Law of heat conduction? Write some of their applications. 3. State the effect of variation of temperature
ME-B41 Lab 1: Hydrostatics. Experimental Procedures
 ME-B41 Lab 1: Hydrostatics In this lab you will do four brief experiments related to the following topics: manometry, buoyancy, forces on submerged planes, and hydraulics (a hydraulic jack). Each experiment
PHYS102 Previous Exam Problems. Temperature, Heat & The First Law of Thermodynamics
 PHYS102 Previous Exam Problems CHAPTER 18 Temperature, Heat & The First Law of Thermodynamics Equilibrium & temperature scales Thermal expansion Exchange of heat First law of thermodynamics Heat conduction
UNIT II CONVECTION HEAT TRANSFER
 UNIT II CONVECTION HEAT TRANSFER Convection is the mode of heat transfer between a surface and a fluid moving over it. The energy transfer in convection is predominately due to the bulk motion of the fluid
Standard Practices for Air Speed Calibration Testing
 Standard Practices for Air Speed Calibration Testing Rachael V. Coquilla Bryza Wind Lab, Fairfield, California Air speed calibration is a test process where the output from a wind measuring instrument
FE Exam Fluids Review October 23, Important Concepts
 FE Exam Fluids Review October 3, 013 mportant Concepts Density, specific volume, specific weight, specific gravity (Water 1000 kg/m^3, Air 1. kg/m^3) Meaning & Symbols? Stress, Pressure, Viscosity; Meaning
(Refer Slide Time: 1: 19)
") Mechanical Measurements and Metrology Prof. S. P. Venkateshan Department of Mechanical Engineering Indian Institute of Technology, Madras Module - 4 Lecture - 46 Force Measurement So this will be lecture
Mechanical Measurements and Metrology Prof. S. P. Venkateshan Department of Mechanical Engineering Indian Institute of Technology, Madras Module - 4 Lecture - 46 Force Measurement So this will be lecture
Annubar Primary Element Flow Calculations
 Rosemount 485 Annubar Annubar Primary Element Flow Calculations ANNUBAR PRIMARY ELEMENT FLOW EQUATIONS The Annubar primary element flow equations are all derived from the hydraulic equations which are
first law of ThermodyNamics
 first law of ThermodyNamics First law of thermodynamics - Principle of conservation of energy - Energy can be neither created nor destroyed Basic statement When any closed system is taken through a cycle,
Name : Applied Physics II Exam One Winter Multiple Choice ( 7 Points ):
:") Name : e-mail: Applied Physics II Exam One Winter 2006-2007 Multiple Choice ( 7 Points ): 1. Pure nitrogen gas is contained in a sealed tank containing a movable piston. The initial volume, pressure and
Name : e-mail: Applied Physics II Exam One Winter 2006-2007 Multiple Choice ( 7 Points ): 1. Pure nitrogen gas is contained in a sealed tank containing a movable piston. The initial volume, pressure and
ME332 FLUID MECHANICS LABORATORY (PART I)
") ME332 FLUID MECHANICS LABORATORY (PART I) Mihir Sen Department of Aerospace and Mechanical Engineering University of Notre Dame Notre Dame, IN 46556 Version: January 14, 2002 Contents Unit 1: Hydrostatics
ME332 FLUID MECHANICS LABORATORY (PART I) Mihir Sen Department of Aerospace and Mechanical Engineering University of Notre Dame Notre Dame, IN 46556 Version: January 14, 2002 Contents Unit 1: Hydrostatics
Evaluation of the Effect of Relative Humidity of Air on the Coefficients of Critical Flow Venturi Nozzles
 Evaluation of the Effect of Relative Humidity of Air on the Coefficients of Critical Flow Venturi Nozzles K. Chahine and M. Ballico National Measurement Institute, Australia P O Box 264, Lindfield, NSW
EXPERIMENT 2-6. e/m OF THE ELECTRON GENERAL DISCUSSION
 Columbia Physics: Lab -6 (ver. 10) 1 EXPERMENT -6 e/m OF THE ELECTRON GENERAL DSCUSSON The "discovery" of the electron by J. J. Thomson in 1897 refers to the experiment in which it was shown that "cathode
Physics 3 Summer 1990 Lab 7 - Hydrodynamics
 Physics 3 Summer 1990 Lab 7 - Hydrodynamics Theory Consider an ideal liquid, one which is incompressible and which has no internal friction, flowing through pipe of varying cross section as shown in figure
White Paper FINAL REPORT AN EVALUATION OF THE HYDRODYNAMICS MECHANISMS WHICH DRIVE THE PERFORMANCE OF THE WESTFALL STATIC MIXER.
 White Paper FINAL REPORT AN EVALUATION OF THE HYDRODYNAMICS MECHANISMS WHICH DRIVE THE PERFORMANCE OF THE WESTFALL STATIC MIXER Prepared by: Dr. Thomas J. Gieseke NUWCDIVNPT - Code 8233 March 29, 1999
EXPERIMENT No.1 FLOW MEASUREMENT BY ORIFICEMETER
 EXPERIMENT No.1 FLOW MEASUREMENT BY ORIFICEMETER 1.1 AIM: To determine the co-efficient of discharge of the orifice meter 1.2 EQUIPMENTS REQUIRED: Orifice meter test rig, Stopwatch 1.3 PREPARATION 1.3.1
Visualization of flow pattern over or around immersed objects in open channel flow.
 EXPERIMENT SEVEN: FLOW VISUALIZATION AND ANALYSIS I OBJECTIVE OF THE EXPERIMENT: Visualization of flow pattern over or around immersed objects in open channel flow. II THEORY AND EQUATION: Open channel:
Engineering Thermodynamics. Chapter 1. Introductory Concepts and Definition
 1.1 Introduction Chapter 1 Introductory Concepts and Definition Thermodynamics may be defined as follows : Thermodynamics is an axiomatic science which deals with the relations among heat, work and properties
Solar Flat Plate Thermal Collector
 Solar Flat Plate Thermal Collector INTRODUCTION: Solar heater is one of the simplest and basic technologies in the solar energy field. Collector is the heart of any solar heating system. It absorbs and
Academic Challenge District Physics Exam 1996
 Academic Challenge District Physics Exam 1996 1. 1.73 seconds after being dropped from rest, a freely-falling object near the Earth's surface will have a speed closest to: (a. ) 17.0 meters per second.
Two mark questions and answers UNIT I BASIC CONCEPT AND FIRST LAW SVCET
 Two mark questions and answers UNIT I BASIC CONCEPT AND FIRST LAW 1. What do you understand by pure substance? A pure substance is defined as one that is homogeneous and invariable in chemical composition
ELEC9712 High Voltage Systems. 1.2 Heat transfer from electrical equipment
 ELEC9712 High Voltage Systems 1.2 Heat transfer from electrical equipment The basic equation governing heat transfer in an item of electrical equipment is the following incremental balance equation, with
11.1 Mass Density. Fluids are materials that can flow, and they include both gases and liquids. The mass density of a liquid or gas is an
 Chapter 11 Fluids 11.1 Mass Density Fluids are materials that can flow, and they include both gases and liquids. The mass density of a liquid or gas is an important factor that determines its behavior
UNIT I Basic concepts and Work & Heat Transfer
 SIDDHARTH GROUP OF INSTITUTIONS :: PUTTUR Siddharth Nagar, Narayanavanam Road 517583 QUESTION BANK (DESCRIPTIVE) Subject with Code: Engineering Thermodynamics (16ME307) Year & Sem: II-B. Tech & II-Sem
Heat and Mass Transfer Prof. S.P. Sukhatme Department of Mechanical Engineering Indian Institute of Technology, Bombay
 Heat and Mass Transfer Prof. S.P. Sukhatme Department of Mechanical Engineering Indian Institute of Technology, Bombay Lecture No. 18 Forced Convection-1 Welcome. We now begin our study of forced convection
Chapter 11 Ideal gases
 OCR (A) specifications: 5.4.10c,d,e,i,j,k Chapter 11 Ideal gases Worksheet Worked examples Practical: Determining absolute zero of temperature from the pressure law End-of-chapter test Marking scheme:
TOPICS. Density. Pressure. Variation of Pressure with Depth. Pressure Measurements. Buoyant Forces-Archimedes Principle
 Lecture 6 Fluids TOPICS Density Pressure Variation of Pressure with Depth Pressure Measurements Buoyant Forces-Archimedes Principle Surface Tension ( External source ) Viscosity ( External source ) Equation
Thermodynamics. Joule-Thomson effect Ideal and Real Gases. What you need: Complete Equipment Set, Manual on CD-ROM included
 Ideal Real Gases Thermodynamics 30600 What you can learn about Real gas Intrinsic energy Gay-Lussac theory Throttling Van der Waals equation Van der Waals force Inverse Inversion temperature Principle:
Thermodynamic Systems
 Thermodynamic Systems For purposes of analysis we consider two types of Thermodynamic Systems: Closed System - usually referred to as a System or a Control Mass. This type of system is separated from its
Fluid Mechanics Introduction
 Fluid Mechanics Introduction Fluid mechanics study the fluid under all conditions of rest and motion. Its approach is analytical, mathematical, and empirical (experimental and observation). Fluid can be
10.52 Mechanics of Fluids Spring 2006 Problem Set 3
 10.52 Mechanics of Fluids Spring 2006 Problem Set 3 Problem 1 Mass transfer studies involving the transport of a solute from a gas to a liquid often involve the use of a laminar jet of liquid. The situation
Examination Heat Transfer
 Examination Heat Transfer code: 4B680 date: 17 january 2006 time: 14.00-17.00 hours NOTE: There are 4 questions in total. The first one consists of independent sub-questions. If necessary, guide numbers
Water Circuit Lab. The pressure drop along a straight pipe segment can be calculated using the following set of equations:
 Water Circuit Lab When a fluid flows in a conduit, there is friction between the flowing fluid and the pipe walls. The result of this friction is a net loss of energy in the flowing fluid. The fluid pressure
An Essential Requirement in CV Based Industrial Appliances.
 Measurement of Flow P M V Subbarao Professor Mechanical Engineering Department An Essential Requirement in CV Based Industrial Appliances. Mathematics of Flow Rate The Scalar Product of two vectors, namely
ME 309 Fluid Mechanics Fall 2010 Exam 2 1A. 1B.
 Fall 010 Exam 1A. 1B. Fall 010 Exam 1C. Water is flowing through a 180º bend. The inner and outer radii of the bend are 0.75 and 1.5 m, respectively. The velocity profile is approximated as C/r where C
Convection. forced convection when the flow is caused by external means, such as by a fan, a pump, or atmospheric winds.
 Convection The convection heat transfer mode is comprised of two mechanisms. In addition to energy transfer due to random molecular motion (diffusion), energy is also transferred by the bulk, or macroscopic,
(Refer Slide Time 03:12)
") Mechanical Measurements and Metrology Prof. S. P. Venkateshan Department of Mechanical Engineering Indian Institute of Technology, Madras Module -2 Lecture - 20 Pressure Measurement So this will be lecture
Mechanical Measurements and Metrology Prof. S. P. Venkateshan Department of Mechanical Engineering Indian Institute of Technology, Madras Module -2 Lecture - 20 Pressure Measurement So this will be lecture
4 Mechanics of Fluids (I)
") 1. The x and y components of velocity for a two-dimensional flow are u = 3.0 ft/s and v = 9.0x ft/s where x is in feet. Determine the equation for the streamlines and graph representative streamlines in
1. The x and y components of velocity for a two-dimensional flow are u = 3.0 ft/s and v = 9.0x ft/s where x is in feet. Determine the equation for the streamlines and graph representative streamlines in
GENERAL PHYSICS (3) LABORATORY PHYS 203 LAB STUDENT MANUAL
 LABORATORY PHYS 203 LAB STUDENT MANUAL") Haifaa altoumah& Rabab Alfaraj By Haifaa altoumah& Rabab Alfaraj GENERAL PHYSICS (3) LABORATORY PHYS 203 LAB STUDENT MANUAL Name:-. ID# KING ABDULAZIZ UNIVERSITY PHYSICS DEPARMENT 1st semester 1430H Contents
Haifaa altoumah& Rabab Alfaraj By Haifaa altoumah& Rabab Alfaraj GENERAL PHYSICS (3) LABORATORY PHYS 203 LAB STUDENT MANUAL Name:-. ID# KING ABDULAZIZ UNIVERSITY PHYSICS DEPARMENT 1st semester 1430H Contents
TYPICAL PRESSURE MEASUREMENT UNCERTAINTY DEFINED BY AN FPG8601 FORCE BALANCED PISTON GAUGE
 TYPICAL PRESSURE MEASUREMENT UNCERTAINTY DEFINED BY AN FPG8601 FORCE BALANCED PISTON GAUGE Michael Bair and Pierre Delajoud 2002 DEC 10 Revised 2004 MAR 26 FORWARD FPG8601 is a pressure standard designed
NORTH SEA FLOW MEASUREMENT WORKSHOP 2004 In. St Andrews, Scotland
 NORTH SEA FLOW MEASUREMENT WORKSHOP 2004 In St Andrews, Scotland From the 26 th to 28 th October, 2004 Tests of the V-Cone Flow Meter at Southwest Research Institute and Utah State University in Accordance
ALASTAIR MCLACHLAN Applications Cameron
 ALASTAIR MCLACHLAN Applications Cameron Have worked in the oil and gas flow measurement industry for 27 years primarily in custody transfer measurement using ultrasonic meters. Joined Cameron Caldon Ultrasonics
Thermodynamic System. A thermodynamic system is a volume in space containing a quantity of matter that is being studied for thermodynamic analysis.
 Thermodynamic System A thermodynamic system is a volume in space containing a quantity of matter that is being studied for thermodynamic analysis. The system is bounded by an arbitrary surface called the
Fluid Mechanics. du dy
 FLUID MECHANICS Technical English - I 1 th week Fluid Mechanics FLUID STATICS FLUID DYNAMICS Fluid Statics or Hydrostatics is the study of fluids at rest. The main equation required for this is Newton's
AP Physics Electromagnetic Wrap Up
 AP Physics Electromagnetic Wrap Up Here are the glorious equations for this wonderful section. This is the equation for the magnetic force acting on a moving charged particle in a magnetic field. The angle
Laboratory work No 2: Calibration of Orifice Flow Meter
 Laboratory work No : Calibration of Orifice Flow Meter 1. Objective Calibrate the orifice flow meter and draw the graphs p = f 1 (Q) and C d = f (Re ).. Necessary equipment 1. Orifice flow meter. Measuring
Reynolds, an engineering professor in early 1880 demonstrated two different types of flow through an experiment:
 7 STEADY FLOW IN PIPES 7.1 Reynolds Number Reynolds, an engineering professor in early 1880 demonstrated two different types of flow through an experiment: Laminar flow Turbulent flow Reynolds apparatus
Chapter 14. Lecture 1 Fluid Mechanics. Dr. Armen Kocharian
 Chapter 14 Lecture 1 Fluid Mechanics Dr. Armen Kocharian States of Matter Solid Has a definite volume and shape Liquid Has a definite volume but not a definite shape Gas unconfined Has neither a definite
Objectives. Conservation of mass principle: Mass Equation The Bernoulli equation Conservation of energy principle: Energy equation
 Objectives Conservation of mass principle: Mass Equation The Bernoulli equation Conservation of energy principle: Energy equation Conservation of Mass Conservation of Mass Mass, like energy, is a conserved
9. Pumps (compressors & turbines) Partly based on Chapter 10 of the De Nevers textbook.
 Partly based on Chapter 10 of the De Nevers textbook.") Lecture Notes CHE 31 Fluid Mechanics (Fall 010) 9. Pumps (compressors & turbines) Partly based on Chapter 10 of the De Nevers textbook. Basics (pressure head, efficiency, working point, stability) Pumps
Lecture Notes CHE 31 Fluid Mechanics (Fall 010) 9. Pumps (compressors & turbines) Partly based on Chapter 10 of the De Nevers textbook. Basics (pressure head, efficiency, working point, stability) Pumps
7. Between 0 and 4 C, the volume coefficient of expansion for water: a.is positive. b.is zero. c.is becoming less dense. d.is negative.
 SERWAY QUESTIONS 1. What is the temperature of a system in thermal equilibrium with another system made up of water and steam at one atmosphere of pressure? a.0 F b.273 K c.0 K d.100 C 2. The observation
Principles of Food and Bioprocess Engineering (FS 231) Problems on Heat Transfer
 Problems on Heat Transfer") Principles of Food and Bioprocess Engineering (FS 1) Problems on Heat Transfer 1. What is the thermal conductivity of a material 8 cm thick if the temperature at one end of the product is 0 C and the temperature
Principles of Food and Bioprocess Engineering (FS 1) Problems on Heat Transfer 1. What is the thermal conductivity of a material 8 cm thick if the temperature at one end of the product is 0 C and the temperature
Chapter 3 Fluid Statics
 Chapter 3 Fluid Statics 3.1 Pressure Pressure : The ratio of normal force to area at a point. Pressure often varies from point to point. Pressure is a scalar quantity; it has magnitude only It produces
All questions are of equal value. No marks are subtracted for wrong answers.
 (1:30 PM 4:30 PM) Page 1 of 6 All questions are of equal value. No marks are subtracted for wrong answers. Record all answers on the computer score sheet provided. USE PENCIL ONLY! Black pen will look
FLUID MECHANICS D203 SAE SOLUTIONS TUTORIAL 2 APPLICATIONS OF BERNOULLI SELF ASSESSMENT EXERCISE 1
 FLUID MECHANICS D203 SAE SOLUTIONS TUTORIAL 2 APPLICATIONS OF BERNOULLI SELF ASSESSMENT EXERCISE 1 1. A pipe 100 mm bore diameter carries oil of density 900 kg/m3 at a rate of 4 kg/s. The pipe reduces
Fluid Mechanics Testbank By David Admiraal
 Fluid Mechanics Testbank By David Admiraal This testbank was created for an introductory fluid mechanics class. The primary intentions of the testbank are to help students improve their performance on
Hydraulics. B.E. (Civil), Year/Part: II/II. Tutorial solutions: Pipe flow. Tutorial 1
, Year/Part: II/II. Tutorial solutions: Pipe flow. Tutorial 1") Hydraulics B.E. (Civil), Year/Part: II/II Tutorial solutions: Pipe flow Tutorial 1 -by Dr. K.N. Dulal Laminar flow 1. A pipe 200mm in diameter and 20km long conveys oil of density 900 kg/m 3 and viscosity
Hydraulics B.E. (Civil), Year/Part: II/II Tutorial solutions: Pipe flow Tutorial 1 -by Dr. K.N. Dulal Laminar flow 1. A pipe 200mm in diameter and 20km long conveys oil of density 900 kg/m 3 and viscosity
Principles of Convection
 Principles of Convection Point Conduction & convection are similar both require the presence of a material medium. But convection requires the presence of fluid motion. Heat transfer through the: Solid
ENGG 3260: Thermodynamics. Home Assignment 1 (Chapter 1) (Answer)
 (Answer)") ENGG 360: Thermodynamics Home Assignment 1 (Chapter 1) (Answer) 1. Why does a bicyclist pick up speed on a downhill road even when he is not pedaling? Does this violate the conservation of energy principle?
ENGG 360: Thermodynamics Home Assignment 1 (Chapter 1) (Answer) 1. Why does a bicyclist pick up speed on a downhill road even when he is not pedaling? Does this violate the conservation of energy principle?
s and FE X. A. Flow measurement B. properties C. statics D. impulse, and momentum equations E. Pipe and other internal flow 7% of FE Morning Session I
 Fundamentals of Engineering (FE) Exam General Section Steven Burian Civil & Environmental Engineering October 26, 2010 s and FE X. A. Flow measurement B. properties C. statics D. impulse, and momentum
First Name: Last Name: Section: 1 December 20, 2004 Physics 201 FINAL EXAM
 First Name: Last Name: Section: 1 December 20, 2004 Physics 201 FINAL EXAM Print your name and section clearly on all nine pages. (If you do not know your section number, write your TA s name.) Show all
Steven Burian Civil & Environmental Engineering September 25, 2013
 Fundamentals of Engineering (FE) Exam Mechanics Steven Burian Civil & Environmental Engineering September 25, 2013 s and FE Morning ( Mechanics) A. Flow measurement 7% of FE Morning B. properties Session
Hydrostatics. ENGR 5961 Fluid Mechanics I: Dr. Y.S. Muzychka
 1 Hydrostatics 2 Introduction In Fluid Mechanics hydrostatics considers fluids at rest: typically fluid pressure on stationary bodies and surfaces, pressure measurements, buoyancy and flotation, and fluid
Compressible Gas Flow
 Compressible Gas Flow by Elizabeth Adolph Submitted to Dr. C. Grant Willson CHE53M Department of Chemical Engineering The University of Texas at Austin Fall 008 Compressible Gas Flow Abstract In this lab,
Formulae that you may or may not find useful. E v = V. dy dx = v u. y cp y = I xc/a y. Volume of an entire sphere = 4πr3 = πd3
 CE30 Test 1 Solution Key Date: 26 Sept. 2017 COVER PAGE Write your name on each sheet of paper that you hand in. Read all questions very carefully. If the problem statement is not clear, you should ask
Chapter 4 DYNAMICS OF FLUID FLOW
 Faculty Of Engineering at Shobra nd Year Civil - 016 Chapter 4 DYNAMICS OF FLUID FLOW 4-1 Types of Energy 4- Euler s Equation 4-3 Bernoulli s Equation 4-4 Total Energy Line (TEL) and Hydraulic Grade Line
Guidelines for the Selection and Operation of Provers with Micro Motion ELITE Coriolis Flow Meters
 Guidelines for the Selection and Operation of Provers with Micro Motion ELITE Coriolis Flow Meters Micro Motion ELITE flow meters are highprecision Coriolis flow meters that are often used in the oil and
Particle resuspension
 86 Chapter 6 Particle resuspension 6.1 Motivation In previous chapters, the relative effective viscosity of a flow with particles denser than the interstitial liquid was discussed. Such results show that
Universität Duisburg-Essen Fakultät für Ingenieurwissenschaften WS 2012 Maschinenbau, IVG, Thermodynamik Dr. M. A. Siddiqi
 1 Universität Duisburg-Essen 3. Semester Fakultät für Ingenieurwissenschaften WS 2012 Maschinenbau, IVG, Thermodynamik Dr. M. A. Siddiqi THERMODYNAMICS LAB (ISE) Pressure Measurement 2 2 Pressure Measurement
Heat Exchangers for Condensation and Evaporation Applications Operating in a Low Pressure Atmosphere
 Acta Polytechnica Vol. 52 No. 3/202 Heat Exchangers for Condensation and Evaporation Applications Operating in a Low Pressure Atmosphere Petr Kracík,JiříPospíšil, Ladislav Šnajdárek Brno University of
ME 305 Fluid Mechanics I. Part 8 Viscous Flow in Pipes and Ducts. Flow in Pipes and Ducts. Flow in Pipes and Ducts (cont d)
") ME 305 Fluid Mechanics I Flow in Pipes and Ducts Flow in closed conduits (circular pipes and non-circular ducts) are very common. Part 8 Viscous Flow in Pipes and Ducts These presentations are prepared
ME 305 Fluid Mechanics I Flow in Pipes and Ducts Flow in closed conduits (circular pipes and non-circular ducts) are very common. Part 8 Viscous Flow in Pipes and Ducts These presentations are prepared
ELECTRONIC SENSORS PREAMBLE. This note gives a brief introduction to sensors. The focus is. on sensor mechanisms. It describes in general terms how
 ELECTRONIC SENSORS PREAMBLE This note gives a brief introduction to sensors. The focus is on sensor mechanisms. It describes in general terms how sensors work. It covers strain gage sensors in detail.