Shallow rupture of the 2011 Tarlay earthquake (M w 6.8), Eastern Myanmar.
|
|
|
- Bonnie Carr
- 6 years ago
- Views:
Transcription
1 Chapter Shallow rupture of the 2011 Tarlay earthquake (M w 6.8), Eastern Myanmar. Yu Wang 1, 2, Yu-Nung Nina Lin 1, Mark Simons 3, Soe Thura Tun 4 1. Division of Geological and Planetary Sciences, California Institute of Technology, Pasadena, USA 2. Earth Observatory of Singapore, Nanyang Technological University, Singapore 3. Seismological Laboratory, Division of Geological and Planetary Sciences, California Institute of Technology, Pasadena, USA 4. Myanmar Earthquake Committee, Myanmar Engineering Society, Myanmar Submitted to Bulletin of the Seismological Society of America Abstract We use L-band ALOS PALSAR data to infer the distribution of subsurface fault slip during the Tarlay earthquake (M w = 6.8) in eastern Myanmar. We find that the total length of surface rupture is approximately 30 km, with nearly 2 m maximum surface offset along the westernmost section of the Nam Ma fault (the Tarlay segment). Finite fault inversions constrained by InSAR and pixel-tracking data suggest that fault slip is concentrated within the upper 10 km of the crust. Maximum slip exceeds 4 m at a depth between 3 and 5 km. Comparison between field measurements and near-fault deformation obtained from InSAR range-offset result suggests about 10-80% of displacement occurred within a 1-km-wide zone off the main surface fault trace. This off-fault deformation may explain the shallow slip deficit that we observed during this earthquake. We estimate a recurrence interval for Tarlay-like events to be 1600 to 6500 years at this section of the Nam Ma fault. Detailed paleoseismological study is essential to clarify the slip behavior and the earthquake recurrence interval of the Nam Ma fault.
2 Introduction 262 While major tectonic faults in the Indochinese peninsula have been mapped (e.g. Le Dain et al., 1984; Lacassin et al., 1998), we have little understanding of their rupture characteristics including their average rupture recurrence intervals, the depth of the seismogenic zone and the spatial and temporal variation in seismic and aseismic slip behavior. Several M ~ 7 earthquakes occurred in the central part of Indochina during the late 20th century (e.g., the M w 7.0 Lancang-Gengma earthquakes in 1988 and the M w 6.8 Myanmar-China earthquake in 1995), but the distribution of fault slip in these events was not well constrained by data. Thus, the March 24, 2011 M w 6.8 Tarlay earthquake (also known as the Mong Hpayak earthquake) provides a unique opportunity to infer faulting behavior in the golden triangle area between Myanmar and Laos. The Tarlay earthquake occurred at the westernmost section of the Nam Ma fault (Fig. 1) with a coseismic surface rupture extending more than 17-km along the previously mapped Nam Ma fault trace (Soe Thura Tun et al., in preparation). Associated surface rupture was partially mapped in the field by the Myanmar Earthquake Committee about two weeks after the mainshock. However, because of limited road access in the field and diffuse surface deformation in several regions, the extent of fault offset was only measured at limited locations. Thus, satellite-based interferometric synthetic aperture radar (InSAR) imagery provides key observations revealing the pattern of coseismic ground deformation and surface displacements across the ruptured section of the Nam Ma fault. We exploit the InSAR data to constrain a finite fault source model, which in turn helps further our understanding of faulting behavior in the golden triangle region. We use both InSAR and pixel-tracking techniques to estimate different components of ground deformations associated with the Tarlay earthquake. We compare these ground deformations to the fault offset measurements from a post-earthquake survey. We then invert for the distribution of fault slip on a model of the Nam Ma fault plane, and use this model to explore the behavior of shallow
3 263 fault slip during the Tarlay earthquake. We conclude by estimating possible earthquake recurrence scenarios of the Nam Ma fault system, assuming the earthquake represents the characteristic event along the Nam Ma fault. The Nam Ma Fault and the 2011 Tarlay Earthquake The Nam Ma fault forms part of a major left-lateral fault system in the northern Sunda Block between Myanmar and Laos (Fig. 1). Although its fault trace lies in the golden triangle area where field investigation has been nearly impossible due to logistical concerns, this 215-km-long structure has been mapped from the interpretation of satellite imagery and 90-m SRTM digital elevation model (DEM) (e.g., Lacassin et al., 1998). In the central portion of the Nam Ma fault, the Mekong River forms a hairpin loop where the river flows across the fault trace (Fig. 1) (Lacassin et al., 1998). This geomorphic feature suggests the Nam Ma fault was once a right-lateral fault before slip-reversal of the Red River fault, and was subsequently reactivated as a left-lateral fault with an estimated average slip rate of mm/yr (Lacassin et al., 1998). Along the western end of the Nam Ma fault in remote eastern Myanmar, the fault trace exhibits classical horsetail geometry, suggesting that this fault system transitions from a single fault zone into a diffuse zone with several sub-parallel fault segments. The Tarlay segment is one of these fault segments at the western end of the Nam Ma fault. This segment runs N70 E east of the Tarlay Township, transecting the hilly area west of the Mekong River (Fig.1 & 2). To the west, our interpretation from the 90-m SRTM DEM suggests that the Tarlay segment terminates at a small tectonic basin within the mountains (marked by Q in Fig. 2). To the east, a triangle-shaped transtensional basin appears where the trace of the Tarlay segment propagates straightly into the basin (Fig. 2). Active tectonic features gradually disappear along the Tarlay segment within this transtensional basin, while a series of triangular facets and offset alluvial fans reappear along the main Nam Ma fault trace that bounds the northern margin of the basin. These observations imply
4 264 the presence of a left step-over between the Tarlay segment and the main trace of the Nam Ma fault, where transfer of slip northwards creates a releasing bend along the northern part of the basin. The inferred epicenter of the March 24, 2011 Tarlay earthquake (M w 6.8) from NEIC catalog falls very close to the western end of the Tarlay segment (Fig. 1). Most fault plane solutions suggest this earthquake occurred on a nearly vertical fault with purely left-lateral slip (see Data and Resources Section). These solutions match our general concept of the slip sense and orientation of the Nam Ma fault. Epicenters of aftershocks from NEIC catalog from March to April 2011 also encircle the Tarlay segment (Fig. 1). Post-earthquake field investigation revealed coseismic left-lateral offsets in the central part of the segment. In the transtensional basin at the eastern end, the rupture pattern becomes more complicated, suggesting near-surface distributed deformation (Soe Thura Tun et al., in preparation). We use ALOS L-band PALSAR satellite imagery to derive a more complete view of surface rupture and to estimate the distribution of fault slip at depth. InSAR data From 2007 until 2011, the Japanese ALOS PALSAR L-band sensor acquired radar imagery permitting measurement of co-seismic ground deformation in regions where dense vegetation usually causes decorrelation in shorter wavelength InSAR imagery (e.g., C- and X-band). For the Tarlay earthquake, ALOS acquired pre- and post-earthquake SAR images along ascending track 126 and descending track 486 that cover the westernmost section of the Nam Ma fault (Tarlay segment; Fig. 1). The pre- and post-quake data are about 2 months apart (Table 1). This relatively small interval of time helps to minimize the effects of temporal decorrelation. We use the repeat orbit interferometry processing package ROI_PAC (Rosen et al., 2004). Both ascending and descending images suffer from decorrelation near the trace of the Nam Ma fault; nevertheless, they still show clear ground deformation around the Tarlay segment (Fig. 3a
5 265 and 3b). Both interferograms show simple concentric fringes around the fault without any complicated bifurcations. The pattern suggests a relatively simple geometry for faulting at the surface. The termination pattern around the western and eastern end of the fault looks somewhat different. To the west, fringes merge into the tip of the fault trace, implying that the fault earthquake rupture extends to the western end of the Tarlay segment, about 9 km west of the westernmost field surveyed point (Fig. 2; Fig. 3a and 3b). To the east, fringes bend into the fault trace at an angle, suggesting that co-seismic slip gradually decreases toward the eastern fault termination. A large area of decorrelation in the descending track coincides with the location of the transtensional basin. We believe this area of decorrelation suggests a plausible distributed deformation zone, or that strong secondary ground deformation (e.g., liquefaction and slope failure along the river bank) took place inside the basin (Fig. 3a). We also applied pixel-tracking analysis on the SAR amplitude data for descending track 126 to further constrain near-field deformation and to provide an additional component of deformation. Pixel-tracking technique produces deformation images with higher level of noise, and therefore multi-looking (spatial averaging) is usually necessary to improve the signal-to-noise ratio. We caution that some deformation features, in particular the sharp discontinuity across the fault trace, may be lost during this process. Figure 3c shows the azimuth component (AZO) of the pixel-offsets estimates. Although data from pixel-tracking is noisier than InSAR where fringes are visible, they allow deformation estimates in the near-field where the interferograms completely decorrelate. From the western to the central part of the segment, the near-field data shows a sharp deformation pattern across the fault. To the east, the boundary between opposite-moving displacements neither follows our pre-mapped Tarlay segment (Fig. 3c), nor does it match the field observation result. This mismatch again suggests either secondary ground deformation effects (e.g., liquefaction) took place inside the basin or the fault slip during the earthquake did not form a localized rupture trace near the
6 266 surface. We also note that we did not find any evidence of surface rupture along the northern boundary of this transtensional basin, suggesting that surface rupture did not extend beyond the Tarlay segment. We carried out the same pixel-tracking analysis on scenes from ascending track 486. Since its line-of-sight direction (LOS) is almost parallel to the direction of the surface rupture, and given that this event is almost purely strike-slip, the signal in the azimuth direction is small compared to the noise level. Therefore we do not to include this set of AZO observations in our model, but instead used the range offset result (RAO) for validation. Range offsets and interferometric measurements measure the same line-of-sight component of the deformation field, so the information they provide is redundant (Fig. 3b & 4). However, range offsets are less influenced by decorrelation, they can sometimes better resolve displacements near the fault, and they do not need to be phase unwrapped. Using these data we estimate near-fault deformation within a ±500-m window across the fault (Fig. 4). We compare these near-fault observations with both the predictions of shallow fault slip in our inferred model and the fault offset data from the field survey. The slip distribution of Tarlay earthquake Using both the ascending and descending InSAR data, plus the AZO observations from the descending track, we estimate the distribution of subsurface fault-slip on the Tarlay segment. In order to improve model efficiency, we adopt a spatially variable data resampling/averaging approach based on the estimation of the inherent data resolution for a given source model (Lohman and Simons, 2005). This approach reduces the total number of data points to less than 1000, while preserving the essential information contained in the original data (Fig. 5). Our fault model has a general strike of N70 E, similar to the strike of the observed surface rupture and the pre-mapped Tarlay segment from SRTM data (Fig. 2). Since no well-located
7 267 aftershock data is available in this area, we adopt the dip angle of 86 SE from the Global Centroid Moment Tensor (GCMT) solution, which agrees with the field observation of the southern side of the Tarlay segment as the down-thrown side (Soe Thura Tun et al., in preparation). We discretized the fault plane into 1 km x 0.6 km rectangles from the surface to 12 km depth. We use elastic Greens functions based on a homogeneous elastic half space model with a Poisson s ratio of We regularize the solution using a Laplacian damping term, and further control the solutions by minimizing total potency of the inferred model. The degree of smoothing and potency constraint is chosen through an L-curve (Fig. 6). We computed an ensemble of models with different combinations of regularization weighting parameters ( 1 for smoothing and 2 for potency constraint), and plot the values of reduced chi-square ( 2 re ) as a function of 1 and 2. We use two criteria to choose our best model: (1) the intersection between the knees of the 2 re plane along the 1 and the 2 directions, and (2) the proximity of reduced chi-square to unity, where model errors equal to observation errors. We also tested the necessity of the total potency constraint, and found that if we remove the total potency constraint, slip tapers toward the lower left corner of the fault plane (Fig. 6e). If we allow the fault to extend deeper, this tapering pattern goes all the way down to whatever maximum depth of the given fault model. This tapering pattern is thus the result of overfitting long wavelength noise in our dataset, and therefore we consider the slip potency constraint as a necessary regularization term to minimize this artifact. Our selected model (Fig. 6b) fits the data well in general, although some systematic pattern appears in the residuals (Fig. 5). We then carried out a grid search to obtain the optimized dip angle, in order to figure out if the systematic pattern results from this specific issue. However, the improvement of goodness of fit is marginal between our current dip angle (86 SE) and the best solution (87 SE), with only 0.2% decrease in the RMS residual. The systematic pattern does not
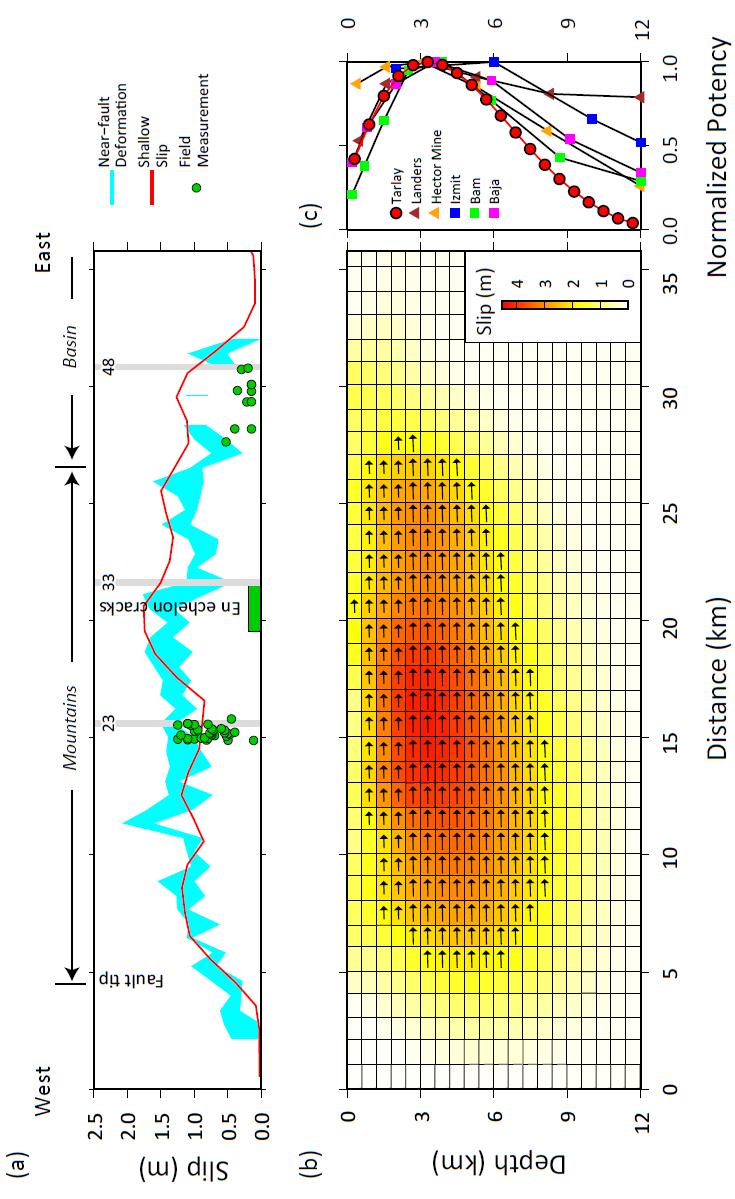
8 268 vanish in all the 21 planar fault models that we tested (from 80 SE to 90 at 0.5 increment). It is hence likely that the fault plane is curved instead of purely planar, or that some secondary fault in the flower structure of the Tarlay segment has been active during this event, although there is no sign on the surface of such a structure. Our preferred coseismic model (Fig. 7) is almost purely left-lateral with a minimal dip slip component. This result matches field observations, in which most surface ruptures also appear to be purely left-lateral (Soe Thura Tun et. al., in preparation). The inferred slip occurs within the upper 10 km of the crust, where the major slip patch concentrates between depths of 2.5 and 6 km, with a maximum slip of nearly 4.5 m at the central part of this depth range. The region of high slip is centered close to the western part of the fault plane, with its slip decreasing faster to the west than to the east. Toward the eastern and western end of the rupture, our preferred model shows different slip behavior near the termination of the fault. To the east, the slip patch extends smoothly upward, forming a narrower and shallower rupture patch beneath the basin, and gradually diminishes at shallow depths (< 3 km in depth). In contrast, at the western end of the fault, the depth distribution of fault slip retains a similar width toward its western termination. The model also suggests that fault slip decreases rapidly at the western end of the Tarlay segment, from 3 m to less than 1 m beneath the western termination of the pre-mapped surface fault trace (Fig. 7). Both our preferred model and the measurement from range-offset data suggest the rupture broke the surface along the entire Tarlay segment. The amount of slip near the surface is small compared to the maximum fault slip at 2.5 to 6 km in depth. Thus, our model suggests a significant reduction in slip within the topmost 2 km of crust, where co-seismic slip decreases from 4 m at 3 km deep to about 1 m near the surface (Fig. 7). Near the central part of the fault, offsets measured in the field and modeled shallow slip are
9 269 roughly consistent with each other. Further east, the agreement between the shallow slip and the field measurements is not as close (Fig. 7b). This section is also where pixel offset data are too noisy for us to obtain measurable near-fault deformation. The modeled shallow slip shows larger amplitude of surface slip than measured in the field. We attribute this difference to the finite size of our topmost fault patches and mapping of any diffuse deformation (off-fault deformation) onto the single fault plane. Using the reference value of the shear modulus of the Earth s crust (30-33 GPa), we infer a geodetic moment on the order of x 1019 Nm, corresponding to M w 6.8, in agreement with the NEIC moment magnitude estimated from the global seismic network. Effects of postseismic deformation may be included in our model, but we expect the influence to be small due to the short time interval (less than 10 days) between the earthquake and the post-earthquake SAR images. Discussion Characteristics of the surface rupture Pixel-tracking and InSAR observations indicate that the entire length of the Tarlay segment ruptured during the March 2011 earthquake, as also hypothesized from field investigations (Soe Thura Tun et al., in preparation). Both slip on the uppermost row of slip patches in our preferred model and the near-fault deformation measured from range offsets suggest a broad bell-shaped pattern of surface rupture with a peak value of 1.5 to 2 m (Fig. 7). We find that near-fault deformation does not always occur within a narrow zone of the surface rupture (Fig. 4). In some places, there is a clear sigmoidal pattern as one traverse the fault, the width of which varies along strike. We select three profiles to compare on-fault and off-fault deformation. We assume that field measurements represent actual on-fault displacement and the pixel offsets capture the total near fault deformation.
10 270 Profile 23 demonstrates an end member where most of the deformation concentrates along the fault surface rupture (Fig. 4c). The sharp sigmoidal pattern over a short distance in the profile suggests that most of the ground deformation occurred on the fault. Nevertheless, we still find about cm more displacement from the pixel offsets than from the field measurements, suggesting a plausible 10 to 20% of deformation occurred over distances of ~800 m across the rupture. Since this cm difference is very close to the measurement precision of the pixel tracking analysis, the real off-fault deformation could be even less. In fact, the field survey found a narrow rupture zone only along this section (Soe Thura Tun et al., in preparation). Toward the east, profile 33 shows a different type of deformation near the main fault trace (Fig. 4d). This profile reveals a more gentle sigmoidal deformation pattern compared to profile 23, but the overall near-fault deformation remains large (approximately 1.1 m). Such gentle deformation curve suggests that either rupture failed to reach the surface, or that slip is distributed over a wide damage zone composed of multiple small fault planes. Field observation reports a series of aligned en echelon cracks on the ground along this section of the fault, suggesting that deformation on the main fault trace is no more than cm near the surface (Soe Thura Tun et al., in preparation). Field investigation also found several plausible fissures within a range of several hundreds of meters away from the fault near this profile. The lateral extensions of these plausible fissures were difficult to trace. Based on these geologic observations, we argue distributed slip can explain the gentle deformation pattern. However, it is difficult to tell whether these deformations mainly occurred along different secondary faults in the damage zone, or formed as dragging and warping in the country rocks around the main fault. Further east, profile 48 is located within the transtensional basin (Fig. 4e). This profile again shows a gentle sigmoidal deformation pattern across the fault similar to profile 33. Field observations report offset rice paddy field boundaries within the disrupted fields, where the maximum offset is 20 to 30 cm, compared to the cm of near-fault deformation. Thus, we
11 271 suggest that tectonic deformation off the main fault along profile 48 is up to 30 cm within the 1-km zone across the fault, accounting for ~50% of the total displacement. Field measurements within the basin area are consistently lower than near-fault deformation from the pixel-tracking result (Fig. 7b), indicating possibly extensive off-fault deformation in the basin. Off-fault deformation may be attributed to the lower brittle strength of the saturated fluvial sediments that fill the basin. By comparison, off-fault deformation is less significant near the central part of the fault in general, where the fault trace transects a granitic batholith with only a thin alluvial layer mantled on top. This difference suggests that lithology, or the condition of the country rocks, may be a key factor controlling the fraction of off-fault deformation during an earthquake. Shallow slip deficit The apparent deficit of shallow slip in our preferred slip model is similar to that seen in many other magnitude ~7 strike slip fault events (e.g., Simons et al., 2002; Fialko et al., 2005; Fialko et al., 2010; Sudhaus et al., 2011). Figure 7c illustrates the comparison of normalized slip potency as a function of depth between the Tarlay event and other studied earthquakes (e.g., Simons et al., 2002; Fialko et al., 2005; Kaneko and Fialko, 2011). We find the shallow slip deficit of the Tarlay earthquake resembles that of the 1992 Landers earthquake and the 2010 El Mayor-Cucapah earthquake. Among these three events, the shallow slip deficit is up to 50-60%, and the potency gradients in the top 2 to 3 km layer are identical. Although the cause of such shallow slip deficit has not been conclusively identified, simulations reveal several possible sources for this phenomenon. Kaneko and Fialko (2011) suggest part of this deficit results from inelastic deformation near the earth surface, especially when the country rock s cohesion is low. Such inelastic slip can further enhance the inference of a slip deficit when we try to fit the inelastic ground deformation via the purely elastic model (e.g., Simons
12 et al., 2002; Barbot et al., 2008; Kaneko and Fialko, 2011). 272 In the case of the Tarlay earthquake, we see plausible off-fault sympathetic deformation ranging from 10% to up to 80% of the total near-fault deformation at different locations (Fig. 4c to 4e). It seems reasonable to attribute the cause of the shallow slip deficit to inelastic off-fault deformations along the fault. However, while we are seeing a large degree of variation in the deformation off the main fault, we do not find an obvious relationship with the inferred shallow slip deficit at any given location. This discordance may result from errors both in the observations and in the models, or that the variation in off-fault deformations is only superficial, or that off-fault deformation and the shallow slip deficit achieve the balance only in the context of multiple earthquake cycles rather than a single event. Despite this ambiguity, we emphasize the importance of recognizing along-strike variations of both aforementioned behaviors and the comparison with geological observations, which in turn may allow us to unravel the enigma of shallow slip deficit in the future. Inferred recurrence interval on the Tarlay segment The difference between the maximum fault slip at depth and the maximum fault offset on the surface makes a significant difference when we estimate the average recurrence interval of earthquake from the coseismic fault offset data. If the fault slip during the Tarlay earthquake represents the characteristic slip pattern of the Tarlay segment, we can roughly estimate its recurrence interval by dividing its maximum fault slip with its average long-term slip rate. Lacassin (1998) suggested the slip-rate of the Nam Ma fault be mm/yr, based on the channel offset of the Mekong River and the regional tectonic history. Therefore, if the 4 m fault slip at depth represents the characteristic slip on the Tarlay segment, the average recurrence interval of a Tarlay-earthquake-like event is about 1600 to 6500 yr along this segment. Such frequency is three times lower than the estimation from the maximum surface offset (1.25 m), where the interval falls
13 273 to the range of yrs (Soe Thura Tun et al., in preparation). The large variation in these first-order estimates of recurrence interval underscores the need for paleoseismological studies. As many strike slip faults produce sequential and clustered events within a short period of time (e.g., North Anatolian Fault; Stein et al., 1997; Sagaing fault; Yeats et al., 1997), we cannot at present conclusively estimate seismic hazard along the Nam Ma fault, Conclusions We have successfully conducted the InSAR and pixel-tracking analyses from ALOS L-band PLSAR dataset. The deformation pattern suggests a simple linear fault plane, with the eastern end submerged into the transtentional basin. Our slip inversion model suggests the entire 30-km long Tarlay segment ruptured during the 2011 earthquake. The rupture has a narrow and concentrated region of slip in the shallow part of the crust (< 10 km), with the peak slip at 2.5 to 6 km. Fault slip in the topmost 600-m layer reveals a broad bell-shape slip pattern and generally agrees with field observations and near-fault deformation measured from the pixel-tracking data. By comparing the field survey result and the near-fault deformation, we find 10% to 80% of the ground deformation occurred outside the main surface rupture. Such off-fault deformation is likely to be inelastic, and may be the cause of shallow-slip deficit that we observed in our slip model. Given the average slip rate of mm/yr on Nam Ma fault, we estimate the recurrence interval at the Tarlay segment to be 1600 to 6500 yr. This estimate is three folds greater than the estimate from the maximum surface offset. Detailed paleoseismological study at the Nam Ma fault is essential to clarify the regional seismic hazard potential in the golden triangle area.
14 Data and Resources 274 Epicenters of the mainshock and aftershocks were collected from the USGS/NEIC PDF catalog (last accessed on Dec-2011). GCMT solutions of aftershocks were collected from Global Centroid Moment Tensor (GCMT) Project database: (last accessed on Dec-2011). The CMT solution of mainshock was obtained from the USGS Significant Earthquake Archive: (last accessed on Mar-2012). ALOS data is copyright Japanese Aerospace Exploration Agency and METI and provided through the US Government Research Consortium Data Pool at the Alaska Satellite Facility. Acknowledgement We have benefited greatly from discussions with Kerry Sieh and Paul Tapponnier. The comments from reviewers Roland Bürgmann and the other anonymous reviewer greatly helped us to improve the quality of the manuscript. This research is supported by the NASA grant NNX12AO30G and by the Earth Observatory of Singapore (EOS). References Bender, F., Geology of Burma, Gebrüder Borntraeger, 293 pp. Barbot S., Y. Fialko, D. Sandwell, (2008). Effect of a compliant fault zone on the inferred earthquake slip distribution, J. Geophys. Res., 113, B06404, 2008, doi: /2007jb Fialko, Y., D. Sandwell, M. Simons, and P. Rosen (2005). Three-dimensional deformation caused by the Bam, Iran, earthquake and the origin of shallow slip deficit, Nature doi: /nature Fialko, Y., A. Gonzalez, J. Gonzalez, S. Barbot, S. Leprince, D. Sandwell and D. Agnew (2010). Static rupture model of the 2010 M7.2 El Mayor-Cucapah earthquake from ALOS, ENVISAT, SPOT and GPS data, EOS, Trans. Am. geophys. Un. 91(52) T53B Kaneko, Y., and Y. Fialko (2011). Shallow slip deficit due to large strike slip earthquakes in
15 dynamic rupture simulations with elasto-plastic off fault response, Geophys. J. Int Lacassin, R., A. Replumaz, and P. H. Leloup (1998). Hairpin river loop and slip sense inversion on SE-Asian strike-slip faults, Geology Le Dain, A. Y., P. Tapponnier, and P. Molnar (1984). Active faulting and tectonics of Burma and surrounding regions, J. Geophys. Res. 89(B1) , doi: /jb089ib01p Lohman, R. B., and M. Simons (2005). Some thoughts on the use of InSAR data to constrain models of surface deformation: Noise structure and data downsampling, Geochem. Geophys. Geosyst. 6 Q01007, doi: /2004gc Rosen, P. A., S. Hensley, G. Peltzer, and M. Simons (2004), Updated repeat orbit interferometry package released, Eos Trans. AGU 85(5) 47 doi: /2004eo Simons M., Y. Fialko, and L. Rivera (2002). Coseismic Deformation from the 1999 M w 7.1 Hector Mine, California, Earthquake as Inferred from InSAR and GPS Observations, Bull. Seismol. Soc. Am Soe Thura Tun, Saw Ngwe Khaing, Y. Wang, Myo Thant, Nyunt Htay, Yin Myo Min Htwe, Than Myint and K. Sieh (2013). Surface Ruptures of the 2011 Tarlay Earthquake and Their Relationship to the Active Tectonics of Eastern Myanmar, in preparation. Stein, R. S., A. A. Barka, and J. H. Dieterich (1997). Progressive failure on the northern Anatolian fault since 1939 by earthquake stress triggering, Geophys. J. Int Sudhaus, H. amd S. Jónsson (2011). Source model for the 1997 Zirkuh earthquake (M w = 7.2) in Iran derived from JERS and ERS InSAR observations, Geophys. J. Int , doi: /j x x. Yeats, R. S., K. Sieh, and C. R. Allen, (1997). The geology of earthquakes, New York, Oxford Univ. Press. 576 pp. 275

16 Figure 1. The March 24, 2011 Tarlay earthquake (Mw 6.8) occurred along the western edge of the Nam Ma fault system, located near the Myanmar-Laos boarder. CMT solutions are for the mainshock and major aftershocks. Other aftershocks of smaller magnitudes are indicated by yellow circles. Black boxes outline the footprint of the ALOS L-band SAR data used in this study, with the line-of-site (LOS) vectors in yellow arrows. Red lines are the active (solid) and suspect active (dashed) strike-slip faults mapped from the 90-meter SRTM shaded relief imagery with the assistance from the published geological map (e.g. Bender, 1983). Black lines are the bedrock faults that do not show associated active geomorphic features from the digital elevation model. The small blue rectangle at the center of this map shows the location of Tarlay Township, which is the major city along the western Nam Ma fault. Country borders are shown in gray lines. 276
, with its western termination close to the Paleozoic sedimentary rocks (Pz; Bender, 1983).")
17 Figure 2. Detailed mapping of the Tarlay segment at the western most section of the Nam Ma fault, based on the 90-meter SRTM and 15-meter Landsat imagery. Most of the fault trace transects through the granitic formation (gr), with its western termination close to the Paleozoic sedimentary rocks (Pz; Bender, 1983). The white dots are the locations of surface rupture that Myanmar geologists found in the field (Soe Thura Tun, in preparation). In general, the surface rupture locations match the fault trace that we mapped from remote sensing datasets. The black rectangle indicates the southward dipping fault plane that we used in the dislocation model. Its surface trace is referenced to the field investigation results and our mappings. 277
, while the other two InSAR results are the deformation along their line-of-sight directions (LOS, Fig. 1).")
18 Figure 3. ALOS L-band InSAR (a and b) and pixel-tracking analysis results (c). The offset map of P126-AZO shows the ground deformations along the azimuth direction (AZO), while the other two InSAR results are the deformation along their line-of-sight directions (LOS, Fig. 1). The bold black-line shows the trace of Tarlay segment mapped from SRTM and LANDSAT imagery. Other thin black lines are the regional faults that did not rupture during this earthquake. 278
 to improve the signal-to-noise ratio. The resolution for both the RAO data and the modeled results are 90 m.")
19 Figure 4. The range offset (RAO) for descending track 486 (a) and the prediction from our preferred finite fault model (b). The RAO data have been processed with multi-looking (spatial averaging) to improve the signal-to-noise ratio. The resolution for both the RAO data and the modeled results are 90 m. The deformation component of the RAO data is almost parallel to the strike of the fault, so here the RAO results are directly compared with the field measurements. (c) Ground deformation along profile 23 (blue dots) and the modeled deformation (red line). The width of the brown area indicates the amount of offset during field measurements at the same location, whereas the width of the purple region indicates the maximum near-fault displacement reading from the RAO data. (d) Ground deformation along profile 33, showing more distributed deformation across the fault. (e) Ground deformation along profile

20 Figure 5. We resample all three ground deformation fields before invert for the fault slip distribution. Generally, the modeled deformation fields match the InSAR and pixel-tracking data with a single planar fault. The residuals show some systematic pattern, which do not vanish even with the optimized dip angle (87 SE). This pattern suggests that the fault plane may be curved rather than purely planar, or that some secondary structure in the flower structure of the Tarlay segment has been active during the earthquake, although there is no sign of such a structure on the surface. 280
 The reduced chi-square ( ) plot as a function of")
 and 2 (for total potency")

21 281 Figure 6. (a) The reduced chi-square ( ) plot as a function of the regularization weighting parameters, 1 (for model smoothness constraint) and 2 (for total potency constraint). (b)-(e) Different realizations of models. The best model is chosen based on the L-curve knees and on the proximity of 2 re values to unity. 2 re
22 282
23 283 Figure 7. (a) Comparison between field measurements (green dots), the upper 600 m fault slip (red line), and the near-fault deformation measured from the AZO pixel tracking analysis (Cyan band; Fig. 4) along the Tarlay segment. This figure shows generally good match between the model result, the near-fault displacement and the field investigation result at the central part of the fault. To the east in the basin area, both the field measurements and the near-fault displacement are systematically smaller than the modeled shallow slip. (b) The distribution of fault-slip along the Tarlay segment. The maximum fault slip in our model is slightly larger than 4 m at km depth, Most of the slip occurred shallower than 10-km at depth. (c) The comparison of the normalized slip potency from our preferred model (red dots) and other earthquake events (from Kaneko and Fialko, 2011). Slip potency of the Tarlay earthquake shows a depth dependence profile very similar to the Landers earthquake and the El Mayor-Cucapah earthquake: all three events reach their maximum slip potency at about 3 km at depth, and their potency gradients at shallow depth are also identical.
24 284 Table 1. ALOS PALSAR data used in this study. Path Frame Pre-quake Post-quake Scene ID date date Scene ID Ascending /02/16 ALPSRP /04/03 ALPSRP track /02/16 ALPSRP /04/03 ALPSRP Descending /02/14 ALPSRP /04/01 ALPSRP track /02/14 ALPSRP /04/01 ALPSRP
to: Interseismic strain accumulation and the earthquake potential on the southern San
 Supplementary material to: Interseismic strain accumulation and the earthquake potential on the southern San Andreas fault system by Yuri Fialko Methods The San Bernardino-Coachella Valley segment of the
27th Seismic Research Review: Ground-Based Nuclear Explosion Monitoring Technologies
 GROUND TRUTH LOCATIONS USING SYNERGY BETWEEN REMOTE SENSING AND SEISMIC METHODS-APPLICATION TO CHINESE AND NORTH AFRICAN EARTHQUAKES C. K. Saikia 1, H. K. Thio 2, D. V. Helmberger 2, G. Ichinose 1, and
The March 11, 2011, Tohoku-oki earthquake (Japan): surface displacement and source modelling
: surface displacement and source modelling") The March 11, 2011, Tohoku-oki earthquake (Japan): surface displacement and source modelling Salvatore Stramondo Bignami C., Borgstrom S., Chini M., Guglielmino F., Melini D., Puglisi G., Siniscalchi V.,
The March 11, 2011, Tohoku-oki earthquake (Japan): surface displacement and source modelling Salvatore Stramondo Bignami C., Borgstrom S., Chini M., Guglielmino F., Melini D., Puglisi G., Siniscalchi V.,
Geodesy (InSAR, GPS, Gravity) and Big Earthquakes
 and Big Earthquakes") Geodesy (InSAR, GPS, Gravity) and Big Earthquakes Mathew Pritchard Teh-Ru A. Song Yuri Fialko Luis Rivera Mark Simons UJNR Earthquake Research Panel, Morioka, Japan - Nov 6, 2002 Goals Accurate and high
Geodesy (InSAR, GPS, Gravity) and Big Earthquakes Mathew Pritchard Teh-Ru A. Song Yuri Fialko Luis Rivera Mark Simons UJNR Earthquake Research Panel, Morioka, Japan - Nov 6, 2002 Goals Accurate and high
27th Seismic Research Review: Ground-Based Nuclear Explosion Monitoring Technologies
 GROUND TRUTH OF AFRICAN AND EASTERN MEDITERRANEAN SHALLOW SEISMICITY USING SAR INTERFEROMETRY AND GIBBS SAMPLING INVERSION Benjamin A. Brooks 1, Francisco Gomez 2, Eric A. Sandvol 2, and Neil Frazer 1
Earthquakes and Faulting
 Earthquakes and Faulting Crustal Strength Profile Quakes happen in the strong, brittle layers Great San Francisco Earthquake April 18, 1906, 5:12 AM Quake lasted about 60 seconds San Francisco was devastated
Today: Basic regional framework. Western U.S. setting Eastern California Shear Zone (ECSZ) 1992 Landers EQ 1999 Hector Mine EQ Fault structure
 1992 Landers EQ 1999 Hector Mine EQ Fault structure") Today: Basic regional framework Western U.S. setting Eastern California Shear Zone (ECSZ) 1992 Landers EQ 1999 Hector Mine EQ Fault structure 1 2 Mojave and Southern Basin and Range - distribution of strike-slip
Today: Basic regional framework Western U.S. setting Eastern California Shear Zone (ECSZ) 1992 Landers EQ 1999 Hector Mine EQ Fault structure 1 2 Mojave and Southern Basin and Range - distribution of strike-slip
Displacement field and slip distribution of the 2005 Kashmir earthquake from SAR imagery
 Click Here for Full Article GEOPHYSICAL RESEARCH LETTERS, VOL. 33,, doi:10.1029/2006gl027193, 2006 Displacement field and slip distribution of the 2005 Kashmir earthquake from SAR imagery E. Pathier, 1
NOTES AND CORRESPONDENCE Segmented Faulting Process of Chelungpu Thrust: Implication of SAR Interferograms
 , Vol. 14, No.2, 241-247, June 2003 NOTES AND CORRESPONDENCE Segmented Faulting Process of Chelungpu Thrust: Implication of SAR Interferograms Chien-Chih Chen 1,*, Chung-Pai Chang 2, and Kun-Shan Chen
INVESTIGATION OF EARTHQUAKE-CYCLE DEFORMATION IN TIBET FROM ALOS PALSAR DATA PI 168 Roland Bürgmann 1, Mong-Han Huang 1, Isabelle Ryder 2, and Eric Fi
 INVESTIGATION OF EARTHQUAKE-CYCLE DEFORMATION IN TIBET FROM ALOS PALSAR DATA PI 168 Roland Bürgmann 1, Mong-Han Huang 1, Isabelle Ryder 2, and Eric Fielding 3 1 Berkeley Seismological Laboratory, University
Two Contrasting InSAR Studies of Recent Earthquakes in Tibet
 Two Contrasting InSAR Studies of Recent Earthquakes in Tibet Barry Parsons Department of Earth Sciences University of Oxford John Elliott, Wanpeng Feng,, James Jackson, Zhenhong Li, Xinjian Shan, Alastair
RELOCATION OF THE MACHAZE AND LACERDA EARTHQUAKES IN MOZAMBIQUE AND THE RUPTURE PROCESS OF THE 2006 Mw7.0 MACHAZE EARTHQUAKE
 RELOCATION OF THE MACHAZE AND LACERDA EARTHQUAKES IN MOZAMBIQUE AND THE RUPTURE PROCESS OF THE 2006 Mw7.0 MACHAZE EARTHQUAKE Paulino C. FEITIO* Supervisors: Nobuo HURUKAWA** MEE07165 Toshiaki YOKOI** ABSTRACT
INGV. Giuseppe Pezzo. Istituto Nazionale di Geofisica e Vulcanologia, CNT, Roma. Sessione 1.1: Terremoti e le loro faglie
 Giuseppe Pezzo Istituto Nazionale di Geofisica e Vulcanologia, CNT, Roma giuseppe.pezzo@ingv.it The study of surface deformation is one of the most important topics to improve the knowledge of the deep
DETECTION OF CRUSTAL DEFORMATION OF THE NORTHERN PAKISTAN EARTHQUAKE BY SATELLITE DATA. Submitted by Japan **
 UNITED NATIONS E/CONF.97/5/CRP. 5 ECONOMIC AND SOCIAL COUNCIL Seventeenth United Nations Regional Cartographic Conference for Asia and the Pacific Bangkok, 18-22 September 2006 Item 6 (b) of the provisional
Basics of the modelling of the ground deformations produced by an earthquake. EO Summer School 2014 Frascati August 13 Pierre Briole
 Basics of the modelling of the ground deformations produced by an earthquake EO Summer School 2014 Frascati August 13 Pierre Briole Content Earthquakes and faults Examples of SAR interferograms of earthquakes
Ground surface deformation of L Aquila. earthquake revealed by InSAR time series
 Ground surface deformation of L Aquila earthquake revealed by InSAR time series Reporter: Xiangang Meng Institution: First Crust Monitoring and Application Center, CEA Address: 7 Naihuo Road, Hedong District
Regional Geodesy. Shimon Wdowinski. MARGINS-RCL Workshop Lithospheric Rupture in the Gulf of California Salton Trough Region. University of Miami
 MARGINS-RCL Workshop Lithospheric Rupture in the Gulf of California Salton Trough Region Regional Geodesy Shimon Wdowinski University of Miami Rowena Lohman, Kim Outerbridge, Tom Rockwell, and Gina Schmalze
Fault Specific, Dynamic Rupture Scenarios for Strong Ground Motion Prediction
 Fault Specific, Dynamic Rupture Scenarios for Strong Ground Motion Prediction H. Sekiguchi Disaster Prevention Research Institute, Kyoto University, Japan Blank Line 9 pt Y. Kase Active Fault and Earthquake
GPS Strain & Earthquakes Unit 5: 2014 South Napa earthquake GPS strain analysis student exercise
 GPS Strain & Earthquakes Unit 5: 2014 South Napa earthquake GPS strain analysis student exercise Strain Analysis Introduction Name: The earthquake cycle can be viewed as a process of slow strain accumulation
Coseismic and Postseismic Displacement of 2011 M w 6.8 Tarlay Earthquake, Myanmar using InSAR Techniques and Inversion Analysis
 Article Coseismic and Postseismic Displacement of 2011 M w 6.8 Tarlay Earthquake, Myanmar using InSAR Techniques and Inversion Analysis Pattama Phodee 1,a, *, Itthi Trisirisatayawong 1,b, and Anuphao Aobpaet
Coulomb stress changes due to Queensland earthquakes and the implications for seismic risk assessment
 Coulomb stress changes due to Queensland earthquakes and the implications for seismic risk assessment Abstract D. Weatherley University of Queensland Coulomb stress change analysis has been applied in
Journal of Geophysical Research (Solid Earth) Supporting Information for
 Supporting Information for") Journal of Geophysical Research (Solid Earth) Supporting Information for Postseismic Relocking of the Subduction Megathrust Following the 2007 Pisco, Peru earthquake D.Remy (a), H.Perfettini (b), N.Cotte
Journal of Geophysical Research (Solid Earth) Supporting Information for Postseismic Relocking of the Subduction Megathrust Following the 2007 Pisco, Peru earthquake D.Remy (a), H.Perfettini (b), N.Cotte
Separating Tectonic, Magmatic, Hydrological, and Landslide Signals in GPS Measurements near Lake Tahoe, Nevada-California
 Separating Tectonic, Magmatic, Hydrological, and Landslide Signals in GPS Measurements near Lake Tahoe, Nevada-California Geoffrey Blewitt, Corné Kreemer, William C. Hammond, & Hans-Peter Plag NV Geodetic
Fault model of the 2007 Noto Hanto earthquake estimated from PALSAR radar interferometry and GPS data
 LETTER Earth Planets Space, 60, 99 104, 2008 Fault model of the 2007 Noto Hanto earthquake estimated from PALSAR radar interferometry and GPS data Yo Fukushima 1, Taku Ozawa 2, and Manabu Hashimoto 1 1
3D temporal evolution of displacements recorded on Mt. Etna from the 2007 to 2010 through the SISTEM method
 3D temporal evolution of displacements recorded on Mt. Etna from the 2007 to 2010 through the SISTEM method Bonforte A., Guglielmino F.,, Puglisi G. INGV Istituto Nazionale di Gofisica e vulcanologia Osservatorio
ERS Track 98 SAR Data and InSAR Pairs Used in the Analysis
 ERS Track 98 SAR Data and InSAR Pairs Used in the Analysis Date 1 Date 2 Date 1 Date 2 Date 1 Date 2 Date 1 Date 2 7/17/1992 6/19/2000 7/17/1992 7/2/1993 9/10/1993 10/28/1996 9/3/1995 10/18/1999 9/25/1992
The Earthquake Cycle Chapter :: n/a
 The Earthquake Cycle Chapter :: n/a A German seismogram of the 1906 SF EQ Image courtesy of San Francisco Public Library Stages of the Earthquake Cycle The Earthquake cycle is split into several distinct
Journal of Geophysical Research Letters Supporting Information for
 Journal of Geophysical Research Letters Supporting Information for InSAR observations of strain accumulation and fault creep along the Chaman Fault system, Pakistan and Afghanistan H. Fattahi 1, F. Amelung
Three-dimensional deformation caused by the Bam, Iran, earthquake and the origin of shallow slip deficit
 Vol 435 19 May 2005 doi:10.1038/nature03425 Three-dimensional deformation caused by the Bam, Iran, earthquake and the origin of shallow slip deficit Yuri Fialko 1, David Sandwell 1, Mark Simons 2 & Paul
UC San Diego UC San Diego Previously Published Works
 UC San Diego UC San Diego Previously Published Works Title Three-dimensional deformation caused by the Bam, Iran, earthquake and the origin of shallow slip deficit Permalink https://escholarship.org/uc/item/3pf1s755
The Size and Duration of the Sumatra-Andaman Earthquake from Far-Field Static Offsets
 The Size and Duration of the Sumatra-Andaman Earthquake from Far-Field Static Offsets P. Banerjee, 1 F. F. Pollitz, 2 R. Bürgmann 3 * 1 Wadia Institute of Himalayan Geology, Dehra Dun, 248001, India. 2
Originally published as:
 Originally published as: Lorenzo Martín, F., Wang, R., Roth, F. (2002): The effect of input parameters on visco-elastic models of crustal deformation. - Física de la Tierra, 14, 33-54 The effect of input
Empirical Green s Function Analysis of the Wells, Nevada, Earthquake Source
 Nevada Bureau of Mines and Geology Special Publication 36 Empirical Green s Function Analysis of the Wells, Nevada, Earthquake Source by Mendoza, C. 1 and Hartzell S. 2 1 Centro de Geociencias, Universidad
Post-seismic motion following the 1997 Manyi (Tibet) earthquake: InSAR observations and modelling
 earthquake: InSAR observations and modelling") Geophys. J. Int. (7) 69, 9 7 doi:./j.365-46x.6.33.x Post-seismic motion following the 997 Manyi (Tibet) earthquake: InSAR observations and modelling Isabelle Ryder, Barry Parsons, Tim J. Wright and Gareth
Geophys. J. Int. (7) 69, 9 7 doi:./j.365-46x.6.33.x Post-seismic motion following the 997 Manyi (Tibet) earthquake: InSAR observations and modelling Isabelle Ryder, Barry Parsons, Tim J. Wright and Gareth
ABSTRACT. Key words: InSAR; GPS; northern Chile; subduction zone.
 ASPERITIES, BARRIERS AND TRANSITION ZONE IN THE NORTH CHILE SEISMIC GAP: STATE OF THE ART AFTER THE 007 MW 7.7 TOCOPILLA EARTHQUAKE INFERRED BY GPS AND INSAR DATA Marta Bejar Pizarro, Daniel Carrizo, Anne
Journal of Geophysical Research - Solid Earth
 Journal of Geophysical Research - Solid Earth Supporting Information for Transpressional Rupture Cascade of the 2016 M w 7.8 Kaikoura Earthquake, New Zealand Wenbin Xu 1*, Guangcai Feng 2*, Lingsen Meng
Effects of Surface Geology on Seismic Motion
 4 th IASPEI / IAEE International Symposium: Effects of Surface Geology on Seismic Motion August 23 26, 2011 University of California Santa Barbara LONG-PERIOD (3 TO 10 S) GROUND MOTIONS IN AND AROUND THE
Ground displacement in a fault zone in the presence of asperities
 BOLLETTINO DI GEOFISICA TEORICA ED APPLICATA VOL. 40, N. 2, pp. 95-110; JUNE 2000 Ground displacement in a fault zone in the presence of asperities S. SANTINI (1),A.PIOMBO (2) and M. DRAGONI (2) (1) Istituto
Monitoring long-term ground movements and Deep Seated Gravitational
 Monitoring long-term ground movements and Deep Seated Gravitational Slope Deformations by InSAR time series: cases studies in Italy Salvatore Stramondo (1), M. Saroli (1, 2), M. Moro (1, 2), S. Atzori
SUPPLEMENTARY INFORMATION
 SUPPLEMENTARY INFORMATION doi: 10.1038/ngeo739 Supplementary Information to variability and distributed deformation in the Marmara Sea fault system Tobias Hergert 1 and Oliver Heidbach 1,* 1 Geophysical
SUPPLEMENTARY INFORMATION
 doi:10.1038/nature11492 Figure S1 Short-period Seismic Energy Release Pattern Imaged by F-net. (a) Locations of broadband seismograph stations in Japanese F-net used for the 0.5-2.0 Hz P wave back-projection
Widespread Ground Motion Distribution Caused by Rupture Directivity during the 2015 Gorkha, Nepal Earthquake
 Widespread Ground Motion Distribution Caused by Rupture Directivity during the 2015 Gorkha, Nepal Earthquake Kazuki Koketsu 1, Hiroe Miyake 2, Srinagesh Davuluri 3 and Soma Nath Sapkota 4 1. Corresponding
Surface changes caused by erosion and sedimentation were treated by solving: (2)
") GSA DATA REPOSITORY 214279 GUY SIMPSON Model with dynamic faulting and surface processes The model used for the simulations reported in Figures 1-3 of the main text is based on two dimensional (plane strain)
GSA DATA REPOSITORY 214279 GUY SIMPSON Model with dynamic faulting and surface processes The model used for the simulations reported in Figures 1-3 of the main text is based on two dimensional (plane strain)
Haiti Earthquake (12-Jan-2010) co-seismic motion using ALOS PALSAR
 co-seismic motion using ALOS PALSAR") Haiti Earthquake (12-Jan-2010) co-seismic motion using ALOS PALSAR Urs Wegmüller, Charles Werner, Maurizio Santoro Gamma Remote Sensing, CH-3073 Gümligen, Switzerland SAR data: JAXA, METI; PALSAR AO Project
Haiti Earthquake (12-Jan-2010) co-seismic motion using ALOS PALSAR Urs Wegmüller, Charles Werner, Maurizio Santoro Gamma Remote Sensing, CH-3073 Gümligen, Switzerland SAR data: JAXA, METI; PALSAR AO Project
Kinematics of the Southern California Fault System Constrained by GPS Measurements
 Title Page Kinematics of the Southern California Fault System Constrained by GPS Measurements Brendan Meade and Bradford Hager Three basic questions Large historical earthquakes One basic question How
Available online at ScienceDirect. Procedia Technology 16 (2014 )
") Available online at www.sciencedirect.com ScienceDirect Procedia Technology 16 (2014 ) 876 885 CENTERIS 2014 - Conference on ENTERprise Information Systems / ProjMAN 2014 - International Conference on
Available online at www.sciencedirect.com ScienceDirect Procedia Technology 16 (2014 ) 876 885 CENTERIS 2014 - Conference on ENTERprise Information Systems / ProjMAN 2014 - International Conference on
The Potential of High Resolution Satellite Interferometry for Monitoring Enhanced Oil Recovery
 The Potential of High Resolution Satellite Interferometry for Monitoring Enhanced Oil Recovery Urs Wegmüller a Lutz Petrat b Karsten Zimmermann c Issa al Quseimi d 1 Introduction Over the last years land
Tandem afterslip on connected fault planes following the 2008 Nima-Gaize (Tibet) earthquake
 earthquake") Click Here for Full Article JOURNAL OF GEOPHYSICAL RESEARCH, VOL. 115,, doi:10.1029/2009jb006423, 2010 Tandem afterslip on connected fault planes following the 2008 Nima-Gaize (Tibet) earthquake I. Ryder,
Click Here for Full Article JOURNAL OF GEOPHYSICAL RESEARCH, VOL. 115,, doi:10.1029/2009jb006423, 2010 Tandem afterslip on connected fault planes following the 2008 Nima-Gaize (Tibet) earthquake I. Ryder,
2008 Monitoring Research Review: Ground-Based Nuclear Explosion Monitoring Technologies
 STRUCTURE OF THE KOREAN PENINSULA FROM WAVEFORM TRAVEL-TIME ANALYSIS Roland Gritto 1, Jacob E. Siegel 1, and Winston W. Chan 2 Array Information Technology 1 and Harris Corporation 2 Sponsored by Air Force
Buried Strike Slip Faults: The 1994 and 2004 Al Hoceima, Morocco Earthquakes.
 Buried Strike Slip Faults: The 1994 and 2004 Al Hoceima, Morocco Earthquakes. Juliet Biggs 1, Eric Bergman 2, Brian Emmerson 3, Gareth Funning 4, James Jackson 3, Barry Parsons 1,Tim Wright 1. 1 COMET,
Was the February 2008 Bukavu seismic sequence associated with magma intrusion?
 Was the February 2008 Bukavu seismic sequence associated with magma intrusion? N. d Oreye, C. Lucas National Museum of Natural History, Luxembourg nicolas.doreye@ecgs.lu P. Gonzalez, J. Fernández Univ.
Estimation of S-wave scattering coefficient in the mantle from envelope characteristics before and after the ScS arrival
 GEOPHYSICAL RESEARCH LETTERS, VOL. 30, NO. 24, 2248, doi:10.1029/2003gl018413, 2003 Estimation of S-wave scattering coefficient in the mantle from envelope characteristics before and after the ScS arrival
Lecture 20: Slow Slip Events and Stress Transfer. GEOS 655 Tectonic Geodesy Jeff Freymueller
 Lecture 20: Slow Slip Events and Stress Transfer GEOS 655 Tectonic Geodesy Jeff Freymueller Slow Slip Events From Kristine Larson What is a Slow Slip Event? Slip on a fault, like in an earthquake, BUT
Evaluation of earthquake triggering during the earthquake sequence on Qeshm Island, Iran
 JOURNAL OF GEOPHYSICAL RESEARCH, VOL. 115,, doi:10.1029/2010jb007710, 2010 Evaluation of earthquake triggering during the 2005 2008 earthquake sequence on Qeshm Island, Iran R. B. Lohman 1 and W. D. Barnhart
Earthquakes. Earthquake Magnitudes 10/1/2013. Environmental Geology Chapter 8 Earthquakes and Related Phenomena
 Environmental Geology Chapter 8 Earthquakes and Related Phenomena Fall 2013 Northridge 1994 Kobe 1995 Mexico City 1985 China 2008 Earthquakes Earthquake Magnitudes Earthquake Magnitudes Richter Magnitude
EARTHQUAKE LOCATIONS INDICATE PLATE BOUNDARIES EARTHQUAKE MECHANISMS SHOW MOTION
 6-1 6: EARTHQUAKE FOCAL MECHANISMS AND PLATE MOTIONS Hebgen Lake, Montana 1959 Ms 7.5 1 Stein & Wysession, 2003 Owens Valley, California 1872 Mw ~7.5 EARTHQUAKE LOCATIONS INDICATE PLATE BOUNDARIES EARTHQUAKE
INSAR ATMOSPHERIC DELAY MIGITIGATION BY GPS; CASE STUDY IZMIT EARTQUAKE INTERFEROGRAMS
 INSAR ATMOSPHERIC DELAY MIGITIGATION BY GPS; CASE STUDY IZMIT EARTQUAKE INTERFEROGRAMS M.U. Altın a, *, E. Tari a, L. Ge b a ITU, Civil Engineering Faculty, 80626 Maslak Istanbul, Turkey (altinm, tari)@itu.edu.tr
3D MODELING OF EARTHQUAKE CYCLES OF THE XIANSHUIHE FAULT, SOUTHWESTERN CHINA
 3D MODELING OF EARTHQUAKE CYCLES OF THE XIANSHUIHE FAULT, SOUTHWESTERN CHINA Li Xiaofan MEE09177 Supervisor: Bunichiro Shibazaki ABSTRACT We perform 3D modeling of earthquake generation of the Xianshuihe
Line of Sight Displacement from ALOS-2 Interferometry: Mw 7.8 Gorkha Earthquake and Mw 7.3 Aftershock
 Line of Sight Displacement from ALOS-2 Interferometry: Mw 7.8 Gorkha Earthquake and Mw 7.3 Aftershock Eric O. Lindsey 1 Ryo Natsuaki 2 Xiaohua Xu 1 Masanobu Shimada 2 Manabu, Hashimoto 3 Diego Melgar 4
Zoning surface rupture hazard along normal faults: insight from the 2009 M w 6.3 L Aquila, central Italy, earthquake and other global earthquakes
 Zoning surface rupture hazard along normal faults: insight from the 2009 M w 6.3 L Aquila, central Italy, earthquake and other global earthquakes Boncio, P., Galli, P., Naso, G., Pizzi, A. Bulletin of
Coseismic Deformation from the 1999 M w 7.1 Hector Mine, California, Earthquake as Inferred from InSAR and GPS Observations
 Bulletin of the Seismological Society of America, Vol. 92, No. 4, pp. 139 142, May 2 Coseismic Deformation from the 1999 M w 7.1 Hector Mine, California, Earthquake as Inferred from InSAR and GPS Observations
Lessons from the 2004 Sumatra earthquake and the Asian tsunami
 Lessons from the 2004 Sumatra earthquake and the Asian tsunami Kenji Satake National Institute of Advanced Industrial Science and Technology Outline 1. The largest earthquake in the last 40 years 2. Tsunami
COULOMB STRESS CHANGES DUE TO RECENT ACEH EARTHQUAKES
 COULOMB STRESS CHANGES DUE TO RECENT ACEH EARTHQUAKES Madlazim Physics Department, Faculty Mathematics and Sciences of Surabaya State University (UNESA) Jl. Ketintang, Surabaya 60231, Indonesia. e-mail:
Introduction to Displacement Modeling
 Introduction to Displacement Modeling Introduction Deformation on the Earth surface informs us about processes and material properties below surface Observation tools: GPS (static-dynamic) InSAR (static)
RELOCATION OF LARGE EARTHQUAKES ALONG THE PHILIPPINE FAULT ZONE AND THEIR FAULT PLANES
 RELOCATION OF LARGE EARTHQUAKES ALONG THE PHILIPPINE FAULT ZONE AND THEIR FAULT PLANES Rey M. Lumbang MEE12608 Supervisor: Nobuo Hurukawa ABSTRACT We relocated large magnitude (Mw 7.0) earthquakes that
STRUCTURE AND HOLOCENE SLIP OF THE JID FAULT, MONGOLIA ALTAI
 STRUCTURE AND HOLOCENE SLIP OF THE JID FAULT, MONGOLIA ALTAI LAURA K.O. SMITH AND SARAHTSETSEG PUREDORG Princeton University, Mongolian University of Science and Technology Sponsors: Ramon Gonzalez-Mieres
Geophysical Journal International
 Geophysical Journal International Geophys. J. Int. (2016) 204, 1867 1886 GJI Gravity, geodesy and tides doi: 10.1093/gji/ggv563 Refining the shallow slip deficit Xiaohua Xu, 1 Xiaopeng Tong, 2 David T.
Seismogenic structure of 1935 Hsinchu-Taichung (M GR =7.1) earthquake, Miaoli, western Taiwan 1935 (M GR =7.1)
 earthquake, Miaoli, western Taiwan 1935 (M GR =7.1)") Seismogenic structure of 1935 Hsinchu-Taichung (M GR =7.1) earthquake, Miaoli, western Taiwan 1935 (M GR =7.1) Y.N. Nina Lin; Y.G. Chen; Y.M. Wu (Inst. of Geosciences, NTU); K.M. Yang (Exploration and
Seismogenic structure of 1935 Hsinchu-Taichung (M GR =7.1) earthquake, Miaoli, western Taiwan 1935 (M GR =7.1) Y.N. Nina Lin; Y.G. Chen; Y.M. Wu (Inst. of Geosciences, NTU); K.M. Yang (Exploration and
A New Perspective on Fault Geometry and Slip Distribution of the 2009 Dachaidan Mw 6.3 Earthquake from InSAR Observations
 Sensors 2015, 15, 16786-16803; doi:10.3390/s150716786 Article OPEN ACCESS sensors ISSN 1424-8220 www.mdpi.com/journal/sensors A New Perspective on Fault Geometry and Slip Distribution of the 2009 Dachaidan
POSTSEISMIC DEFORMATION IN SOUTH ICELAND STUDIED USING MULTIPLE ACQUISTION RADAR INTERFEROMETRY
 POSTSEISMIC DEFORMATION IN SOUTH ICELAND STUDIED USING MULTIPLE ACQUISTION RADAR INTERFEROMETRY Sigurjón Jónsson (1), Jörn Hoffmann (2), Thóra Árnadóttir (3) (1) Institute of Geophysics, ETH Zurich, Schafmattstr.
Case Study 1: 2014 Chiang Rai Sequence
 Case Study 1: 2014 Chiang Rai Sequence Overview Mw 6.1 earthquake on 5 May 2014 at 11:08:43 UTC Largest recorded earthquake in Thailand Fault Orientation How does the orientation of the fault affect the
Shallow intraplate earthquakes in Western Australia observed by Interferometric Synthetic Aperture Radar
 Click Here for Full Article JOURNAL OF GEOPHYSICAL RESEARCH, VOL. 113,, doi:10.1029/2008jb005807, 2008 Shallow intraplate earthquakes in Western Australia observed by Interferometric Synthetic Aperture
G 3. AN ELECTRONIC JOURNAL OF THE EARTH SCIENCES Published by AGU and the Geochemical Society
 Geosystems G 3 AN ELECTRONIC JOURNAL OF THE EARTH SCIENCES Published by AGU and the Geochemical Society Some thoughts on the use of InSAR data to constrain models of surface deformation: Noise structure
one of many left-lateral faults that comprise the Shan fault system, which has accommodated more
 223 Chapter 5 Surface Ruptures of the Mw 6.8 March 2011 Tarlay Earthquake, Eastern Myanmar Soe Thura Tun 1, Yu Wang 2, 3, Saw Ngwe Khaing 4, Myo Thant 5, Nyunt Htay 6, Yin Myo Min Htwe 7, Than Myint 1
Surface ruptures and building damage of the 2003 Bam, Iran, earthquake mapped by satellite synthetic aperture radar interferometric correlation
 JOURNAL OF GEOPHYSICAL RESEARCH, VOL. 110,, doi:10.1029/2004jb003299, 2005 Surface ruptures and building damage of the 2003 Bam, Iran, earthquake mapped by satellite synthetic aperture radar interferometric
ESTIMATES OF HORIZONTAL DISPLACEMENTS ASSOCIATED WITH THE 1999 TAIWAN EARTHQUAKE
 ESTIMATES OF HORIZONTAL DISPLACEMENTS ASSOCIATED WITH THE 1999 TAIWAN EARTHQUAKE C. C. Chang Department of Surveying and Mapping Engineering Chung Cheng Institute of Technology, Taiwan, ROC ABSTRACT A
Far-reaching transient motions after Mojave earthquakes require broad mantle flow beneath a strong crust
 Click Here for Full Article GEOPHYSICAL RESEARCH LETTERS, VOL. 34, L19302, doi:10.1029/2007gl030959, 2007 Far-reaching transient motions after Mojave earthquakes require broad mantle flow beneath a strong
APLICATION OF INSAR TO THE STUDY OF GROUND DEFORMATION IN THE MEXICALI VALLEY, B. C., MEXICO.
 APLICATION OF INSAR TO THE STUDY OF GROUND DEFORMATION IN THE MEXICALI VALLEY, B. C., MEXICO. O. Sarychikhina (1), R. Mellors (2), E. Glowacka (1). (1) Centro de Investigacion Cientifica y Educaccion Superior
Interseismic strain accumulation across the Manyi fault (Tibet) prior to the 1997 M w 7.6 earthquake
 prior to the 1997 M w 7.6 earthquake") GEOPHYSICAL RESEARCH LETTERS, VOL. 38,, doi:10.1029/2011gl049762, 2011 Interseismic strain accumulation across the Manyi fault (Tibet) prior to the 1997 M w 7.6 earthquake M. A. Bell, 1 J. R. Elliott,
GEOPHYSICAL RESEARCH LETTERS, VOL. 38,, doi:10.1029/2011gl049762, 2011 Interseismic strain accumulation across the Manyi fault (Tibet) prior to the 1997 M w 7.6 earthquake M. A. Bell, 1 J. R. Elliott,
Co-seismic slip from the July 30, 1995, M w 8.1 Antofagasta, Chile, earthquake as constrained by InSAR and GPS observations
 98 Chapter 3 Co-seismic slip from the July 30, 1995, M w 8.1 Antofagasta, Chile, earthquake as constrained by InSAR and GPS observations Published by Blackwell Publishing Ltd. in Geophysical Journal International
Geophysical Journal International
 Geophysical Journal International Geophys. J. Int. (2013) 195, 650 660 Advance Access publication 2013 July 25 doi: 10.1093/gji/ggt254 The 2011 M W 6.8 Burma earthquake: fault constraints provided by multiple
4600 Rickenbacker Cswy, Miami 33149, FL. U.S.A., (2)
") POSTSEISMIC DEFORMATION FOLLOWING THE 2010 HAITI EARTHQUAKE: TIME-DEPENDENT SURFACE SUBSIDENCE INDUCED BY GROUNDWATER FLOW IN RESPONSE TO A SUDDEN UPLIFT Shimon Wdowinski (1), Sang-Hoon Hong (1)(2) (1)
POSTSEISMIC DEFORMATION FOLLOWING THE 2010 HAITI EARTHQUAKE: TIME-DEPENDENT SURFACE SUBSIDENCE INDUCED BY GROUNDWATER FLOW IN RESPONSE TO A SUDDEN UPLIFT Shimon Wdowinski (1), Sang-Hoon Hong (1)(2) (1)
Slip on faults in the Imperial Valley triggered by the 4 April 2010 Mw 7.2 El Mayor Cucapah earthquake revealed by InSAR
 GEOPHYSICAL RESEARCH LETTERS, VOL. 38,, doi:10.1029/2010gl045235, 2011 Slip on faults in the Imperial Valley triggered by the 4 April 2010 Mw 7.2 El Mayor Cucapah earthquake revealed by InSAR Meng Wei,
Section 19.1: Forces Within Earth Section 19.2: Seismic Waves and Earth s Interior Section 19.3: Measuring and Locating.
 CH Earthquakes Section 19.1: Forces Within Earth Section 19.2: Seismic Waves and Earth s Interior Section 19.3: Measuring and Locating Earthquakes Section 19.4: Earthquakes and Society Section 19.1 Forces
Internal Layers of the Earth
 Lecture #4 notes Geology 3950, Spring 2006; CR Stern Seismic waves, earthquake magnitudes and location, and internal earth structure (pages 28-95 in the 4 th edition and 28-32 and 50-106 in the 5 th edition)
Coseismic slip distribution of the 1946 Nankai earthquake and aseismic slips caused by the earthquake
 Earth Planets Space, 53, 235 241, 2001 Coseismic slip distribution of the 1946 Nankai earthquake and aseismic slips caused by the earthquake Yuichiro Tanioka 1 and Kenji Satake 2 1 Meteorological Research
Slip distributions of the 1944 Tonankai and 1946 Nankai earthquakes including the horizontal movement effect on tsunami generation
 Slip distributions of the 1944 Tonankai and 1946 Nankai earthquakes including the horizontal movement effect on tsunami generation Toshitaka Baba Research Program for Plate Dynamics, Institute for Frontier
DETECTION OF CRUSTAL MOVEMENTS IN THE 2011 TOHOKU, JAPAN EARTHQUAKE USING HIGH-RESOLUTION SAR DATA
 Paper No. M-5 DETECTION OF CRUSTAL MOVEMENTS IN THE 2011 TOHOKU, JAPAN EARTHQUAKE USING HIGH-RESOLUTION SAR DATA Fumio Yamazaki 1 and Wen Liu 2 SUMMARY Significant crustal movements were caused by the
Evolution of the 2007 earthquake swarm, Tanzania: Envisat and ALOS interferometry, ground observations and elastic modeling
 Evolution of the 2007 earthquake swarm, Tanzania: Envisat and ALOS interferometry, ground observations and elastic modeling Gidon Baer, Yariv Hamiel, Gadi Shamir, Ran Nof Geological Survey of Israel East
NASA Jet Propulsion Laboratory Data Products
 NASA Jet Propulsion Laboratory Data Products 17 April 2014 Emergency Response Spatial Tools Technical Interchange Maggi Glasscoe Margaret.T.Glasscoe@jpl.nasa.gov Sang-Ho Yun Sang-Ho.Yun@jpl.nasa.gov www.nasa.gov
Surface displacements and source parameters of the 2003 Bam (Iran) earthquake from Envisat advanced synthetic aperture radar imagery
 earthquake from Envisat advanced synthetic aperture radar imagery") JOURNAL OF GEOPHYSICAL RESEARCH, VOL. 110,, doi:10.1029/2004jb003338, 2005 Surface displacements and source parameters of the 2003 Bam (Iran) earthquake from Envisat advanced synthetic aperture radar imagery
JOURNAL OF GEOPHYSICAL RESEARCH, VOL. 110,, doi:10.1029/2004jb003338, 2005 Surface displacements and source parameters of the 2003 Bam (Iran) earthquake from Envisat advanced synthetic aperture radar imagery
Does Aftershock Duration Scale With Mainshock Size?
 GEOPHYSICAL RESEARCH LETTERS, VOL.???, NO., PAGES 1 16, Does Aftershock Duration Scale With Mainshock Size? A. Ziv A. Ziv, Ben-Gurion University of the Negev, Beer-Sheva, 84105, Israel. (e-mail: zival@bgu.ac.il)
InSAR-derived Crustal Deformation and Reverse Fault Motion of the 2017 Iran-Iraq Earthquake in the Northwestern Part of the Zagros Orogenic Belt
 InSAR-derived Crustal Deformation and Reverse Fault Motion of the 2017 Iran-Iraq Earthquake in the Northwestern Part of the Zagros Orogenic Belt Tomokazu Kobayashi, Yu Morishita, Hiroshi Yarai and Satoshi
Earthquakes and Earthquake Hazards Earth - Chapter 11 Stan Hatfield Southwestern Illinois College
 Earthquakes and Earthquake Hazards Earth - Chapter 11 Stan Hatfield Southwestern Illinois College What Is an Earthquake? An earthquake is the vibration of Earth, produced by the rapid release of energy.
TEMPORAL VARIABILITY OF ICE FLOW ON HOFSJÖKULL, ICELAND, OBSERVED BY ERS SAR INTERFEROMETRY
 TEMPORAL VARIABILITY OF ICE FLOW ON HOFSJÖKULL, ICELAND, OBSERVED BY ERS SAR INTERFEROMETRY Florian Müller (1), Helmut Rott (2) (1) ENVEO IT, Environmental Earth Observation GmbH, Technikerstrasse 21a,
SUPPLEMENTARY INFORMATION
 SUPPLEMENTARY INFORMATION DOI: 1.138/NGEO177 The Long Precursory Phase of Most Large Interplate Earthquakes Supplementary Information Supplementary Methods 1. Data and Classification We select the earthquakes
Episodic growth of fault-related fold in northern Japan observed by SAR interferometry
 GEOPHYSICAL RESEARCH LETTERS, VOL. 35,, doi:10.1029/2008gl034337, 2008 Episodic growth of fault-related fold in northern Japan observed by SAR interferometry Takuya Nishimura, 1 Mikio Tobita, 1 Hiroshi
Overview of the Seismic Source Characterization for the Palo Verde Nuclear Generating Station
 Overview of the Seismic Source Characterization for the Palo Verde Nuclear Generating Station Scott Lindvall SSC TI Team Lead Palo Verde SSC SSHAC Level 3 Project Tuesday, March 19, 2013 1 Questions from
Slow Deformation of Mt. Baekdu Stratovolcano Observed by Satellite Radar Interferometry
 Slow Deformation of Mt. Baekdu Stratovolcano Observed by Satellite Radar Interferometry Sang-Wan Kim and Joong-Sun Won Department of Earth System Sciences, Yonsei University 134 Shinchon-dong, Seodaemun-gu,
Scaling Relations for Seismic Cycles on Mid-Ocean Ridge
 Scaling Relations for Seismic Cycles on Mid-Ocean Ridge Transform Faults Margaret S. Boettcher University of New Hampshire, Dept. of Earth Sciences, Durham, NH 03824 Jeffrey J. McGuire Woods Hole Oceanographic