Ice Sheet Climate Interac0on Learned from Modeling the Past for the Future
|
|
|
- Candice Mathews
- 5 years ago
- Views:
Transcription
1 Ice Sheet Climate Interac0on Learned from Modeling the Past for the Future WCRP OSC (27 October 2011, Denver) A. Abe Ouchi, M. Yoshimori (Univ. of Tokyo/AORI), F. Saito, K. Takahashi (JAMSTEC/RIGC), and R. O ishi (Univ. of Tokyo/AORI)
2 Outline of this talk Introduc0on Part1: Sources of uncertainty in the future ice sheet surface mass balance projec0ons Part2: Note on the interpreta0on of observed recent changes Part3: A challenge of modelling the last interglacial ice sheet and sea level Conclusions
 +59 (A1FI upper) cm If observed ice flow accelera0on were scaled up with global surface temperature: add +10 +20 cm to the upper bound,")
3 Observed and future sea level change IPCC AR4 (2007) 20 th century +17 cm Late 20 th century ( ~50% by steric component ~25% by glaciers and ice caps ~14% by Greenland and Antarc0c ice sheets 21 st century Without rapid ice discharge +18 (B1 lower) +59 (A1FI upper) cm If observed ice flow accelera0on were scaled up with global surface temperature: add cm to the upper bound, but no es0mate in SPM Cazenave et al. (2009), Rignot (2011) More rela0ve contribu0on from the polar ice sheets recently Large uncertainty exists Church et al., (2010) need to examine individual (e.g., ice sheet) contribu:ons through physical understanding
 (IPCC-AR4, Fig. 4.")

4 Observed Greenland ice sheet mass balance Rates of elevation change (cm/yr) from ATM+ICESat (Velicogna, 2009) (IPCC-AR4, Fig. 4.17) GRACE: Gravity Recovery and Climate Experiment Recent observations indicate rapid mass loss e.g., Cazenave, 2006; Shepherd and Windgham, 2007; Hanna et al. 2008; Rignot et al., 2008; Wouters et al., 2008; Velicogna, 2009; Pritchard et al., 2009 (Jensen and Steffen, 2009) (Alley et al., 2010)


5 Mass balance es0mate based on observa0ons and RCM Both ice discharge and melting are important. (Broeke et al., 2009)
6 Outline of this talk Introduc0on Part1: Sources of uncertainty in the future ice sheet surface mass balance projec0ons Part2: Note on the interpreta0on of observed recent changes Part3: A challenge of modelling the last interglacial ice sheet and sea level Conclusions
7 Run high res. ( 1.1 ) AGCM with lower boundary condi0ons taken from lowres. AOGCM Ohmura and Wild (1996), Wild and Ohmura (2000) Interpolate climate change simulated by GCM onto fine resolu0on (~2 km) and add to observa0ons; use empirical formula Wild et al. (2003), Suzuki et al. (2005) Run snowpack model on 20 km res. using EMIC output Bugnion and Stone (2002) Scale climate change pajerns simulated by high res. GCM by low res. GCM/ EMIC simula0ons; use empirical formula 20 km res. IPCC TAR (2001), Huybrechts et al. (2004), Gregory and Huybrechts (2006), IPCC AR4 (2007) Apply a regression equa0on derived from RCM for specific regions Fejweis et al. (2008) There are many studies, but few inves:gated mechanisms behind the difference among climate models.
8 Purpose to analyze reasons for intermodel difference Important: mel0ng occurs narrow and steep margin Input data: CMIP3 Abla0on Interpolate GCM simulated temperature change onto fine resolu0on: 0.05 x 0.02 (~2.8km@60N x ~2.2km) Compute summer temperature by adding the anomaly to observa0ons on the fine resolu0on (take steep margin into account; remove model bias as a by product) use empirical formula (func0on of summer surface air temperature proposed by Ohmura, 1996) Accumula0on Interpolate GCM simulated snowfall onto the fine resolu0on
9 Rate of sea level rise due to Greenland SMB (A1B) snowfall net abla:on Abla:on change dominates over snowfall change.
10
11 Sea level change due to Greenland SMB (A1B, A2, & B1) A2 A1B B1 Small scenario dependency by 2100, but becomes large by 2300
12 Rate of sea level rise due to Greenland SMB (A1B) snowfall net abla:on Inves:gate intermodel difference.


13 The rela0onship between 21 st century global mean warming and GrIS abla0on rate change L-group S-group About 61 of the intermodel spread is explained by global mean temp. change. We investigate other processes. Composite analysis based on ablation rate increase normalized by global temp. change during the 21 st century; L group = 5 largest, S group = 5 smallest
Small ablation increase (S) 21 st century summer Max.")

14 The effect of temperature bias over Greenland Large ablation increase (L)Small ablation increase (S) 21 st century summer Max. surface temperature in melting region is limited to the melting point initially colder models require more warming to occur until reaching 0 late 20 th century summer


15 Large abla0on models (L) Small abla0on models (S) 21 st century temp. change Late 20 th century temp. 21 st century sea ice change Late 20 th century sea ice Models with larger sea ice extent in the late 20 th century tend to have larger warming during the 21 st century through sea ice feedback
16 Rela0on to Atlan0c meridional overturning circula0on (AMOC) AMOC weakening vs. Melting Models with larger weakening of AMOC exhibit smaller increase of normalized ablation r=-0.75
17 Outline of this talk Introduc0on Part1: Sources of uncertainty in the future ice sheet surface mass balance projec0ons Part2: Note on the interpreta0on of observed recent changes Part3: A challenge of modelling the last interglacial ice sheet and sea level Conclusions


18 Recent observations and RCM (SMB, D, mass balance) GrIS GrIS AIS AIS Total (Rignot et al. 2011)
 2007 record mel0ng background 2007 2007 - background (Hanna et al.")
19 Internal variability or climate change? (1) 2007 record mel0ng background background (Hanna et al., 2009: large scale changes in the sub-polar jet stream) (Jensen and Steffen, 2009)


20 Internal variability or climate change? (2) Rela0on to NAO Year DJF MAM JJA SON NAO and Temperature NAO and Precipitation (Fettweis, 2007)
.")
21 Internal variability or climate change? (3) Recent warming Possible influence of internal/natural variability Rela0on between temperature/precipita0on and NAO was pointed out (Appenzeller et al., 1998; Hanna and Cappelen, 2003; Chylek et al., 2004; Johannessen et al., 2005; Vinther et al., 2003; Bhajacharya et al., 2009). There was a warm period in early 20 th century [1930s 1940s] (Chylek et al., 2006; Vinther et al., 2006; Box et al., 2009). Quasi periodic mul0 decadal temperature fluctua0on persisted throughout the last millennium, possibly linked to AMO (Kobashi et al., 2010). (Hanna et al. 2008) Link to N. Hem. warming NAO is a good proxy for the Greenland winter temperature but not for winter snowfall nor summer temperature for the last 28 years (Fejweis, 2007). The correla0on of NAO with temperature is nega0ve and the NAO index has a posi0ve trend for the last 40 years (Fejweis, 2007). (Box et al., 2009) Summer temperature NAO rela0onship breaks down aver the early 1990s (Hanna et al., 2008).


22 An example of ensemble spread (same model, same bias correc0on, different ini0al condi0ons) MIROC5


23 Dipole SLP anomaly ( avg.) may have caused the difference among ensemble members in MIROC5 RCP4.5 RUN2 RUN1 RUN2 RUN3
24 Outline of this talk Introduc0on Part1: Sources of uncertainty in the future ice sheet surface mass balance projec0ons Part2: Note on the interpreta0on of observed recent changes Part3: A challenge of modelling the last interglacial ice sheet and sea level Conclusions
25 Previous studies: Reconstructed sea level and GrIS simula0ons during the LIG period Studies Lambeck et al. (2002) Overpeck et al. (2006) Kopp et al. (2009) Alley et al. (2010) LIG sea level from today 2 4 m > 4 6 m > 6.6 m (95%) 5 8 m Studies GrIS contribu:on Forcing and constraint Cuffey and Marshall (2000) m O isotope Tarasov and Pel0er (2003) m O isotope + obs. constraints Lhomme et al. (2005) m O isotope + obs. Constraints Ojo Bliesner et al. (2006) m AOGCM There are large uncertainties in both estimates. The direct analogue for the future is not possible (Crowley 1990; van de Berg et al. 2011). Useful if we understand mechanisms of the changes.
26
 Basic features (e.g.")
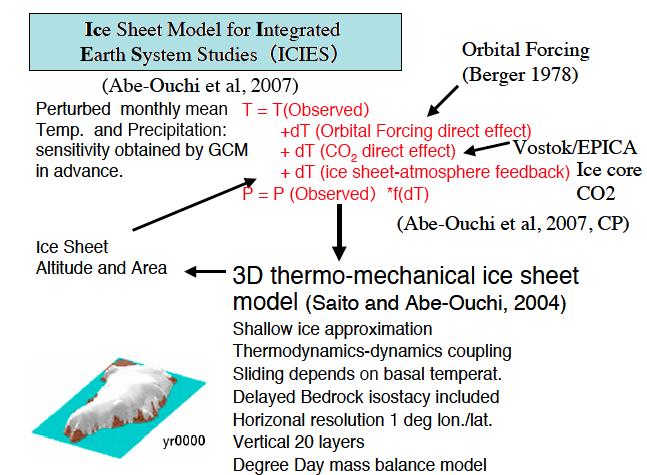
27 Simula0on of the last glacial cycle CO2 (Abe-Ouchi et al. 2007) Basic features (e.g., 100-kyr cycle) of glacial cycles can be simulated with insolation and atmospheric CO2 changes.

28 Time slice Ice age cycle run with MIROC GCM and IcIES Forced by Insolation, GHG and NH Ice sheet


29 The effect of vegeta0on feedback


30 With and without vegeta0on feedback
31 Concluding remarks A majority of spread in mul0 model projec0ons of GrIS SMB is accounted for by global mean temperature change (i.e., climate sensi0vity and ocean heat uptake). There are, however, other processes that are important (i.e., sea ice, ocean circula0on). It is important to correctly simulate the present day condi0ons. There is a possibility of narrowing the uncertainty by assessing performance in the present day simula0ons. To do so based on short observa0on records, we need to dis0nguish externally forced and unforced internal components in them. There is no perfect past analogue for the future change in ice sheet and sea level changes, but the bridge can be build and insight may be gained through quan0ta0ve understanding of the underlying mechanisms of the past changes.
32 END
33 Rela0on to Sea Ice and Atlan0c MOC Sea ice reduction vs. Melting AMOC weakening vs. Melting Models with larger reduction of sea ice exhibit larger increase of normalized ablation r=0.7 Models with larger weakening of AMOC exhibit smaller increase of normalized ablation r=-0.75
34 Sources of uncertainty in es0ma0ng future contribu0on of ice sheet to sea level change Huybrechts et al. (2004) lists following 4 points: 1. Long term background evolu0on 2. Surface mass balance (SMB) changes 3. Ice dynamic response to these mass balance changes 4. Poorly represented rapid dynamical changes in ice flow Inland transmission of stress aver ice front thinning or break up Enhanced basal lubrica0on aver surface mel0ng Here, we focus on the Greenland ice sheet (GrIS) surface mass balance changes.
 CMIP 20km 4.5+/-0.9 K, 3.1+/-0.")
35 Previous research Gregory and Huybrechts (2006) 3 AGCM 1 AOGCM(MIROC) CMIP 20km 4.5+/-0.9 K, 3.1+/-0.8 K
 MIROC3.2 High res. MIROC3.2 Low res.")
36 Previous research Suzuki et al. (2005) MIROC3.2 High res. MIROC3.2 Low res.
 Ablation")

37 Large ablation model (L) Small ablation model (S) Ablation composite Small AMOC weakening Large AMOC weakening AMOC composite
38 SMB es0mate from different calibrated regional models (Hanna et al., 2009)
 (from http://www.")
39 2010 record mel0ng (Not for presenta0on) (from
Overview of the Ice Sheet Model Intercomparison Project for CMIP6 (ISMIP6)
") Overview of the Ice Sheet Model Intercomparison Project for CMIP6 (ISMIP6) S. Nowicki & ISMIP6 13th July 2017 Sophie Nowicki (USA) Tony Payne (UK) Eric Larour (USA) Ayako Abe- Ouchi (JP) Heiko Goelzer
Overview of the Ice Sheet Model Intercomparison Project for CMIP6 (ISMIP6) S. Nowicki & ISMIP6 13th July 2017 Sophie Nowicki (USA) Tony Payne (UK) Eric Larour (USA) Ayako Abe- Ouchi (JP) Heiko Goelzer
Projection of global and regional sea level change for the 21st century
 Projection of global and regional sea level change for the 21st century Jonathan Gregory 1,2 1 NCAS-Climate, University of Reading 2 Met Office Hadley Centre, Exeter Global mean sea level rise observed
Tropical Pacific modula;ons of global climate
 Tropical Pacific modula;ons of global climate Shang- Ping Xie 1 & Yu Kosaka 2 1 Scripps Inst of Oceanogr, UCSD; 2 Univ of Tokyo Develop seasonal and spa
POLAR EXPLORER EXPLORING SEA LEVEL RISE
 POLAR EXPLORER EXPLORING SEA i LEVEL RISE Developed by: Margie Turrin, mkt@ldeo.columbia.edu As a polar explorer you and your team will be collec@ng evidence of changes occurring throughout the world that
CMIP3/CMIP5 differences: Scenario (SRESA1B vs RCP4.5) Ensemble mean Tas responses: CMIP3 = 2.8 K CMIP5 = 1.9 K CMIP5 higher average resolution
 Ensemble mean Tas responses: CMIP3 = 2.8 K CMIP5 = 1.9 K CMIP5 higher average resolution") CMIP3/CMIP5 differences: Scenario (SRESA1B vs RCP4.5) Ensemble mean Tas responses: CMIP3 = 2.8 K CMIP5 = 1.9 K CMIP5 higher average resolution Several `high-top models in CMIP5 Key question What are
CMIP3/CMIP5 differences: Scenario (SRESA1B vs RCP4.5) Ensemble mean Tas responses: CMIP3 = 2.8 K CMIP5 = 1.9 K CMIP5 higher average resolution Several `high-top models in CMIP5 Key question What are
Ice Sheets and Climate Change. William H. Lipscomb Los Alamos National Laboratory
 Ice Sheets and Climate Change William H. Lipscomb Los Alamos National Laboratory What is an expert? An expert is somebody who is more than 50 miles from home, has no responsibility for implementing the
Projecting regional sea-level changes for the 21 st century
 Projecting regional sea-level changes for the 21 st century Aimée Slangen Postdoctoral research fellow In collaboration with: Mark Carson (CEN Hamburg), Caroline Katsman (KNMI), Roderik van de Wal (IMAU),
Greenland and Antarctic ice sheets under 1.5 C global warming
 Greenland and Antarctic ice sheets under 1.5 C global warming Frank Pattyn, Catherine Ritz, Edward Hanna, Xylar Asay-Davis, Rob DeConto, Gaël Durand, Lionel Favier, Xavier Fettweis, Heiko Goelzer, Nicholas
Projecting regional sea-level changes for the 21 st century
 Projecting regional sea-level changes for the 21 st century Aimée Slangen In collaboration with Mark Carson (CEN Hamburg), Caroline Katsman (KNMI), Roderik van de Wal (IMAU), Armin Köhl (CEN Hamburg),
Northern European Sea Level Rise. Aslak Grinsted Centre for Ice and Climate Niels Bohr Institute University of Copenhagen
 Northern European Sea Level Rise Aslak Grinsted Centre for Ice and Climate Niels Bohr Institute University of Copenhagen Global Sea Level Rise The world is warming and this causes sea level to rise because:
GEOG 401 Climate Change
 GEOG 401 Climate Change Climate Downscaling GCMs have coarse resolu/on Spa
Summary for the Greenland ice sheet
 Contribution of Greenland and Antarctica to future sea level change Catherine Ritz, Gaël Durand, Fabien Gillet-Chaulet, Olivier Gagliardini, Vincent Peyaud EDGe team, LGGE, CNRS/UJF Grenoble, France Ice
How do we deal with uncertainty connected with atmospheric circulation?
 How do we deal with uncertainty connected with atmospheric circulation? Ted Shepherd Grantham Professor of Climate Science Department of Meteorology University of Reading Some addi-onal background Circula-on
Accumula'on-rate changes through the Holocene from ice-core records and radar data. Michelle Koutnik Earth and Space Sciences
 Accumula'on-rate changes through the Holocene from ice-core records and radar data Michelle Koutnik Earth and Space Sciences Outline Basics deriving accumula9on histories from ice-core records Ice and
Moderate Greenland ice sheet melt during the last interglacial constrained by present-day observations and paleo ice core reconstructions
 The Cryosphere Discuss., doi:.19/tc-16-1, 16 Moderate Greenland ice sheet melt during the last interglacial constrained by present-day observations and paleo ice core reconstructions P. M. Langebroek 1
Ensemble of Climate Models
 Ensemble of Climate Models Claudia Tebaldi Climate Central and Department of Sta7s7cs, UBC Reto Knu>, Reinhard Furrer, Richard Smith, Bruno Sanso Outline Mul7 model ensembles (MMEs) a descrip7on at face
Rapid Climate Change: Heinrich/Bolling- Allerod Events and the Thermohaline Circulation. By: Andy Lesage April 13, 2010 Atmos.
 Rapid Climate Change: Heinrich/Bolling- Allerod Events and the Thermohaline Circulation By: Andy Lesage April 13, 2010 Atmos. 6030 Outline Background Heinrich Event I/Bolling-Allerod Transition (Liu et
Schema8c Global Climate Model
 Schema8c Global Climate Model Horizontal Grid (Latitude-Longitude) Vertical Grid (Height or Pressure) NOAA/ GFDL s CLIMATE and EARTH SYSTEM MODELING Geophysical Fluid Dynamics Laboratory Understanding
Evalua&on, applica&on and development of ESM in China
 Evalua&on, applica&on and development of ESM in China Contributors: Bin Wang 1,2 1. LASG, Ins&tute of Atmospheric Physics, CAS 2. CESS, Tsinghua University 3. Beijing Normal University 4. Beijing Climate
Potential Impact of climate change and variability on the Intra-Americas Sea (IAS)
") Potential Impact of climate change and variability on the Intra-Americas Sea (IAS) Sang-Ki Lee 1, Yanyun Liu 1 and Barbara Muhling 2 1 CIMAS-University of Miami and AOML-NOAA 2 Princeton University and
Potential Impact of climate change and variability on the Intra-Americas Sea (IAS) Sang-Ki Lee 1, Yanyun Liu 1 and Barbara Muhling 2 1 CIMAS-University of Miami and AOML-NOAA 2 Princeton University and
Centennial-scale Climate Change from Decadally-paced Explosive Volcanism
 Centennial-scale Climate Change from Decadally-paced Explosive Volcanism Yafang Zhong and Gifford Miller INSTAAR, University of Colorado at Boulder, USA Bette Otto-Bliesner, Caspar Ammann, Marika Holland,
Decadal Predic+ons: State of the Science. E. Towler EaSM Mee+ng, NCAR Jan 20, 2015
 Decadal Predic+ons: State of the Science E. Towler EaSM Mee+ng, NCAR Jan 20, 2015 1 Why the emphasis on decadal predic+ons? Societal need for near term/decadal predic+ons of climate for decision support
Speleothems and Climate Models
 Earth and Life Institute Georges Lemaître Centre for Earth and Climate Research Université catholique de Louvain, Belgium Speleothems and Climate Models Qiuzhen YIN Summer School on Speleothem Science,
SUPPLEMENTARY INFORMATION
 SUPPLEMENTARY INFORMATION DOI: 10.1038/NCLIMATE1449 Multistability and critical thresholds of the Greenland ice sheet Alexander Robinson 1,2,3, Reinhard Calov 1 & Andrey Ganopolski 1 February 7, 2012 1
GEOG 401 Climate Change
 GEOG 401 Climate Change Climate Downscaling GCMs have coarse resolu/on Spa=al resolu=on of global models con=nues to improve. But, they are s=ll not sufficiently resolved to accurately represent processes
The role of the tropics in atmospheric forcing and ice sheet response in Antarctica on decadal to millennial timescales
 The role of the tropics in atmospheric forcing and ice sheet response in Antarctica on decadal to millennial timescales Eric Steig 168160160 University of Washington Earth and Space Sciences Atmospheric
Interpre'ng Model Results
 Interpre'ng Model Results Clara Deser Na'onal Center for Atmospheric Research Boulder, CO CESM Tutorial, 12 August 2016 Interpre'ng Model Results 1) What kind of model? 2) What kind of simula'on? 3) What
Patterns and impacts of ocean warming and heat uptake
 Patterns and impacts of ocean warming and heat uptake Shang-Ping Xie Scripps Inst of Oceanography, UCSD Ocean warming & circulation change Ocean heat uptake & meridional overturning circulation Global
Sea level change recent past, present, future
 Sea level change recent past, present, future Anny Cazenave LEGOS-CNES Toulouse, France CCI_Colocation meeting, ESA/ESRIN Global mean sea level rise during the 20 th century (red : tide gauges; blue :
Effect of Ocean Warming on West Antarctic Ice Streams and Ice Shelves. Bryan Riel December 4, 2008
 Effect of Ocean Warming on West Antarctic Ice Streams and Ice Shelves Bryan Riel December 4, 2008 Ice Sheet Mass Balance/WAIS Dynamics -Mass Balance = (Ice/Snow Accumulation) (Surface melting, ice outflux,
Transient response of the MOC and climate to potential melting of the Greenland Ice Sheet in the 21st century
 Click Here for Full Article GEOPHYSICAL RESEARCH LETTERS, VOL. 36, L10707, doi:10.1029/2009gl037998, 2009 Transient response of the MOC and climate to potential melting of the Greenland Ice Sheet in the
ATOC OUR CHANGING ENVIRONMENT Class 19 (Chp 6) Objectives of Today s Class: The Cryosphere [1] Components, time scales; [2] Seasonal snow
![ATOC OUR CHANGING ENVIRONMENT Class 19 (Chp 6) Objectives of Today s Class: The Cryosphere [1] Components, time scales; [2] Seasonal snow](/thumbs/95/126309683.jpg "ATOC OUR CHANGING ENVIRONMENT Class 19 (Chp 6) Objectives of Today s Class: The Cryosphere [1] Components, time scales; [2] Seasonal snow") ATOC 1060-002 OUR CHANGING ENVIRONMENT Class 19 (Chp 6) Objectives of Today s Class: The Cryosphere [1] Components, time scales; [2] Seasonal snow cover, permafrost, river and lake ice, ; [3]Glaciers and
ATOC 1060-002 OUR CHANGING ENVIRONMENT Class 19 (Chp 6) Objectives of Today s Class: The Cryosphere [1] Components, time scales; [2] Seasonal snow cover, permafrost, river and lake ice, ; [3]Glaciers and
Supporting Online Material for
 www.sciencemag.org/cgi/content/full/326/5955/984/dc1 Supporting Online Material for Partitioning Recent Greenland Mass Loss Michiel van den Broeke,* Jonathan Bamber, Janneke Ettema, Eric Rignot, Ernst
Ice Sheet Modeling and Sea Level Rise. William Lipscomb, NCAR CESM Sea Level Session 10 January 2018
 Ice Sheet Modeling and Sea Level Rise William Lipscomb, NCAR CESM Sea Level Session 10 January 2018 Ice sheets in IPCC AR4 The IPCC Fourth Assessment Report (AR4) projected 0.18 to 0.59 m of sea level
Future Climate Change
 Future Climate Change How do you know whether to trust a prediction about the future? All predictions are based on global circulation models (GCMs, AOGCMs) - model accuracy is verified by its ability to
Today s Climate in Perspective: Hendrick Avercamp ( ) ~1608; Rijksmuseum, Amsterdam
 ~1608; Rijksmuseum, Amsterdam") Today s Climate in Perspective: Paleoclimate Evidence Hendrick Avercamp (1585-1634) ~1608; Rijksmuseum, Amsterdam Observations Instrumental surface temperature records? (Le Treut et al., 2007 IPCC AR4
Today s Climate in Perspective: Paleoclimate Evidence Hendrick Avercamp (1585-1634) ~1608; Rijksmuseum, Amsterdam Observations Instrumental surface temperature records? (Le Treut et al., 2007 IPCC AR4
Nathalie de Noblet-Ducoudré. Who am I today? Some snapshots into my main results And from now on?
 Nathalie de Noblet-Ducoudré nathalie.de-noblet@lsce.ipsl.fr Who am I today? Some snapshots into my main results And from now on? Who am I today? Scien>st at the Laboratoire des Sciences du Climat et de
(c) (a) (d) (b) JJA DJF. V850 Hulu Cave. V850 Hulu Cave V1000 V1000. Dongge Cave. Dongge Cave. Lake Huguang Maar.
 (a) (d) (b) JJA DJF. V850 Hulu Cave. V850 Hulu Cave V1000 V1000. Dongge Cave. Dongge Cave. Lake Huguang Maar.") NCEP-DOE (1981-2010) TraCE21ka (a) (c) JJA Dongge Cave V850 Hulu Cave Dongge Cave V850 Hulu Cave (b) (d) DJF Lake Huguang Maar V1000 Lake Huguang Maar V1000 Supplementary Figure 1 Climatology of EASM and
NCEP-DOE (1981-2010) TraCE21ka (a) (c) JJA Dongge Cave V850 Hulu Cave Dongge Cave V850 Hulu Cave (b) (d) DJF Lake Huguang Maar V1000 Lake Huguang Maar V1000 Supplementary Figure 1 Climatology of EASM and
Continental Hydrology, Rapid Climate Change, and the Intensity of the Atlantic MOC: Insights from Paleoclimatology
 Continental Hydrology, Rapid Climate Change, and the Intensity of the Atlantic MOC: Insights from Paleoclimatology W.R. Peltier Department of Physics University of Toronto WOCE derived N-S salinity section
Prolog. Processes Causing Regional Sea Level Change
 Prolog Regional Variability: Causes for contemporary Regional Sea Level Changes Detlef fstammer Center für Erdsystemforschung und Nachhaltigkeit (CEN) Universität Hamburg Sea level is one of the climate
AMOC Impacts on Climate
 AMOC Impacts on Climate Rong Zhang GFDL/NOAA, Princeton, NJ, USA Paleo-AMOC Workshop, Boulder, CO, USA May 24, 2016 Atlantic Meridional Overturning Circulation (AMOC) Kuklbrodt et al. 2007 McManus et al.,
Past, present and future
 Southern New Jersey and Delaware sea levels: Past, present and future Benjamin P. Horton Sea Level Research Department of Marine and Coastal Science Rutgers University bphorton@marine.rutgers.edu DRIVERS
Climate Change. Unit 3
 Climate Change Unit 3 Aims Is global warming a recent short term phenomenon or should it be seen as part of long term climate change? What evidence is there of long-, medium-, and short- term climate change?
An Arctic Perspective on Climate Change
 An Arctic Perspective on Climate Change 23 Oct 2012 Gifford Miller (and many others) University of Colorado Boulder The Earth is warming How do we know? Temperature Anomaly ( C) It s a fact Global Land
SPECIAL PROJECT FINAL REPORT
 SPECIAL PROJECT FINAL REPORT All the following mandatory information needs to be provided. Project Title: Modelling Interglacial Climate Computer Project Account: Spdklang Start Year - End Year : 2014
Variability of the Atlantic Meridional Overturning Circulation (AMOC)
") Variability of the Atlantic Meridional Overturning Circulation (AMOC) Rowan Sutton Director of Climate Research UK National Centre for Atmospheric Science (NCAS) Department of Meteorology University of
Variability of the Atlantic Meridional Overturning Circulation (AMOC) Rowan Sutton Director of Climate Research UK National Centre for Atmospheric Science (NCAS) Department of Meteorology University of
Fast and Slow Response of Sea ice and the Southern Ocean to Ozone Depletion
 Fast and Slow Response of Sea ice and the Southern Ocean to Ozone Depletion Annual Minimum Sea ice extent 1979-2013 10 6 km 2 Arctic September Antarctic February Data from in passive microwave satellite
Ice sheet freshwater forcing
 Jan Lenaerts Utrecht University University of Colorado Ice sheet freshwater forcing Photo: Reijmer, 2011 Sea level meeting 5 to ~6 pm, South Bay Goal: Sea level rise and its impacts on coastal populations
Sea Level. John Church WCRP Antarctic Climate and Ecosystems CRC Centre for Australian Weather and Climate Research
 Sea Level John Church WCRP Antarctic Climate and Ecosystems CRC Centre for Australian Weather and Climate Research Sea level rose by more than 120 m since the last glacial maximum 2 Church et al., 2008
Decadal Hindcasts and Forecasts at GFDL
 Decadal Hindcasts and Forecasts at GFDL Tony Rosati T. Delworth, R. Gudgel, F. Zang, S. Zhang Key Ques;ons What seasonal decadal predictability exists in the climate system, and what are the mechanisms
IPCC Chapter 12: Long- term climate change: projections, commitments and irreversibility
 GEF4400 The Earth System Autumn 2015 23.11.2015 IPCC Chapter 12: Long- term climate change: projections, commitments and irreversibility Introduction and Background (from Chapter 10 and 11) Climate Model
Exploring The Polar Connection to Sea Level Rise NGSS Disciplinary Core Ideas Science & Engineering Crosscutting Concepts
 Exploring The Polar Connection to Sea Level Rise NGSS Disciplinary Core Ideas Science & Engineering Crosscutting Concepts Practices MS - ESS: Earth & Space Science 1. Ask questions 2. Developing and using
AMAP. Climate Change in the Cryosphere: Snow, Water, Ice and Permafrost in the Arctic (SWIPA) Assessment Summary
 Assessment Summary") Cooperative Institute for Research in Environmental Sciences University of Colorado AMAP Climate Change in the Cryosphere: Snow, Water, Ice and Permafrost in the Arctic (SWIPA) Assessment Summary Arctic
Cooperative Institute for Research in Environmental Sciences University of Colorado AMAP Climate Change in the Cryosphere: Snow, Water, Ice and Permafrost in the Arctic (SWIPA) Assessment Summary Arctic
Climate changes in Finland, but how? Jouni Räisänen Department of Physics, University of Helsinki
 Climate changes in Finland, but how? Jouni Räisänen Department of Physics, University of Helsinki 19.9.2012 Outline Some basic questions and answers about climate change How are projections of climate
Explanation of thermal expansion differences between climate models
 Explanation of thermal expansion differences between climate models Summary More than 90% of the positive Earth s energy imbalance - mainly anthropogenic as origin (Church et al. 2013) - is stored in the
AMOC Response to Climate Change: Questions after TRACE21
 AMOC Response to Climate Change: Questions after TRACE21 Zhengyu Liu University of Wisconsin-Madison TRACE21 collaborators Jiang Zhu, UW-Madison Wei Liu, Yale Univ. Esther Brady, NCAR Bette Otto-Bliesner,
Second-Order Draft Chapter 10 IPCC WG1 Fourth Assessment Report
 Second-Order Draft Chapter IPCC WG Fourth Assessment Report Figure... Multi model mean changes in a) zonal mean cloud fraction (in %), shown as a cross section though the atmosphere, and b) total cloud
Challenges for Climate Science in the Arctic. Ralf Döscher Rossby Centre, SMHI, Sweden
 Challenges for Climate Science in the Arctic Ralf Döscher Rossby Centre, SMHI, Sweden The Arctic is changing 1) Why is Arctic sea ice disappearing so rapidly? 2) What are the local and remote consequences?
Anthropogenic forcing dominates global mean sea-level rise since 1970
 Anthropogenic forcing dominates global mean sea-level rise since 1970 Aimée B. A. Slangen 1,2 *, John A. Church 1, Cecile Agosta 3, Xavier Fettweis 3, Ben Marzeion 4 and Kristin Richter 5 1 CSIRO Oceans
Understanding Paleoclimates ~ Modelling the Glacial/Interglacial Climate with Coupled GCM~
 Understanding Paleoclimates ~ Modelling the Glacial/Interglacial Climate with Coupled GCM~ Ayako Abe-Ouchi, CCSR, University of Tokyo / FRSGC 1 Introduction 2 Model description 3 Greening Sahara (mid Holocene)
An Introduction to Coupled Models of the Atmosphere Ocean System
 An Introduction to Coupled Models of the Atmosphere Ocean System Jonathon S. Wright jswright@tsinghua.edu.cn Atmosphere Ocean Coupling 1. Important to climate on a wide range of time scales Diurnal to
Future Sea Level Rise and its Implications for SIDS and LDCs
 Future Sea Level Rise and its Implications for SIDS and LDCs Bill Hare, Michiel Schaeffer, Mahé Perrette, Matthias Mengel COP17, Durban, 2 nd December Overview Part 1: Global sea level: past and future
Current Climate Science and Climate Scenarios for Florida
 Current Climate Science and Climate Scenarios for Florida Daniel Bader and Vivien Gornitz Water Utilities and Climate Change Workshop Palm Beach County Water Utilities/ Water Research Foundation June 10,
An Assessment of IPCC 20th Century Climate Simulations Using the 15-year Sea Level Record from Altimetry Eric Leuliette, Steve Nerem, and Thomas Jakub
 An Assessment of IPCC 20th Century Climate Simulations Using the 15-year Sea Level Record from Altimetry Eric Leuliette, Steve Nerem, and Thomas Jakub Colorado Center for Astrodynamics Research and Department
Changing predictability characteristics of Arctic sea ice in a warming climate
 Changing predictability characteristics of Arctic sea ice in a warming climate Marika Holland 1 Laura Landrum 1, John Mioduszewski 2, Steve Vavrus 2, Muyin Wang 3 1. NCAR, 2. U. Wisconsin-Madison, 3. NOAA
Can Arctic sea ice decline drive a slow-down of the Atlantic Meridional Overturning Circulation (AMOC)?
?") Can Arctic sea ice decline drive a slow-down of the Atlantic Meridional Overturning Circulation (AMOC)? September 2012 NASA Alexey Fedorov Yale University with Florian Sevellec (NOC, Southampton) and Wei
Can Arctic sea ice decline drive a slow-down of the Atlantic Meridional Overturning Circulation (AMOC)? September 2012 NASA Alexey Fedorov Yale University with Florian Sevellec (NOC, Southampton) and Wei
Sea level change. Eustatic sea level change. Tectono-eustasy. Tectonic control of global sea level. Global signal of sea level change Causes:
 Sea level change Important processes Global vs. local Geologic Modern Current rates of rise Observations, calculations, and models Lessons from the past Projected future changes Eustatic sea level change
Past and future climate development in Longyearbyen, Svalbard
 Past and future climate development in Longyearbyen, Svalbard Eirik J. Førland 1,2 and Ketil Isaksen 1 1). Norwegian Meteorological Institute 2). Norwegian Centre for Climate Services Svalbard Science
Climate change and variability -
 Climate change and variability - Current capabilities - a synthesis of IPCC AR4 (WG1) Pete Falloon, Manager Impacts Model Development, Met Office Hadley Centre WMO CaGM/SECC Workshop, Orlando, 18 November
Multiple timescale coupled atmosphere-ocean data assimilation
 Multiple timescale coupled atmosphere-ocean data assimilation (for climate prediction & reanalysis) Robert Tardif Gregory J. Hakim H L H University of Washington w/ contributions from: Chris Snyder NCAR
Eemian Greenland Surface Mass Balance strongly sensitive to SMB model choice
 Eemian Greenland Surface Mass Balance strongly sensitive to SMB model choice Andreas Plach 1, Kerim H. Nisancioglu 1,2, Sébastien Le clec h 3,4, Andreas Born 1,,6, Petra M. Langebroek 7, Chuncheng Guo
ESM-Snow model intercomparison
 Grand Challenge Cryosphere in a Changing Climate ESM-Snow model intercomparison C. Derksen, G. Krinner, R. Essery, M. Flanner, S. Hagemann, H. Rott Motivation Rapid snow extent changes in NH Climate change
Chapter Causes of Climate Change Part I: Milankovitch Cycles
 Chapter 19.1-19.3 Causes of Climate Change Part I: Milankovitch Cycles Climate Cycles =400 Milankovitch Cycles Milankovitch Cycles are created by changes in the geometry of Earth s orbit around the sun
Danish Meteorological Institute Scientific Report 15-05
 Danish Meteorological Institute Figure 6.2: Monthly temperature fields used to drive the spinup run. temperature data [Bindschadler et al., 2013] to drive PISM. This spinup run through the past glacial
Glacier (and ice sheet) Mass Balance
 Mass Balance") Glacier (and ice sheet) Mass Balance The long-term average position of the highest (late summer) firn line is termed the Equilibrium Line Altitude (ELA) Firn is old snow How an ice sheet works (roughly):
Glacier (and ice sheet) Mass Balance The long-term average position of the highest (late summer) firn line is termed the Equilibrium Line Altitude (ELA) Firn is old snow How an ice sheet works (roughly):
Ecole d Eté Altimétrie spatiale. Sea level variations at climatic time scales: observations & causes. Benoit Meyssignac
 Ecole d Eté 2014 Altimétrie spatiale Sea level variations at climatic time scales: observations & causes Benoit Meyssignac 1 Ecole d Eté 2014, Saint-Pierre d Oléron, 1-5 septembre 2014 Echelles climatiques
The forcings and feedbacks of rapid Arctic sea ice loss
 The forcings and feedbacks of rapid Arctic sea ice loss Marika Holland, NCAR With: C. Bitz (U.WA), B. Tremblay (McGill), D. Bailey (NCAR), J. Stroeve (NSIDC), M. Serreze (NSIDC), D. Lawrence (NCAR), S
TEMPERATURE GRADIENTS AND GLACIATION. Chris Brierley & Alexey Fedorov
 TEMPERATURE GRADIENTS AND GLACIATION Chris Brierley & Alexey Fedorov Outline Recap on the warm early Pliocene (as we have reconstructed it) Methodology to compare meridional SST gradient impacts and zonal
The Nansen-Zhu International Research Centre: Beijing, China
 The Nansen-Zhu International Research Centre: Beijing, China Vision To become an internationally acknowledged climate research and training centre with emphasis on tropical and highlatitude regions, and
becoming more reliable in climate change
 El Niño Occurs when air pressure increases in the western Pacific and decreases in the eastern Pacific Weakening the equatorial winds Water flows eastward, suppressing up-wellings, shu
A Warming Arctic: Regional Drama with Global Consequences
 A Warming Arctic: Regional Drama with Global Consequences Norway: Temperature in March was 3,8 C above the normal, 4th highest since 1900 Monthly precipitation for Norway was 120 % above the normal Temperaturein
(1) Arctic Sea Ice Predictability,
 Arctic Sea Ice Predictability,") (1) Arctic Sea Ice Predictability, (2) It s Long-term Loss and Implications for Ocean Conditions Marika Holland, NCAR With contributions from: David Bailey, Alex Jahn, Jennifer Kay, Laura Landrum, Steve
(1) Arctic Sea Ice Predictability, (2) It s Long-term Loss and Implications for Ocean Conditions Marika Holland, NCAR With contributions from: David Bailey, Alex Jahn, Jennifer Kay, Laura Landrum, Steve
Mozambique. General Climate. UNDP Climate Change Country Profiles. C. McSweeney 1, M. New 1,2 and G. Lizcano 1
 UNDP Climate Change Country Profiles Mozambique C. McSweeney 1, M. New 1,2 and G. Lizcano 1 1. School of Geography and Environment, University of Oxford. 2.Tyndall Centre for Climate Change Research http://country-profiles.geog.ox.ac.uk
Wind induced changes in the ocean carbon sink
 Wind induced changes in the ocean carbon sink Neil Swart John Fyfe Oleg Saenko Canadian Centre for Climate Modelling and Analysis, Environment Canada Ocean carbon and heat uptake workshop 14 December 2014
Introduction to Global Warming
 Introduction to Global Warming Cryosphere (including sea level) and its modelling Ralf GREVE Institute of Low Temperature Science Hokkaido University Sapporo, 2010.09.14 http://wwwice.lowtem.hokudai.ac.jp/~greve/
1.Decadal prediction ( ) 2. Longer term (to 2100 and beyond)
 2. Longer term (to 2100 and beyond)") Coordinated climate change experiments (formulated by WGCM and AIMES) to be run for assessment in IPCC AR5 Two classes of models to address two time frames and two sets of science questions: 1.Decadal
Coordinated climate change experiments (formulated by WGCM and AIMES) to be run for assessment in IPCC AR5 Two classes of models to address two time frames and two sets of science questions: 1.Decadal
Evalua&ng Snow- Albedo Feedback in Climate Models
 Evalua&ng Snow- Albedo Feedback in Climate Models Paul Kushner, Dept. of Physics, University of Toronto Collaborators: Chris Fletcher (U. Toronto) and Hongxu Zhao (Environment Canada) Richard Fernandes
Antigua and Barbuda. General Climate. Recent Climate Trends. UNDP Climate Change Country Profiles. Temperature
 UNDP Climate Change Country Profiles Antigua and Barbuda C. McSweeney 1, M. New 1,2 and G. Lizcano 1 1. School of Geography and Environment, University of Oxford. 2. Tyndall Centre for Climate Change Research
Downscaling ability of the HadRM3P model over North America
 Downscaling ability of the HadRM3P model over North America Wilfran Moufouma-Okia and Richard Jones Crown copyright Met Office Acknowledgments Special thanks to the Met Office Hadley Centre staff in the
European temperatures prior to the 20 th century fundamentally a consequence of unforced variability? (Bengtsson et al., 2006)
") 01-12-2000 1 European temperatures prior to the 20 th century fundamentally a consequence of unforced variability? (Bengtsson et al., 2006) Not really (Hegerl, Luterbacher et al. 2011 NGeo) Observations
01-12-2000 1 European temperatures prior to the 20 th century fundamentally a consequence of unforced variability? (Bengtsson et al., 2006) Not really (Hegerl, Luterbacher et al. 2011 NGeo) Observations
Present and future climates of the Greenland ice sheet according to the IPCC AR4 models
 Clim Dyn (2011) 36:1897 1918 DOI 10.1007/s00382-010-0779-1 Present and future climates of the Greenland ice sheet according to the IPCC AR4 models Bruno Franco Xavier Fettweis Michel Erpicum Samuel Nicolay
Climate change and variability -
 Climate change and variability - Current capabilities - a synthesis of IPCC AR4 (WG1) Pete Falloon, Manager Impacts Model Development, Met Office Hadley Centre WMO CaGM/SECC Workshop, Orlando, 18 November
How might extratropical storms change in the future? Len Shaffrey National Centre for Atmospheric Science University of Reading
 How might extratropical storms change in the future? Len Shaffrey National Centre for Atmospheric Science University of Reading Extratropical storms Extratropical storms Strong winds, extreme waves, storm
Paleoclimatic constraints on climate sensivity learning from paleoclimate modelling: last glacial maximum mid-holocene
 Reducing the uncertainty in the prediction of global warming Jerusalem, 12-16 January 2009 Paleoclimatic constraints on climate sensivity learning from paleoclimate modelling: last glacial maximum mid-holocene
Future sea level rise through 2100 and beyond
 Future sea level rise through 2100 and beyond Emma Stone Uncertain World Summit (Tuesday 20 October 2015) 1 Why are we interested in future sea level rise? How certain are we about the worst case scenario
Sea-level change: A scientific and societal challenge for the 21 st century John Church International GNSS Service Workshop, Sydney, Feb 11, 2016
 Sea-level change: A scientific and societal challenge for the 21 st century John Church International GNSS Service Workshop, Sydney, Feb 11, 2016 OCEANS AND ATMOSPHERE NATIONAL RESEARCH FLAGSHIP Our coastal
Understanding and projecting sea level change: improvements and uncertainties
 Understanding and projecting sea level change: improvements and uncertainties Jonathan Gregory On behalf of all the lead authors of Chapter 13, Sea level change John Church, Peter Clark, Anny Cazenave,
An assessment of key model parametric uncertainties in projections of Greenland Ice Sheet behavior
 doi:10.5194/tc-6-589-2012 Author(s) 2012. CC Attribution 3.0 License. The Cryosphere An assessment of key model parametric uncertainties in projections of Greenland Ice Sheet behavior P. J. Applegate 1*,
XVI. Warming and the cryosphere
 XVI. Warming and the cryosphere review temperature from thermometers, satellites, glacier lengths and boreholes all show significant warming in the 20th C+ reconstruction of past temperatures from corals,
Understanding and attributing climate variations: The role of energy. Kevin E Trenberth NCAR
 Understanding and attributing climate variations: The role of energy Kevin E Trenberth NCAR NCAR: attribution A way to organize a lot of research Makes it relevant to societal concerns Has some implications