CHAPTERN-III DENSITY AND DISTRIBUTION OF POPULATION
|
|
|
- Kelley Bailey
- 5 years ago
- Views:
Transcription
1 CHAPTERN-III DENSITY AND DISTRIBUTION OF POPULATION 3.1 Introduction. 3.2 Determinants of population Distribution and Density. 3.3 Trends of Population Density. 3.4 Variation in Density of Population for Parbhani District. 3.5 Rural Density of Population for Parbhani District. 3.6 Urban Density of Population for Parbhani District. 3.7 Physiological Density. 3.8 Agricultural Density. 3.9 The Distribution of Population. 75
2 Chapter - III Density and Distribution of Population. 3.1 Introduction: In the previous chapter geographical and socio economic setting of the study region, divided in to two part, A part describes the physical personality of the study region i.e. Parbhani district. This chapter includes the ovation, location and bounders, geology, physiographic, drainage, soils, vegetation, climate, etc. Part B describes the agriculture, general land use, industrial structure and transport and communication. Land holding size, irrigation, animal husbandry, resources, marketing etc. All these are the factors responsible for the distribution of population in the study region. This chapter deals with density and distribution of population in Parbhani district. In this chapter introduction, determinants of population density, trends in population density, variation in density of population, spatial variations in the density of population within the region, the density of population in rural areas, urban density of population, physiological density, agricultural density, distribution of population etc. points discussed, distribution of rural population of villages by population size etc. points analyzed. The concepts of distribution and density of population, though not identical, are so intimately related to each other that there is a genuine reason to discuss them simultaneously under the same chapter. This chapter deals with the analysis of density and distribute of population of the study region. The analysis of population distribution and density holds immense significance for population geographers, as its successful understanding holds the key to the analysis of entire demographic character of an area. 76
3 The analysis of the patterns of population distribution is fundamental to the understanding of population geography of an area; because it is the pattern of population distribution and density with which all other, characteristics of population are intimately related. The land and people constitute the two significant elements of an area, and therefore the ratio between these two is fundamental interest to all scholars concerned with population analysis 1. A comprehensive understanding of changes in various significant attributes of population demands the study of prevailing patterns of its distribution. It reveals as how to man has attributed himself, at a particular point of time in the context of his physical environment, type of economy, cultural patterns and history. The distributional patterns of population are, in fact, an eloquent expression of the analysis of all geographic phenomena operating in an area. Geographer s goal is to understand the regional differences of people on the earth s surface, which varies from one locality to another and from region to region. Thus, it has been considered as simple but extremely useful measure of population-resource relationship. However, it cannot be treated as a measure of population pressure on land because it merely spells out a simple quality 2. It is necessary not only to describe how population distributed spatially in terms of density, composition and dynamics, but also to seek reasons for the patterns of this distribution and for spatial changes in these patterns, if any. A study of population distribution is thus descriptive as well as analytical. The concept of population distribution and density is a very useful tool for the analysis of mans distribution in space 3. One of the important indices of population concentration is the density of population. The analysis of population distribution and density holds immense significance for population geographers, as its successful 77
4 understanding holds the key to the analysis of entire demographic character of an area 4. Population density is one of the basic and important population characteristics. Density of population plays an important role in the studies related to population geography. This is the outcome of collective influence of several natural factors functioning in a region. The term density of population was first used by Henry D. Harness in 1837 while preparing railway maps for Ireland. His purpose was however altogether different. This is the ratio between population and area. This is used an indicator to measure concentration of population 5. Density of population per unit of area represents the ratio of population to land 6. Thus it is a measure of the degree of population concentration. The density of population is expressed in different ways to understand the population resource relationship. These ratios have been designated as arithmetic density, physiological density, agricultural density and caloric density population and land constitute the two vital elements of an area. Hence the ratio between the two is important in all population studies. Arithmetic density is a ratio between total area and total population. It is expressed in terms of persons per square km or mile of the area. The data for such a calculation are easily available for most parts of the world. Hence such a ratio is frequently employed by geographers and other social scientists. However it cannot be used as a measure of population pressure on land, because it merely gives a simple quantitative relationship between man and land. Physiological density as compared to arithmetic density is more refined method of calculating ratio of population to land. It is a ratio between total population and total cultivated or cropped area. It is expressed in terms of number of persons per sq.km or mile, of cultivated 78
5 area. This ratio is of special significance for the region which is primarily agricultural 7. However all non-arable areas to be unproductive. Non cultivated areas have diverse used which in many cases yield considerable economic returns. Apart from that there is an implicit assumption in such a calculation that all cultivated areas are of equal quality which obviously is untenable. Another measure of land ratio devised is agricultural density. In this measure only agricultural population is correlated with the total area under cultivation. It is expressed as agricultural population per square km or mile of the cultivated area. The preceding discussion mirrors the composite role of physical and cultural determinants. In certain situation, the physical factors may play decisive role, while, in others the cultural and demographic factors May largely govern the aerial spread and degree of concentration of population. It has generally been agreed that the advancement in science and technology increases the role of non-physical determinants. Among the various cultural factors that have controlling effect upon the population spread are history of settlement, rapid urbanization and type of economy, advancement in technology, political decisions and social organizations 8 (Clarke, 1971). The changes in the distribution and density of population take place through the variations in the rate of natural increase and also through the migration between areas. Thus, the demographic factors of vital rates and migration introduce another dimension to the inventory of determinants of population distribution. Apart from these major physical, socio-cultural and demographic factors influencing the distribution and density of population, some physical and social disasters have also been mentioned as factors temporarily altering the population of the affecting areas. Earthquake, landslide, volcanic eruption, flood, severe drought, glacial advancement, 79
6 storm, epidemic, and fire constitute the physical disasters. War, genocide, forced transfer and repatriation constitutes the social disasters. The pattern of population distribution and density in an area is the product of the inter-play between the physical milieu and the society through the matrix of time 9. He also remarks that, In order to understand the meanings lying behind the contemporary patterns of population, one must wield encyclopedic knowledge of the area s physical settings, the minutes of its economic behavior, and the broader lineaments of its socio-cultural structure and virtually all aspects of its human geography The variation in size and population numbers it is difficult to compare nations directly. Moreover, it must remember that in nearly every country, there are vast differences in population densities from one region to another 10. Size and density of population are the fundamental issues and their disparities are of prime concern to population geographers. A study of population distribution should, therefore, be supplemented by a discussion on the pattern of population density. Distribution and density are the two fundamental problem of population geography. This is so because distribution and density are related to all other features of population. Distribution and density of population are analytically very important for population geography. Distribution of population is an aspect so population change which has become important in the recent years. The changes in distribution of population in space arise mainly as a consequence of change in the relative importance of economic activities of different regions, whereas, there is no direct correlation between density and progress or poverty. Density gives an idea about the human resources. A density of population will imply grater economic activities and an obvious urge for an improved standard of living, a grater struggle for existence and continuous competition. All 80
7 these are helpful for better economic life. Hence, it is necessary to the study distribution and density of the study area. High increase in the density of population is a matter of great concern as it puts an immense pressure on our natural resources and it may adversely affect the quality of life. The intent of the present chapter is to understand the meanings lying behind the density and distribution patterns of population in Parbhani district. The geographical characteristics of the study region are already discussed in previous chapter. Therefore, here we are going to discuss the spatial organization of population within the study region, with the help of two main indicators i.e. density and distribution of population, which have been analyzed in a spatio-temporal perspective. As far the study region is concerned, various factors which attribute to distributional patterns include physiographic, amount of rainfall, productivity of soil, availability of surface and underground water, agricultural and industrial development, degree of urbanization and historical background of the places. Thus, the density and distributional pattern of population is the product of natural, social, cultural, economic, historical environment. In the present chapter, an attempt has been made to find out an effect of these determinants on population distribution. Finally, the density zones have been determined for the study region. 3.2 Determinants of Population Distribution and Density: The factors which determine the pattern of population distribution and density are very complex and varied. These factors could be grouped into three broad categories. I) Geographical factors, which include climate, landforms, soils, other physical resources and space relationships. 81
8 II) Economic and social factors, which include the attitude and the aims of the people, their economic activities and techniques and their form a social organization. III) Demographic factors, which include the birth and death rates for various areas and the volume and nature of migration. These factors interact in a highly complex manner and their influence upon the distribution of population is brought about by a slow process of adaptation. These regional contrasts in the population distribution and density are governed by a variety of factors. Much has been written about the factors determining the geographical distribution of population among international region, countries national subdivisions, etc. in this regard, the United Nations (1973) population studies No.50. The Determinants and consequences of population Trends, offers perhaps the most lucid account all the factors affecting the population distribution and density may broadly be classified into three major categories of physical, socio - cultural and demographic factor. The following paragraphs deal with these factors in some detail. I) Geographical factor:- The pattern of population distribution is influenced by the physical condition, such as configuration of land, nature and degree of fertility of the soil, availability of, water, climatic condition and spatial relations. Excessively high or low temperature or precipitation influences the degree of soil erosion, vegetative growth and in turn nature of economic activities, particularly agriculture, which influences pattern of population distribution. The regions of difficult terrain and high altitude have generally low population densities. Nature of soil affects use of land in an area. This has a bearing on nature of economic activities possible in the region, which affects the distribution of population. Favorable 82
9 geographical location is a very important factor for higher density of population. The concentration of population in large cites is mainly due to geographical factor of favored location. II) Social - Cultural and economic factor:- The influence of the physical factors on distribution of population also depends on the ways of life of the people. According to James, "The significance to man of the physical features of the land is determined by culture and therefore, any change in the attitudes, objectives and technical abilities of the people inhabiting an area requires a revaluation of the significance of the land. The more complex a society becomes the less directly physical factors, influence the distribution of its population. For obvious reasons, the pattern of spatial distribution of an agricultural population is totally different from that of a population engaged primarily in non-agricultural activities. The techniques of productions are intimately related to the types of economic activities, which intern, influence the distribution of population. The steps taken to implement social policies related to the distribution of population also depend in part upon the existing form of social organization. Improved standards of living higher cost of education, greater social security and so on reduce the birth rate. Political factor are sometimes very strong for changing the distribution of population III) Demographic factor: Which include the birth and death rates for various areas and the volume and nature of migration; these factors interact in a highly complex manner and their influence upon the distribution of population is brought about by a slow process of adaptation. Changes in the distribution of population are influenced by variation in birth and death rate in different areas and variation in volume and nature of migrants between the areas. Geographical and non geographical factors play their 83
10 roles in distribution of population but none of these factors is individually responsible for any change in the pattern of population distribution in course of time. Some factors lose their significance and new complex condition crop up which may make the problem of distribution of population acquire of constant flux Trends of Population Density: The population of India at March 2011 stood at 1,210,193,422 persons. Next to china, India is the largest populated country in the world. India Contribute 17.50% of world population and surface area of nearly 32, 87,263 sq km, which account for hardly 2.42 % surface area of the world. Maharashtra state is second largest state of India in respect of population after Uttar Pradesh also second in terms of area after Rajasthan. According to the census 2011 the total population of Maharashtra stood at 112,372,972 which is 9.29 % of the total population rested on 3,07,762sq km area which is 9.6 % of total area of India. As far the study region i.e. Parbhani district is concerned, according to the 2011 census, population of the region is 1,836,086 supported by an area of 6611 sq km. If the study region compared to Maharashtra, it occupies 2.39 % of the land surface and supports 1.63 % population, of the state. Table 3.1 reveals the population density of India, Maharashtra and Parbhani district with decadal variations between 1981 and If we consider the ratio between land area and density, India has disproportionate share of the world s population in terms of the total area. India has % of the world s population on merely 2.42 % of the worlds land surface. Maharashtra and Parbhani district have fairly balanced man-land ratio. For example Maharashtra covers 9.6 % of the country s total land and supports almost same i.e % population. Whereas Parbhani 84
11 district in general shares 1.63 % population rested on nearly 2.39 % land area of the state. Table 3.1: Trends of Population Density. (1981 to 2011) India Maharashtra Parbhani District censes Year Density Decades Variation Density Decades Variation Density Decades Variation Source: Censes of India 1981,1991,2001& In terms of density of population comparing decadal census figures for the last 30 years, it is readily apparent that Parbhani district had the lowest density of population throughout the 30 year in comparison to Maharashtra. If we compare with the population density of India. All the three hierarchical regions i.e. India, Maharashtra and Parbhani district recorded almost same trends in the increase in population density (Fig. 3.1). It has been significantly noted that, where the population density for India increased % and for Maharashtra % and Parbhani district 94.67% in 30 year. If one considers the population density of these three regions, one can note very slow and constant increase in population density up to Then From 1981 onwards the density increased with considerable rate up to 2011 (Fig.3.1). First stage, from , second stage , and third stage decadal variation in population density considerably high with very rapid increase. 85
12 Population Density ( Per sons sq. km) 450 Fig.No Trends of Population Density 1981 to Decades India Maharashtra Parbhani District Source: Computed by the Author. During the decades , population density increased for India, Maharashtra and Parbhani district. Parbhani district %, India % and Maharashtra showed slightly high growth rate in population density i.e %. 86
13 The decade is known as a great unique decade in Indian census. In this decade density actually declined for all the three regions. India showed a decline of 1.2 % and Maharashtra 2.89 %, while for Parbhani district, decline was the highest i.e % (Table No 3.1). In the Decade density of India Population was decreased by 3.63%, same as of Maharashtra was decreased by 6.69% but it was raised to 12.11% density of Parbhani District. 3.4 Variation in Density of Population for Parbhani District: Over all district and tahsil level density of population were calculated for the decadal years of 1981, 1991, 2001 and In the year 2011, the total density of population for the region as overall was 292 persons per square kilometer, which has increased substantially since 1981, when it was 150 persons per square kilometer. For the year 1991, it was193 person and became as high as 226 persons per square kilometer. This trend of density clearly reveals that during last four decades, there has been consistent increase in the density of population, due to natural increase of population as well as contribution made by in-migrants to the district of Parbhani Spatial Variations in the Density of Population within the Region: The table concerned reveals, that the densities of population for various tahsils of Parbhani district vary enormously from one tahsil to another. In the year 1981, as expected, it was highest for the Parbhani tahsil due to the existence of city of Parbhani, where it was 223 persons per square kilometer. On the other hand, it was lowest for Palam tahsil, probably, due to entirely rural tahsil in the Parbhani district. The Purna, Sailu and Manwath show higher density than the regional average in the year Rest of other tahsils shows lower density than the region average (Table No.3.2). 87
14 Table No Tahsil Wise-Arithmetic Density and Decade Variation Since 1981to Sr.No. Tahsil Censes Year Sailu A.D D.V Jintur A.D D.V Parbhani A.D D.V Manwath A.D D.V Pathari A.D D.V Sonpeth A.D D.V Gangakhed A.D D.V Palam A.D D.V Purna A.D D.V Parbhani District A.D D.V Source: Censes of India District Censes Handbook of Parbhani 1918, 91, 01 & *A.D. =Arithmetic density. *D.V. =Decade variation in population density. In the year 1991, the average density for the study region as a whole was 193 persons per square kilometer. Parbhani, Purna, and Gangakhed tahsils have also shown the density of population more than region average in the year 1991(Table No.3.2). A part from this, the remaining tahsils have much lower density with compare to other thasils in the district. No doubt, the same trend was also observed in 1991, as it was for the earlier decades highest being Parbhani tahsil band lowest for them Manwath. 88
15 During the decade 1981 t o 1991 population density rate increase of all tahsils in the study region. In this decade observed of population density high increase in Parbhani tahsil (40.80%), Gangakhed (36.55%) and Purna tahsil (31.36%). But in this same period Manwath tahsil (15.28%), Sailu (20%) and Sonpeth thasils have been observed lowest growth of population density (Table No.3.2). In the year 2001, the average density for the study region as was 237 persons per square kilometer. It is followed by Parbhani tahsil as well as Purna, where the density is higher than the study region. Sonpeth being entirely rural tahsil represents the lowest density of population for the year While rest of other tahsils, are much below than the average for the district as a whole as per as the density of population is concerned in 2001.(Table No.3.2). The growth rate of population density during 1991 to 2001 declined further. In this period highest declined rate was Gangakhed tahsil (19.38%), Purna (16.05%) and Parbhani (14.69%). (Table No. 3.2). But In this same period, Pathari tahsil (0.61%), Palam and Manwath tahsil was less declined rate. In the year 2011, varies from one tahsil to another. As expected, it is highest for the Parbhani tahsil, where it was 463 persons per square kilometer and lowest for Palam tahsil, where it was as low as 233 persons per square kilometer. Gangakhed and Purna have much higher density than the average region density. Remaining other tahsils show much lower density of population than Parbhani district.there are number of factors responsible for the variations in the density of population. Some of them have already being discussed in the preceding discussion. Even though, the nature of terrain, proportion of land under agriculture, degree of urbanization and industrialization are some of the important factors 89
16 responsible for the variations in density of population in the Parbhani district. During the decade 2001 t o 2011 population density rate increase of all tahsils in the study region. In this decade observed of population density high increase in Sonpeth tahsil (34.07%), Gangakhed (30.17%) and Pathari (29.70%). But in this same period Purna tahsil and Parbhani thasils has been observed lowest growth of population density (Table No.3.2). I) Changes in Population Density (1981): A cursory glance at the map of population density in 1981 shows a decrease in density towards south, southwest and north tahsils of the study region (Fig 3.2.A). An east-west extending belt in the central part shows high to moderate population density, where as low to extreme low density was fond in the mountainous Ajantha and Balaghat zone along the north part and south part of the study region. From among the tahsils, Parbhani tahsil occupied first position with the highest density of 223 persons per sq. km area, followed by Purna (169), Manwath (157), and Sailu with 155 persons per sq. km area. At the other end of the scale, which among various tahsils had the lowest density of average density of the study region.the higher densities are observed in the tahsils, which are well developed agriculturally as well as industrially and have high proportion of urban population and the low densities are the result of rugged terrain in the north part of the region i.e. Aajntha Ghats region in the north. a. There is no any tahsil situated in the range of 251 people and above density per sq. km. b. The second range of 201 to 250 persons per sq. km covered Parbhani tahsil in Parbhani district. 90
17 c. The third range of 151 to 200 persons per sq. km covered three tahsils of the region namely Sailu, Manwath and Purna. d. The last range of 150 persons and below per sq. km comprises the largest number i.e. 5 (55.55%) of tahsils in the study region. II) Changes in Population Density (1991): In 1991, as observed in the previous decade, non-uniformity in population distribution continued even in the era of planning and development. Spatial pattern of population density of this census year showed almost similar pattern with marginal exception of high density toward the east-west center part (Fig B). As in the previous decade, east-west extending central belt continued to show high density of population, while the north and the south tahsils continued to have low density of population. During this decade, Parbhani tahsil remained at the first position with the highest population density of 314 persons per sq. km area. While Purna tahsil one-step gain and leaving behind second position with 222 persons per sq km. On the other hand, low to very low population density was noticed in the south belts of the study region. Lack of transportation, commutation and irrigation facilities main reasons of low population density of south belts study region. a. As far as, the population density ranges are concerned in the decade the tahsils were also unevenly distributed in these ranges. The highest range of 251 persons and above per sq. km included one tahsil i e Parbhani tahsil. b. The second range of 201 to 250 persons per sq. km included only one tahsil i.e. Purna tahsil. c. As far the range of 151 to 200 persons per sq. km or moderately dense regions is concerned, there were six tahsils, namely Sailu, Gangakhed, Sonpeth, Pathari, Manwath, and Jintur, which had moderate population density. 91
18 d. The last range, i.e. 150 persons and below per sq.km, included only one tahsil i.e. Palam tahsil. There was a shift of tahsils from one density range to another and it was mostly seen in the last and second last range, 4 tahsils were upgraded from the last range to second last range in during 1981 to 1991(Fig B). III) Changes in Population Density (2001): In 2001, a tahsil-wise analysis further revealed that almost all the tahsils from Parbhani district experienced an increase in population density. The interior tahsils were more populous than the marginal tahsils of the study region (Fig C). Particularly Parbhani and Purna tahsils had higher density of population than that of the remaining tahsils in the study region. Higher densities in these tahsils were due to the cumulative effect of a higher-level urbanization, transport, communication, agricultural and industrial development, development in co-operative sector and greater diversification in economic activities. a. There were two tahsils in the highest range of 251 persons and above per sq. km. This range included two tahsils namely Parbhani and Purna tahsils. b. The second range of 201 to 250 persons per sq. km covered three tahsils namely Gangakhed, Pathari, and Sailu. c. Moderate density i.e. 151 to 200 persons per sq. km was seen in four tahsils namely Manwath, Sonpeth, Jintur and Palam. d. The last range of 150 persons and below per sq. km in this period no any tahsil in this range. As far as, the population density ranges are concerned, the drastic changes were seen in the last and second last ranges. Three tahsils with increase in population density jumped in the second range, where other ranges showed very little changes from those in the previous decade. 92
19 93
20 94
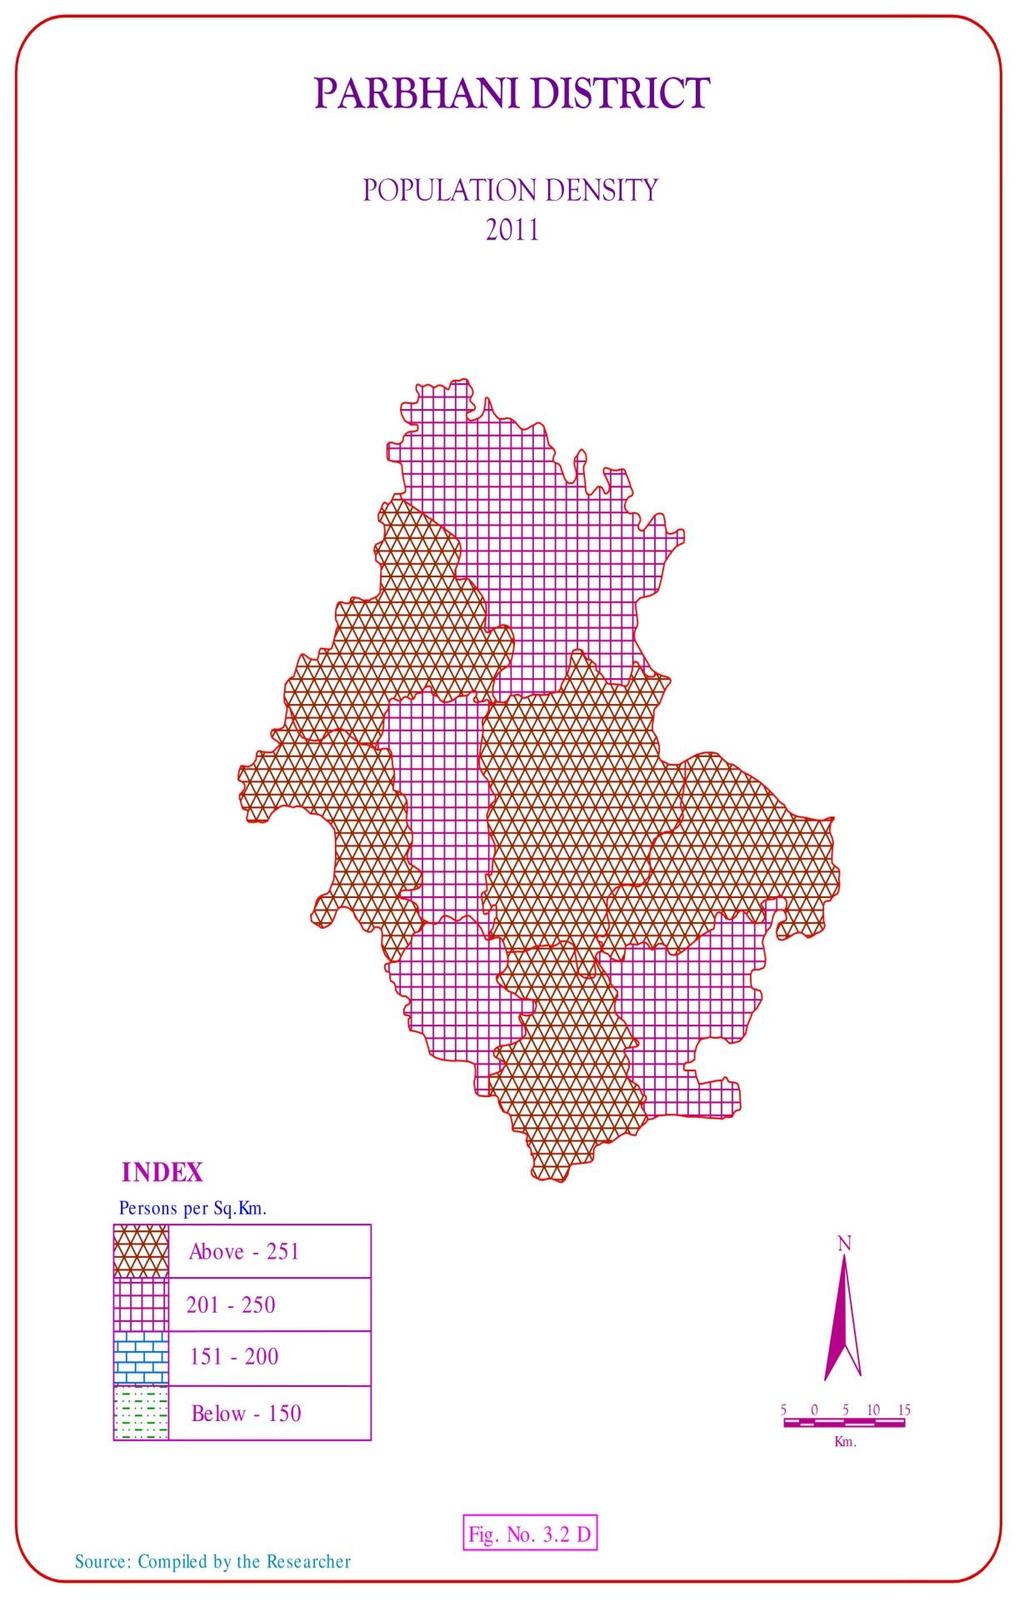
21 IV) Changes in Population Density (2011): According to fig (3.2.D), population density at tahsil level in Parbhani district in 2011 was as usual unevenly distributed as the previous decades. The tahsils, which were leading in population density in the study region in previous decades and another three thasils including in first position were still in the leading position, located in the central part of the study region, extending in west- east direction. Having rugged topography, non-availability of agricultural land, negligible industrial development, resulted in low population density. Low population density was also seen in the southern tahsils. As far the high density tahsils are concerned Parbhani, Purna, Sailu, Pathari and Gangakhed fast run due to the agricultural and industrial development, higher level of urbanization and socio-economic development. a. The densely populated area with 251 persons and above per sq. km this range included 5 tahsils namely Parbhani, Purna, Sailu, Pathari and Gangakhed, which showed maximum number of tahsils in this range according to 2011 census. b. The second highest range i.e. 201 to 250 persons per sq. km included four tahsils namely Jintur, Sonpeth, Manwath and Palam. c. Moderate density i.e. 151 to 200 persons per sq. km in this period no any tahsil in this range. d. The last range of 150 persons and below per sq. km in this period no any tahsil in this range. In the study area irrigated area is most important determinant of population density. Purna tahsil having high irrigated area in 2001 (34.81%) to total area, and density of population is high (2011). Urban population is high in Parbhani tahsil and irrigated area (23.09%) so that high density of population. But Jintur, (0.84%), Palam (0.92%), Sailu 95
22 (2.43%) less irrigated area is that low population density. Soil, economic factor, rainfall, cultivated area transport facility, affecting on population density. 3.5 Rural Density of Population for Parbhani District ( ): In order to understand, the densities of rural population for the region under study as well as for different tahsils, for the last four decades have been represented in the table 3.3 for different tahsils. Table No.3.3 Tahsil wise Rural Density of Population in Parbhani Sr. No. Tahsil District ( ) Rural Population Decade Change in % Density t o t o to Sailu Jintur Parbhani Manwath Pathari Sonpeth Gangakh ed Palam Purna Parbhani District Source: Computed by the Author
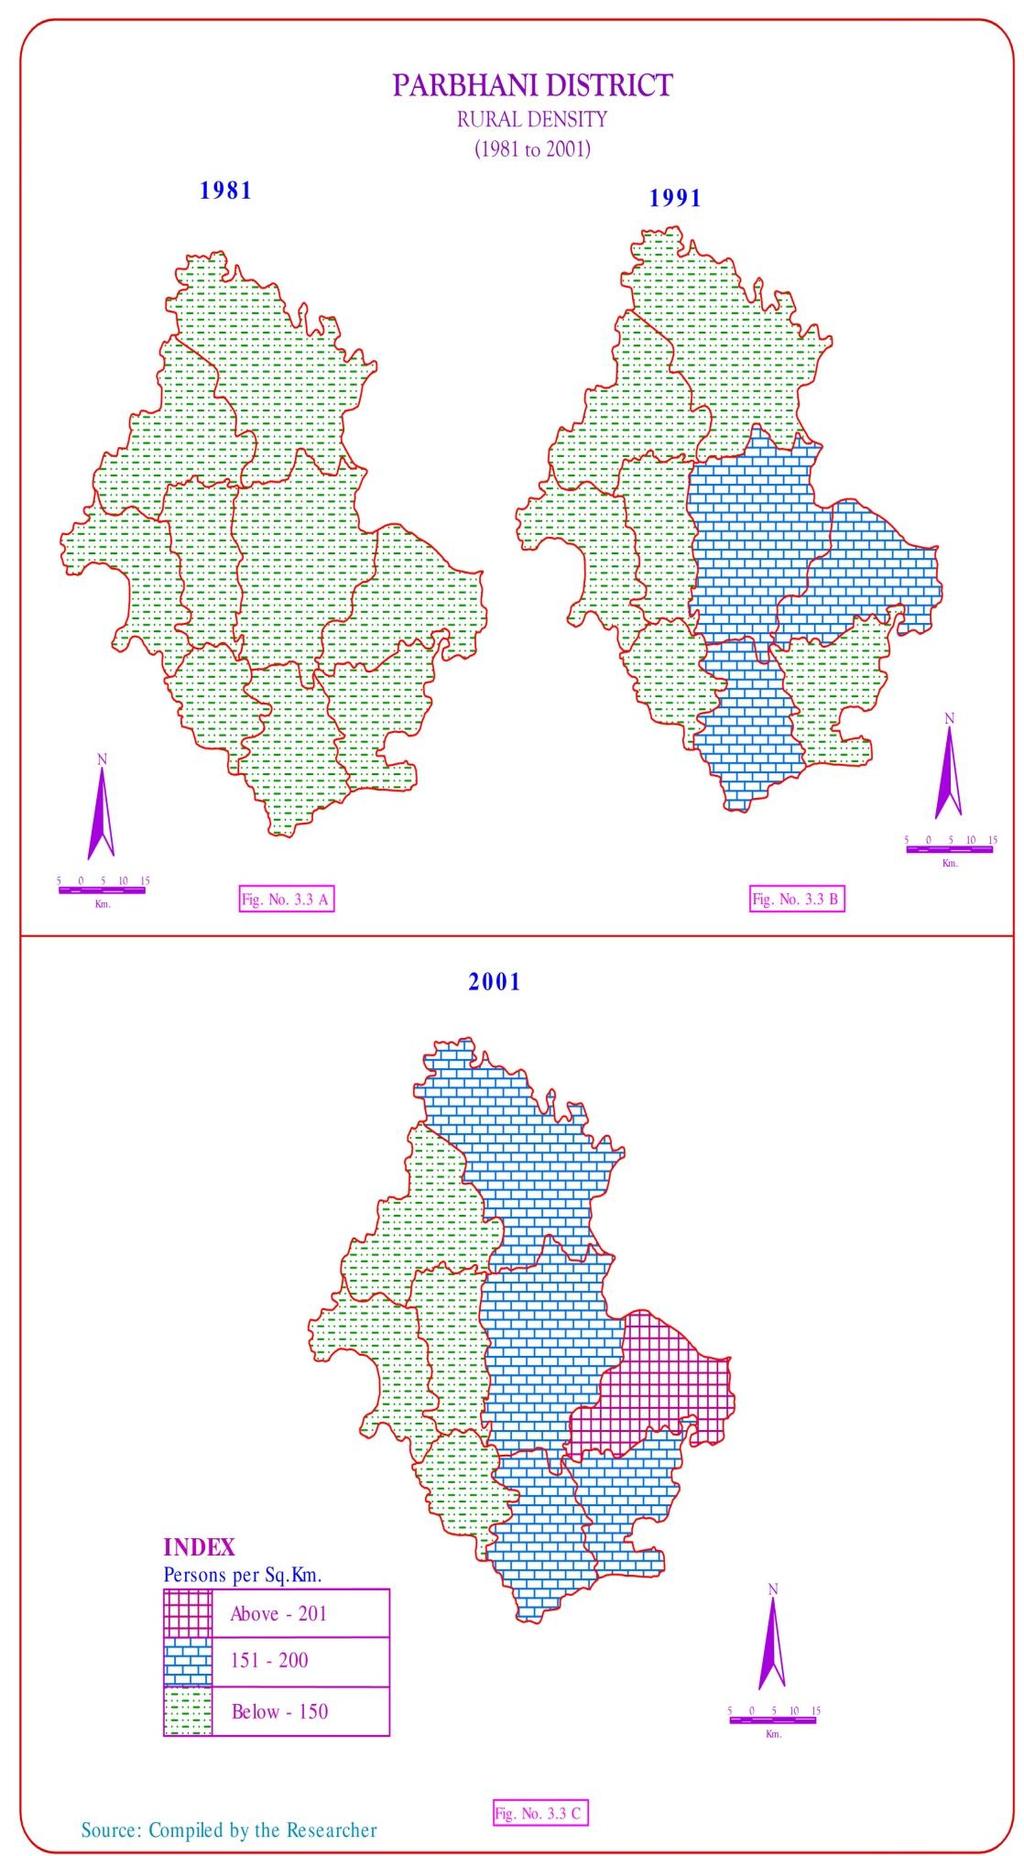
23 The rural density of population for the year 1981 was 118 persons per square kilometer, which is much lower than the total density of the region as a whole. The lowest rural density was observed for the Pathari tahsil, while the highest for the Purna tahsil. There are wide variations in the density of population within the tahsil of the Parbhani district, which ranges 98 for Pathari, and 136 for Purna in the year There are five tahsils within the Parbhani district consisting of Pathari, Jintur, Manwath, Palam and Sonpeth, representing much lower density than the average for the district. While rest of other four tahsils, have rural density of population above the region. (Fig. 3.3 A). In the year 1991, the rural density of population for region, was 148 persons per square kilometer. More or less, the similar pattern as was for the year 1981 was also found f or the spatial variation in the rural density of population in 1991 it was highest of 179 for Purna tahsil and lowest of 128 for Pathari tahsils. In the year 1991, five tahsils consisting of Pathari, Manwath, Sonpeth, Sailu, and Jintur have shown rural density of population below the region as a whole. On the other hand, remaining tahsils consist of Purna, Parbhani, Gangakhed and Palam have shown rural density above the region (Fig. 3.3 B). In the year 2001, the rural density of population for the region was 164 persons per square kilometer as against 237 persons for the total density of population. This shows that there is much increase in density of rural population during the last two decades. Further, rural density is highest for Purna tahsil, while the lowest for the Manwath tahsil in the year The agricultural prosperity and other economic allied economic activities are responsible for the high rural density of population for different tahsils of the Parbhani district. However, there are wide variations in rural density of population within the various tahsils of Parbhani district. Three tahsils show higher rural density, while 97
24 98
25 99
26 rest of six tahsils show lower rural density than the region. (Table no.3.3. & Fig No.3.3 C). For the year 2011, the rural density of population is 205 persons per square kilometer, while it was 164 persons per square kilometer in By and large similar trend was also observed for the year 2011, highest being for Purna and lowest for the Manwath. The reason behind it is the lower development of secondary and tertiary sectors (Fig No.3.3 D). Table No.3.4 Distribution and Density of Population at Village Level S N Tahsils Village Area in hector Total Population Male Femal e 1 Sailu Walour Jintur Charthana Parbhani Daithana Dens ity / sq. km. 4 Manwath Sawangi Magar Pathari Dhalegaon Sonpeth Gauli Pimpri Gangakhed Ranisawargaon Palam Navhalgaon Purna Tadkalas Average Source: Computed by the Author, Based on Field work
27 One village from each tahsil of the study region i.e. total nine villages has been selected for field work. They are selected from different environment such as hilly area, plane area, drought area, irrigated area, forest area, road side and from close to urban centre. Table No. 3.4 is showing the density and distribution of population at village level of the study area. As per field work conducted at 09 village s total population is in which male population was and female population was According to field work average density for 09 villages was 321 persons sq.km. Highest density of population was noticed in the village Daithana (450) and followed by village Ranisawargaon (425) and Tadkalas (450). Moderate density was observed in the village of Charthana (290), Sawangi Magar (287), Dhalegaon (284) and Walour (364). Lowest density of population was found in the village Gauli Pimpri (220) and Navhalgaon (240). 3.6 Urban Density of Population for Parbhani District ( ): Further, an attempt has been made to understand variations in the urban density for region as a whole, as well as for different tahsils, during the last four decades. The urban density for district as a whole was 2154, which was much higher than the rural and total density of population. It has increased consistently due to various social and economic activities and became 3226 in the year 1991, and further increased to 4299 persons per square kilometer for the year Rapid industrialization and consequent urbanization has reflected in the high urban density of population in 2011, when it increased to 5051 persons per square kilometer. During the period , urban population has been increase in 134% for the district. (Table No.3.5). Similarly, urban density of population has been calculated for different tahsils of the district, for the same period. At the very outset, it should be mentioned that one tahsil namely, Palam has no urban 101
28 settlement throughout the period, under consideration. Hence, no urban population was found in such tahsil. This has resulted, in the nil urban density of population for the concerned period. Table No.3.5 Tahsil wise Urban Density of Population in Parbhani Sr. No. District ( ) Tahsil Urban Population Density Decade Change in % to to to Sailu Jintur Parbhani Manwath Pathari Sonpeth Gangakhed Palam Purna Parbhani District Source: Censes of India, District Censes Handbook of Parbhani 1981,91,01&2011. In the year 1981, among the various tahsils of Parbhani district, Purna tahsils occupies the first position as regard to urban density of population while it is followed by Pathari and Sailu on the one hand, and the lowest urban density was recorded for Jintur tahsil. Jintur, Gangakhed and Parbhani are only three tahsils having urban density of population below the region average, while rest of tahsils, fall as regard to urban
29 103
30 104
31 density above the region average. There are wide variations as regard to urban density within the different tahsils of Parbhani district ranging between 811 for Jintur and for Purna. These variations in the density of urban population varies due to the presence of Purna city in Purna tahsil and low degree of industrialization and consequent urbanization in tahsils like Jintur and Gangakhed. (Fig.3.4 A) For the year 1991, similar trend was observed, highest for the Purna tahsil as for as urban density of population is concerned, while lowest for the Jintur tahsil. There are three tahsils namely Jintur, Gangakhed and Manwath, where urban density of population is less than average for the region under study. The highest urban population density in 2001 was recorded in Pathari tahsil followed by Purna and Sailu thasils. The lowest urban density was recorded in Jintur followed by Manwath and Gangakhed thasils due to less industrial development, and less educational facilities (Fig.3.4 C). For the year 2011, the average urban density of the region was 5051, which was increase 134% during the last four decades. The density of urban population varies within the region from 1717 in Jintur and for Pathari tahsil. Jintur, Manwath and Gangakhed tahsil represents low urban density than the region as a whole. Due to low degree of urbanization in such region while rest other tahsils have density of urban population much higher than district. 3.7 Physiological Density: Physiological density, expressed by the ratio population and arable areas a somewhat more concept of density since it eliminates from the denominator barren area production. On the other hand it, era in eliminating all productive non - arable land such as forest, natural pasture, scenic land, mining land, etc. It likewise errs in continuing to 105
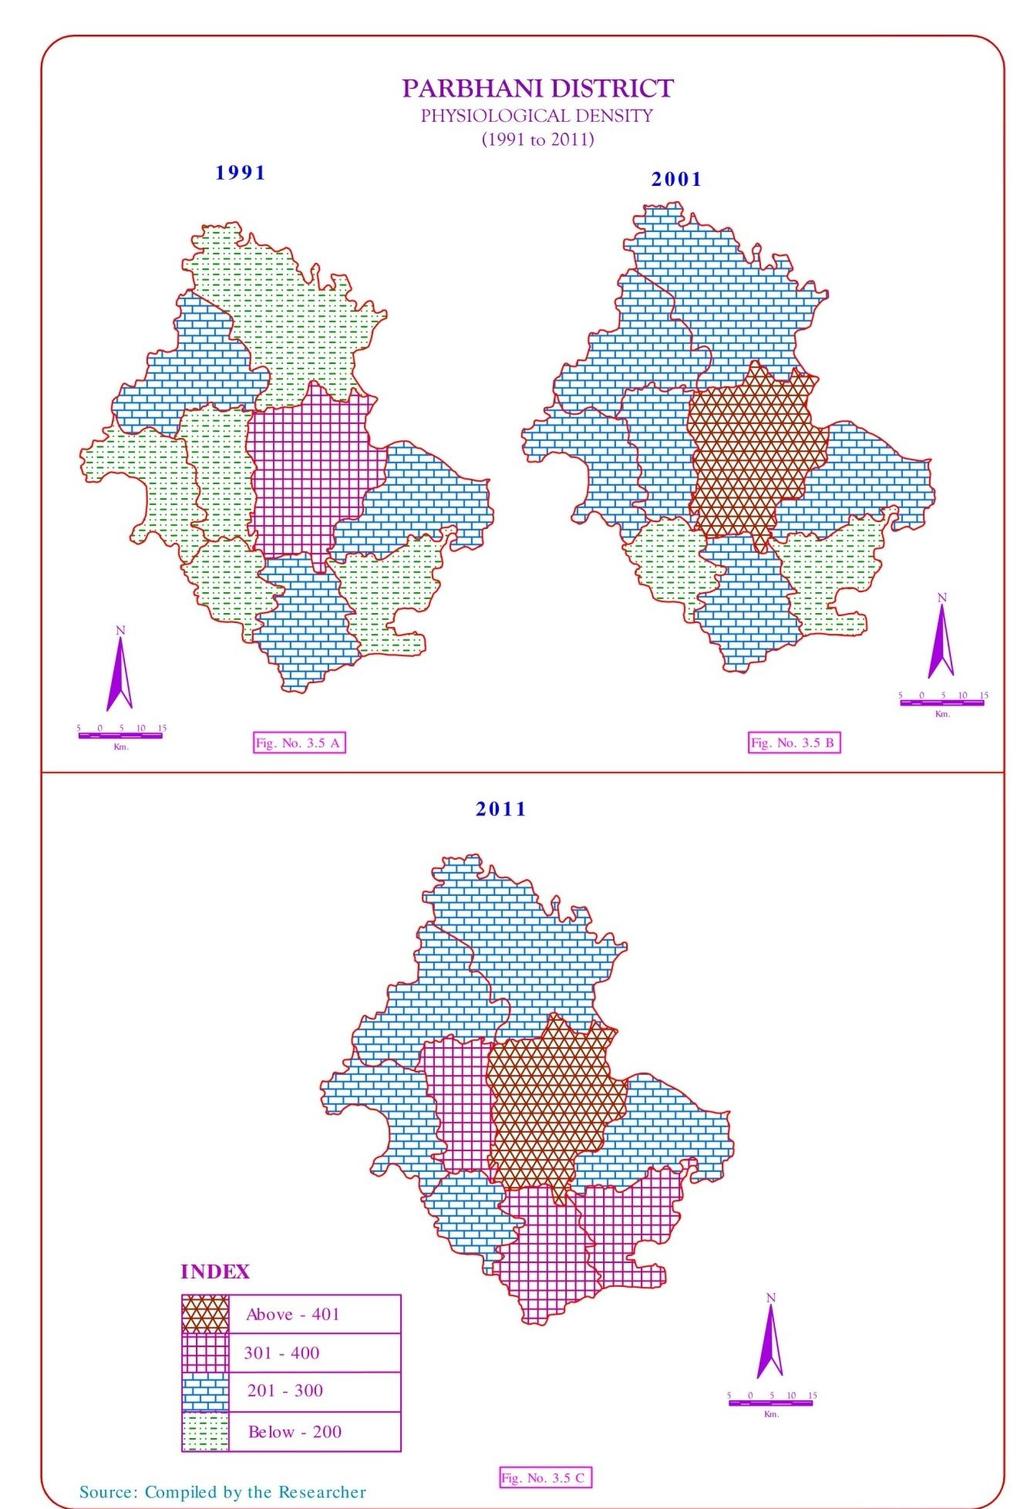
32 evaluate all arable land as having same productivity. In the physiological - density ratio 50 as to get a more realistic comparison of population density in different physical environments. The man-land ratio gives a crude density of population but in order to evaluate the population pressure on resources it is imperative to assess population in relation to the abele and cultivated area (Trewartha, 1953). Physiological density provides more refined and correct picture of population than rural density 12. This type of density is expressed by the ratio of total population and arable area. It is quite useful for the region whose economy is based on agriculture. Since Parbhani district is region of mostly rural population engaged in cultivation and livestock economy the physiological density gives an impression of pressure of population on arable land. The physiological density however does not take into account the variable productivity aspects based on factors of climate, soils, drainage characteristics etc. providing a better indicator of degree of crowding in a region compared with its physical potentials for producing food and agricultural raw materials 13. The physiological density calculated for all the tahsil of Parbhani district for the census year 1991 to The physiological density of Parbhani district 216 persons per sq. km in 1991 which increased to 345 person per sq. km in 2011.Table No. 3.6 clearly show that physiological density varies from tahsil to tahsil. I) Changes Physiological Density (1991): In the year 1991, the highest physiological density was noticed in Parbhani tahsil (352), which was followed by Purna (249), and Gangakhed (237). This was Parbhani due to thick population of this region. It was lowest in Palam (170), Jintur (179) and Sonpeth (181) tahsil. 106
33 Sr. No. Table No. 3.6 Tahsilwise Physiological density per sq. km (1991 to 2011) Tahsil Physiological Density Decade Change in % Sailu Jintur Parbhani Manwath Pathari Sonpeth Gangakhed Palam Purna Parbhani District Source: Computed by the Author. a. There is no any tahsil lies in 401 people and above density per sq. km in this period. b. The second range of 301 to 400 persons per sq. km covered Parbhani tahsil in Parbhani district. c. The third range of 201 to 300 persons per sq. km covered three tahsils of the region namely Sailu, Gangakhed and Purna. d. The last range of 200 persons and below per sq. km comprises the largest number i.e. 5 (55.55%) of tahsils in the study region.( Fig No.3.5.A). 107
34 108
35 II) Changes Physiological Density (2001): Table-3.6 shows high physiological density was recorded central and east parts in study region in The highest density was recorded in Parbhani tahsil (428). This tahsil has high urban population. The density between 201 to 300 persons was covered in six thasils of the region namely Sailu, Gangakhed, Purna, Jintur, Manwath and Pathari. The lowest density was found in Sonpeth and Palam in study region (Fig.-3.5 B). During 1991 to 2001 total physiological density was increased by 13.35%. The growth between 15% to 25% physiographical density was recorded in Parbhani (21.59%), Pathari (18.07%) and Gangakhed (15.18%) thasils. The less than 15% growth was observed in Palam, Jintur, Purna, Sailu, Manwath and Sonpeth. III). Changes Physiological Density (2011): In the year 2011 physiological density above 401 persons per sq. km was observed in Parbhani tahsil. The density between 301 to 400 persons was covered in three thasils of the region namely Gangakhed, Manwath and Palam. The third range of 201 to 300 persons per sq. km covered five tahsils of the region namely Sailu, Jintur, Pathari, Sonpeth and Purna. The last range of 200 persons and below per sq. km in this period no any tahsil in this range. The continuously change pattern of physiological density in decade 1991 to Fig.-3.5 exhibits that the highly urbanized tahsil have found high physiological density in study region indicating population pressure on agriculture land. 3.8 Agricultural Density: Agricultural density is expressed by the ratio agricultural population and cultivated area. Obviously it can serve as an index of general population density only in those regions where agricultural population from a very large proportion of the total. It represents no 109
36 advance over the other type of density on differentiating between different qualities of environment or of men. In order to assess the agricultural development in the study region the study of agricultural density is necessary. It gives clear and realistic picture of the pressure of population on land. The agricultural density of population is the result of intrinsic interest and practical value 14. Table No.3.7 Tahsilwise Agricultural Density Per sq. km (1991 to 2011). Sr. No. Tahsil Agricultural Density Decade Change in % Sailu Jintur Parbhani Manwath Pathari Sonpeth Gangakhed Palam Purna Parbhani District Source: Computed by the Author. Agricultural density in Parbhani district in 1991 was 69 persons per square kilometer. The highest density was observed in Parbhani tahsil (72 persons) followed by Purna (71) due to fertile soil of Godavari and Purna 110
37 111
38 basin. The agricultural density less than 70 was observed in three patches, one lying north in Jintur (66) and Sailu (68), other is found for in east part covering Pathari (70) and Manwath (66) tahsil and third patch in south part in Sonpeth, Gangakhed and Palam tahsils. In same period these tahsils are less irrigation and less land under cultivation (Fig.-3.6 A). Table 3.7 and Fig. No. 3.6.B gives the number of cultivators and agricultural laborers per sq. km of cultivated area in 2001 by tahsil in the district. It is seen that there are 84 persons per sq. km agricultural density. In the year 2001 the agricultural density above 90 persons per sq. km observed in Pathari (96), Purna (94), and Gangakhed tahsil (92). The highest rate of changing observed in Pathari (37.14%), Purna (32.39%) and Gangakhed tahsil (31.42%). Lowest agricultural density below the average of the region was noticed in Manwath (73), Parbhani (75%), Sonpeth (75), Palam (81), Sailu (83) and Jintur tahsil (84). Fig No.3.6.C exhibits agricultural density in 2011 for study region. The high agricultural density was recorded in Palam, Gangakhed, Manwath and Sonpeth tahsils lying south parts in study region due to irrigation facility. The agricultural density 91 to 110 was observed in northeast and southwest parts in study region in Sailu (94), Pathari (101), Purna (103) and Parbhani (104) tahsils. The lowest agricultural density was noted in north part of study region in Jintur (89) tahsil. 3.9 The Distribution of population: The Geographical factor impact on the spatial distribution of population.soil, available of water, altitude, Relief, river patters etc. All geographical factors is affecting for distribution of population. Rural areas are marked by spared distribution of population as compared with urban area. 112


39 Table No.3.8 Population and its percentage to Total Population by Residence, Parbhani District, Year Population Percentage to total population Total Rural Urban Total Rural Urban Source: Computed by the Author. Fig. No. 3.7 Population by Residence in Parbhani District, Urban Rural Urban 28.5 Rural Urban Rural Urban Rural Source: Computed by the Author. 113
40 Table No. 3.8 & Fig No. 3.7 deals with population by residence and percentage of urban and rural populations to total population in Parbhani district in 1981, 1991, 2001 and The percentage of urban population in Parbhani district from 1981 to2011 (24.92 % in 1981, % in 1991, % in 2001 and % in 2011) Shows an increasing trend constantly from 1981 to 2001 but in 2011 decreasing trend it is down by 0.72% and the rural population (75.08 % in 1981, 75.50% in 1991, % in 2001 and % in 2011) shows decreasing trend constantly from 1981 to 2001 but in 2011 an increasing trend. According to 2011 census the total population of Parbhani district is relatively high Parbhani high proportion of rural population which accounts for 68.97% of the region. There are about 31.03% people living in 8 urban centers. The population spread over of the 9 tahsil of the districts, it we superimpose the (Fig. No 3.7) distribution of population on the map showing relief -features it coincides clearly. It is clear that there is a close relationship between relief features, usability of land, pattern of transport system and native of economic activities, on the one hand and the distribution of population on the other. The population is thinly distributed due to the impact of relief particularly due to the Ajantha, (Jintur tahsil) and Balaghat (Gangakhed tahsil) ranges. The Jintur range is a chain of residual hill which is a part of the Ajantha range and has a general west- north -west to east -south- east in one line. On the other hand the population is thick concentrated in the Godavari, Dudhna, and Purna river basin, where the development of agricultural is relatively high.the impact of transmutation on the distribution of population. Purna, Parbhani, Sailu, railway station and railway line in this place high population, industrialization and urbanization on the distribution of population is clearly evident so that the 114
POPULATION CHARACTERISTICS IN SOLAPUR DISTRICT
 CHAPTER- III POPULATION CHARACTERISTICS IN SOLAPUR DISTRICT 3.1 INTRODUCTION 3.2 THE GROWTH OF POPULATION IN SOLAPUR DISTRICT 3.3 SPATIAL PATTERN OF GROWTH OF POPULATION IN SOLAPUR DISTRICT 3.4 BIRTH RATE
DENSITY OF POPULATION
 DENSITY OF POPULATION Chapter 4 The concept of population density is a simple concept of relating population size to the land area with a view to assessing crudely the pressure of population upon the resources
SPATIO-TEMPORAL ANALYSIS OF URBAN POPULATION GROWTH AND DISTRIBUTION IN AURANGABAD CITY
 International Journal of Research in Social Sciences Vol. 8 Issue 3, March 2018, ISSN: 2249-2496 Impact Factor: 7.081 Journal Homepage: Double-Blind Peer Reviewed Refereed Open Access International Journal
SRJIS/BIMONTHLY/S. A. BORUDE. ( ) APPLICATION OF SPATIAL VARIATION URBAN DENSITY MODEL: A STUDY OF AHMEDNAGAR CITY, MAHARASHTRA, INDIA
 APPLICATION OF SPATIAL VARIATION URBAN DENSITY MODEL: A STUDY OF AHMEDNAGAR CITY, MAHARASHTRA, INDIA") APPLICATION OF SPATIAL VARIATION URBAN DENSITY MODEL: A STUDY OF AHMEDNAGAR CITY, MAHARASHTRA, INDIA S.A. Borude, Assistant Professor, PG, Dept. of Geography, Ahmednagar College, Ahmednagar, Maharashtra.
APPLICATION OF SPATIAL VARIATION URBAN DENSITY MODEL: A STUDY OF AHMEDNAGAR CITY, MAHARASHTRA, INDIA S.A. Borude, Assistant Professor, PG, Dept. of Geography, Ahmednagar College, Ahmednagar, Maharashtra.
INDIANA ACADEMIC STANDARDS FOR SOCIAL STUDIES, WORLD GEOGRAPHY. PAGE(S) WHERE TAUGHT (If submission is not a book, cite appropriate location(s))
 WHERE TAUGHT (If submission is not a book, cite appropriate location(s))") Prentice Hall: The Cultural Landscape, An Introduction to Human Geography 2002 Indiana Academic Standards for Social Studies, World Geography (Grades 9-12) STANDARD 1: THE WORLD IN SPATIAL TERMS Students
Prentice Hall: The Cultural Landscape, An Introduction to Human Geography 2002 Indiana Academic Standards for Social Studies, World Geography (Grades 9-12) STANDARD 1: THE WORLD IN SPATIAL TERMS Students
World Geography. WG.1.1 Explain Earth s grid system and be able to locate places using degrees of latitude and longitude.
 Standard 1: The World in Spatial Terms Students will use maps, globes, atlases, and grid-referenced technologies, such as remote sensing, Geographic Information Systems (GIS), and Global Positioning Systems
I. PRACTICAL GEOGRAPHY A. Maps. B. Scale and measurement. C. Map reading and interpretation; D. Interpretation of statistical data;
 TOPICS/CONTENTS/NOTES OBJECTIVES I. PRACTICAL GEOGRAPHY A. Maps Ai define and identify different types and uses of maps B. Scale and measurement distances, areas reduction and enlargement, directions,
A Review of Concept of Peri-urban Area & Its Identification
 A Review of Concept of Peri-urban Area & Its Identification Ar. Manita Saxena Research Scholar Department of Architecture and Planning M.A.N.I.T, Bhopal Dr. Supriya Vyas Assistant Professor, Department
Arizona Educator Proficiency Assessments (AEPA ) FIELD 04: GEOGRAPHY TEST OBJECTIVES
 FIELD 04: GEOGRAPHY TEST OBJECTIVES") Arizona Educator Proficiency Assessments (AEPA ) TEST OBJECTIVES Subarea Range of Objectives Approximate Test Proportions I. Geographic Concepts and Skills 1 6 25% II. World Geography 7 14 34% III. United
Arizona Educator Proficiency Assessments (AEPA ) TEST OBJECTIVES Subarea Range of Objectives Approximate Test Proportions I. Geographic Concepts and Skills 1 6 25% II. World Geography 7 14 34% III. United
Topic 4: Changing cities
 Topic 4: Changing cities Overview of urban patterns and processes 4.1 Urbanisation is a global process a. Contrasting trends in urbanisation over the last 50 years in different parts of the world (developed,
M14/3/GEOGR/SP2/ENG/TZ0/XX/Q GEOGRAPHY STANDARD LEVEL PAPER 2. Monday 19 May 2014 (morning) 1 hour 20 minutes INSTRUCTIONS TO CANDIDATES
 1 hour 20 minutes INSTRUCTIONS TO CANDIDATES") M14/3/GEOGR/SP2/ENG/TZ0/XX/Q 22145203 GEOGRAPHY STANDARD LEVEL PAPER 2 Monday 19 May 2014 (morning) 1 hour 20 minutes INSTRUCTIONS TO CANDIDATES Do not open this examination paper until instructed to do
M14/3/GEOGR/SP2/ENG/TZ0/XX/Q 22145203 GEOGRAPHY STANDARD LEVEL PAPER 2 Monday 19 May 2014 (morning) 1 hour 20 minutes INSTRUCTIONS TO CANDIDATES Do not open this examination paper until instructed to do
CHAPTER VII PATTERNS OF URBANISATION
 7.1 INTRODUCTION CHAPTER VII PATTERNS OF URBANISATION Urbanisation has been regarded as an index of the level of socio-economic development of a country; hence, the study of urbanisation assumes importance
Downloaded from
 GIST OF THE LESSON: General patternsof population distribution in the world, density of population, factors influencing the distribution of population, population growth, trends in population growth, doubling
CBSE Question Paper 2010 GEOGRAPHY Class XII
 CBSE Question Paper 200 GEOGRAPHY Class XII Time allowed: 3 hours Maximum Marks: 70. Name any two areas of high latitudes in the world, where gathering economic activity is practiced. 2. Name the type
GEOGRAPHY ADVANCED LEVEL
 GEOGRAPHY ADVANCED LEVEL The syllabus is based on the belief that geography makes a valuable contribution to education. This partly derives from the nature of the questions which geographers raise and
Post Independence Trends of Urbanization and Role of Small and Medium Towns in Maharashtra- A Geographical Analysis
 Post Independence Trends of Urbanization and Role of Small and Medium Towns in Maharashtra- A Geographical Analysis A careful and systematic study of the process of urbanization and related factors is
Settlements are the visible imprint made by the man upon the physical
 Settlements are the visible imprint made by the man upon the physical landscape through the process of cultural occupancy. It is manmade colony of human being in which they live, work, and move to pursue
Wastelands Analysis and Mapping of Bhiwani District, Haryana
 Wastelands Analysis and Mapping of Bhiwani District, Haryana Virender Sihag Research Scholar, Department of Geography, OPJS University, Churu, Rajasthan ABSTRACT This study aimed at monitoring, mapping,
Chapter 10 Human Settlement Geography Book 1 Class 12
 CHAPTER 10 HUMAN SETTLEMENTS 1. RURAL, SUB URBAN AND URBAN SETTLEMENTS: This classification is common worldwide but the criteria differ from country to country. 5. Criteria for classification differs from
Amarillo ISD Social Studies Curriculum
 Amarillo Independent School District follows the Texas Essential Knowledge and Skills (TEKS). All of AISD curriculum and documents and resources are aligned to the TEKS. The State of Texas State Board
DEPARTMENT OF GEOGRAPHY B.A. PROGRAMME COURSE DESCRIPTION
 DEPARTMENT OF GEOGRAPHY B.A. PROGRAMME COURSE DESCRIPTION (3 Cr. Hrs) (2340100) Geography of Jordan (University Requirement) This Course pursues the following objectives: - The study the physical geographical
Assessment Objectives Grid for Geography - G1. Summer Application Skills Total. (a) (b) (c) (a)
 (b) (c) (a)") Assessment Objectives Grid for Geography - G1 Summer 2014 Question 1 Knowledge and Understanding Application Skills Total Key Question (a) 0 2 3 5 1.5 (b) 8 2 10 1.3 (c) 7 3 10 1.4 15 7 3 25 Question 2
Assessment Objectives Grid for Geography - G1 Summer 2014 Question 1 Knowledge and Understanding Application Skills Total Key Question (a) 0 2 3 5 1.5 (b) 8 2 10 1.3 (c) 7 3 10 1.4 15 7 3 25 Question 2
CROP COMBINATION REGION: A SPATIO-TEMPORAL ANALYSIS OF HARYANA: &
 212 CROP COMBINATION REGION: A SPATIO-TEMPORAL ANALYSIS OF HARYANA:1990-93&2009-12 Subhash chander 1 Abstract Agriculture being a basic activity plays a vital role in Indian economy. The studies of crop
AP Human Geography Free Response Questions Categorized
 AP Human Geography Free Response Questions Categorized 2002-2010 2. Population (13-17%) 3. Over the past 150 years, Europe has changed from a source to a destination region for international migration.
World Geography TEKS 2nd Nine Weeks. Unit of Study Regional Studies; U.S. and Canada Regional Studies; Latin America; and Europe
 World Geography TEKS 2nd Nine Weeks Unit of Study Regional Studies; U.S. and Canada Regional Studies; Latin America; and Europe 1) History. The student understands how geography and processes of spatial
Summary and Implications for Policy
 Summary and Implications for Policy 1 Introduction This is the report on a background study for the National Spatial Strategy (NSS) regarding the Irish Rural Structure. The main objective of the study
11/14/2017. Key City Focus: Phoenix
 Semester Project Reminder Semester Project presentations begin on Monday, November 20 (and continue on Monday, November 27 and Wednesday, November 27). See the presentation schedule posted online for your
G E O G RAP H Y Geomorphology: Climatology : Oceanography: Geographic Thought : Population Geography :
 GEOGRAPHY SYALLABUS Geomorphology: Fundamental concepts; Endogenetic and Exogenetic forces; Denudation and weathering; Geosynclines, continental drift and plate tectonics; Concept of geomorphic cycle;
Spatio-temporal changes in literacy of Nandurbar district of Maharashtra, India
 2015; 1(10): 602-606 ISS Print: 2394-7500 ISS Online: 2394-5869 Impact Factor: 5.2 IJAR 2015; 1(10): 602-606 www.allresearchjournal.com Received: 23-07-2015 Accepted: 24-08-2015 RC Ahire Geography, Late
Department of Geography: Vivekananda College for Women. Barisha, Kolkata-8. Syllabus of Post graduate Course in Geography
 India: Regional Problems and Resource management Module 11 (Full Marks 50) Unit I: Region and Regionalisation 1.1 Various bases of regionalisation of India; problems of identification and delineation.
MULTIPLE CHOICE. Choose the one alternative that best completes the statement or answers the question.
 Exam Name MULTIPLE CHOICE. Choose the one alternative that best completes the statement or answers the question. 1) One important feature of the world's population with the most significant future implications
JAMB Syllabus for Geography
 JAMB Syllabus for Geography The aim of this JAMB Geography Syllabus for Unified Tertiary Matriculation Examination (UTME), is to prepare the candidates for the Board s examination. It is designed to test
Urbanization in Japan since 1960 viewed from the DID Statistics
 Institute of Geography, Asahikawa Campus Hokkaido University of Education Asahikawa, 070-8621, Japan 1. Introduction Urban expansion is one of the most important features of land use/cover changes in the
Chapter 32. Australia & New Zealand
 Chapter 32 Australia & New Zealand Lesson 1: Physical Geography of Australia & New Zealand Landforms Australia lies between the Pacific and Indian Oceans in the Southern Hemisphere. Although an island,
Application of Remote Sensing Techniques for Change Detection in Land Use/ Land Cover of Ratnagiri District, Maharashtra
 IOSR Journal of Applied Geology and Geophysics (IOSR-JAGG) e-issn: 2321 0990, p-issn: 2321 0982.Volume 3, Issue 6 Ver. II (Nov. - Dec. 2015), PP 55-60 www.iosrjournals.org Application of Remote Sensing
Directed Reading. Section: Types of Maps
 Skills Worksheet Directed Reading Section: Types of Maps 1. What are some of the characteristics of an area shown on maps used by Earth scientists? a. types of animals, types of plants, types of minerals
Academic Vocabulary CONTENT BUILDER FOR THE PLC WORLD GEOGRAPHY
 Academic Vocabulary CONTENT BUILDER FOR THE PLC WORLD GEOGRAPHY : academic vocabulary directly taken from the standard STANDARD WG.1A analyze the effects of physical and human geographic patterns and processes
THE ROLE OF GEOSPATIAL TECHNOLOGY IN SOCIAL AMENITIES FOR RURAL DEVELOPMENT
 THE ROLE OF GEOSPATIAL TECHNOLOGY IN SOCIAL AMENITIES FOR RURAL DEVELOPMENT ANAND P. PANDIT, P.G. Department of Geography, New Arts Commerce and Science College, Ahmednagar. (MS) INDIA MADHUKAR R. KARALE
VILLAGE INFORMATION SYSTEM (V.I.S) FOR WATERSHED MANAGEMENT IN THE NORTH AHMADNAGAR DISTRICT, MAHARASHTRA
 FOR WATERSHED MANAGEMENT IN THE NORTH AHMADNAGAR DISTRICT, MAHARASHTRA") VILLAGE INFORMATION SYSTEM (V.I.S) FOR WATERSHED MANAGEMENT IN THE NORTH AHMADNAGAR DISTRICT, MAHARASHTRA Abstract: The drought prone zone in the Western Maharashtra is not in position to achieve the agricultural
VILLAGE INFORMATION SYSTEM (V.I.S) FOR WATERSHED MANAGEMENT IN THE NORTH AHMADNAGAR DISTRICT, MAHARASHTRA Abstract: The drought prone zone in the Western Maharashtra is not in position to achieve the agricultural
The Shape of the Territorial-Administrative Systems from the North-Western Region
 The Shape of the Territorial-Administrative Systems from the North-Western Region Vasile Surd, Vasile Zotic University Babeş-Bolyai, Cluj-Napoca, Romania In a social political system marked by rapid input
Chapter 32. Australia & New Zealand
 Chapter 32 Australia & New Zealand Lesson 1: Physical Geography of Australia & New Zealand Landforms Australia lies between the Pacific and Indian Oceans in the Southern Hemisphere. Although an island,
Socials Studies. Chapter 3 Canada s People 3.0-Human Geography
 Socials Studies Chapter 3 Canada s People 3.0-Human Geography Physical Geography Study of the natural features of the Earth s surface including landforms, climate, ocean currents and flora and fauna Human
Nature s Art Village
 Nature s Art Village Educational Field Trip Programs Guide To: College, Career & Civic Life C3 Framework For Social Studies State Standards Grades 3 through 5 All That Glitters Children journey back in
PÀ ÁðlPÀ gádå G À Áå ÀPÀgÀ CºÀðvÁ ÀjÃPÉë KARNATAKA STATE ELIGIBILITY TEST FOR LECTUERSHIP
 PÀ ÁðlPÀ gádå G À Áå ÀPÀgÀ CºÀðvÁ ÀjÃPÉë KARNATAKA STATE ELIGIBILITY TEST FOR LECTUERSHIP Subject: GEOGRAPHY Subject Code: 08 Note: There will be two question papers, Paper-II and Paper-III. Paper II will
The trends and patterns of urbanization in the NCT of Delhi during
 International Journal of Interdisciplinary and Multidisciplinary Studies (IJIMS), 2015, Vol 2, No.4, 27-39. 27 Available online at http://www.ijims.com ISSN: 2348 0343 The trends and patterns of urbanization
Physical Geography of the United States and Canada Chapter 5 A Land of Contrasts
 Physical Geography of the United States and Canada Chapter 5 A Land of Contrasts Land Area Together the U.S. and Canada cover more than 7 million square miles. In total area, Canada ranks 2 nd and the
DROUGHT RISK EVALUATION USING REMOTE SENSING AND GIS : A CASE STUDY IN LOP BURI PROVINCE
 DROUGHT RISK EVALUATION USING REMOTE SENSING AND GIS : A CASE STUDY IN LOP BURI PROVINCE K. Prathumchai, Kiyoshi Honda, Kaew Nualchawee Asian Centre for Research on Remote Sensing STAR Program, Asian Institute
Stillwater Area Schools Curriculum Guide for Elementary Social Studies
 Stillwater Area Schools Curriculum Guide for Elementary Social Studies Grade Four Draft March 21, 2006 Minnesota and the St. Croix Valley I. Historical Skills A. The student will acquire skills of chronological
Social Studies Continuum
 Historical Skills chronological thinking understand that we can learn about the past from different sorts of evidence begin to use historical resources apply research skills by investigating a topic in
Content Area: Social Studies Standard: 1. History Prepared Graduates: Develop an understanding of how people view, construct, and interpret history
 Standard: 1. History Develop an understanding of how people view, construct, and interpret history 1. Organize and sequence events to understand the concepts of chronology and cause and effect in the history
PERCEPTION and Focus on Maps. Focus on Maps 8/29/2014. English and Dutch Maps from the 1600s and 1680 British Maps of N. Am.
 PERCEPTION English and Dutch Maps from the 600s The Nature of New York Dutch67 Prof. Anthony Grande English 67 Copyright 04 AFG 676 and 680 British Maps of N. Am. 70 and 776 4 Focus on Maps Maps are geographers
Measuring Disaster Risk for Urban areas in Asia-Pacific
 Measuring Disaster Risk for Urban areas in Asia-Pacific Acknowledgement: Trevor Clifford, Intl Consultant 1 SDG 11 Make cities and human settlements inclusive, safe, resilient and sustainable 11.1: By
6/25/2018. Upcoming Classes After Today. Our Only Presentation Day: Monday, July 2
 Upcoming Classes After Today Tuesday (June 26): Pacific Northwest and the Northlands Wednesday (June 27): Geographic Literacy in America; Take-Home Midterm Exam #2 distributed and discussed Thursday (June
Population and Employment Forecast
 Population and Employment Forecast How Do We Get the Numbers? Thurston Regional Planning Council Technical Brief Updated July 2012 We plan for forecast growth in Population and Employment, but where do
Chapter 21 Southwest Asia: Harsh & Arid Lands
 Name Hour Chapter 21 Southwest Asia: Harsh & Arid Lands Essential Question: How has the physical geography of Asia influenced the development of these regions (i.e. history, population distribution, &
International Journal of Modern Trends in Engineering and Research e-issn No.: , Date: April, 2016
 International Journal of Modern Trends in Engineering and Research www.ijmter.com e-issn No.:2349-9745, Date: 28-30 April, 2016 Landslide Hazard Management Maps for Settlements in Yelwandi River Basin,
Unit No-1&2. Settlement Geography
 Unit No-1&2 Settlement Geography TYPES OF SETTLEMENTS Rural Settlements - agriculture as the predominant occupation. Urban settlements - principal industries are secondary and tertiary. Rural Settlement:
CHAPTER 2: KEY ISSUE 1 Where Is the World s Population Distributed? p
 CHAPTER 2: KEY ISSUE 1 Where Is the World s Population Distributed? p. 45-49 Always keep your vocabulary packet out whenever you take notes. As the term comes up in the text, add to your examples for the
Indicators of sustainable development: framework and methodologies CSD Indicators of sustainable development 1996
 Indicators of sustainable development: framework and methodologies CSD Indicators of sustainable development 1996 Keywords: mountain areas, mountain development, natural resources management, sustainable
5th social studies geography (5thsocstud_geography)
") Name: Date: 1. Many of the Native Americans who lived on the Great Plains were nomadic people. Why did they move from place to place? A. They were finding new areas to mine. B. They were looking for fertile
Name: Date: 1. Many of the Native Americans who lived on the Great Plains were nomadic people. Why did they move from place to place? A. They were finding new areas to mine. B. They were looking for fertile
Grade Level Expectations for the Sunshine State Standards
 for the Sunshine State Standards FLORIDA DEPARTMENT OF EDUCATION http://www.myfloridaeducation.com/ The sixth grade student: Time, Continuity, and Change [History] understands that historical events are
European spatial policy and regionalised approaches
 Findings of the ESPON 2006 Programme COMMIN Final Conference 26-27 April 2007 European spatial policy and regionalised approaches by Dr. Kai BöhmeB ! Territory matters Structure of presentation! Territorial
Campus: VALLEY VIEW HIGH SCHOOL Content Area: Social Studies
 Campus: VALLEY VEW HGH SCHOOL : Map Name: Grading Period: 1 1A 21A 21B 21D 21E 22A 22B 22C 22D 3A 3B Description, TEKS Concept and Description analyze the effects of physical and human ggraphic patterns
Most people used to live like this
 Urbanization Most people used to live like this Increasingly people live like this. For the first time in history, there are now more urban residents than rural residents. Land Cover & Land Use Land cover
Geography Class XI Fundamentals of Physical Geography Section A Total Periods : 140 Total Marks : 70. Periods Topic Subject Matter Geographical Skills
 Geography Class XI Fundamentals of Physical Geography Section A Total Periods : 140 Total Marks : 70 Sr. No. 01 Periods Topic Subject Matter Geographical Skills Nature and Scope Definition, nature, i)
AP Human Geography Free-response Questions
 AP Human Geography Free-response Questions 2000-2010 2000-preliminary test 1. A student concludes from maps of world languages and religions that Western Europe has greater cultural diversity than the
By Geri Flanary To accompany AP Human Geography: A Study Guide 3 rd edition By Ethel Wood
 Session 1 By Geri Flanary To accompany AP Human Geography: A Study Guide 3 rd edition By Ethel Wood WHAT IS DEMOGRAPHY? It is the scientific or statistical study of population. It comes from the Greek
LOUISIANA STUDENT STANDARDS FOR SOCIAL STUDIES THAT CORRELATE WITH A FIELD TRIP TO DESTREHAN PLANTATION KINDERGARTEN
 LOUISIANA STUDENT STANDARDS FOR SOCIAL STUDIES THAT CORRELATE WITH A FIELD TRIP TO DESTREHAN PLANTATION KINDERGARTEN Standard 2 Historical Thinking Skills Students distinguish between events, people, and
RubensteinCh. 2. Population
 RubensteinCh. 2 Population Icebreaker Imagining Billions Q1: The equator stretches approx. 25,000 miles around Earth. If each of the world s 6.8 billion people was allotted 1 yard of space. How many times
Impact of physiography, rainfall and forest cover on the spatial distribution of population in the tribal region, Nashik district.
 Page16 Journal of Basic Sciences, 2015, 3, 16-24 www.skpubs.com Impact of physiography, rainfall and forest cover on the spatial distribution of population in the tribal region, Nashik district. Ravi R.
AP HUG REVIEW WELCOME TO 2 ND SEMESTER! Annette Parkhurst, M.Ed. January, 2015
 AP HUG REVIEW WELCOME TO 2 ND SEMESTER! Annette Parkhurst, M.Ed. January, 2015 Movement Globalization Latitude & Elevation Levels of Economic Activities CONNECTIONS Human Geography Human is the geography
LOCATION, SPACE AND TIME IN GEOGRAPHY
 LOCATION, SPACE AND TIME IN GEOGRAPHY Component-I(A) - Personal Details Chand Sultana Role Name Affiliation Principal Investigator Prof. Masood Ahsan Siddiqui Department of Geography, Jamia Millia Islamia,
Global Atmospheric Circulation. Past climate change and natural causes. Global climate change and human activity
 GCSE Geography Edexcel B Revision Checklist Paper 1. Global Geographical Issues Topic 1. Hazardous Earth Key Idea I know/ understand The world s climate system Global Atmospheric Circulation Past climate
World Geography Fall 2013 Semester Review Project
 Reporting Category RC 1: History, Government and Citizenship Standard WG.1 History. The student understands how geography and processes of spatial exchange (diffusion) influenced events in the past and
DROUGHT ASSESSMENT USING SATELLITE DERIVED METEOROLOGICAL PARAMETERS AND NDVI IN POTOHAR REGION
 DROUGHT ASSESSMENT USING SATELLITE DERIVED METEOROLOGICAL PARAMETERS AND NDVI IN POTOHAR REGION Researcher: Saad-ul-Haque Supervisor: Dr. Badar Ghauri Department of RS & GISc Institute of Space Technology
Population And Settlement Part I
 Population And Settlement Part I 0011 0010 1010 1101 0001 0100 1011 4 12 Think of the earth as a living organism that is being attacked by billions of bacteria whose numbers double every forty years. Either
Norwich City Schools Social Studies 6
 Social Studies 6 Topic: Maps and Globes and Graphs and Time Transferable Concepts: change 3: Geography Geography Geographers use maps, globes, and graphs to study the Earth and everything on it. Types
GEOGRAPHY Practice Answer Paper - 2
 GEOGRAPHY Practice Answer Paper - 2 Q.1) Select the correct option and rewrite the sentence : 4 1) According to Census 2011, the average population density of India is 382 persons per sq.km. 2) The rate
Edexcel GCSE Geography A
 Edexcel GCSE Comparing the 2012 AQA GCSE specification with the new 2016 Edexcel specification This document is designed to help you compare the existing 2012 AQA GCSE specification (9030) with the new
MARS AREA SCHOOL DISTRICT CURRICULUM GRADE: Grade 4
 MARS AREA SCHOOL DISTRICT CURRICULUM GRADE: Grade 4 Course Title: Social Studies Brief Description Overview: Students will explore the history, geography, government, and economy of the United States with
SPACING OF RURAL SETTLEMENTS IN NAGAUR DISTRICT, RAJASTHAN: A SPATIAL ANALYSIS
 Journal of Global Resources Volume 5 July 2017 Page 28-33 ISSN: 2395-3160 (Print), 2455-2445 (Online) 05 SPACING OF RURAL SETTLEMENTS IN NAGAUR DISTRICT, RAJASTHAN: A SPATIAL ANALYSIS Varun Binda Assistant
GRAAD 12 NATIONAL SENIOR CERTIFICATE GRADE 12
 GRAAD 12 NATIONAL SENIOR CERTIFICATE GRADE 12 GEOGRAPHY P1 FEBRUARY/MARCH 2013 MARKS: 300 TIME: 3 hours This question paper consists of 11 pages and a 12-page annexure. Geography/P1 2 DBE/Feb. Mar. 2013
ABSTRACT One of the serious problems that India facing today is the problem of regional disparities. It results in social, economic and political
 ABSTRACT One of the serious problems that India facing today is the problem of regional disparities. It results in social, economic and political instability. The current tension and strain in the Indian
Chapter 27. Bhutan, Maldives, Nepal, & Sri Lanka
 Chapter 27 Bhutan, Maldives, Nepal, & Sri Lanka Physical Geography of Bhutan, Maldives, Nepal & Sri Lanka Landforms Their locations on the fringe of South Asia means their physical and human geography
The Cultural Landscape: Introduction to Human Geography Chapter 1 Thinking Geographically Chapter 2 Population
 The Cultural Landscape: Introduction to Human Geography Chapter 1 Thinking Geographically Chapter 2 Population 1) Scale is A) the system used by geographers to transfer locations from a globe to a map.
Flood hazard mapping in Urban Council limit, Vavuniya District, Sri Lanka- A GIS approach
 International Research Journal of Environment Sciences E-ISSN 2319 1414 Flood hazard mapping in Urban Council limit, Vavuniya District, Sri Lanka- A GIS approach Abstract M.S.R. Akther* and G. Tharani
Fifth Grade Social Studies Major Instructional Goals
 Fifth Grade Social Studies Major Instructional Goals We exist for the academic excellence of all students. December 2007 1 Rationale The purpose of the social studies program is to prepare young people
DATA DISAGGREGATION BY GEOGRAPHIC
 PROGRAM CYCLE ADS 201 Additional Help DATA DISAGGREGATION BY GEOGRAPHIC LOCATION Introduction This document provides supplemental guidance to ADS 201.3.5.7.G Indicator Disaggregation, and discusses concepts
Spatiotemporal Analysis of Noida, Greater Noida and Surrounding Areas (India) Using Remote Sensing and GIS Approaches
 Using Remote Sensing and GIS Approaches") Spatiotemporal Analysis of Noida, Greater Noida and Surrounding Areas (India) Using Remote Sensing and GIS Approaches Gopal Krishna* Indian Agricultural Research Institute, New Delhi, India ABSTRACT Spatiotemporal
Spatiotemporal Analysis of Noida, Greater Noida and Surrounding Areas (India) Using Remote Sensing and GIS Approaches Gopal Krishna* Indian Agricultural Research Institute, New Delhi, India ABSTRACT Spatiotemporal
TOPIC 8: POPULATION DISTRIBUTION AND URBANIZATION
 TOPIC 8: POPULATION DISTRIBUTION AND URBANIZATION Concept of population distribution Factors affecting population distribution and density Urbanization: Concept and issues associated Introduction WORLD
Subject Area: Geography
 Long Term Planning Overview Key Stage 3 Subject Area: Geography Academic : 08-9 7 Assessment Your Island Home the physical and human geography of the UK and will investigate weather patterns, population
CHANGES IN THE STRUCTURE OF POPULATION AND HOUSING FUND BETWEEN TWO CENSUSES 1 - South Muntenia Development Region
 TERITORIAL STATISTICS CHANGES IN THE STRUCTURE OF POPULATION AND HOUSING FUND BETWEEN TWO CENSUSES 1 - South Muntenia Development Region PhD Senior Lecturer Nicu MARCU In the last decade, a series of structural
Pacemaker World Geography and Cultures. correlated to. Louisiana Social Studies Grade Level Expectations: World Geography Geography Grades 9-12
 Pacemaker World and Cultures correlated to Louisiana Social Studies Grade Level Expectations: World Grades 9-12 Pacemaker World and Cultures Pearson Learning Group correlated to Louisiana Social Studies
Groveport Madison Local School District Sixth Grade Social Studies Content Standards Planning Sheets
 Standard: Citizenship Rights and Responsibilities A. Show the relationship between civic participation and attainment of civic and public goals. 1. Explain how opportunities for citizens to participate
TEKS: 1A, 2A, 6B, 9A, 13A, 18A
 SOCIAL STUDIES World Geography Curriculum Based Assessment (CBA) #5 TEKS: 1A, 2A, 6B, 9A, 13A, 18A World Geography, CBA 5, 5th Six Weeks WG 1.A Analyze the effects of physical and human geographic patterns
Development of modal split modeling for Chennai
 IJMTES International Journal of Modern Trends in Engineering and Science ISSN: 8- Development of modal split modeling for Chennai Mr.S.Loganayagan Dr.G.Umadevi (Department of Civil Engineering, Bannari
This table connects the content provided by Education Perfect to the NSW Syllabus.
 Education Perfect Geography provides teachers with a wide range of quality, engaging and innovative content to drive positive student learning outcomes. Designed by teachers and written by our in-house
Anne Buisson U.M.R. E.S.P.A.C.E. Ater, University of Provence
 LITERACY AND RELIGION : SOME GEOGRAPHICAL LINKS Anne Buisson U.M.R. E.S.P.A.C.E. Ater, University of Provence The idea of this paper is to understand links between literacy and religion in India, keeping
AP Human Geography Unit 7a: Services Guided Reading Mr. Stepek Introduction (Rubenstein p ) 1. What is the tertiary sector of the economy?
 1. What is the tertiary sector of the economy?") Public Business Consumer AP Human Geography Unit 7a: Services Guided Reading Mr. Stepek Introduction (Rubenstein p 372 374) 1. What is the tertiary sector of the economy? 2. What is a service activity?
Public Business Consumer AP Human Geography Unit 7a: Services Guided Reading Mr. Stepek Introduction (Rubenstein p 372 374) 1. What is the tertiary sector of the economy? 2. What is a service activity?
STAAR Vocabulary Words extracted directly from the standard and/or associated with the instruction of the content within the standard.
 STAAR Vocabulary Words extracted directly from the standard and/or associated with the instruction of the content within the standard. READINESS STANDARDS - World Geography (WG.1) History. The student