CHAPTER VII PATTERNS OF URBANISATION
|
|
|
- Emil Wilcox
- 5 years ago
- Views:
Transcription
1 7.1 INTRODUCTION CHAPTER VII PATTERNS OF URBANISATION Urbanisation has been regarded as an index of the level of socio-economic development of a country; hence, the study of urbanisation assumes importance in the population studies. Due to this importance, the study of patterns of urbanisation in the study area i.e. Pune Division is presented in this chapter. The degree of urbanisation in an area is a fair index of level of its socio-economic development. It is in this context that the population geographers have their concentration in the study of urbanisation (Chandana, 2001). Urbanisation refers to the population of a nation living in urban areas, which is very comprehensive process. Urbanisation as a process reveals itself through temporal, spatial and sectoral changes in the demographic, social, economic, technological and environmental aspects of life in a region (Ramchandradu et all, 2004). Considering all aspects of urbanisation Riessman interprets urbanisation as the whole process of change and its consequences, when a society gets transformed from an agrarian economy to an industrial economy and from a small homogeneous society to a large heterogeneous mass (Riessman, 1964). Urbanisation has been increasing ever since the emergence of the first urban settlement. The magnitude of urbanisation is directly correlated with the increasing rate of urban functions, where in the role played by science and technology is more important, which ultimately results in the multiplication of functions and leads to further diffusion of urban culture. The determinants of urbanisation can broadly be categorised into three categories of economic, social and demographic determinants. The economically rooted determinants are the type of economy, the degree of commercialisation of agriculture, the extent of diversification of economy, the changing size of agricultural landholdings, the stage of economic advancement and the degree of development of means of transportation and communication. The social factors that determine the nature and magnitude of urbanisation are the degree of 218
2 socio-economic awaking, the social value system, the stage of technological advancement, the public policies and the Government decisions. Among the demographic factors, the rate of population growth, magnitude of migration and pressure of population are significant. The preceding discussion reveals that urbanisation is concerned mainly with the growth of urban population. However, there are centripetal as well as centrifugal forces at work at various stages of urbanisation. The centripetal forces are those that tend to agglomerate economies and societies, while the centrifugal forces impede agglomerative tendencies and tend to scatter population. The centrifugal forces came into operation more at a high level of urbanisation, as is the case with the developed economies on the other hand, in case of the less developed economies; the centripetal forces may still be at work (Meadows, 1975). The intent of the present chapter is to understand the whole process of urbanisation in Pune Division. In the present chapter, we have discussed the spatial organisation and temporal changes of urban population within the study region from a geographical point of view. Firstly, a comparative analysis has been made in between India, Maharashtra and Pune Division for pre-independence period (1901 to 1951), early post-independence period (1951 to 1971) and late post-independence period (1971 to 2001). A district wise analysis is also made comparing the districts namely Pune, Satara, Sangli, Solapur and Kolhapur during the same period. For tahsil level study, to measure the degree of urbanisation namely percentage distribution method is used. In the percentage distribution method, the percentage of urban population to total population is considered as an index of degree of urbanisation. A positive correlation between proportion of urban population and degree of urban population is presumed by this method, and it allows fair degree of comparability both in space and in time, through constructing choropleath maps to represent these percentages. Percentage distribution helps in understanding the regional imbalances in urban development in the study region. 219
3 7.2 MEANING OF URBANISATION The most important problem, which the population geographers face in the study of urbanisation, is that of defining an urban settlement. In India an urban area is defined as follows, I. All places with a municipality, municipal corporation, cantonment board or notified town area committee etc. II. All other places, which satisfy the following criteria, a. a minimum population of 5000 b. at least 75 per cent of male working population engaged in non agricultural activities and c. a density of population of at least 400 persons per sq km In addition, the Director of Census Operation, in consultation with Registrar General s Office, also permitted to classify marginal cases as urban, taking into consideration the local circumstances. Such marginal cases, which could have qualified as urban units, would include major project colonies, new area of intensive industrial development, railway colonies and important tourist centres etc. It will be noticed form the above definition that criterion b would generally include places which would otherwise have been consideration as rural i.e., villages. Places, which defined as urban because they satisfy criterion b, are for convenience, referred to as census towns or non-municipal towns. This is to distinguish them from what considered as statutory towns under criterion a. Thus, there are two types of towns in India. First, those, which are town by virtue if a statutory notification, known as municipal towns. Second, those, which considered urban based on various criteria at the direction of the census operation, known as census town or non-municipal town. The concept of Urban Agglomeration (UA) and Out-Growth (OG) are developed and adopted at the time of 1971 (Census of India, 2001). To avoid this variability in the definitions of an urban centre and to make international data comparable, the United Nations categorised urban units into the following six distinct classes (United Nations, 1958), 220
4 Class I : 1,00,000 and above Class II : 50,000 to 99,999 Class III : 20,000 to 49,999 Class IV : 10,000 to 19,999 Class V : 5,000 to 9,999 Class VI : Less than 5,000 Geographers, however, are not only concerned with the process of urbanisation but also with a wide range of spatial implications, which this process carries with it. This process, thus, immediately leads to the multiplication of points of concentration and to and increase in the size of individual concentrations, both of which have far-reaching implication in terms of spatial interaction. Increasing degree of population concentration as one of the most conspicuous aspects of urbanisation, which refers to the extent of which an area is urbanised. High increase in the urban population is a matter of great concerns as it puts an immense pressure on our natural resources and it may adversely affect the quality of life in the urban places. 7.3 TRENDS OF URBANISATION Last few centuries witnessed very rapid growth of urban population on the world scenario. The rate of growth of urban population was only gradual up to the industrial revolution, since then it has been increasing on an accelerated rate. It closely linked up with improved agricultural technique, industrialisation and increased volume of trade. At the beginning of the twentieth century is percent of the world population lived in urban areas. By the year 1950, this proportion increased up to almost 30 per cent and it accepted to reach might be up to 61 per cent by the year Table 7.1 shows urban population and trends of urbanisation in India, Maharashtra and Pune division from 1901 to On comparing the decadal census figures for the last 100 years, it is apparent that Maharashtra had the highest urban population throughout the century in comparison to India and Pune Division. India had slightly low proportion of urban population than 221
5 Maharashtra and Pune Division in the whole investigation period i.e., from 1901 to As far the urban population of Pune Division is concerned, it is much higher than the urban population of India and slightly lower than that of Maharashtra. In the last ten decades it was extended only once in the decade i.e than Maharashtra. Table 7.1 Trends of Urbanisation (1901 to 2001) India Maharashtra Pune Division Decades Urban population* Percentage to total Growth rate (%) Urban population* Percentage to total Growth rate (%) Urban population* Percentage to total Growth rate (%) Note : * Population in Lakhs Source : Census of India of concern years and concern districts 222
6 According to Table 7.1, all the three hierarchical regions i.e. India, Maharashtra and Pune Division recorded almost the same trend and increase in urban population in the investigation period. During 1901, urban population of India was lakh and it increased up to lakh in the decade 2001, recording an increase by 11 times. Over 32 lakh population of Maharashtra had urban residence in 1901, which increased up to lakh during In the same period, the urban population of Pune Division increased from 6.9 lakh to 75.1 lakh. In this period, the urban population of both Maharashtra and Pune Division increased by 11 to 12 times. It means that, though the figures of urban population in absolute number for all the three regions in the investigation period differ markedly, the increase of urban population was the same i.e. by about 12 times. Figure 7.1 depicts the decadal growth of urban population from 1901 to 2001 for all the three hierarchical regions, while the figure 7.2 explains the decadal growth of urban population in India, Maharashtra and Pune Division for the same period. The decadal growth of urban population recorded a gradual increase in the whole investigation period for all the three regions, while growth rate depicted some ups and downs or a fluctuating trend in the last 10 decades for all the three regions. In the pre-independence period, the growth rate of urban population increased gradually. The decade showed the highest growth of the century for all the three regions. Then the decades and recorded an uneven trend in growth rate of urban population and finally, from up to the decadal growth declined considerably for India, Maharashtra and Pune Division. The figure 7.2 portrayed three stages of growth rate of urban population. The first stage is pre-independence period, which recorded a steady increase. The second stage, early post-independence period, which witnessed an uneven increase, while in the third stage i.e. late post-independence period through the absolute number of urban population increased alarmingly, the growth rate of urban population declined showing downward trend for all the three hierarchical regions. 223
7 As far, the pre-independence and post-independence period is concerned; the decanal growth of urban population and the growth rate of urban population recorded some contrasting trends for all the three regions. In the pre-independence period i.e. from 1901 to 1941, the actual urban population or the percentage of urban population recorded very steady and even increase, while the post-independence period witnessed an alarming increase in both actual urban population and percentage of urban population. In the pre-independence period, the urban population increased 1.70, 1.76, and 1.71 times for India, Maharashtra and Pune Division respectively. In the post-independence period India recorded highest increase (4.6 times), while, Maharashtra and Pune Division recorded 4.46 and 3.7 time increase in the urban population. Growth rate of urban population is also quite different in the pre and post independence period. In the pre-independence period, the growth rate of urban population was low, steady and increasing for all the three regions, while during the post-independence period the growth rate of urban population was declining for India, Maharashtra and Pune Division. In the pre-independence period, growth rate of urban population was per cent and it increased up to per cent during the post-independence period. 224
8 Maharashtra also showed some trend of highest growth rate in the post-independence period, it increased from per cent up to per cent. Pune Division was also not behind, with per cent increase in the pre-independence period and per cent during the post-independence period. In the pre-independence period due to very low industrialisation, lack of civic amenities, poor employment opportunities, poor educational facilities, very poor transport services, the growth of urban population in terms of absolute number and growth rate was very behind in comparison to postindependence period. In the latter phase of investigation period i.e. after independence development in agriculture, industry, education, transportation, civic facilities, natural growth rate and migration increased considerably supporting a base for urban population PRE-INDEPENDENCE PERIOD At the beginning of the present century, it pointed out that lakh people in India had urban residence. In Maharashtra lakh population and in Pune Division 6.9 lakh population according to 1901 census lived in towns. In terms of percentage of urban population to total population a small portion that is, 10.8 per cent lived in urban centres of India, some 16.6 per cent population of Maharashtra and 15.8 per cent population of Pune Division resided in the urban centres. This poor state of urbanisation was due to low industrialisation, limitations of religious and administrative functions. As far the comparison, in that decade for the three regions is concerned, Maharashtra had the highest percentage of urban population (16.6 %), followed by Pune Division (15.8 %) and India (10.8 %). By 1911, the proportion of urban population for India declined to 10.3 per cent from 10.8 per cent in The absolute number of urban population has increased form lakh to lakh, recording a growth rate of 0.35 per cent. The actual urban population of Maharashtra increased from lakh to lakh, with a growth rate of 0.99 per cent. The proportion of urban population declined from 16.6 per cent to 15.1 per cent. As far the Pune 225
9 Division is concerned there was a decline in the percentage of urban population to total population as well as in the absolute number of urban population also. Growth rate also recorded a negative trend as far the decade was concerned. In this decade, urban population declined from 6.9 lakh to 6.3 lakh along with the decline in the percentage of urban population from 15.8 per cent to 14.4 per cent. In this decade growth rate for Pune Division was -8.7 per cent, which was an erupting figure for all the three regions in the whole investigation period. In this census period ( ), there was a very low growth of urban population in absolute number and in percentage of urban population for all the three regions i.e. India, Maharashtra and Pune Division. There was an actual decline and negative growth rate in urban population of Pune Division, which was due to the increase in mortality as a result of epidemics like plague, cholera, small pox, influenza, malaria, etc. It was also affected the movement of people towards the cities; many people migrated to nearby villages. The epidemics were brought under control during the decade 1911 to The actual urban population and percentage of urban population increased along with notable acceleration in the percentage of growth rate for all the three regions. The urban population for India increased to lakh, and for Maharashtra, it was lakh. Number of urban dwellers in Pune Division also increased from 6.3 lakh to 7.5 lakh. In the same decade, percentage of urban population also increased specifically, which was 11.2 per cent for India, 18.5 per cent for Maharashtra and 17.8 per cent for Pune Division. Growth rate of urban population showed some dynamic increase for all the three regions. India recorded a growth rate of 8.29 per cent, while, the growth rate of Maharashtra and Pune Division was per cent and per cent respectively. In this decade, Maharashtra was far ahead of India and Pune Division in the percentage of urban population and Pune Division was having the highest growth rate of urban population as compared to the growth rates of the state and also of the nation. Up to 1931, the growth of urban population in the country has been fluctuating from decade to decade. The year 1931 marked a significant 226
10 demographic divide in the history of urban growth in the country, with the actual growth rate of urban population stared exceeding a natural rate of population growth. In India lakh, people had urban residence, while, lakh people in Maharashtra and 9.2 lakh people in Pune Division lived in the urban centres in the decade On comparing proportional figures of urban population in this decade, Pune Division had the highest urban population (18.8 %), followed by Maharashtra (18.3 %) and India (12.0 %). As the growth rate of urban population is concerned along with percentage of urban population, Pune Division recorded the highest growth rate i.e per cent. India recorded more than double (19.12 %) growth rate from that of the previous decade, while, Maharashtra recorded the lowest growth rate (15.56 %) as compared to the growth rate of urbanisation of India and Pune Division. The growth of urban population was augmented slowly during the decade 1941, for India, Maharashtra and Pune Division lakh population of India rose to lakh during the decade The level of urbanisation of India was 13.9 per cent and the growth rate was per cent, which was the highest as compared to those of Maharashtra (27.1 %) and Pune Division (28.26 %). In this decade the urban population of Maharashtra was lakh with 21.1 per cent level of urbanisation, while, the urban population of Pune Division during this decade was 11.8 lakh and the level of urbanisation was the same as that of the State i.e per cent EARLY POST-INDEPENDENCE PERIOD It should, however, be noted that during the inter-censual period 1941 to 1951, urban population increased quite rapidly due to the influx of refugees from Pakistan to many urban centres in India. Because of the partition of the country in 1947, large number of people came to India. A number of colonies were established in the vicinities of big cities to accommodate them and it helped the process of urbanisation. Therefore, by 1951, the urban population increased with some extra pace for all three regions i.e. India, Maharashtra and Pune Division. The census of 1951 recorded lakh urban population in 227
11 India with 17.6 per cent level of urbanisation. The growth rate during this decade was per cent, which was almost 10 per cent more than that in the previous decade. Urban population in Maharashtra, in the decade was lakh, which increased with the growth rate of per cent and level of urbanisation was 28.7 per cent. With the growth rate of per cent, Pune Division recorded 20.3 lakh urban population and level of urbanisation was 29.3 per cent. According to 1951 census, the growth rate of urban population for all India, Maharashtra and Pune Division were dynamically high through out the investigation period i.e. from 1901 to Continuous increase in the growth rate of urban population was bringing to a standstill by the end this decade. The decade , recognised for its unique characteristic of rapid fall in the growth rate as well as a drastic decrease in the percentage of urban population also. It should be mentioned that, the fall in the growth rate and decrease in the percentage of urban population was due to a conceptual change in the definition of the urban centre in India. India was more rationalised and made strict changes at the time 1961 census. Consequently, a large number of towns were declassified and number of small towns lost their identity as urban centres. During this inter-censual period, the urban population increased very marginally. The growth rate was very slow and the percentage increase of urban population in the total population was remarkably low for India, Maharashtra and Pune Division. The urban population of India increased up to lakh with the growth rate of per cent and the level of urbanisation was 18.0 per cent. Maharashtra also recorded less than half growth rate than that of the previous decade i.e per cent. The percentage of urban population to total population was 28.2 per cent and the actual urban population increased up to lakh. Pune Division recorded the lowest growth rate (4.43 %) in this decade, and the percentage of urban population was 24.7 with having 21.2 lakh urban residents. From the year 1971 onwards, stress was given on industrialisation, improvement in transportation facilities and education, which helped to 228
12 augment urbanisation still further. The growth of urban population again picked up during the subsequent decades reaching per cent for India. Urban population reached lakh, while the level of urbanisation was 19.9 per cent. Urbanisation in Maharashtra also took some pace with per cent growth rate and had 31.8 per cent level of urbanisation. The number of urban dwellers increased up to lakh. Set back in the previous decade was reclaimed by Pune Division in this decade with 27.0 per cent level of urbanisation and per cent growth rate, Pune Division again came in the flow of urbanisation on the national scenario. The actual urban population increased up to 29.0 lakh LATE POST-INDEPENDENCE PERIOD In the early post-independence period ( ), the growth rate of urban population was increasing and after 1981 the growth rate showed declining trend for India, Maharashtra and also for Pune Division. Urban population of India again picked up speed in this decade and reached to lakh with growth rate of over 46 per cent and level of urbanisation was 23.3 per cent. During this decade, urban population of Maharashtra increased up to lakh along with 35.1 per cent level of urbanisation. The growth rate of urban population was quite low (39.99 %) than that of the previous decade. As far 1981 census was concerned, Pune Division recorded almost the same trend of urbanisation. The number of urban population of Pune Division increased to 40.2 lakh with 30.6 per cent level of urbanisation. The growth rate was quite high (38.62 %) than that of the previous decade. During the inter-censual period of , the rate of urban growth was declined significantly due to decline in the magnitude of rural to urban migration as well as decline in the rate of natural increase. India, Maharashtra and Pune Division showed considerable decline in the urban growth than the previous census years. By 1991, in India lakh population had urban residence with 25.7 per cent level of urbanisation. The growth rate recorded by Indian urban population was percent declined by 10.0 per cent than that 229
13 of the previous decade. There was also very marginal decline i.e per cent in the growth rate of urban population of Maharashtra, which was just less than 1.0 per cent as compared to that of the previous decade lakh population of Maharashtra resided in urban centres with 38.7 per cent level of urbanisation. The same trend continued in Pune Division during the decade, 53.4 lakh population of Pune Division along with 32.5 per cent level of urbanisation and per cent of growth rate resided in urban centres. In the last and final decade of investigation period, i.e though the actual urban population and level of urbanisation increased alarmingly and growth rate of urban population declined considerably except Pune Division. In the year 2001, India had lakh i.e per cent urban population and the growth rate of urban population in inter-censual period was per cent, which was lesser than that in the earlier inter-censual period. As far as Maharashtra was concerned, lakh (42.4 %) population lived in the urban areas along with per cent of growth rate. The growing trend of urban population in Pune Division was per cent, which was higher than the figure of the earlier decade. The actual urban population of Pune Division was 75.1 lakh, which accounted for 37.6 per cent of the total population. Although, the growth rate of urban population of India and Maharashtra was declined considerably it was astonishingly increased from that in the previous decade (32.84 %) and reached up to per cent in Pune Division. According to above discussion, one can summarise that Maharashtra had the highest urban population as compared to those of India and Pune Division through out the investigation period. With slight differences, all the three regions recorded almost the same trend of urbanisation from 1901 to In the pre-independence period ( ), the growth of urban population was steady and the growth rate was very slow. The decade showed the highest growth rate of the urban population in the century. Post-independence period ( ) witnessed an alarming increase in urban population along with high growth rate, though the growth rate of urban population was previously steady and quite alarming in the latter phase of the 230
14 investigation period. Ultimately, it declined significantly at the end of the century. There can also be observed three stages of the urbanisation. In the first stage, i.e. pre-independence period ( ), the urban population and the growth rate were quite steady, with the exception of The second stage that was early post-independence period ( ) witnessed uneven increase in urban population along with some ups and downs in the growth rate, while in the third and final stage i.e. late post-independence period (1981 up to 2001), the urban population increased alarmingly and the growth rate declined noticeably. In short, the urban population and the growth rate of urban population showed some different and uneven trends for India, Maharashtra and Pune Division. 7.4 DISTRICT-WISE TRENDS IN URBANISATION ( ) As like India, Maharashtra and Pune Division, all the five districts, which are included in Pune Division viz. Pune, Satara, Sangli, Solapur and Kolhapur also showed some unique features of urbanisation in the investigation period. Table 7.2 shows the trends in the growth of urban population in five districts of Pune Division during the investigation period. Every district under investigation showed positive change in the urbanisation in every decade except 1911 and On comparing the decadal census figures of urban population for last 100 years, it was readily apparent that, Pune District had the highest urban population than the remaining districts. Solapur was at the second position followed by Kolhapur and Sangli districts, which were at the third and the fourth position respectively. Satara district with the least urban population remained at the last position throughout the investigation period. All the five districts recorded almost the same trend of urbanisation in the last 10 decades. In the pre-independence period, all the five districts recorded a steady increase in urban population. The decade witnessed increase in urban population in all the five districts. Then, in the decade, , because of conceptual change in the definition of urban 231
15 centres, there was decline in the urban population of all the five districts. In the late post-independence period, the urban population again increased significantly in all the districts. From the Fig. 7.3 it is clear that in the pre-independence period i.e to 1941, Solapur district was at the top and Satara district was at the bottom position, but from 1951 onwards, Pune district overtook Solapur district and then onwards always remained at the first position. From 1951 onwards, the urban population of Pune district increased considerably, at the same time urban population of Solapur district showed decreasing trend. Kolhapur and Sangli districts showed a steady growth during the pre-independence period, while during the post-independence period the urban population increased significantly. In the pre and post-independence period, Satara district showed not much difference in the increase of urban population. In 1901, the urban population of Pune district was 2.2 lakh, which was increased by about 19 times and reached up to 42 lakh in 2001, while Sangli district, having 0.9 lakh urban dwellers in 1901 increased up to 6.3 lakh and Solapur district having 1.8 lakh of urban population in 1901, increased up to 12.2 lakh in
16 Sr. No. Table 7.2 District-Wise Urbanisation ( ) Region Indicator Pune 2 Satara 3 Sangli 4 Solapur 5 Kolhapur UP % to Total GR (%) UP % to Total GR (%) UP % to Total GR (%) UP % to Total GR (%) UP % to Total GR (%) Note : UP = Urban Population in lakh, GR = Growth Rate in percentage Source : Census of India of concern years and concern districts 233
17 Both Sangli and Solapur districts recorded almost seven-time increase in urban population for the same period. With the nine-time increase in urban population, Kolhapur district reached up to 10.5 lakh in 2001 from 1.1 lakh in Satara district recorded lowest increase i.e. five-time in urban population and accomplished 3.9 lakh from 0.7 lakh of urban population during the same period. Fig. 7.4 diepicted the growth rate of urban population for the five districts. Trends of growth rate for these districts were almost the same as like India, Maharashtra and Pune Division. It was fluctuating in the initial stage and in the middle stage of the investigation period. It was negative in the decades and , while it recorded the highest peaks in It was steadily increasing in the pre-independence period, while it was again steady but declined in the post-independence period. Three stages are clearly seen if one can sight at the graph of growth rate of urban population. First stage i.e. in between to (pre-independence period), witnessed steady growth of urban population, which was negative in the first decade. All the districts in the study region 234
18 recorded almost the same rate of growth of urban population. Second stage was observed from to decades (early post-independence period) with constructive growth rates for all the districts. In the decade , the highest growth rate in the investigation period was recorded by all the five districts in Pune Division. It was because of the partition and the migration of large population from Pakistan. While, second number of growth rate in investigation period was recorded in decade of Pune, Solapur, and Kolhapur districts recoded the lowest but positive growth rate, on the other hand Satara and Sangli districts recorded negative growth rate. It was only due to the conceptual change in the definition of urban population and urban centres. The third and final stage from to (late post-independence period), recorded some unique characteristics of growth rate. In this stage, though the urban population of all the five districts has increased remarkably. The growth rate of urban population showed a declining trend. It happened owing to decreasing opportunities and over crowding phenomenon in urban centres along with agricultural and agro industrial development in other areas, the migration of rural population decreased considerably. As far the growth rate during total investigation period is concerned, the highest growth rate was recorded by Pune District per cent. Kolhapur district recorded per cent of growth rate and rested at the second rank in the Pune Division. Solapur ( %) and Sangli ( %) districts recorded almost a similar growth in the urban population. The lowest growth of urban population has been seen in Satara district, which was increased with per cent. Discrimination of pre and post independence periods also showed an interesting depiction of growth in urban population. In the pre-independence period highest growth rate was recorded by Solapur district (99.13 %), followed by Pune (78.41 %), Kolhapur (52.55 %) and Satara (50.95 %) districts. The lowest growth in the urban population (46.31 %) was seen in Sangli district. In the post-independence period Pune district overtook Solapur 235
19 district and obtained first position with per cent. Kolhapur district trailed behind Solapur district and took second position with per cent. More surprisingly, Solapur district with per cent of growth rate fell two-step downstairs and rested at the third position. Satara ( %) and Sangli ( %) districts maintained their positions and were at the fourth and fifth places. It is very clear from the above discussion that the decadal growth of urban population in Pune district was much higher than those of the other districts in the study region. It is because of the location of Pune district, which is much closer to the Mumbai, metropolis of administrative as well as economic and industrial capital of Maharashtra state. Multi-functional nature of Pune city, accessibility, good transportation facilities, educational as well as agricultural and industrial development are the factors, which made Pune city one of the most urbanised cities in the Maharashtra. Kolhapur is a well-known district about its agricultural and industrial development, especially in the co-operative sector, ranked second in growth of urban population. Solapur city with its traditional heritage of textile industry, in spite of the adverse climatic and geographical conditions, got the third number of urban population. Sangli and Satara districts were at the fourth and fifth places in the growth of urban population, mostly because of hostile physiography but development in the co-operative sector and improved agricultural practices, urban population in these districts increasing day by day PRE INDEPENDENCE PERIOD In the beginning of the century (1901), Solapur district had the highest i.e i.e. 1.8 lakh urban population, followed by Pune district, which was having per cent urban population (2.2 lakh). Sangli district with per cent (0.9 lakh) and Kolhapur district with per cent (1.1 lakh) of urban population to their total population were at the third and fourth places respectively. Satara district with 8.33 per cent (0.7 lakh) urban population was at the last position. 236
20 The decade recorded some drastic changes in the urban population of all the districts in Pune Division. Except Pune district, the remaining districts in the division recorded negative growth of urban population. Highest negative growth rate was recorded by Kolhapur district ( %) with 0.8 lakh actual population and having per cent level of urbanisation. Second highest negative growth rate was recorded by Satara district ( %) with only 6.02 per cent population (0.5 lakh) level of urbanisation. Solapur ( %) and Sangli (-6.40 %) districts also recorded negative growth of urban population. Solapur district had 1.5 lakh urban dwellers with per cent level of urbanisation and in Sangli district 0.8 lakh urban population with per cent level of urbanisation. Thus, all these districts except Pune district showed declined trend of urbanisation, while Pune district with marginal change recorded an increase in the urban population. During this decade, 2.3 lakh persons had urban residence with per cent level of urbanisation. As far, the highest growth rate was concerned, only Pune district with positive increase as usual stood at the first place in the study region. The set back in urban population in this decade was because of very high mortality and out migration from the urban centres because of the epidemics like plague, cholera, small pox, influenza and malaria. The attempt was made to prevent high mortality and out migration was brought to stand still in the inter-censual period , resulted notable growth in the urban population in all the five districts in the study region. During this decade, highest level of urbanisation was recorded by Solapur district (24.44 %) with 2.2 lakh actual urban dwellers. Highest growth rate (41.64 %) was also recorded by the Solapur district. Pune district with per cent level of urbanisation rested at second position with actual 2.5 lakh urban dwellers and growth rate of 9.13 per cent. Sangli (15.25 %) and Kolhapur (12.65 %) districts were at third and fourth places respectively. Satara district with only 0.7 lakh urban population, and 8.97 per cent level of urbanisation was at the last place among the districts. 237
21 In the decade , urban population for all the districts increased gradually and all the districts maintained their positions as it was in the earlier decade. In this decade Solapur district with 2.7 lakh urban dwellers and per cent level of urbanisation remained at the first place in study region, followed by Pune district with 3.1 lakh urban population and per cent level of urbanisation. Sangli district with per cent level of urbanisation and 1.1 lakh urban population stayed at number three position and with 1.3 lakh population and14.44 per cent level of urbanisation, Kolhapur district rested at number four position. Satara district also remained at the last position with 0.8 lakh urban population and 8.98 per cent level of urbanisation. As far the growth rate is concerned, Kolhapur district with per cent of growth in the urban population achieved first place, followed by Sangli (28.24 %), Pune (21.90 %), Solapur (21.71 %) and Satara (15.08 %) districts. The slow and steady trend in urbanisation persisted in the last census year of the pre-independence period i.e also. Because of the negligence of British Rule, urban centres in India were unable to provide the basic and primary facilities to urban population. The freedom movement of India also affected the process of urbanisation in India. The agricultural and industrial development was going with snail s pace resulted into very limited job opportunities. All these things affected the rural-urban movement of the people in the study region, which hampered the process of urbanisation. During this decade, Solapur with 3.6 lakh urban population (29.50 %) and Pune with 4.0 lakh urban population (27.21 %) carried on their respective positions as in the previous decade. As compared to the earlier decade, Kolhapur district with 1.7 lakh urban population (16.50 %) slightly overtook Sangli district, which had 1.3 lakh urban population (16.04 %) and achieved third position. Satara district with 1.1 lakh urban population (10.89 %) maintained its last position throughout the pre-independence period. About growth rate of urban population Solapur district with per cent of growth in the urban population got first place, followed by Kolhapur (30.67 %), Pune (30.57 %), Satara (27.80 %) and Sangli (17.58 %) districts. 238
22 7.4.2 EARLY POST-INDEPENDENCE PERIOD Urbanisation entered a new and more important phase in the postindependence period, in contrast with the British period or pre-independence period of urban stagnation, the post-independence period was notable for rapid urbanisation (Ramchandran, 1989). The influx of refugees, building and development of administrative towns, construction of industrial townships, emergence of new rural-urban fringes and most importantly the introduction of urban planning and general improvement in civic amenities in the urban areas were the major reasons of rapid urbanisation in the post-independence period in the study region. The decade , showed some abrupt changes in urbanisation of all the districts in the study region. The urban population was almost doubled from the previous decade. The growth rate and the percentage of urban population or level of urbanisation also recorded an immense increase for all the districts. During this decade, Pune districts showed some stupendous changes in every criterion of urbanisation and for the first time grabbed a first place by living behind the Solapur district. Pune district, recorded highest growth rate in urban population ( %) in the century with 8.3 lakh urban population and per cent of level of urbanisation. In this phase of rapid urbanisation, Satara district still lagged behind and was on the last position. The level of urbanisation of Satara district was per cent with growth rate of per cent, the actual urban population of Satara district during this decade was 1.6 lakh. Solapur district was on leading position in pre-independence period but was pushed back on second position with 4.7 lakh urban population and per cent level of urbanisation but was having a lowest growth rate (30.50 %) of urban population during this decade. Kolhapur and Sangli districts also recorded some sharp hikes in urbanisation. Sangli district had 2.8 lakh urban population (28.18 %) and recorded per cent of growth rate. Kolhapur district with 2.7 lakh urban population (21.42 %), registered per cent growth in urban population. During this decade, 239
23 Sangli and Kolhapur districts secured their third and fourth positions respectively. It may be noted here that the fall in the growth rate of urban population during the decade was due to the conceptual change in the definition of an urban centre. The definition of urban centre in India was rationalised and made strictest at the time of 1961 census. Consequently, a large number of towns were disclassified and sudden downfall was registered in urban population all over India. The study region i.e. Pune Division and the districts in the division were also not an exception to it. All the districts in the study region recorded downward growth of urban population. Satara and Sangli districts recorded negative growth, while Pune, Solapur and Kolhapur districts registered very marginal growth of urban population. With 1.9 lakh urban population and per cent level of urbanisation, Sangli district recorded highest negative growth rate ( %) in the decade. Satara was another district, which recorded negative growth (-1.19 %) in the urban population. The total urban population (1.5 lakh) and the level of urbanisation (10.48 %) also declined as compared to those in the previous decade. Urban population of Pune district increased very marginally up to 9.4 lakh and level of urbanisation declined to per cent. Solapur and Kolhapur districts also registered positive but very marginal growth in the urban population. Solapur district with 5.1 lakh urban population (27.41 %) recorded per cent growth. Kolhapur district also shared same condition with 3.0 lakh urban population (19.35 %) with per cent growth. In other words, because of conceptual change in the definition of urban centre, 1961 decade marked as a census divide in the growth of urban population of the study region. From 1971 onwards, stress was given on industrialisation, education and improvements in transportation, which helped urbanisation still further. The growth of urban population again picked up in this decade. In this inter-census period i.e , all the districts except Solapur district achieved more than 40.0 per cent of growth in urban population. The highest growth rate of per cent was registered by Sangli district, with 2.8 lakh urban population 240
24 (18.30 %). Satara district recorded per cent growth and achieved second position along with 2.2 lakh urban population (12.79 ). With 4.4 lakh urban population (22.0 %), Kolhapur district recorded third highest growth rate of per cent. Pune district registered per cent growth rate and was pushed back from first place to fourth position with 13.3 lakh urban population (41.64 %). Solapur district recorded the lowest growth rate of this decade i.e per cent. The level of urbanisation was per cent with 6.1 lakh of urban population LATE POST-INDEPENDENCE PERIOD The same trends of urbanisation continued from 1971 to 1981 census with marginal changes. Total urban population and percentage of urban population increased for all the districts in Pune Division. As far as growth rate was concerned, Pune and Solapur districts recorded positive change, while Sangli, Satara and Kolhapur districts registered negative change in the urban population. In previous decade, it was high forties, which came down to thirties and twenties. In other wards, though the urban population for all the districts increased, the rate of increase declined considerably. In this decade, urban population of Pune district increased up to 19.7 lakh (47.35 %) and highest growth rate of per cent reached at the first position. Kolhapur district maintained its above forty integer, but slightly turned down to per cent with 6.2 lakh urban population and growth rate of per cent. Sangli district stood at the third position in the growth rate (37.36 %) with 3.9 lakh urban population and per cent urbanisation. With per cent growth in the urban population and 7.6 lakh urban dwellers (28.11 per cent urbanisation), Solapur district was at the fourth rank. Satara district (16.96 %) with level of urbanisation was per cent and 2.6 lakh urban population recorded the highest downfall in the growth of urban population during this decade. In the decade 1991, previous trend of urbanisation persisted for all the districts in the study region. All the five districts registered positive change in the urban population. During this decade, level of urbanisation of Pune District 241
25 registered per cent and left behind other districts. As far as, the total urban population is concerned, it supports almost three to seven times larger urban population (28.1 lakh) than the other districts and the growth rate (42.41 %) was also the highest during this decade. Along with per cent urbanisation and 9.2 lakh total urban population, Solapur district was at second position registered per cent growth in the urban population. Satara district as usual registered the lowest level of urbanisation (12.65 %) and growth rate (18.70 %) again remained on the last position. Kolhapur district supported 7.8 lakh urban population, which was per cent of the total population and rested on the third position. The growth rate was registered by this district was per cent during this decade. With marginal difference in the urbanisation (22.72 %), Sangli district was at the forth position. The total urban population of Sangli district was 5.0 lakh and recorded per cent of growth in the urban population. The trend of increasing level of urbanisation with declining growth rate from previous two decades of late post-independence period also continued in the decade Formation of suburbs, convenience in the transportation network, high cost residence in the cities, over crowding in the cities, scarcity of civic amenities in the cities and the problems of slum and pollution forced people to move outside the cities, all these factors resulted into out migration and finally growth rate of urban population declined significantly. All the districts in the study region recorded a positive change in the urban population. All the districts recorded marginal increase in the growth rate compared to declining trends in previous two decades, except Sangli district. During the decade , Pune district with 42.0 lakh urban population and per cent urbanisation was again at the top position. At the other end, was Satara district with 3.9 lakh urban population and per cent of urbanisation again remained at the lowest position. Solapur district was at the second position with 12.2 lakh urban residences and per cent of urbanisation. Kolhapur and Sangli districts again at the third and forth positions respectively with very small margin. Out of total population of Kolhapur district per cent 242
26 i.e lakh population was urban. It was closely followed by Sangli district with 6.3 lakh urban population and per cent urbanisation. As far growth of urban population during this decade is concerned Pune district ranked first with per cent, followed by Kolhapur (33.47 %), Solapur (31.83 %), Satara (26.20 %) and Sangli (26.02 %). To conclude, it is very apparent that, the urban population of all the districts in the last hundred years increased gradually but the rate of increase was quite fluctuating throughout the investigation period. The decades 1911 and 1961 recognised as the divides in the urban population of all the districts because of their negative growth. Pre-independence period recorded very slow and uneven growth of urban population, while post-independence period recorded very fast and declining growth of urban population with declining trend. The hike in the growth was seen in the decade , because of migration from outside. In the pre-independence period Solapur district was at the top, which was left behind by Pune district in the post-independence period as far the urban population in concerned. In the entire investigation period, Satara district was at the lowest position, along with Kolhapur and Sangli districts on the third and forth position except some ups and downs. Alternatively, leaving behind remaining four districts, Pune district had almost equal urban population that of the rest of the districts together and became a highly urbanised district. 7.5 SPATIO-TEMPORAL CHANGES IN URBANISATION As like India and Maharashtra the study region had a long history of urbanisation. Five districts in Pune division are the major contributors to the state s and country s urban population. According to 2001 census, the study region supported an urban base for 37.6 per cent population, which was nearly equal to the state average (42.4 %) and almost 10.0 per cent more than the national average (27.8 %). In terms of absolute number, the study region supported lakh urban population, which was quite higher than most of the other parts of Maharashtra. At the beginning of the 20 th century, the urban population of the 243
27 study region was 6.9 lakh and increased up to 75 lakh in the early 21 st century recording per cent or almost 11 times increase. Pre-independence period witnessed very slow urban growth (71.0 %), while in the post-independence period the urban growth rate reached up to per cent. Urbanisation in the study region in the last 10 decades was associated with a particular characteristic feature in each decade. More specifically, in the and famine and epidemic like plague and influenza, and agricultural depression and world war, partition of India, planned development, and emergence and decentralisation of urbanisation in backward areas and finally the last decades i.e and decelerated rural-urban migration and declining rate of natural increase. Table 7.3 Tahsil-Wise Levels of Urbanisation in Pune Division ( ) Sr. No. District/Tahsil Pune District Junnar Ambegaon Shirur Khed Maval Mulsi Haveli Pune City Daund Purandar Velhe Bhor Baramati Indapur Satara District Mahabaleshwar Wai Khandala Phaltan Man Khatav Koregaon Satara City
28 Table 7.3 Continued Jaoli Patan Karad Sangli District Shirala Walwa Palus Khanapur Atpadi Tasgaon Miraj Kavatemahankal Jat Kadegaon Kolhapur District Shahuwadi Panhala Hatkanangale Shirol Karveer Bavada Radhanagari Kagal Bhudargad Ajara Gadhinglaj Chandgad Solapur District Karmala Madha Barshi Solapur North Mohol Pandharpur Malshiras Sangola Mangalwedha Solapur South Akkalkot Note : Population figures in percentage Source : Based on census data from concern years and concern districts 245
29 246
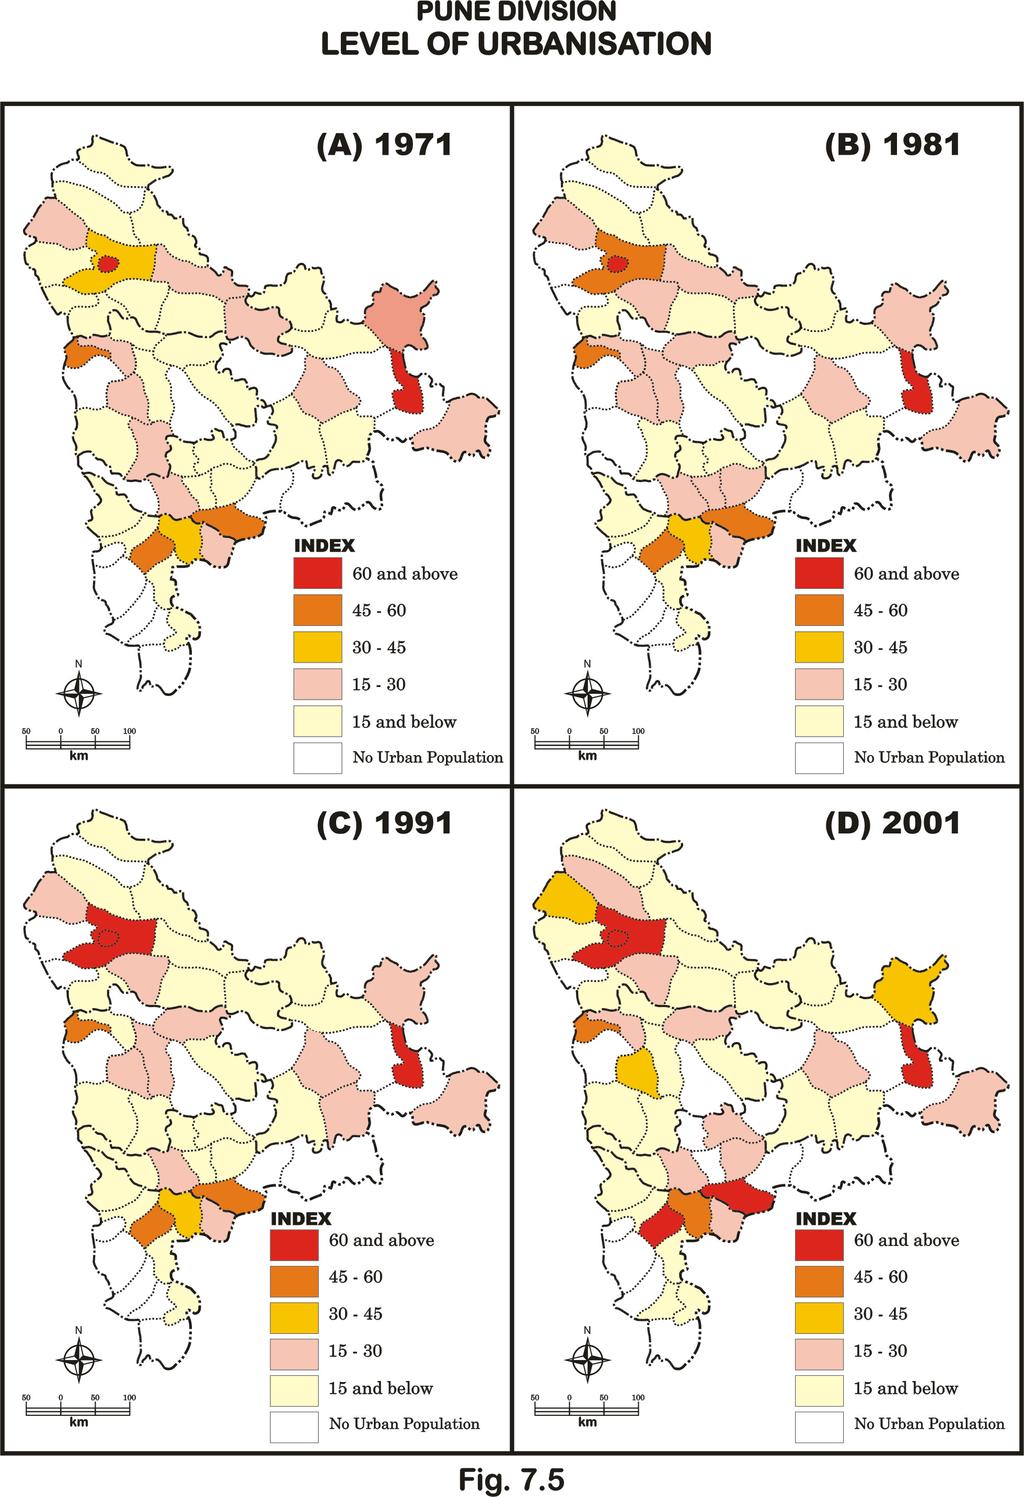
30 Table 7.3 shows the tahsil wise distribution of population in the study region. Today, the study region with its urban centres like Pune, Pimpari Chinchwad, Solapur, Kolhapur, Ichalkaranji, Sangli, Miraj, Kupwad and Satara, identifies itself as one of the important urbanised regions of Maharashtra and ultimately of India. A tahsil wise analysis further reveals the uneven pattern of urbanisation in the study region during late post-independence period (Fig 7.5) CHANGES IN URBANISATION (1971) According to 1971 census, among the various tahsils in the study region, the tahsil of Pune City was the most urbanised tahsil with 99.8 per cent of its total population living in urban areas, followed by Solapur North (81.8 %), Karveer (56.7 %), Miraj (49.3 %) and Mahabaleshwar (47.1 %). Panhala tahsil in Kolhapur district was the least urbanised tahsil with only 1.5 per cent of urban population. Very low-level urbanisation was also found in Khed (2.5 %), Khandala (3.3 %), Shahuwadi (3.7 %) and Shirur (5.9 %) tahsils. The adverse physiographic and climatic conditions, lack of infrastructure, lack of industrial development and predominance of primary activities are the factors those explain largely the poor urbanisation, while there were favourable physical and climatic conditions supported by agricultural and industrial development in the central part of the study region, which was highly urbanised (Fig. 7.5 A). Table 7.3 divulges that, majority of the tahsils in the study region recorded very poor state of urbanisation (below 15.0 per cent). These tahsils included Khed, Shirur, Velhe, Junnar, Bhor, Purandar and Baramati of Pune district; Khandala, Patan, Man, Koregaon and Phaltan of Satara district; Tasgaon and Khanapur of Sangli district; Panhala, Shahuwadi, Gadhinglaj and Kagal of Kolhapur district and Sangola, Madha, Karmala and Mangalwedha of Solapur district. It means that almost 40 per cent of the tahsils in the study region were having very low level of urbanisation. In the range of 15 to 30 per cent, there were 11 tahsils and only two tahsils were in the range of 30 to 45 per cent, which showed moderate state of urbanisation. The tahsils, namely 247
31 Indapur, Daund Maval, and Haveli from Pune district, Karad, Wai and Satara City from Satara district, Akkalkot, Pandharpur and Barshi from Solapur district, Walwa tahsil from Sangli and Shirol and Hatkanangale tahsils from Kolhapur districts were moderately urbanised. The range of 45 to 60 per cent and above 60 per cent, which showed respectively high proportion of urban population, included five tahsils in the study region and these tahsils included Mahabaleshwar, Miraj, Karveer, Solapur North and Pune City. Out of 58 tahsils in the study region, 18 tahsils were entirely rural and did not contain any urban areas. As far as the average of the study region (27.0 %) is concerned, out of 40 urbanised tahsils, 29 tahsils were under the average and 11 tahsils were above the average. The tahsils having very low level of urbanisation are located either in the rugged terrain of Western Ghats or Sahyadris in the west or in the drought prone area in the east. Inspite of these adverse geographical conditions the tahsils of Mahabaleshwar in the Western Ghat and Solapur North in the drought prone region registered high percentage of urban population due to development of tourism and development of cotton textile industry respectively. Relatively high proportion of the urban population was found in the central part of the study region, which was a result of agricultural and industrial development. Pune city, which is a multifunctional town and having a location in proximity to Mumbai, registered highest percentage of urban population. Along with Pune city, Miraj and Karveer tahsils also registered high percentage of urban population. Along with above-mentioned reasons, the administrative functions of the district headquarters are of prime importance in the process of urbanisation. In between those two high and low urbanised regions was the location of moderately urbanised tahsils (Fig. 7.5 A) CHANGES IN URBANISATION (1981) According to 1981 census, about lakh population (30.6 %) in Pune division lived in the urban areas, which was slightly higher than the national average (23.3 %) and quite less than the state average (35.1 %). Among the 248
32 various districts in Pune division, Satara was least urbanised district with 12.8 per cent of urban population, while Pune with per cent of urban population was the most urbanised district in the study region. The remaining districts such as Solapur (28.11 %), Kolhapur (25.30 %) and Sangli (21.31 %) showed varying levels of urbanisation. In this decade, all the peripheral tahsils of the study region portrayed low level of urbanisation, while the tahsils in the central part having district headquarters along with the adjoining tahsils depicted relatively high level of urbanisation (Fig. 7.5 B). As has been pointed out earlier in this decade also, the study region witnessed an accelerated and an uneven Spatio-temporal picture of urban growth. Figure 7.5 (B) reveals that the tahsil of Pune City again came as the most urbanised tahsil in the study region with 99.3 per cent of urban population. Tahsils of Solapur North (83.6 %), Karveer (57.9 %), Haveli (53.7 %), Miraj (53.1 %), Mahabaleshwar (48.2 %) and Hatkanangale (41.7 %) had high percentage of urban population, because these tahsils except Mahabaleshwar; have high degree of development in agriculture, industry and administrative functions. Mahabaleshwar with its hilly geographical location developed as a hill station, therefore, registered high degree of urbanisation. In case of Pune City, it may be correlated with the multifunctional nature and location near to Mumbai. The western hilly tahsils and eastern drought prone tahsils of the study region, however, continued to remain very poorly urbanised tahsils in the study region. In this decade also, Panhala tahsil of Kolhapur district remained least urbanised (1.5 %) tahsil in the study region. It was closely preceded by the tahsils of Khed (3.3 %), Shahuwadi (3.5 %), Shirur (6.7 %), Junnar (7.4 %), Sangola (8.2 %), Madha (9.4 %), and Bhor (9.9 %). The tahsils around the district headquarters and the industrial and agricultural centres displayed moderate level of urbanisation and were located in between high and low urbanised regions or tahsils. During this decade, out of 58 tahsils in the study region 17 tahsils registered very low (below 15 per cent) level of urbanisation. The lowest percentage of urban population was recorded in the tahsils of Khed, Shirur, 249
33 Junnar, Bhor, Baramati and Indapur in Pune district, Man and Karad tahsils in Satara district, Khanapur in Sangli district, Panhala, Shahuwadi, Gadhinglaj and Kagal tahsils in Kolhapur district and Sangola, Madha, Karmala and Mangalwedha tahsils in Solapur district. In other words, majority of the tahsils (30.0 %) were in this lowest category. Purandar, Daund and Maval in Pune district, Phaltan, Wai, Koregaon and Satara City in Satara district, Tasgaon and Walwa in Sangli district, Shirol and Hatkanangale in Kolhapur district and Akkalkot, Barshi and Pandharpur in Solapur district, which included in the range of per cent and registered moderate state of urbanisation. The tahsils having high proportion (45-60 and above 60 per cent) of urban population were Haveli, Mahabaleshwar, Miraj, Karveer, Solapur North and Pune City. Out of 58 tahsils in the study region, 19 tahsils (33.0 %) did not contain any urban areas and were entirely rural in CHANGES IN URBANISATION (1991) During the decade of 1991, Spatio-temporal analysis further revealed the uneven pattern of urbanisation in the study region. The tahsils having district headquarters in their domain and the adjoining tahsils had a vast base of urban population. Geographical factors like terrain and the climatic conditions (temperature and rainfall) affected the agricultural, industrial and commercial development, which ultimately resulted in the uneven tahsil-wise distribution of urban population in the study region. The moderately urbanised tahsils were distributed in between the high and low urbanised tahsils in all over the study region. These tahsils with low urbanisation were mainly concentrated on the peripheral parts of the study region and which were hampered by at least any one of the adverse geographical factors. According to the Table 7.3 and Fig 7.5 (C), Pune City (99.5 %) was the most urbanised tahsil in the study region, followed by Solapur North, which was having 79.2 per cent urbanisation. Other tahsils, which could be classified as relatively more urbanised included Haveli (66.4 %), Miraj (57.3 %), Karveer (56.6 %), Mahabaleshwar (47.5 %), and Hatkanangale (44.2 %). In all these 250
34 tahsils, the proportion of urban population was more than the average of the study region (32.5 %). At the other end of the scale were the tahsils of Panhala (1.4 %), Shahuwadi (3.3 %), Khed (3.6 %), Patan (3.7 %), Shirala (5.0 %), Junnar (7.0 %) and Shirur (7.7 %) where the proportion of urban population was much less and half of the average of study region. Highly urbanised tahsils were located in the central north-south belt of the study region, which is agriculturally and industrially more developed, while the tahsils, which were relatively lagging far behind in terms of urban population had peripheral and adverse geographic location in the study area. In the census year 1991, out of 1,64,13,956 total population 53,41,801 persons resided in urban areas forming a proportion of 32.5 per cent of the total population in Pune Division. It is one of the highly urbanised divisions in the state of Maharashtra. The favourable location of the study region offers great opportunities for industrial and commercial development and growth. However, in the study region, still regional imbalances in the urban population persisted. Among various tahsils of the study region, there were sharp differences in the level of urbanisation. Three units viz. Pune City, Haveli and Solapur North tahsils were highly urbanised units in the study region and were in the highest range of 60 per cent and above. The second and third ranges of per cent and per cent, which were also ranges of relatively high proportion of urban population had four tahsils in the study region viz. Mahabaleshwar, Miraj, Karveer and Hatkanangale. The range of per cent, which is a second last range, had 11 tahsils, having low level of urbanisation. While, the lowest range of urban population denoted by 15 per cent and below had 21 tahsils. All these tahsils were found scattered throughout the study region, which are Baramati, Indapur, Daund, Bhor, Shirur, Junnar, Khed in Pune district; Patan, Man and Karad in Satara district; Khanapur, Tasgaon and Shirala in Sangli district; Kagal, Gadhinglaj, Shahuwadi and Panhala in Kolhapur district; Mangalwedha, Karmala, Sangola and Madha in Solapur district. Out of 58 tahsils in the study region, 19 tahsils (33.0 %) were entirely rural and did not have any urban areas in
35 7.5.4 CHANGES IN URBANISATION (2001) As has been pointed out earlier, the study region had witnessed highly uneven distribution of urban population in the last and final decade under study. According to 2001 census, out of lakh population about lakh persons in India lived in urban centres of varying sizes. As observed earlier (Table 7.3), almost two-fifth population of the study region had an urban base and it was about 37.6 per cent of the total population. The average of the total population of the study region was 10 per cent more than the country s average (27.8 %) and little less than the average of the state (42.4 %). It was closely apparent from Fig. 7.5 (D), which displayed a regional pattern of urbanisation prevailed in 2001, that, all the tahsils having district headquarters in them, registered more than 50 per cent urban population. Along with administrative functions, these tahsils more developed being agriculturally and industrially had vast commercial base to support large number of urban dwellers. Among the various tahsils, only Pune City tahsil was cent per cent urbanised tahsil during this decade. The other tahsils, which registered very high and high proportion of urban population were Solapur North (90.8 %), Haveli (78.7 %), Miraj (61.2 %), Karveer (60.5 %), Hatkanangale (50.0 %), Mahabaleshwar (47.7 %) and Maval (41.9 %). At the other end of the scale, the least urbanised tahsils registered very marginal proportion of urban population of less than 5 per cent. The remote geographical location, uneven terrain, extreme climatic conditions hampered agricultural, industrial and commercial development. These tahsils having western hilly or eastern dry climatic location displayed low degree of urbanisation. However, these tahsils continued to remain very poorly urbanised tahsils in the study region (Fig. 7.5 D). Panhala with on 1.4 per cent of its urban residences was the least urbanised tahsil in the study region. Similarly, the tahsils which displayed low degree of urbanisation included Shirala (2.5 %), Shahuwadi (3.1 %), Patan (3.9 %), Indapur (6.2 %), Mulshi (6.3 %), Ambegaon (6.5 %), Koregaon (6.5 %) and Junnar (6.7 %). 252
36 As observed earlier in this decade also, one could experience the regional imbalance with the sharp difference in the distribution of urban population in the study region. The tahsils, in the various ranges explain themselves, the uneven distribution of proportion of urban population in Pune Division as prevailed in Pune City was the only tahsil that was entirely urbanised and accounted for per cent urban population of Pune Division. Other tahsils having high proportion of urban population included Solapur North, Haveli, Miraj and Karveer, these tahsils were in the range of 60 per cent and above and these tahsils with Pune City accounted for per cent of the urban population in the study region. In other word, majority of the urban population was concentrated in these five tahsils and remaining almost 25 per cent, urban population was shared by 38 tahsils, which were having near about equal proportion of urban population. The second range (40-60 per cent) claimed two tahsils viz. Mahabaleshwar and Hatkanangale of Satara and Kolhapur districts respectively, also contained a relatively high proportion of urban population. The third range (30-45 per cent) comprised of Maval, Satara City and Barshi tahsils, while 10 tahsils were in the forth range (15-45 per cent) having a moderate proportion of urban population. The tahsils in the forth range were found distributed throughout the study region. The last and the lowest range (below 15 per cent) contained 23 tahsils in the study region. That means majority of the tahsils (40.0 %) recorded the lowest state of urbanisation. This range accounted largest number of eight tahsils from Pune district, 5 tahsils from Satara and Kolhapur district each, four tahsils from Solapur district and only one tahsil from Sangli district. Out of 58 tahsils in the study region, 15 tahsils were utterly rural and did not hold any urban population in the decade Six tahsils viz. Khed, Satara City, Khanapur, Tasgaon, Hatkanangale and Barshi jumped into next range, while two tahsils, namely Koregaon and Mangalwedha from Satara and Solapur district respectively registered decrease in urban population and were pushed backward as compared to the previous decade. 253
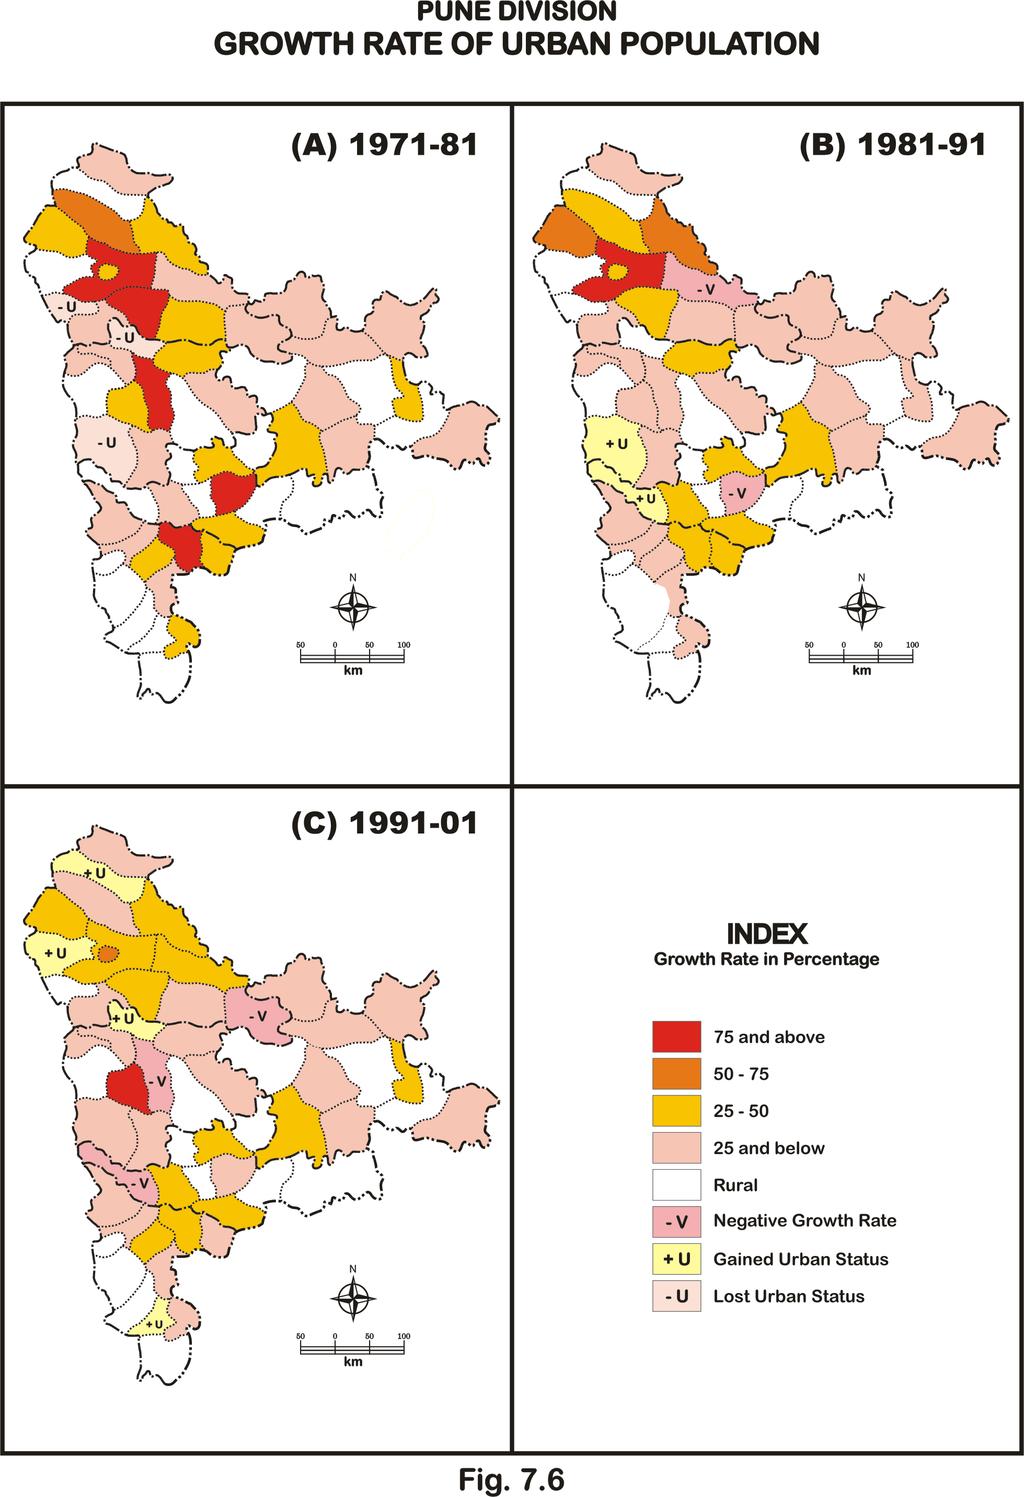
37 The tahsils in the central north-south belt of the study region were more urbanised than the peripheral tahsils. The industrially, agriculturally and economically advanced tahsils in the study region were more urbanised than the peripheral and remote tahsils, which were suffering due to the geographical problems. Moreover, their problems were enormous and resources were limited and hence, the process of socio-economic transformation is bound to be gradual, which explained largely their poor state of urbanisation, while the moderately urbanised tahsils were distributed all over the study region in between high and low urbanised tahsils. 7.6 DECADAL VARIATION IN TAHSIL-WISE URBANISATION Regional pattern of decadal variation in urban population at tahsil level in the study region during late post-independence period ( ) revealed sharp contrasts in between highly urbanised tahsils and less urbanised tahsils in the study region. This means that an uneven regional pattern of change in the urban population was noticed in Pune Division. Table 7.4 reveals the condition of the regional pattern of increase in urban population in the study region during to Table 7.4 Decadal variation in Tahsil-Wise Urban Population ( ) Sr. No. District/Tahsil Pune District 01 Junnar Ambegaon U 03 Shirur Khed Maval Mulshi U 07 Haveli Pune City Daund Purandar Velhe - U Bhor Baramati Indapur
38 Table 7.4 Continued Satara District 15 Mahabaleshwar Wai Khandala - U - + U 18 Phaltan Man Khatav Koregaon Satara City Jaoli Patan - U + U Karad Sangli District 26 Shirala - + U Walwa Palus Khanapur Atpadi Tasgaon Miraj Kavatemahankal Jat Kadegaon Kolhapur District 36 Shahuwadi Panhala Hatkanangale Shirol Karveer Bavada Radhanagari Kagal Bhudargad Ajara U 46 Gadhinglaj Chandgad Solapur District 48 Karmala Madha Barshi Solapur North Mohol Pandharpur
39 Table 7.4 Continued Malshiras Sangola Mangalwedha Solapur South Akkalkot Note : 1. Population figures in percentage 2. + U = Gained Urban Status and U = Lost Urban Status Source : Based on census data of concern years and concern districts REGIONAL PATTERN OF DECADAL VARIATION IN URBAN POPULATION IN During the decade , study region as a whole recorded an increase of per cent, which was considerably less than that of the country s average (46.14 %) and marginally less than the state s average (39.99 %). Among the tahsils, it was varying between per cent in Haveli tahsil in Pune district and 6.88 per cent in Shahuwadi tahsil in Kolhapur district (Fig. 7.6 A). Haveli ( %), Tasgaon ( %), Hatkanangale (80.88 %) and Koregaon (79.66 %) tahsils showed high variation (above 75.0 %) in their urban population. In the second range (50-75 per cent), there were only two tahsils from Pune district viz. Purandar (66.11 %) and Khed (57.12 %). Among all these tahsils, Haveli tahsil had a vast base of urban population. Majority of these tahsils are located adjoining the tahsils headquarters having developed industrial, agricultural, commercial and administrative base. Pune city influenced the high growth of Haveli tahsil. 13 tahsils claimed the third range (25-50 per cent) of decadal increase in urban population, these included Pune City, Shirur, Maval, Miraj, Baramati, Sangola, Karveer, Shirol, Solapur North, Khanapur, Phaltan, Gadhinglaj and Satara City. Below 25.0 per cent decadal increase was found in 18 tahsils during , these tahsils were Daund, Mahabaleshwar, Junnar, Walwa, Kagal, Pandharpur, Bhor, Karmala, Wai, Man, Barshi, Panhala, Mangalwedha, Indapur, Madha, Akkalkot, Karad and Shahuwadi. There was not even a single tahsil in the study region, which experienced a decrease in urban population during
40 Not a single tahsil in the study region was entirely rural in previous decade of 1971 and recorded urban population in the decade of 1981, while there were three tahsils viz. Velhe, Khandala and Patan, which were having urban population in 1971 but lost their urban status and became entirely rural in REGIONAL PATTERN OF DECADAL VARIATION IN URBAN POPULATION IN During the decade of , the study region recorded an increase of per cent, which was less than the state s average (38.87 %) and country s average (36.19 %) also. As far, the highest and lowest increase is concerned, the highest increase was recorded by Haveli tahsil ( %) in Pune district and Karad (4.51 %) in Satara district recorded the lowest increase. The other tahsils, which experienced high rate of increase in urban population, 257 were Maval (59.98 %), Shirur (51.13 %), Purandar (47.59 %), Hatkanangale (42.92 %) and Sangola (40.42 %). Whereas, at the other end of scale, along with Karad tahsil, the tahsils viz. Kagal (11.78 %), Madha (10.42 %), Shahuwadi (8.11 %) and Wai (6.60%) recorded a low growth rate of urban population during the decade (Fig. 7.6 B). The highest range of increase (75.0 per cent and above) accounted for only one tahsil in Pune district viz. Haveli with per cent of decadal variation in urban population. The second range (50-75 per cent) had two tahsils and those were also from Pune district viz. Maval (59.98 %) and Shirur (51.13 %). The third range (25-50 per cent) included 12 tahsils viz. Purandar (47.59 %), Hatkanangale (42.92 %), Sangola (40.42 %), Tasgaon (37.02 %), Khed (36.23 %), Miraj (35.22 %), Shirol (33.06 %), Khanapur (32.95 %), Phaltan (31.03 %), Walwa (28.54 %), Pune City (26.05 %) and Daund (25.70 %). The tahsils, which recorded moderate rate of increase in urban population were mainly concentrated in and around the tahsils of district headquarters. The lowest range (25 per cent and below) included 22 tahsils (38.0 %), which were mostly distributed all over the study region. The tahsils belonging to this range viz. Indapur, Baramati, Bhor and Junnar of Pune
41 district; Man, Mahabaleshwar, Koregaon, Satara City, Wai and Karad of Satara district; Gadhinglaj, Karveer, Panhala, Kagal and Shahuwadi of Kolhapur district and Pandharpur, Akkalkot, Barshi, Solapur North, Mangalwedha, Karmala and Madha of Solapur district. Sangli district had not any tahsil, which recorded less than 25 per cent rate of increase in urban population. Two tahsils in the study region experienced a decrease or a negative growth rate in urban population during The highest decrease was recorded in Tasgaon tahsil ( %) in Sangli district, followed by Daund tahsil (-25.7 %) in Pune district. Two tahsils in the study region, which recorded urban population in 1991 but were entirely rural in 1981, these tahsils were Patan and Shirala from Satara and Sangli district respectively. While, there was not a single tahsil, which recorded urban population in 1981 and became entirely rural in As far the shift of range of urban population was concerned, Maval and Haveli tahsils in Pune district; Khanapur and Walwa tahsils in Sangli district and Mangalwedha tahsil in Solapur district switched over in the next range, while Daund tahsil in Pune district and Tasgaon tahsil in Sangli district were pushed back to the lower ranges REGIONAL PATTERN OF DECADAL VARIATION IN URBAN POPULATION IN Uneven regional pattern of change in urban population was found in Pune Division during the decade of Pune Division as a whole recorded an increase of per cent, which was for the first time much higher than the average of the state (34.31 %) and also the average of the country (31.40 %). A tahsil-wise rate of increase varied in between per cent and 5.07 per cent, which was recorded by Satara City in Satara district and Shahuwadi tahsil in Kolhapur district respectively. Other tahsils also registered the highest rate of increase in urban population viz. Pune City (56.09 %), Khed (54.99 %), Shirur (46.65 %) and Solapur North (40.53 %). Because of developed industrial and commercial activities, Pune City and Solapur city influenced the high growth of above-mentioned tahsils. On the contrary, along 258
42 with Shahuwadi other tahsils recorded low rate of increase e.g. Gadhinglaj (13.27 %), Karmala (12.32 %), Mangalwedha (10.41%), Akkalkot (6.55 %), Karad (5.77 %) and Madha (5.48 %). The highest range of increase in urban population (75.0 per cent and above) accounted for only one tahsil, that was Satara city in Satara district. The second range (50-75 per cent) included two tahsils from Pune district namely Khed and Pune city. The moderate range of increase in urban population (25-50 per cent) included 13 tahsils in the study region. The low range of increase (below 25.0 per cent) included 20 tahsils in the study region, it means that highest number of tahsils (34.48 %) were in this range. There were six tahsils from Solapur and Satara districts each, five tahsils from Kolhapur district, two tahsils from Pune district and only one tahsil from Sangli district, which recorded the lowest rate of increase in urbanisation. Three tahsils from the study region experienced a negative growth rate in urban population during the decade The highest decrease was recorded by Koregaon tahsil ( %) in Satara district, followed by Shirala tahsil ( %) in Sangli district and Indapur tahsils ( %) in Pune district. There was not a single tahsil in the study region, which lost its urban status during , while there were four tahsils viz. Ambegaon and Mulsi in Pune district; Khandala in Satara district and Ajara in Kolhapur district, which gained their urban status and had urban population in 2001, previously they were entirely rural. 7.7 CLASSIFICATION OF CITIES AND TOWNS IN PUNE DIVISION Towns and cities are essential part for the regional development and the development from them penetrates to their peripheral areas. Particularly historical, economic and social background is one of the exclusive characteristics of Indian cities; therefore, there are some ups and downs in the growth of Indian cities. In the study region, there are also some vicissitudes in the growth of urban areas. Table 7.5 shows the growth of population in the cities in the districts in Pune Division during 1971 to
43 260
44 Table 7.5 Population Growth of Cities and Towns Sr. No. District/Towns Census Years Pune District Pune City Pune Cant Kirkee Dehu Pimpari Chinchwad Khadakwasla Lohagaon Hadapsar Sangvi Dehu Road Cant Vadgaon Sh Kalas Kivale Bopkhel Kharadi Dhankavadi Warji Shivane Vadgaon Bk Alandi Junnar Manchar Shirur Rajgurunagar Chakan Daund Daund (M) Kalamb Indapur Bhigvan Baramati Saswad Shivatkar (Nira) Jejuri Bhor Kuran kh Lonawala Talegaon Dabhade Kusgaon Bk
45 Table 7.5 continued Khadkale Vadgaon Mulshi District Total (42) Satara District Satara Wai Shirwal Koregaon Bhade Rahimatpur Khed Karanje Truf Satara Kodoli Godoli Satara Road Phaltan Mhaswad Karad Sadashivgad (Vanvadi) Patan Humbarli Gokul T. Helwal Mahabaleshwar Panchgani District Total (20) Sangli District Sangli Kupwad Miraj Wanleswadi Madhavnagar Budhgaon Tasgaon Kirloskarwadi Vita Urun Islampur Ashta Mandur District Total (12) Kolhapur District Kolhapur Gandhinagar
46 Table 7.5 continued Panchgaon Unchgaon Kalambe Turf Thane Panhala Ichalkaranji Hupari Kabnur Vadgaon Korochi Jayshingpur Kurundwad Kagal Murgud Ajara Gadhinglaj Malkapur District Total (18) Solapur District Solapur City Solapur (R) Manjrewadi Nehrunagar Barshi Akkalkot Maindargi Dudhani Mangalwedha Pandharpur Sangola Karmala Kurduwadi District Total (13) Grand Total (105) No. of Cities Source : Census of India of concern years and concern districts. As discussed earlier, United Nations categorised urban units into six distinct classes based on population (United Nations, 1958). Considering those classes, urban units in the study region are also classified in six categories viz. Class I cities to Class VI cities. 263
47 7.7.1 CLASSIFICATION OF CITIES (1971) During the decade , all the five district in Pune division together consisted 64 cities, among them 22 cities were in Pune District followed by Satara with 14 cities. Kolhapur and Solapur districts had 11 and 10 cities respectively and with the seven cities Sangli district ranked last. Table 7.6 (A) District-Wise Classification of Urban Centres (1971) Sr. Urban Centre (Class) District No. I II III IV V VI Total 1 Pune Satara Sangli Kolhapur Solapur Total Source : Based on census data of 1971 of concern districts Table 7.6 (A) shows district-wise classification of urban centres in the decade. In this decade, there were four Class I cities in Pune Division; each district had one city, except Satara district. All the four cities were district headquarters. There were eight Class II cities, out of these, Pune district had three (Pimpari-Chinchwad, Pune Cant and Kirkee) and Solapur district had two 264
48 (Barshi and Pandharpur) cities. There were 10 Class III cities in the study region, which were in Pune (4 cities), Satara (3 cities), Sangli (2 cities) and Solapur (1 city) districts. Kolhapur district did not have a single city in Class III category. Most of the urban centres in the study region, being small in population size, were classified as Class IV cities. There were 22 Class IV cities in Pune Division. Pune District has seven of them followed by Kolhapur and Solapur districts with five each. Satara and Sangli districts had three and two Class IV cities respectively. Number of Class V cities was 12; and there were eight class VI cites CLASSIFICATION OF CITIES (1981) In 1981, study region consisted 66 urban units, which were further classified in Class I to Class VI. Two urban units were added in 1981 as compared to the earlier decade. This decade showed most interesting features in classification of cities. More upside-downs were seen in Satara district, there were five urban units, which lost their urban status, these were Sadashivgad, Patan, Humbarli, Bhade and Gokul T. and Helwal, one unit viz. Koregaon gained urban status. Table 7.6 (B) District-Wise Classification of Urban Centres (1981) Sr. Urban Centre (Class) District No. I II III IV V VI Total 1 Pune Satara Sangli Kolhapur Solapur Total Source : Based on census data of 1981of concern districts In Pune district, Kuran Kh lost its urban status and a Daund unit was agglomerated in Daund Municipal limits, on the other hand, Hadapsar, Sangvi, Vadgaon Sh, Kalas and Shivatkar (Nira) gained the classes. Sangli, Kolhapur and Solapur districts maintained their previous urban units and each of them gained one more urban unit. 265
49 266
50 Table 7.6 (B) shows district-wise classification of urban centres in Previously, only the district headquarters of Pune, Sangli, Kolhapur and Solapur districts were categorised in the group of Class I cities except Satara district. During this decade Pune, Sangli and Kolhapur district had additional one city each viz. Pimpari Chinchwad, Miraj and Ichalkaranji gained their status from Class II to Class I cities. Solapur district continued with only one Class I city i.e. Solapur City and Satara did not have any Class I city in this decade too. Apart from that there were six cities in the Class II category, out of them Pune (Pune Cant., Kirkee), Satara (Satara City and Karad), Solapur (Barshi and Pandharpur) districts had two Class II cities each. Out of 17 Class III cities, 7 cities were in Pune district, followed by Sangli district with 5 Class III cities. Satara and Kolhapur districts each had two Class III cities and Solapur had only one. Every district in the study region had Class IV cities. Out of the total 24 Class IV cities, Pune district had nine of them, followed by Kolhapur and Solapur with five cities each. Satara district had four Class IV cities, while Sangli district had only one. Out of three Class VI cites Panhala and Malkapur were located in Kolhapur district. Solapur (Rural) gained urban status because of outgrowth from Solapur City CLASSIFICATION OF CITIES (1991) There was no change in Class I and Class II cities during the period from 1981 to 1991 in all five districts in the study region, but number of Class III and Class V cities increased as compared to those in the earlier decade, while number of Class IV and Class VI cities also increased but addition was in small number. Table 7.6 (C) District-Wise Classification of Urban Centres (1991) Sr. Urban Centre (Class) District No. I II III IV V VI Total 1 Pune Satara Sangli Kolhapur Solapur Total Source : Based on census data of 1991of concern district 267
51 268
52 Table 7.6 (C) shoes the district-wise classification of urban centres in Pune Division during the decade As mentioned earlier, Class I and Class II cities maintained their status in this decade also, however, not a single city from other classes gained as a Class I and Class II city in this decade. Out of total 24 Class III cities 10 cities and out of total 25 Class IV cites 11 cities were located in Pune district. Rest of the districts showed some dissimilarity in the distribution of Class III and Class IV cites. There were 14 Class V cities in the study region, out of them eight cities were in Pune district alone. Solapur (Manjrewadi and Solapur R) and Kolhapur (Murgud and Malkapur) districts had two Class V cities each. Sangli (Mandur) and Satara (Satara Road) districts had one Class V city each. There were four Class VI cities in the study region and except Satara district; each district had one of them. Dehu (Pune district), Wanleswadi (Sangli district), Panhala (Kolhapur district) and Nehrunagar (Solapur district) were the Class VI cities. Out of them Dehu, Wanleswadi and Nehrunagar were the product of outgrowth from the nearby major cities, while Panhala from Kolhapur district got urban status especially because of its importance as hill station and tourist destination CLASSIFICATION OF CITIES (2001) According to 2001 census, apart from the seven Class I cities from those in the previous decade, only one city, which gained its status in this decade and became Class I from Class II i.e. Satara city, which is also a district headquarters. Moreover, Sangli-Miraj-Kupwad is a one million plus agglomerated zone created in Sangli district, which was having almost 4.5 million population during this decade. Table 7.6 (D) shows the district-wise classification of urban centres in Pune Division during There were eight Class I cities in the study region. Out of them Pune, Kolhapur and Solapur districts had two each same as in the earlier decade. There were eight Class II cities, as compared to those in the previous decade. Two cities from Class III group improved their status and became 269
53 Class II, which were Baramati and Lonawala in Pune district and with two previous Class II cities (Pune Cant. and Kirkee); this district had four i.e. 50 per cent of Class II cities in the study region. Rest of the Class II cities continued their status from previous decade to this decade. Table 7.6 (D) District-Wise Classification of Urban Centres (2001) Sr. Urban Centre (Class) District No. I II III IV V VI Total 1 Pune Satara Sangli Kolhapur Solapur Total Source : Based on census data of 2001 of concern district Fig Number of Towns in Pune Division ( ) In this census year, highest number of cities, almost above 64 per cent were in the Class III and Class IV categories. Out of 27 Class III cities, Pune and Kolhapur districts had eight cities each, followed by Solapur district (5) Sangli districts (4) and Satara district (3). There were 22 Class IV cities in the division, out of which seven cities were located in Pune and Satara district 270
54 each; Kolhapur district had four out of them and Sangli and Solapur had two Class IV cities each. Eight cities were in Class V category, from which four were in Pune district and three cities in Kolhapur district, only one Class V city was located in Satara district. Satara, Sangli and Kolhapur districts had one Class VI city each, specifically Sadashivgad (Vanvadi) from Satara district, Mandur from Sangli district and Panhala from Kolhapur district. Pune and Solapur districts did not have any Class VI city. According to above discussion, upside-down changes were found in the classification of the cities from Class I to Class VI group. Pune City was the only tahsil from Pune district, which became a cent percent urbanised tahsil in the study region. Class III and Class IV cities covered lot of area in the study region and most of them were having influence of the Class I and Class II cities nearby them. Class V and Class VI cities were mostly the peripheral cities nearby upper class cities and were the result of outgrowth from those upper class cities. 7.8 ZONES OF URBANISATION The tahsil-wise urbanisation levels in 2001 helped to demark the Zones of urbanisation (Fig. 7.11). There were three such zones viz. I. Zone of high urbanisation having above 50.0 per cent urbanisation level, II. Zone of moderate urbanisation having urbanisation level between 25.0 to 50.0 per cent, and III. Zone of low urbanisation having below 25.0 per cent urbanisation level ZONE OF HIGH URBANISATION As per the investigation, the level of urbanisation of the study region was not up to the mark. During 2001, 15 tahsils out of 58 tahsils were not having urban population; it means that all these tahsils were entirely rural. Remaining 43 tahsils excluding aforesaid tahsils were considered with their urbanisation level to demarcate zones of urbanisation. 271
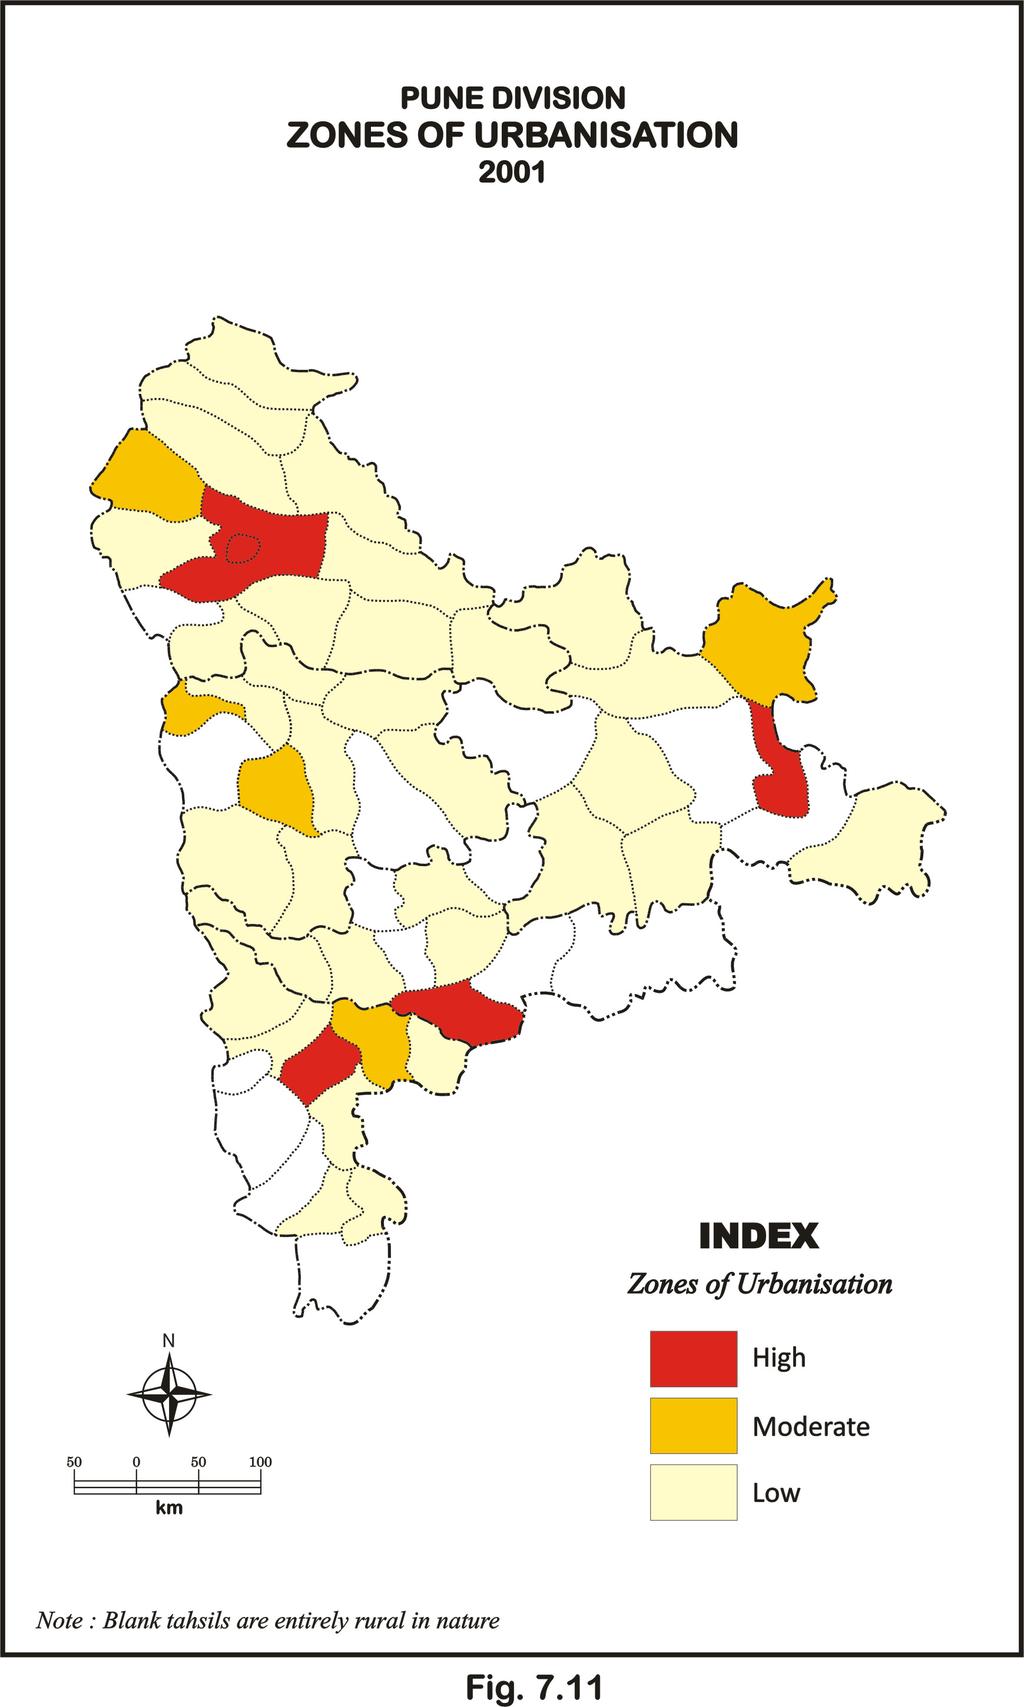
55 272
Post Independence Trends of Urbanization and Role of Small and Medium Towns in Maharashtra- A Geographical Analysis
 Post Independence Trends of Urbanization and Role of Small and Medium Towns in Maharashtra- A Geographical Analysis A careful and systematic study of the process of urbanization and related factors is
The trends and patterns of urbanization in the NCT of Delhi during
 International Journal of Interdisciplinary and Multidisciplinary Studies (IJIMS), 2015, Vol 2, No.4, 27-39. 27 Available online at http://www.ijims.com ISSN: 2348 0343 The trends and patterns of urbanization
Studies. Population and Development
 Studies in Population and Development No. 12-05 Urbanisation in Gujarat Evidence from 2011 Population Census Aalok Ranjan Chaurasia Shyam Institute URBANISATION IN GUJARAT Evidence from the provisional
POPULATION CHARACTERISTICS IN SOLAPUR DISTRICT
 CHAPTER- III POPULATION CHARACTERISTICS IN SOLAPUR DISTRICT 3.1 INTRODUCTION 3.2 THE GROWTH OF POPULATION IN SOLAPUR DISTRICT 3.3 SPATIAL PATTERN OF GROWTH OF POPULATION IN SOLAPUR DISTRICT 3.4 BIRTH RATE
Population Trend of Urban India
 Population Trend of Urban India Arun Keshav 1 and J.B.Komaraiah 2 Abstract This paper tries to draw attention on the increasing urbanisation trend in India. It tries to highlight that though presently,
SPATIO-TEMPORAL ANALYSIS OF URBAN POPULATION GROWTH AND DISTRIBUTION IN AURANGABAD CITY
 International Journal of Research in Social Sciences Vol. 8 Issue 3, March 2018, ISSN: 2249-2496 Impact Factor: 7.081 Journal Homepage: Double-Blind Peer Reviewed Refereed Open Access International Journal
Topic 4: Changing cities
 Topic 4: Changing cities Overview of urban patterns and processes 4.1 Urbanisation is a global process a. Contrasting trends in urbanisation over the last 50 years in different parts of the world (developed,
Chapter 10 Human Settlement Geography Book 1 Class 12
 CHAPTER 10 HUMAN SETTLEMENTS 1. RURAL, SUB URBAN AND URBAN SETTLEMENTS: This classification is common worldwide but the criteria differ from country to country. 5. Criteria for classification differs from
Unit No-1&2. Settlement Geography
 Unit No-1&2 Settlement Geography TYPES OF SETTLEMENTS Rural Settlements - agriculture as the predominant occupation. Urban settlements - principal industries are secondary and tertiary. Rural Settlement:
AP Human Geography Free-response Questions
 AP Human Geography Free-response Questions 2000-2010 2000-preliminary test 1. A student concludes from maps of world languages and religions that Western Europe has greater cultural diversity than the
A STUDY OF HUMAN DEVELOPMENT APPROACH TO THE DEVELOPMENT OF NORTH EASTERN REGION OF INDIA
 ABSTRACT A STUDY OF HUMAN DEVELOPMENT APPROACH TO THE DEVELOPMENT OF NORTH EASTERN REGION OF INDIA Human development by emphasizing on capability approach differs crucially from the traditional approaches
Urbanisation & Economic Geography (2)
") GEOG1101: Introduction to Economic Geography Tuesday 20 October, 2009 Urbanisation & Economic Geography (2) Kevon Rhiney Department of Geography and Geology University of the West Indies, Mona Lecture
GEOG1101: Introduction to Economic Geography Tuesday 20 October, 2009 Urbanisation & Economic Geography (2) Kevon Rhiney Department of Geography and Geology University of the West Indies, Mona Lecture
Summary and Implications for Policy
 Summary and Implications for Policy 1 Introduction This is the report on a background study for the National Spatial Strategy (NSS) regarding the Irish Rural Structure. The main objective of the study
CITIES IN TRANSITION: MONITORING GROWTH TRENDS IN DELHI URBAN AGGLOMERATION
 Dela 21 2004 195-203 CITIES IN TRANSITION: MONITORING GROWTH TRENDS IN DELHI URBAN AGGLOMERATION 1991 2001 Debnath Mookherjee Western Washington University, Bellingham, Washington USA. e-mail: debnath.mookherjee@wwu.edu
SRJIS/BIMONTHLY/S. A. BORUDE. ( ) APPLICATION OF SPATIAL VARIATION URBAN DENSITY MODEL: A STUDY OF AHMEDNAGAR CITY, MAHARASHTRA, INDIA
 APPLICATION OF SPATIAL VARIATION URBAN DENSITY MODEL: A STUDY OF AHMEDNAGAR CITY, MAHARASHTRA, INDIA") APPLICATION OF SPATIAL VARIATION URBAN DENSITY MODEL: A STUDY OF AHMEDNAGAR CITY, MAHARASHTRA, INDIA S.A. Borude, Assistant Professor, PG, Dept. of Geography, Ahmednagar College, Ahmednagar, Maharashtra.
APPLICATION OF SPATIAL VARIATION URBAN DENSITY MODEL: A STUDY OF AHMEDNAGAR CITY, MAHARASHTRA, INDIA S.A. Borude, Assistant Professor, PG, Dept. of Geography, Ahmednagar College, Ahmednagar, Maharashtra.
ABSTRACT One of the serious problems that India facing today is the problem of regional disparities. It results in social, economic and political
 ABSTRACT One of the serious problems that India facing today is the problem of regional disparities. It results in social, economic and political instability. The current tension and strain in the Indian
Measuring Disaster Risk for Urban areas in Asia-Pacific
 Measuring Disaster Risk for Urban areas in Asia-Pacific Acknowledgement: Trevor Clifford, Intl Consultant 1 SDG 11 Make cities and human settlements inclusive, safe, resilient and sustainable 11.1: By
A Review of Concept of Peri-urban Area & Its Identification
 A Review of Concept of Peri-urban Area & Its Identification Ar. Manita Saxena Research Scholar Department of Architecture and Planning M.A.N.I.T, Bhopal Dr. Supriya Vyas Assistant Professor, Department
Spatio-temporal changes in literacy of Nandurbar district of Maharashtra, India
 2015; 1(10): 602-606 ISS Print: 2394-7500 ISS Online: 2394-5869 Impact Factor: 5.2 IJAR 2015; 1(10): 602-606 www.allresearchjournal.com Received: 23-07-2015 Accepted: 24-08-2015 RC Ahire Geography, Late
R E SEARCH HIGHLIGHTS
 Canada Research Chair in Urban Change and Adaptation R E SEARCH HIGHLIGHTS Research Highlight No.8 November 2006 THE IMPACT OF ECONOMIC RESTRUCTURING ON INNER CITY WINNIPEG Introduction This research highlight
URBAN LAND USE STRATEGIES AND INFRASTRUCTURE PROVISION IN AHMEDABAD CITY
 URBAN LAND USE STRATEGIES AND INFRASTRUCTURE PROVISION IN AHMEDABAD CITY 1 HARSH M PATEL, 2 BHUPENDRA M MARVADI 1 Student, M.E. Infrastructure Engineering, Dept. of Civil Engineering, L.D.R.P. Institute
Urbanisation and Socio-Economic Structure in Lakshadweep
 International Journal of Research in Geography (IJRG) Volume 3, Issue 3, 2017, PP 30-37 ISSN 2454-8685 (Online) http://dx.doi.org/10.20431/2454-8685.0303003 www.arcjournals.org Urbanisation and Socio-Economic
Urban Centre, Urbanisation and Urban Growth
 Urban Centre, Urbanisation and Urban Growth 2.1 lntroduction 2.2 Concept of Urban 2.3 Defining "Urban" in the Indian Context. 2.4 Some Categories of Towns According to the lndian Census 2.5 Concept of
Global Atmospheric Circulation. Past climate change and natural causes. Global climate change and human activity
 GCSE Geography Edexcel B Revision Checklist Paper 1. Global Geographical Issues Topic 1. Hazardous Earth Key Idea I know/ understand The world s climate system Global Atmospheric Circulation Past climate
National Spatial Development Perspective (NSDP) Policy Coordination and Advisory Service
 Policy Coordination and Advisory Service") National Spatial Development Perspective (NSDP) Policy Coordination and Advisory Service 1 BACKGROUND The advances made in the First Decade by far supersede the weaknesses. Yet, if all indicators were
National Spatial Development Perspective (NSDP) Policy Coordination and Advisory Service 1 BACKGROUND The advances made in the First Decade by far supersede the weaknesses. Yet, if all indicators were
Developing a global, peoplebased definition of cities and settlements
 Developing a global, peoplebased definition of cities and settlements By Lewis Dijkstra, Lewis.Dijkstra@ec.europa.eu Head of the Economic Analysis Sector DG for Regional and Urban Policy, Regional & Urban
Analysis of travel-to-work patterns and the identification and classification of REDZs
 Analysis of travel-to-work patterns and the identification and classification of REDZs Dr David Meredith, Teagasc, Spatial Analysis Unit, Rural Economy Development Programme, Ashtown, Dublin 15. david.meredith@teagasc.ie
The National Spatial Strategy
 Purpose of this Consultation Paper This paper seeks the views of a wide range of bodies, interests and members of the public on the issues which the National Spatial Strategy should address. These views
Declaration Population and culture
 Declaration Population and culture The ministers of the parties to the Alpine Convention regard the socio-economic and socio-cultural aspects mentioned in Article 2, Paragraph 2, Item a., as being central
Downloaded from
 GIST OF THE LESSON: General patternsof population distribution in the world, density of population, factors influencing the distribution of population, population growth, trends in population growth, doubling
DENSITY OF POPULATION
 DENSITY OF POPULATION Chapter 4 The concept of population density is a simple concept of relating population size to the land area with a view to assessing crudely the pressure of population upon the resources
Measuring Agglomeration Economies The Agglomeration Index:
 Measuring Agglomeration Economies The Agglomeration Index: A Regional Classification Based on Agglomeration Economies J. P. Han Dieperink and Peter Nijkamp Free University, The Netherlands* Urban agglomerations
AP Human Geography Unit 7a: Services Guided Reading Mr. Stepek Introduction (Rubenstein p ) 1. What is the tertiary sector of the economy?
 1. What is the tertiary sector of the economy?") Public Business Consumer AP Human Geography Unit 7a: Services Guided Reading Mr. Stepek Introduction (Rubenstein p 372 374) 1. What is the tertiary sector of the economy? 2. What is a service activity?
Public Business Consumer AP Human Geography Unit 7a: Services Guided Reading Mr. Stepek Introduction (Rubenstein p 372 374) 1. What is the tertiary sector of the economy? 2. What is a service activity?
Operational Definitions of Urban, Rural and Urban Agglomeration for Monitoring Human Settlements
 Operational Definitions of Urban, Rural and Urban Agglomeration for Monitoring Human Settlements By Markandey Rai United Nations Human Settlements Programme PO Box-30030 Nairobi, Kenya Abstract The United
Module 2.1: Defining the Urban in India
 Module 2.1: Defining the Urban in India Role Name Affiliation National Coordinator Subject Coordinator Paper Coordinator Prof Sujata Patel Ashima Sood Surya Prakash Department of Sociology, University
ENVIRONMENTALLY ORIENTED PLANNING FOR HUMAN SETTLEMENTS
 40 TOPIC 7 ENVIRONMENTALLY ORIENTED PLANNING FOR HUMAN SETTLEMENTS Scope The process of rapid population growth and urbanization taking place in practically all the less developed countries will have an
Rural Gentrification: Middle Class Migration from Urban to Rural Areas. Sevinç Bahar YENIGÜL
 'New Ideas and New Generations of Regional Policy in Eastern Europe' International Conference 7-8 th of April 2016, Pecs, Hungary Rural Gentrification: Middle Class Migration from Urban to Rural Areas
CHANGES IN THE STRUCTURE OF POPULATION AND HOUSING FUND BETWEEN TWO CENSUSES 1 - South Muntenia Development Region
 TERITORIAL STATISTICS CHANGES IN THE STRUCTURE OF POPULATION AND HOUSING FUND BETWEEN TWO CENSUSES 1 - South Muntenia Development Region PhD Senior Lecturer Nicu MARCU In the last decade, a series of structural
Course Name Rural and Urban Sociology. Department Humanities and Social Sciences IIT Kanpur. Dr. Anindita Chakrabarti. NPTEL Online - IIT Bombay
 NPTEL Online - IIT Bombay Course Name Rural and Urban Sociology Department Humanities and Social Sciences IIT Kanpur Instructor Dr. Anindita Chakrabarti file:///d /NPTL%20WORK/Dr.%20Anindita%20Chakrabarti/UrbanSociology/lecture1/main.html
CHAPTERN-III DENSITY AND DISTRIBUTION OF POPULATION
 CHAPTERN-III DENSITY AND DISTRIBUTION OF POPULATION 3.1 Introduction. 3.2 Determinants of population Distribution and Density. 3.3 Trends of Population Density. 3.4 Variation in Density of Population for
Rural Alabama. Jennifer Zanoni. Geography Division U.S. Census Bureau. Alabama State Data Center 2018 Data Conference Tuscaloosa, Alabama
 Rural Alabama Jennifer Zanoni Geography Division U.S. Census Bureau Alabama State Data Center 2018 Data Conference Tuscaloosa, Alabama May 17, 2018 Agenda Census Geography Urban/Rural Definitions County-based
Regional Snapshot Series: Transportation and Transit. Commuting and Places of Work in the Fraser Valley Regional District
 Regional Snapshot Series: Transportation and Transit Commuting and Places of Work in the Fraser Valley Regional District TABLE OF CONTENTS Complete Communities Daily Trips Live/Work Ratio Commuting Local
International Court of Justice World Trade Organization Migration and its affects How & why people change the environment
 Social Issues Unit 2 Population Grade 9 Time for Completion: 12 class period State Standard: The student uses a working knowledge and understanding of the spatial organization of Earth s surface and relationships
Dublin City Schools Social Studies Graded Course of Study Grade 5 K-12 Social Studies Vision
 K-12 Social Studies Vision The Dublin City Schools K-12 Social Studies Education will provide many learning opportunities that will help students to: develop thinking as educated citizens who seek to understand
AP Human Geography Free Response Questions Categorized
 AP Human Geography Free Response Questions Categorized 2002-2010 2. Population (13-17%) 3. Over the past 150 years, Europe has changed from a source to a destination region for international migration.
Improving rural statistics. Defining rural territories and key indicators of rural development
 Improving rural statistics Defining rural territories and key indicators of rural development Improving rural statistics Improving Rural Statistics In 2016, the Global Strategy to improve Agricultural
Identification of vulnerable areas in municipal corporation of Greater Mumbai due to extreme events based on socio economic indicators
 Indian Journal of Geo-Marine Sciences Vol. 42 (7), November 2013, pp. 907-914 Identification of vulnerable areas in municipal corporation of Greater Mumbai due to extreme events based on socio economic
Settlements are the visible imprint made by the man upon the physical
 Settlements are the visible imprint made by the man upon the physical landscape through the process of cultural occupancy. It is manmade colony of human being in which they live, work, and move to pursue
A Case Study of Regional Dynamics of China 中国区域动态案例研究
 A Case Study of Regional Dynamics of China 中国区域动态案例研究 Shuming Bao Spatial Data Center & China Data Center University of Michigan 1:00 PM - 2:00 PM, Tue, Feb 6, 2018 EST USA A Case Study of Regional Dynamics
Frans Thissen Department of Geography, Planning and International Development Studies Rural Poverty in Flanders
 Frans Thissen Department of Geography, Planning and International Development Studies Rural Poverty in Flanders a diversity of poverty in a diversity of places Rural poverty research in Flanders Henk Meert
International Journal of Scientific Research and Reviews
 Case Study Available online www.ijsrr.org ISSN: 2279 0543 International Journal of Scientific Research and Reviews A Study on Urban Population Concentration across Various Districts of North Bengal Arindam
AAG CENTER FOR GLOBAL GEOGRAPHY EDUCATION Internationalizing the Teaching and Learning of Geography
 Using the CGGE Materials in Advanced Placement Human Geography Classes About the CGGE: The AAG Center for Global Geography Education (CGGE) is a collection of online modules for undergraduate courses in
REPUBLIC OF ZAMBIA STATEMENT THE HONOURABLE LUCKY MULUSA, M.P., MINISTER OF NATIONAL DEVELOPMENT PLANNING,
 REPUBLIC OF ZAMBIA Permanent Mi$sion of Zambia to the United Nations, 237 East 52nd Street, New York, NY 10022 Tex: (212) 888-5770 Fax: (212) 888-5213 E-mail: zambia@un.int Please check against delivery
Development of modal split modeling for Chennai
 IJMTES International Journal of Modern Trends in Engineering and Science ISSN: 8- Development of modal split modeling for Chennai Mr.S.Loganayagan Dr.G.Umadevi (Department of Civil Engineering, Bannari
The History Behind Census Geography
 The History Behind Census Geography Michael Ratcliffe Geography Division US Census Bureau Kentucky State Data Center Affiliate Meeting August 5, 2016 Today s Presentation A brief look at the history behind
Urban Geography. Unit 7 - Settlement and Urbanization
 Urban Geography Unit 7 - Settlement and Urbanization Unit 7 is a logical extension of the population theme. In their analysis of the distribution of people on the earth s surface, students became aware
Spatial Distribution of Primary Health Centres in Solapur District of Maharashtra
 EUROPEAN ACADEMIC RESEARCH Vol. II, Issue 6/ September 2014 ISSN 2286-4822 www.euacademic.org Impact Factor: 3.1 (UIF) DRJI Value: 5.9 (B+) Spatial Distribution of Primary Health Centres in A. G. NIMASE
Spatial and temporal change in distribution of urban population according to hierarchy of urban centres in Jalgaon district (MS)
") 2015; 1(12): 39-43 ISSN Print: 2394-7500 ISSN Online: 2394-5869 Impact Factor: 5.2 IJAR 2015; 1(12): 39-43 www.allresearchjournal.com Received: 07-09-2015 Accepted: 08-10-2015 Jaywantrao Gulabrao Patil
2015; 1(12): 39-43 ISSN Print: 2394-7500 ISSN Online: 2394-5869 Impact Factor: 5.2 IJAR 2015; 1(12): 39-43 www.allresearchjournal.com Received: 07-09-2015 Accepted: 08-10-2015 Jaywantrao Gulabrao Patil
The History Behind Census Geography
 The History Behind Census Geography Michael Ratcliffe Geography Division US Census Bureau Tennessee State Data Center August 8, 2017 Today s Presentation A brief look at the history behind some of the
HSC Geography. Year 2013 Mark Pages 10 Published Jul 4, Urban Dynamics. By James (97.9 ATAR)
") HSC Geography Year 2013 Mark 92.00 Pages 10 Published Jul 4, 2017 Urban Dynamics By James (97.9 ATAR) Powered by TCPDF (www.tcpdf.org) Your notes author, James. James achieved an ATAR of 97.9 in 2013 while
HSC Geography Year 2013 Mark 92.00 Pages 10 Published Jul 4, 2017 Urban Dynamics By James (97.9 ATAR) Powered by TCPDF (www.tcpdf.org) Your notes author, James. James achieved an ATAR of 97.9 in 2013 while
SUBJECT: YEAR: Half Term:
 Geography 9 1 Introduction to Population and population distribution begin to explain the pattern of population distribution. describe and explain the pattern of population distribution at a range of scales.
CERTIFIED RESOLUTION. introduction: and dated May 29, 2017, as attached, as appropriate
 15322 Buena Vista Avenue, White Rock BC, Canada V4B 1Y6 www.whiterockcity.ca City of White Rock P: 604.541.22121 F: 604.541.9348 /2tC% City Clerk s Office IT E ROC K June 13,2017 Stephanie Lam, Deputy
POPULATION ATLAS OF SLOVAKIA
 POPULATION ATLAS OF SLOVAKIA Jozef Mládek Department of Human Geography and Demogeography Faculty of Nature Sciences Comenius University Bratislava mladek@fns.uniba.sk Jana Marenčáková University of Central
MULTIPLE CHOICE. Choose the one alternative that best completes the statement or answers the question.
 Exam Name MULTIPLE CHOICE. Choose the one alternative that best completes the statement or answers the question. 1) One important feature of the world's population with the most significant future implications
Council Workshop on Neighbourhoods Thursday, October 4 th, :00 to 4:00 p.m. Burlington Performing Arts Centre
 Council Workshop on Neighbourhoods Thursday, October 4 th, 2012 1:00 to 4:00 p.m. Burlington Performing Arts Centre Agenda Introductions Warm-Up Exercise Presentation Exercise Neighbourhood Planning Break
Urbanization in Japan since 1960 viewed from the DID Statistics
 Institute of Geography, Asahikawa Campus Hokkaido University of Education Asahikawa, 070-8621, Japan 1. Introduction Urban expansion is one of the most important features of land use/cover changes in the
Groveport Madison Local School District Sixth Grade Social Studies Content Standards Planning Sheets
 Standard: Citizenship Rights and Responsibilities A. Show the relationship between civic participation and attainment of civic and public goals. 1. Explain how opportunities for citizens to participate
URBAN CHANGE DETECTION OF LAHORE (PAKISTAN) USING A TIME SERIES OF SATELLITE IMAGES SINCE 1972
 USING A TIME SERIES OF SATELLITE IMAGES SINCE 1972") URBAN CHANGE DETECTION OF LAHORE (PAKISTAN) USING A TIME SERIES OF SATELLITE IMAGES SINCE 1972 Omar Riaz Department of Earth Sciences, University of Sargodha, Sargodha, PAKISTAN. omarriazpk@gmail.com ABSTRACT
URBAN CHANGE DETECTION OF LAHORE (PAKISTAN) USING A TIME SERIES OF SATELLITE IMAGES SINCE 1972 Omar Riaz Department of Earth Sciences, University of Sargodha, Sargodha, PAKISTAN. omarriazpk@gmail.com ABSTRACT
A Framework for the Study of Urban Health. Abdullah Baqui, DrPH, MPH, MBBS Johns Hopkins University
 This work is licensed under a Creative Commons Attribution-NonCommercial-ShareAlike License. Your use of this material constitutes acceptance of that license and the conditions of use of materials on this
World Geography. WG.1.1 Explain Earth s grid system and be able to locate places using degrees of latitude and longitude.
 Standard 1: The World in Spatial Terms Students will use maps, globes, atlases, and grid-referenced technologies, such as remote sensing, Geographic Information Systems (GIS), and Global Positioning Systems
Presented By: Bikram Kumar Dutta and Sanhita Bandyopadhyay
 Presented By: Bikram Kumar Dutta and Sanhita Bandyopadhyay INTRODUTION NEED OF STUDY DAWN OF CITY SPATIO-TEMPORAL TEMPORAL GROWTH OF DELHI CITY GROWTH WITH DIFFERENT MASTER PLANS PULL AND PUSH FACTOR FOR
C) Discuss two factors that are contributing to the rapid geographical shifts in urbanization on a global scale.
 Discuss two factors that are contributing to the rapid geographical shifts in urbanization on a global scale.") AP Human Geography Unit VII. Cities and Urban Land Use Free Response Questions FRQ 1 Rapid urbanization in Least Developed Countries (LDCs) has many profound impacts for the world. Answer the following
AP Human Geography Unit VII. Cities and Urban Land Use Free Response Questions FRQ 1 Rapid urbanization in Least Developed Countries (LDCs) has many profound impacts for the world. Answer the following
Dar es Salaam - Reality Check Workshop
 Dar es Salaam - Reality Check Workshop hosted by GIZ and Dar es Salaam City Council Introduction: Key Urban Characteristics of Dar es Salaam Challenges and Opportunities for Resilient Development in the
Curriculum Unit. Instructional Unit #1
 Curriculum Unit Name of Course: AP Human Geography Grade Level(s): 9-12 Brief Description (Course Catalog): The purpose of the AP Human Geography course is to introduce students to the systematic study
AS Population Change Question spotting
 AS Change Question spotting Changing rate of growth How the rate of growth has changed over the last 100 years Explain the reasons for these changes Describe global or national distribution. Study the
DEPARTMENT OF GEOGRAPHY JANANAYAK CHANDRASHEKHAR UNIVERSITY, BALLIA. Course Structure for Ph.D. (Doctor of Philosophy) Admission Test
 Admission Test") DEPARTMENT OF GEOGRAPHY JANANAYAK CHANDRASHEKHAR UNIVERSITY, BALLIA Course Structure for Ph.D. (Doctor of Philosophy) Admission Test Department of Geography ACADEMIC SESSION -2018-19 JANANAYAK CHANDRASHEKHAR
DEPARTMENT OF GEOGRAPHY JANANAYAK CHANDRASHEKHAR UNIVERSITY, BALLIA Course Structure for Ph.D. (Doctor of Philosophy) Admission Test Department of Geography ACADEMIC SESSION -2018-19 JANANAYAK CHANDRASHEKHAR
Together towards a Sustainable Urban Agenda
 Together towards a Sustainable Urban Agenda The City We (Youth) Want Preliminary findings from youth consultations Areas Issue Papers Policy Units 1.Social Cohesion and Equity - Livable Cities 2.Urban
Chapter 12. Key Issue Three: Why do business services locate in large settlements?
 Chapter 12 Key Issue Three: Why do business services locate in large settlements? Business Services and Settlements World cities Ancient world cities Medieval world cities Modern world cities Hierarchy
Belfairs Academy GEOGRAPHY Fundamentals Map
 YEAR 12 Fundamentals Unit 1 Contemporary Urban Places Urbanisation Urbanisation and its importance in human affairs. Global patterns of urbanisation since 1945. Urbanisation, suburbanisation, counter-urbanisation,
Too Close for Comfort
 Too Close for Comfort Overview South Carolina consists of urban, suburban, and rural communities. Students will utilize maps to label and describe the different land use classifications. Connection to
Local Area Key Issues Paper No. 13: Southern Hinterland townships growth opportunities
 Draft Sunshine Coast Planning Scheme Review of Submissions Local Area Key Issues Paper No. 13: Southern Hinterland townships growth opportunities Key Issue: Growth opportunities for Southern Hinterland
DATA BASE AND METHODOLOGY
 DATA BASE AND METHODOLOGY The work is mainly based on primary data which will be generated through field work. The interviews and discussions with member of management of sugar factories in the district
Introduction to the Study of Urban Geography
 38: 281 Urban Unit I Introduction to the Study of Urban Introduction to the Study of Urban 1.1 Urban as an Academic Discipline 1.2 The Object of Urban 1.2.i What is a City, What is Urban? 1.2.ii What is
DETERMINE OF REGIONAL DEVELOPMENT STRATEGIES IN IZMIR
 Sukran Yalpir Asli Bozdag Saban Inam DETERMINE OF REGIONAL DEVELOPMENT STRATEGIES IN IZMIR Globalization INTRODUCTION Economic pressure cause Economic migration cause cause Spatial organizations Spatial
CHAPTER 4 HIGH LEVEL SPATIAL DEVELOPMENT FRAMEWORK (SDF) Page 95
 Page 95") CHAPTER 4 HIGH LEVEL SPATIAL DEVELOPMENT FRAMEWORK (SDF) Page 95 CHAPTER 4 HIGH LEVEL SPATIAL DEVELOPMENT FRAMEWORK 4.1 INTRODUCTION This chapter provides a high level overview of George Municipality s
CHAPTER 4 HIGH LEVEL SPATIAL DEVELOPMENT FRAMEWORK (SDF) Page 95 CHAPTER 4 HIGH LEVEL SPATIAL DEVELOPMENT FRAMEWORK 4.1 INTRODUCTION This chapter provides a high level overview of George Municipality s
INDIANA ACADEMIC STANDARDS FOR SOCIAL STUDIES, WORLD GEOGRAPHY. PAGE(S) WHERE TAUGHT (If submission is not a book, cite appropriate location(s))
 WHERE TAUGHT (If submission is not a book, cite appropriate location(s))") Prentice Hall: The Cultural Landscape, An Introduction to Human Geography 2002 Indiana Academic Standards for Social Studies, World Geography (Grades 9-12) STANDARD 1: THE WORLD IN SPATIAL TERMS Students
Prentice Hall: The Cultural Landscape, An Introduction to Human Geography 2002 Indiana Academic Standards for Social Studies, World Geography (Grades 9-12) STANDARD 1: THE WORLD IN SPATIAL TERMS Students
UNIT 22 THEORY AND PRACTICE OF CENTRAL SETTLEMENTS IN DEVELOPMENT PLANNING
 and Administration UNIT 22 THEORY AND PRACTICE OF CENTRAL SETTLEMENTS IN DEVELOPMENT PLANNING Structure 22.0 Objectives 22.1 Introduction 22.2 Region and Central Place in the Context of Decentralised Development
Population Change. Alessandro Alasia Agriculture Division Statistics Canada. (ICRPS) Summer School 2009
 Summer School 2009") Population Change in Rural Areas Seminar presented by Alessandro Alasia Agriculture Division Statistics Canada alessandro.alasia@statcan.gc.ca International Comparative Rural Policy Studies (ICRPS) Summer
Population Change in Rural Areas Seminar presented by Alessandro Alasia Agriculture Division Statistics Canada alessandro.alasia@statcan.gc.ca International Comparative Rural Policy Studies (ICRPS) Summer
Enquiry question: How does the world s climate system function, why does it change and how can this be hazardous for people?
 Content Topic 1: Hazardous Earth Enquiry question: How does the world s climate system function, why does it change and how can this be hazardous for people? 1.1 The atmosphere operates as a global system
SOCIAL STUDIES Grade 6 Standard: History
 Standard: History Chronology A. Interpret relationships between events shown on multipletier 1. Construct a multiple-tier time line from a list of events time lines. and interpret the relationships between
Citation for published version (APA): Terluin, I. J. (2001). Rural regions in the EU: exploring differences in economic development s.n.
: Terluin, I. J. (2001). Rural regions in the EU: exploring differences in economic development s.n.") University of Groningen Rural regions in the EU Terluin, Ida Joke IMPORTANT NOTE: You are advised to consult the publisher's version (publisher's PDF) if you wish to cite from it. Please check the document
University of Groningen Rural regions in the EU Terluin, Ida Joke IMPORTANT NOTE: You are advised to consult the publisher's version (publisher's PDF) if you wish to cite from it. Please check the document
Key Issue 1: Where Are Services Distributed? INTRODUCING SERVICES AND SETTLEMENTS LEARNING OUTCOME DESCRIBE THE THREE TYPES OF SERVICES
 Revised 2017 NAME: PERIOD: Rubenstein: The Cultural Landscape (12 th edition) Chapter Twelve Services and Settlements (pages 430 thru 457) This is the primary means by which you will be taking notes this
TOPIC 8: POPULATION DISTRIBUTION AND URBANIZATION
 TOPIC 8: POPULATION DISTRIBUTION AND URBANIZATION Concept of population distribution Factors affecting population distribution and density Urbanization: Concept and issues associated Introduction WORLD
WORLD GEOGRAPHY INSTRUCTIONAL PACING GUIDE
 FIRST NINE WEEKS Standard USHC-1 Standard WG-1: The student will demonstrate an understanding of the physical and human characteristics of places, including the creation of regions and the ways that culture
A Simplified Travel Demand Modeling Framework: in the Context of a Developing Country City
 A Simplified Travel Demand Modeling Framework: in the Context of a Developing Country City Samiul Hasan Ph.D. student, Department of Civil and Environmental Engineering, Massachusetts Institute of Technology,
Human development is a well-being concept with its core being the capability
 www. epratrust.com Impact Factor : 0.998 p- ISSN : 2349-0187 e-issn : 2347-9671 January 2015 Vol - 3 Issue- 1 HUMAN DEVELOPMENT IN ASSAM- A DISTRICT LEVEL ANALYSIS Bishweshwar Bhattacharjee 1 1 Ph.D. Research
Cultural Diffusion. AP HG SRMHS Mr. Hensley
 Cultural Diffusion AP HG SRMHS Mr. Hensley Space-time compression: The reduction in time it takes for something to reach another place Because of technology, connections have reduced distance (not literally
The Shape of the Territorial-Administrative Systems from the North-Western Region
 The Shape of the Territorial-Administrative Systems from the North-Western Region Vasile Surd, Vasile Zotic University Babeş-Bolyai, Cluj-Napoca, Romania In a social political system marked by rapid input
Key Issue 1: Where Are Services Distributed?
 Key Issue 1: Where Are Services Distributed? Pages 430-433 *See the Introduction on page 430 to answer questions #1-4 1. Define service: 2. What sector of the economy do services fall under? 3. Define
A Micro-Analysis of Accessibility and Travel Behavior of a Small Sized Indian City: A Case Study of Agartala
 A Micro-Analysis of Accessibility and Travel Behavior of a Small Sized Indian City: A Case Study of Agartala Moumita Saha #1, ParthaPratim Sarkar #2,Joyanta Pal #3 #1 Ex-Post graduate student, Department