POPULATION CHARACTERISTICS IN SOLAPUR DISTRICT
|
|
|
- Melanie Shepherd
- 5 years ago
- Views:
Transcription
1 CHAPTER- III POPULATION CHARACTERISTICS IN SOLAPUR DISTRICT 3.1 INTRODUCTION 3.2 THE GROWTH OF POPULATION IN SOLAPUR DISTRICT 3.3 SPATIAL PATTERN OF GROWTH OF POPULATION IN SOLAPUR DISTRICT 3.4 BIRTH RATE IN SOLAPUR DISTRICT Birth rate for rural areas Birth rate for urban areas 3.5 DEATH RATE IN SOLAPUR DISTRICT Death Rate for Rural Area Death Rate for Urban Area 3.6 INFANT MORTALITY RATE IN SOLAPUR DISTRICT 3.7 DENSITY OF POPULATION Variation in Density of Population in Solapur district Spatial Variation in Density of Population in Solapur district Density of Population in Rural Area Density of Population in Urban Area 3.8 DISTRIBUTION OF POPULATION IN SOLAPUR DISTRICT Tahsilwise Percentage of Total Population 3.9 SEX COMPOSITION OF SOLAPUR DISTRICT Sex Ratio for Solapur District and Maharashtra Temporal Variations in Sex Ratio in Solapur District 78
2 Spatial Variations in Sex Ratio in Solapur District Decadal Variations in Rural Urban Sex Ratio 3.10 AGE COMOPOSITION OF SOLAPUR DISTRICT Agewise Percentage of Population 3.11 OCCUPATIONAL STRUCTURE IN SOLAPUR DISTRICT Proportion of Workers to the Total Population in the Solapur Distirct ( ) Primary Workers Secondary Workers Tertiary Workers 3.12 LITERACTY PATTERN IN SOLAPUR DISTIRCT Temporal Literacy Pattern in Solpaur district ( ) Tahsilwise Literacy Pattern in Solpaur district REFRENCES. 79
3 CHAPTER- III POPULATION CHARACTERISTICS IN SOLAPUR DISTRICT 3.1 INTRODUCTION: Because of differences in social economic cultural, political and geographical systems, the problems of developing and developed regions relating to population differ. The knowledge of population density and distribution size, growth and compostion, finding out the disparities associated with socioeconomic development in a particular region. Hence, the understanding of population characteristics is highly useful for the socio-economic and political development of a region. The knowledge associated with the spatial and temporal distribution of population, growth and composition helps planners to assess the existing pressure of population on available facilities and may plan for the future orientated development programme to solve the existing problems in that region. The most important problem before the country today, is the one created by population explosion. All attempts to improve socio-economic condition of the people are thrown out of the gear, which increased from 238 million in 1901 to 1002 million in Solapur district also during the same period experienced enormous increase in the total population which increased from 0.87 million in 1901 to 3.8 million in 2001.The present chapter is associated with various aspects of population in Solapur district. Growth rates since, 1901, till 2001, have been discussed in detail. Birth rates, death rates and infant mortality rates have been also taken in to account. Infact, the growth of population in any area is an index of its economic development, social awakening and many other characters. The 80
4 growth of population is one of the significant factors associated with man's occupancy. In other words, it flows in size from time to time and people migrate temporarily or permanently both within the administrative boundaries and across them. The growth of population in any area is determined by three basic factors namely, human fertility, human mortality and human mobility. The difference between human fertility and mortality is called natural increase of population. There are many factors which are responsible for increasing, the natural growth of population. The demographic factors and social factors influence the growth rate of population. The present pattern of population growth is simply the latest phase of census, of the growth trend in the past. The trends of population growth rates are basic to the change in the overall geographic personality of any area. The purpose of this topic is to examine the dynamic of population numbers in the study region during the period along with their broad implications, on socio-economic development, such analysis has provided not only an understanding of the contemporary demographic situation in the study region but also provided clues about the likely trend in this regard in the years to come. These in turn, has given a measure of social and economic problems within the district and for its various tahsils, and are called upon to solve the problems. The growth of population means, any change in population numbers. If, this change is in negative direction, then population decreases. When, it is in positive direction, then population increases. In the present chapter, we are discussing about the growth of population since 1901 in the whole district. Then we have discussed the tahsil-wise population growth during , and have determined the sub-regions of population growthrates, such as, high population growth-rate region, medium population growth rates region and low population growth-rate region. 81
5 3.2 THE GROWTH OF POPULATION The growth of population may be approached just by taking into consideration the next growth of population over the basic year. The growth rate assumes special significance, when viewed in temporal perspective. The growth of population has been taken in to consideration for the last ten decades that is for The growth rate of population has a great significance for the geographer to understand the various social and economic problems. GROWTH RATE: The actual growth rate of specific decade is obtained by dividing the difference between the populations of two dates and multiplying it with 100 as under: Pn-Po r = x 100 Po Where : r = Growth rate. Pn = Population of next year. Po = Population of base year. 100 is for percentage value. The table 3.1 reveals that the trends of general rural and urban population growth rates vary from rural to urban areas during the span of 100 years ( ). The trend of general population growth rate and rural population growth rate by and large are lower than the urban growth rate, except, during periods. But, there are remarkable ups and downs in the urban population growth rates during the span of hundred years ( ) 82
6 Table 3.1 Growth Rate of Population Sr. Growth Rate in percentage Decade No Total General Rural Urban Source : Socio-economic abstract of Solapur district. The general population growth rate and rural population growth rate have been gradually increasing up to the year Only and decades showed reverse trends. There was severe toll of life due to influenza epidemic (1918) and other severe diseases. During the decade there were 93,766 deaths (out of 96,961 births) due to plague, cholera, fevers, bowel complaints and other causes. Same case was recurred in decade, where 89,008 deaths (out of births) occurred. The heavy toll of life was experienced in the rural areas as compared to the urban areas. After the independence of India huge medical facilities have been provided to rural areas, which helped in controlling the epidemics and other diseases in the study region of Solapur district. 83
7 There were remarkable ups and downs in the trend of urban population. The growth rate sharply declined during and decades, while it suddenly increased during decade. The growth rate decreased by percent during and during decades, while it increased by during decade. The growth rate declined during decade due to heavy toll of life due to fevers and due to respiratory diceases in urban areas, it recorded was percent and percent respectively. In the case of decade, the urban definition was changed and there was consequent reclassification of four towns in the village, viz Mohol, Madha, Akluj and Malshiras. There was sudden growth in urban population during due to the emergence of three urban centres and control of fevers and respiratory diseases in urban areas. i) : In this period population grew by 1,85,423 for region as a whole. In this, net increase for urban population was 93,182 (i.e percent), while for rural areas was 92,814 (i.e percent) increase. During this period birth rate was percent in 1901 and percent in While these figures are taken into consideration, it shows that the population grew due to high fertility rate than that of the mortality rates. ii) : In this period, population enhanced by 79,525, in this, net increase of population for urban areas was (i.e.30 percent), and (i.e. 70 percent) increase was for rural population. During this period, the birth rate was percent in 1931 and percent in 1961, while death rate was percent and percent respectively. These figures show that the birth rates and death rates both declined. But there was an interesting observation that the birth rates did not decline in 84
8 proportion to death rates. It was, therefore, the major cause for population increase in the Solapur district. iii) : In this period, the population grew by In this net increase of population, (i.e percent) was contributed by urban population, while (i.e percent) was increased by rural population. The birth rates were 35.4 in 1961 and percent respectively. These figures show that the population grew in this period due to gradual decline in births and sudden decline in the deaths. Rapid decline in mortality rate was a major cause for the population increase. iv) : During this period the population grew by for the district as a whole. The increase in percentage was of the order of percent for total population, percentage for rural and percent for urban areas of the district, the total increase was of , which is about percent, while for rural areas of the district, contributed , percent which is percent in rural areas. The birth rate was percent in 1991, while it declined to in The death rates during the same period were recorded to 5.08 percent and 5.35 percent respectively. From this, it can be concluded that the growth rate of population though, declined, but due to better food supply, the death by and large, remained the same. Hence, there is a growth of actual and natural increase of population. From the preceding discussion, it can be concluded that the population increased due to higher fertility rates as compared to the mortality rates during the first three decades ( ). During the next three decades ( ), it increased due to rapid decline in death rates than that of the birth rates. While during the last four decades, it increased, because of sharp decline in death rates. In brief, the fertility is the major cause for the 85
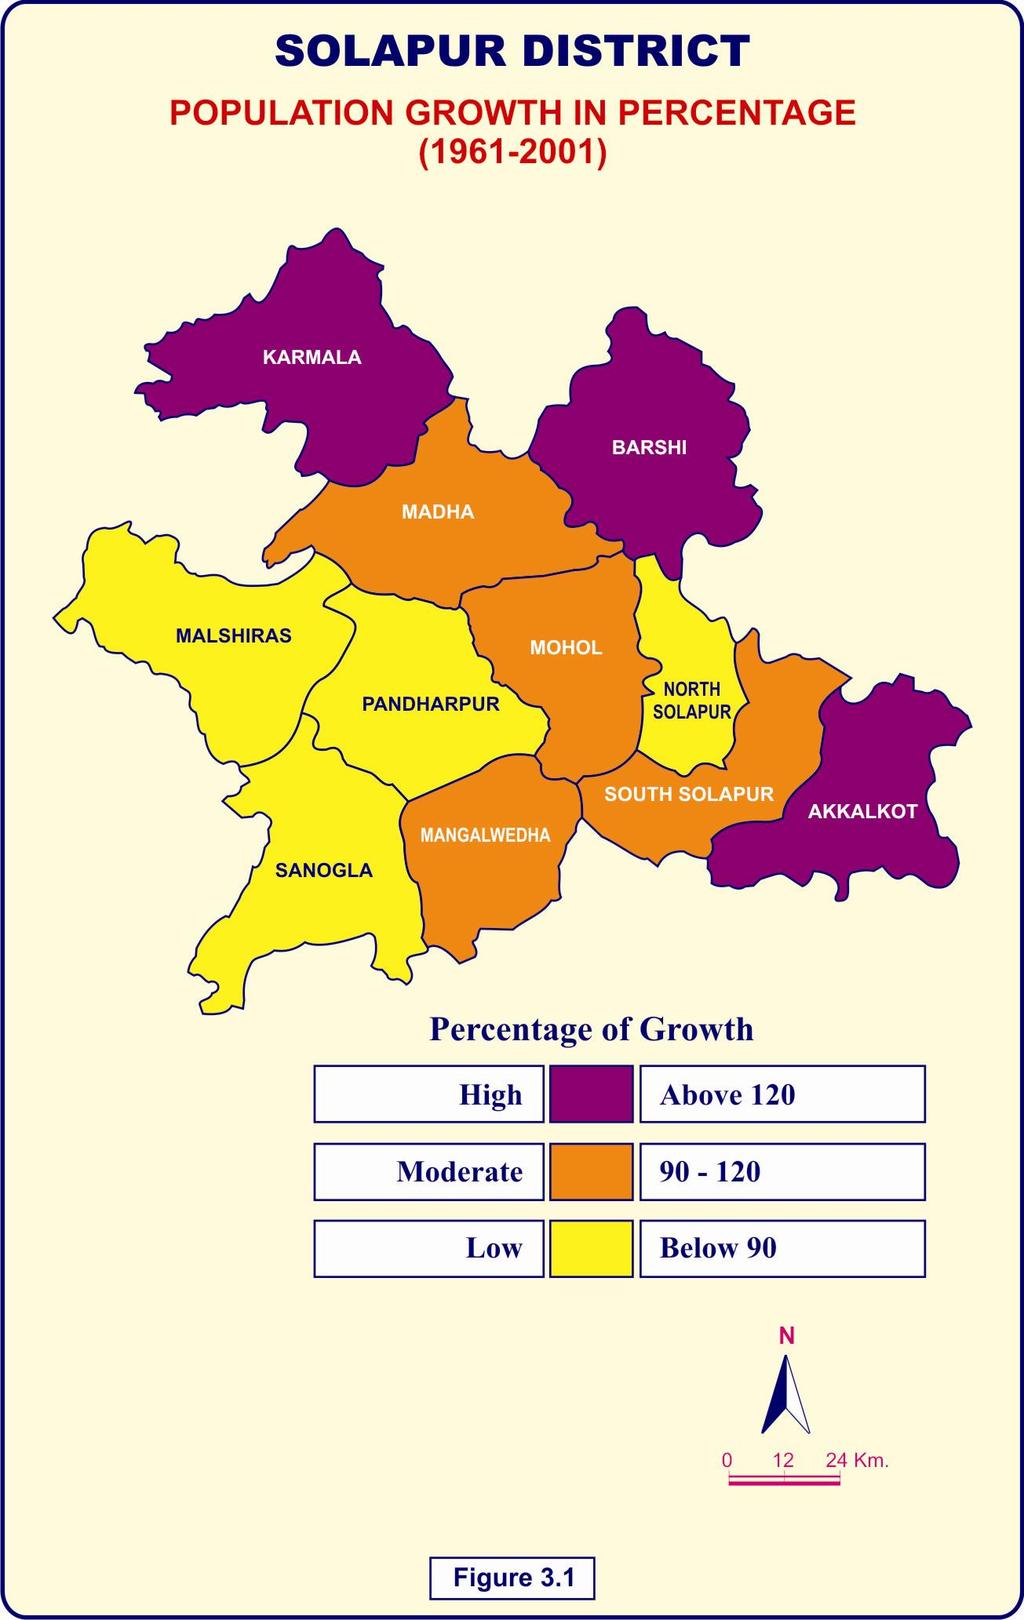
9 first three decades ( ) while the mortality is a major cause for next three decades ( ).Mortality and mobility both are the causes for high increase in population for last four decades that is for It emerges from the above discussion that the history of population growth in the study region, thus, has been mainly a faction of the changing pattern of the death rates in the years to come. On the other hand, even under favourable conditions, births rates have taken a comparatively long time to decline. It is most likely, therefore, that with the current trend, population of the study region will continue to grow at accelerated rates even during coming decades. It is obvious from the points discussed above that the accelerated growth of population during the post independence period has not retarded the socio-economic development which otherwise has been substantial, but it seems sure to be the main stumbling block in study region. If the same demographic trend continuous, it will produce adverse effects on the environmental conditions of the land as well as the Psychology of the people in the long run. 3.3 SPATIAL PATTERN OF GROWTH OF POPULATION IN SOLAPUR DISTRICT: The table 3.2 indicates that Solapur district had percent of growth rate of population during Thus, spatial pattern of growth rate of population varies enormously within the district. i) High Population Growth Rate: The Barshi tahsil recorded highest growth rate while Pandharpur tahsil recorded lowest growth rate during Within the district, the Barshi, Akkalkot and Karmala tahsils have recorded the growth of population above the average for the region. Tahsils, which have recorded 86
10 higher growth rate of population, infact, are of the order of , and percent. (Fig. 3.1) Table 3.2 Tahsilwise growth of population during Sr. Tahsil Population Growth rate No Barshi Akkalkot Karmala Madha South Solapur Mangalwedha Mohol Sangola North Solapur Malshiras Pandharpur District Total Source: Socio-economic abstract of Solapur district. ( ) ii) Medium Population Growth Rate: The Madha, Mangalwedha South Solapur and Mohol tahsils of the study region fall in this category. Madha had percent population growth, Mangalwedha percent, South Solapur percent while Mohol tahsil had percent growth of population during Mangalwedha and South Solapur tahsils are located extreme south 87
11 88
12 of the Solapur district on the border between Maharashtra and Karnataka states, while Mohol tahsil is located in the central part of the study region. iii) Low Population Growth Rate: Sangola, North Solapur, Malshiras and Pandharpur tahsils belong to this category. Sangola represents percent of population growth rate while Malshiras shows percent growth rate and Pandharpur depicts percent of growth rate respectively during period. North Solapur represents percent growth rate of population. Malshiras, Pandharpur and Sangola are located in western side of the district while North Solapur belongs to eastern part of the district bordering Karnataka state. 3.4 BIRTH RATE IN SOLAPUR DISTRICT: Birth rate is one of the most important factors influencing growth of population in any particular region. In early days, birth rate was very high only on account of high death rate. This was, due to the security point of view for parents in old age. Since, children become the only supporting means for parents. In ancient period both births as well as death rates were high due to insufficient medical facilities as well as insufficient availability of nutriticious food. Now days, both birth as well as death rates have come down due to improvement in better medical facilities and improved food supply. If, there, is a close region, than the birth rates becomes the only factor influencing the growth of population. In order to understand the contribution made by birth rate in Solapur district towards growth of population. The birth rates for different periods and for various tahsils have been calculated for the year 1981, 1991and
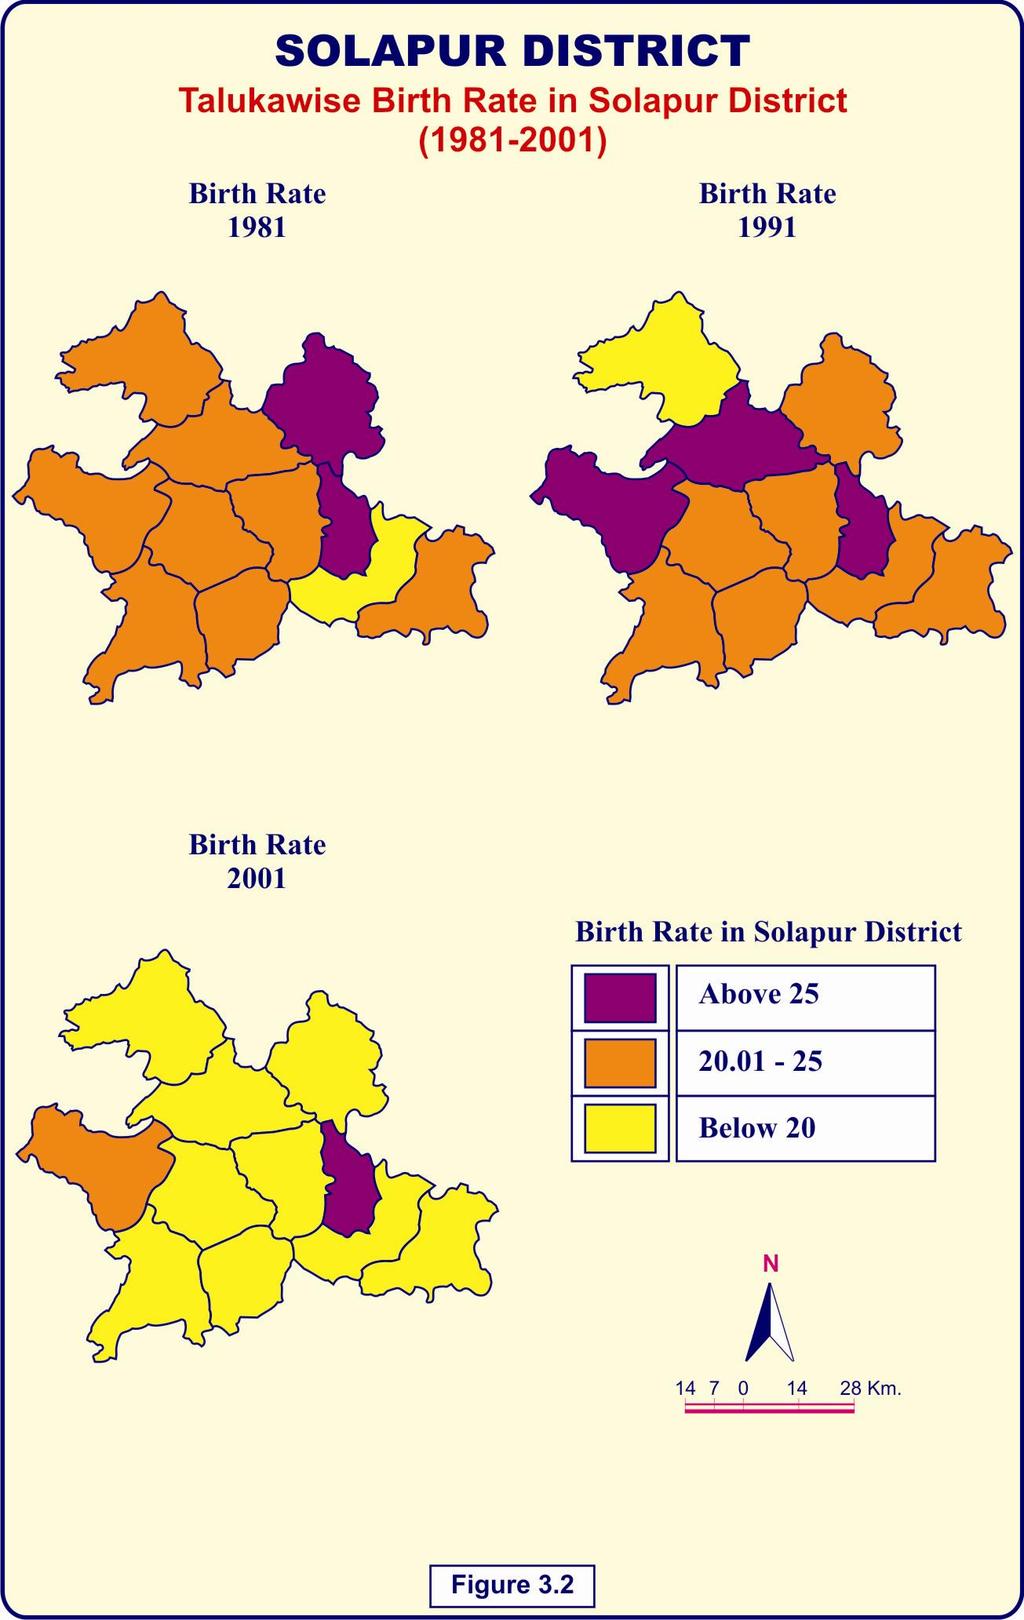
13 Table 3.3 Tahsil wise Birth Rates in Solapur district Sr. No. Tahsil Karmala Madha Barshi North Solapur Mohol Pandharpur Malshiras Sangola Mangalwedha South Solapur Akkalkot Dist. Total Source : Socio-economic abstract of Solapur district. ( ) In 1981, birth rates for Solapur district was percent, which slightly declined and became percent in During periods, it substantially declined and became as low as percent. This decline may be attributed to increase in literacy rate and impact of family planning programmes, such as the age at marriage has been increased both for male and female during the recent period, as well as, the awareness, among the people created by the Government, planners and local reformers. Similarly, the birth rates were calculated for the all tahsils of Solapur district. The birth rates within the Solapur district varies enormously within the district, the highest birth rate was for the North 90
14 Solapur tahsil during the last three decades. It may be due to the availability of maternity hospital in the Solapur city while from other tahsils, generally, people come to the city, of Solapur for delivery, in order to avoid any complications during the delivery period. Due to this reason, the highest birth rates for the North Solapur have been recorded for 1981, 1991, 2001 period. (Table 3.3) On the other hand, the lowest birth rate was calculated for Malshiras tahsil, due to entirely rural region. The number of maternity hospital and lack of other medical facilities, the birth rate were recorded lower for this tahsil during But it increased substaintially during the period, the reason behind it, may be, the increase in the medical facilities and number of maternity hospitals. The average birth rate for the Solapur district was percent in the year 1981, and Karmala, Madha, Mohol, Malshiras, Sangola, Magalwedha and South Solapur have shown, birth rates below from the district average. While, North Solapur, Barshi and Pandharpur have shown, birth rates above the district average. It clearly reveals that the urban places like Solapur, Barshi, and Pandharpur have better maternity facilities. During the periods, the birth rate remains by and large the same for the district and there has been slight fluctuation, in birth rates within the district. Again, north Solapur tahsil was on the first rank and Malshiras in the last as per as the birth rates are concerned. (Fig.3.2) It is a matter of surprise, that cumulative effect made by the Government, planners, and social workers have reflected in the awaking the people in the period. It is clear form fact, that the birth rate for the district as a whole was as low as percent in For the similar reasons, again, North Solapur recorded the highest birth rates. 91
15 92
16 While on the other hand, South Solapur recorded lowest birth rate. Most of the people from South Solapur use the medical facilities from the Solapur city which is in close proximity. Hence, most of the high birth rates are recorded from the South Solapur in the city of Solapur. The tahsils which have recorded birth rates lower than the district average are Karmala, Madha, Mohol, Pandharpur, South Solapur and Akkalkot. On the other hand, tahsil which have shown higher birth rate than the region average are North Solapur, Barshi, Malshiras, Sangola and Mangalwedha. It might be due to wide spread, of medical facilities in different parts of the district by the government Birth Rate for Rural Areas: The rural and urban pattern of birth rates are different, as the nature of living, occupation structure, literacy pattern, per capita income are also different within the two areas. India is a predominently agricultural country, where more than 70 percent people are still engaged in primary activities. Hence, the mode of life, actually differ from rural to urban areas. It is generally, expected, that the birth rates are higher in the rural areas on one hand and lower in urban areas on the other due to relatively developed society. In order to understand, the contribution made by rural and urban areas towards the growth of population in Solapur district, the birth rates were calculated for both rural as well as urban sectors for different tahsil during period (Table 3.4). Contrary to expectation, surprisingly, the birth rates for urban areas were found much higher than the rural areas for periods, for region as a whole. If, we compare the birth rate for rural areas with that of urban areas then we find, that there is a tremendous difference as regard to birth rate. 93
17 Table 3.4 Rural Urban Birth Rates ( ) Sr. Tahsil Birth rate for rural areas Birth rate for Urban areas Karmala Madha Barshi N. Solapur Mohol Pandharpur Malshiras Sangola Magalwedha S. Solapur Akkalkot District Total For 1991, the comparison between rural and urban areas clearly indicates that for urban it is more than two times than the rural areas. In 1991, the birth rate for rural areas for district as a whole was percent and for the urban areas it was percent during the same period. The highest birth rate for rural sector was for Mangalwedha tahsil while the lowest was for the Malshiras tahsil. Other than this two extremes tahsils, the birth rate varies from tansil to tahsil; the tashils which have recorded lower birth rates than average for the region are the Karmala, North Solapur, Pandharpur, Malshiras, South Solapur and Akkalkot. On the other hand tehsils, which have shown higher birth rate, are Mangalwedha and Barshi tahsils. These fluctuations in the birth rates, for rural areas within the various tahsils are due to recording of the birth rate in non-authentic way. It shows that the birth rates are not recorded properly in Solapur district. (Fig. 3.3) 94
18 95
19 For 2001, the average birth rate was percent being highest for Malshiras, while the lowest for North Solapur. North Solapur tahsil is dominated by the city of Solapur and Malshiras is entirely rural tahsil in Solapur district. More or less the year 2001, also represent the same picture as it was in Birth Rate for Urban Areas: As a matter of fact, the birth rate for urban areas are lower than, the birth rate of rural areas in general. This is, because that the urban areas have better educational, medical and employment opportunities. Apart from this, the recreational facilities, are also much more in urban areas than the rural sectors. However, it is a matter of astonishment that the maintenance of proper records of the birth rate is not maintained in rural sectors properly. This has resulted in against of expectation, higher birth rate in all the tahsils in Solapur district. In urban areas, the records of birth rate are properly maintained. (Fig 3.4) In the year 2001, the urban birth rate was percent for district as a whole, the highest for the Karmala and lowest for the North Solapur. The North Solapur tehsil is predominantly occupied by the Solapur city. Taking into consideration all dimensions of social and economic developments, the birth rate is lowest for Solapur city, as it is expected. Except, Akkalkot and North Solapur tehsils, all other tahsils in the Solapur district have shown substantially higher birth rate in DEATH RATE IN SOLAPUR DISTRICT: Death rate is another important factor, influencing the growth of population in a particular region. If, death rates are higher in a region, it results in the lower growth rate. If, the net migrant are not taken into consideration then death rate becomes most important component in the decreasing of the growth rate of population. In view of this, an attempt has been made to understand, the impact made by death rate on the 96
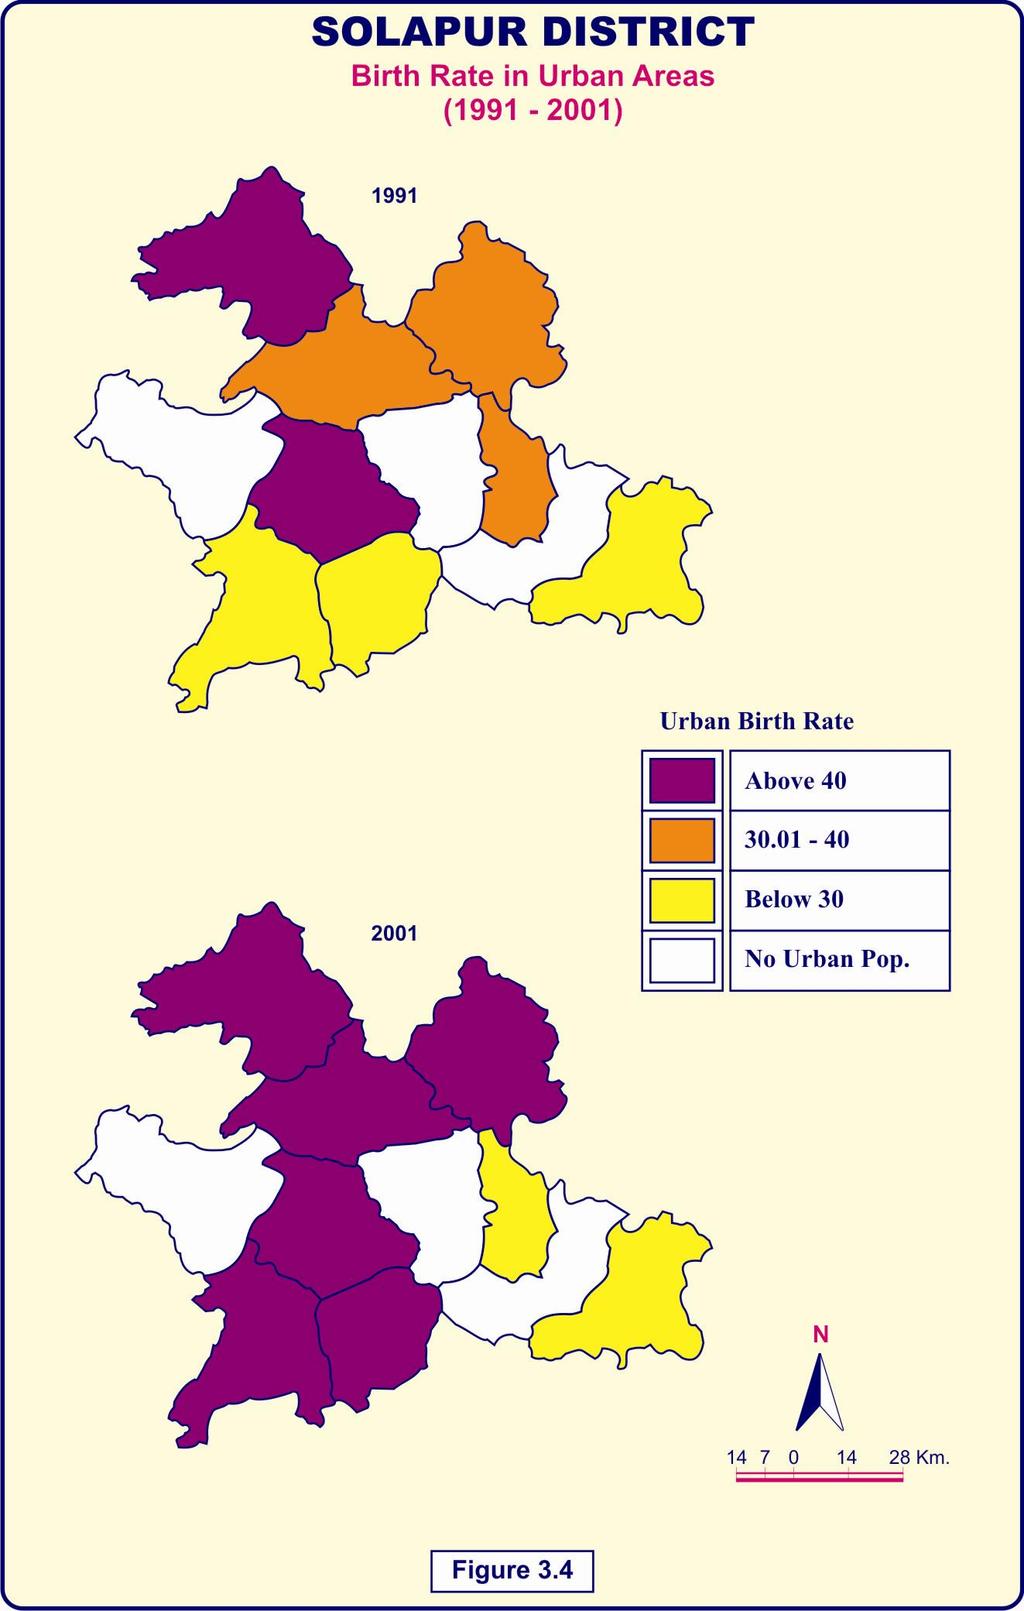
20 97
21 population growth. For this analysis, the death rates have been calculated per thousands of population for the year 1981, 1991 and (Table 3.5) Table 3.5 Tahsil wise Death Rates in Solapur district. Sr.No. Tahsil Karmala Madha Barshi North Solapur Mohol Pandharpur Malshiras Sangola Mangalwedha South Solapur Akkalkot Dist. Total For the district of Solapur as a whole, the death rate was calculated to 6.22 percent per thousand populations. At the same time, the death rates were calculated for various tahsils for the same period. It is here, worth mentioning that the highest death rate was recorded for Barshi on one hand and lowest of 3.94 percent for the Malshiras tahsil on the other. Except, four tahsils namely Barshi, North Solapur, South Solapur and Akkalkot, rest other tahsils have shown death rates lower than the district average in the year 1981 (Table 3.5). Similarly, in the year 1991, the death rates were calculated for all the tahsils in Solapur district, the average death rate was 5.08 percent for the region as a whole while; highest death rate was recorded for 98
22 Mangalwedha and lowest for Malshiras tahsil. Except, North Solapur, Barshi and Mangalwedha tahsils all other tahsils have shown death rate much lower than the region average. Though, the death rate varies enormously within the region during 1991 period. Death rate was also calculated for the year 2001 for all the tahsils in the Solapur district. The average death rate was found 5.35 percent for the region as a whole. In comparison to previous two decades of 1981 and 1991, the year 2001, does not show a much significant variation in death rate within various tahsils in Solapur district. The highest death rate was recorded to 6.78 percent for North Solapur tahsil and the lowest death rate of 3.68 percent was observed in Karmala Tahsils. Except, Akkalkot, North Solapur, and Barshi tahsils all the other tahsils have shown death rate much lower than the region average. The causes for this variation may be the same as mentioned earlier Death Rate for Rural Areas: Death rates are responsible for loosing as well as for gaining the population, affecting the positive and negative growth rate. Rural as well as Urban death rates are different due to the variations in medical facilities. Urban and rural areas also vary in occupation, per capita income and illiteracy. For the year 1991 and 2001, the rural death rates differ enormously in different tahsils in Solapur district. These were calculated to understand the spatial pattern of death rates, which in turn reflect the growth of population in a particularly region. (Table 3.6) 99
23 Table 3.6 Tahsil wise Rural Urban Death Rate Sr. No. Tahsil Death rate for rural areas Death rate for Urban areas Karmala Madha Barshi N. Solapur Mohol Pandharpur Malshiras Sangola Magalwedha S. Solapur Akkalkot District Total For the year 1991, the average death rate for the district as a whole, was 3.88 percent per 1000 of population. Surprisingly, it increased to percent for the year 2001, in rural areas of Solapur district. The spatial pattern of rural death rate varies enormously for the year The high death rate was for the Mangalwdha tahsil, while, lowest for Malshiras tahsil in the south western part of the Solapur district. Tahsils, which have recorded death rate lower than the district average, are Karmala, Madha, North Solapur, Pandharpur and Malshiras. Rest, other tahsils have shown death rate higher than district average. For the year 2001, as stated earlier, the average death for the district as a whole was 4.38 percent per 1000 of population. The highest 100
24 death rate was found in Akkalkot tahsil, while it was lowest for Karmala tahsil within district of Solapur. It also varies from one tahsil to another due to different socio-economic reasons. (Fig. 3.5) Death Rate for Urban Areas: The rural urban differential for the death rate is obvious from the higher death rate in different areas of Solapur. It is a matter of surprise, that in spite of, influencing availability of medical facilities, the death rate for urban areas has been higher subsequently, for the year 1991 and It is clear from the fact, that it was 8.06 percent in 1991 for the Solapur district as a whole. There are three tahsils namely Mohol, Malshiras and south Solapur where there are no urban settlements. The highest death rate for urban areas was recorded for Madha tahsil, while the lowest was for the Sangola tahsil. There are four tahsils, constiting of Karmala, Sangola, Mangalwedha and Akkalkot, where the death rate for urban areas was much lower than the district average. Remaining other tahsils namely Madha, Barshi, North Solapur and Pandharpur have recorded the death rate for urban areas, higher than the district average. This variation may be attributed, to various social-economic and geographical reasons within the tahsils. Similarly, the death rates for urban areas were also calculated for the year The average death rate of Solapur district as a whole was 7.43 per 1000 of population. Due to improvement in better medical facilities and secured food supply, has resulted in decline death rate in The highest death rate was recorded for Madha tahsil, while the lowest for Sangola in the year There are number of tahsils which have shown death rate above the region average. These are Karmala, Madha, Barshi and Mangalwedha, while rest of tahsils in Solapur district, have shown death rate below average. The causes behind this may be different in the standard of living of the people and different in the medical facilities. (Fig.3.6) 101
25 102
26 103
27 3.6 INFANT MORTALITY RATE IN SOLAPUR DISTRICT: Infant mortality rate may be considered as an index of the socially and economically developing society. In a country like India, still the priority is given to male child. Female children are considered as a burden on the society. This is, because, India is still a male dominated society. The infant mortality rate, which is death of children below the age of one year, in other words, the infant mortality rate is death of suckling children. This is calculated as the death of children below one year to the total death in a particular year. The higher infant mortality rate means socially and economically poor and backward society. The lower infant mortality rate is associated with the developed rich and advance society. Because of high literacy rate, high production and high per capita income result in least differential male and female children. The infant mortality rates have been calculated for the year 1981, 1991, and 2001 for different tahsils of Solapur district. As expected, the infant mortality has declined gradually, for the last three decades. In 1981, the infant mortality rate was for the Solapur district as a whole of 0.81 which declined to 0.28 in the year (Table 3.7) Spatial pattern of infant mortality rate varies within the district from one tahsil to another. It was higher for Barshi tahsil, on the one hand, and lowest for Malshiras tahsils on the other. Except, three tahsils namely Pandharpur, North-Solapur and Barshi, all other tahsils have shown, the infant mortality rate, below the district average. For the year 1991 and 2001, the infant mortality rates have declined slowly to a certain extent. For the year 1991, the average infant mortality for the district was The tahsils consist of Madha, Barshi, North Solapur, Pandharpur and Mangalwedha, have shown infant mortality rate above the region, while remaining other tahsils have shown infant mortality rate below the region average. Similarly, it may be expected the 104
28 highest infant mortality rate for North Solapur tahsil while the lowest for Malshiras tahsil. Table 3.7 Infant Mortality Rate in Solapur district Sr.No. Tahsil Karmala Madha Barshi North Solapur Mohol Pandharpur Malshiras Sangola Mangalwedha South Solapur Akkalkot Dist. Total Source : Socio-economic abstract of Solapur district. ( ) For the year 2001, the average infant mortality rate was calculated to The highest for North Solapur and lowest for Manglwedha tahsil with slight, fluctuation, the infant mortality rate was recorded below 0.5 for almost, for all tahsils except for North Solapur. 3.7 DENSITY AND DISTRIBUTION OF POPULATION The concept of distribution and density as applied to population are not identical, but are closely interrelated and hence, can be discussed 105
29 simultaneously. Distribution of population is very commonly represented by two types of maps, one using dots for numbers and the other using different density categories based on ratios of number of people to area. The term density of population on the other hand; refers to a ratio between population and land area. Thus, it is a measure of the degree of population concentration. Generally, it is expressed in terms of number of persons per unit of area. However, the density of population is expressed in different ways to understand the population resource relationship. These ratios have been designated as arithmetic density, physiological density, nutrition density, agricultural density and economic density. However, most of these ratios suffer from certain, handicaps, particularly when an international comparison is sought for. Land and people constitute two vital elements of an area. Hence, the ratio between the two is of fundamental importance in all population studies. Arithmetic density is a ratio between total population and total area and is expressed in terms of persons per square mile or kilometer of the area. The data for such a calculation are readily available for most parts of the world. Hence, such a ratio is frequently employed by geographers and other social scientists. It reveals simple man-land relationship. However, it cannot be used as a measure of population pressure on land because it merely gives a simple quantitative relationship between man and land. Another measure of man-land ratio, devised quite frequently is what is known as agricultural density. In this measure only agricultural population is correlated with the total area under cultivation. It is expressed as agricultural population per square miles or kilometers of the cultivated area. 106
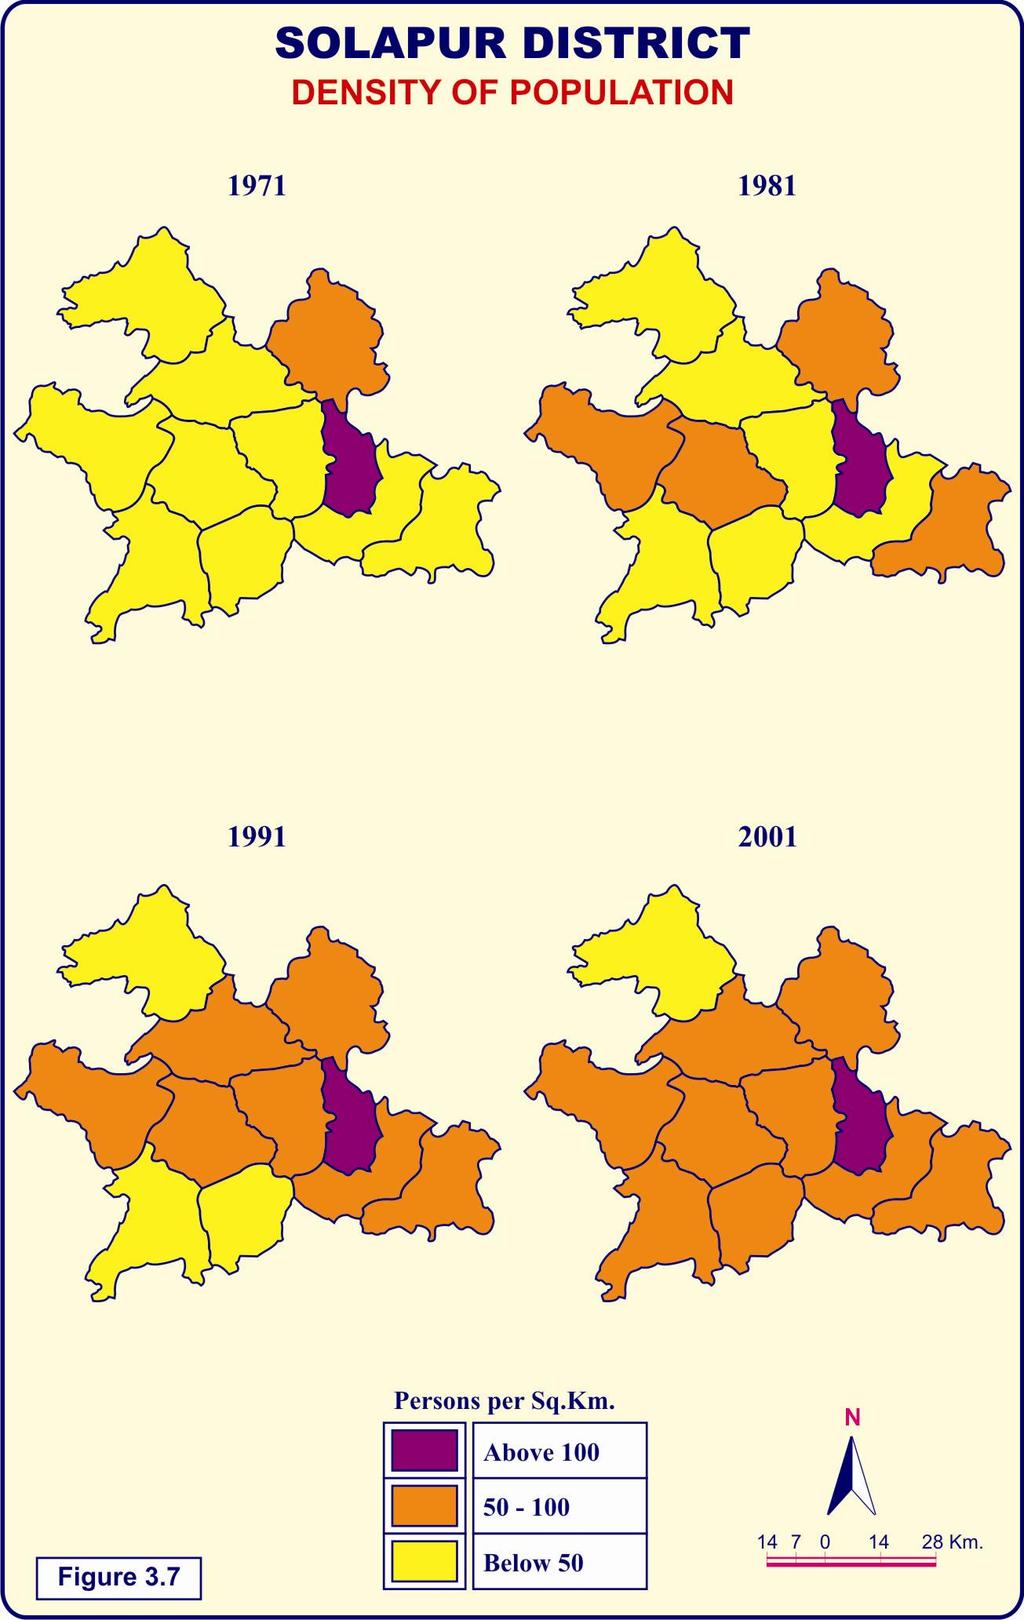
30 3.7.1 Variation in density of population in Solapur district: For district as a whole and tahsil level density of population were calculated for the decadal years of 1971, 1981, 1991 and In the year 2001, the total density of population for the region as a whole was 258 persons per square kilometer, which has increased substantially, since 1971, when it was 150 persons per square kilometer in For the year 1981, it was 173 persons and became as high as 217 persons per square kilometer. This trend of density clearly reveals that during last four decades, there has been consistant increase in the density of population, due to natural increase of population as well as contribution made by inmigrants to the district of Solapur and became 258, consequently in Spatial variations in the density of population within the region:- The table concerned reveals, that the densities of population for various tahsils of Solapur district vary enormously from one tahsil to another. In the year 1971, as expected, it was highest for the North Solapur tahsil due to the existence of city of Solapur, where it was 662 persons per square kilometer. On the other hand, it was lowest for Karmala tahsil, due to entirely rural tahsil in the Solapur district. The Barshi and North Solapur tahsil show, higher density than the region average in the year Rest other tahsils, show lower density than the region average. (Table 3.8) In the year 1981, the average density for region as a whole was 173 persons per square kilometer. Due to the present of Solapur city it was 825 persons for North Solapur tahsil. Besides Barshi, Pandharpur and Malshiras tahsils have also shown the density of population more than region average in the year Apart from this, the remaining tahsils have much lower density than the district as a whole. No doubt, the same trend was also observed in 1981, as it was for the earlier decades, highest 107
31 being for North Solapur and lowest for the Karmala and Mangalwedha tahsils. (Fig. 3.7) In the year 1991, more or less, the similar trend was found as far as the density of population is concerned. For region as a whole, it was 217 persons per square kilometer and for North Solapur tahsil, it was 1124 persons per square kilometer, since Solapur city contributes a large number of persons from urban area. It is followed by Pandharpur tahsil as well as Malshiras, where the density is higher than the region as a whole. Karmala being entirely rural tahsil represents the lowest density of population for the year While rest other tahsils, are much below than the district as a whole as per as the density of population is concerned in Table 3.8 Density of Population for Solapur district ( ) Sr. Tahsil Density of Population (Sq.Km.) No Karmala Madha Barshi North Solapur Mohol Pandharpur Malshiras Sangola Mangalwedha South Solapur Akkalkot District Total
32 109
33 The spatial variations in the density of population for the Solapur district in 2001 vary from one tahsil to another. As expected, it is highest for the North Solapur tahsil, where it was 1287 persons per square kilometer and lowest for Karmala tahsil, where it was as low as 145 persons per square kilometer. North Solapur, Pandharpur and Malshiras have much higher density than the region as a whole. Remaining other tahsils show much lower density of population than Solapur district as a whole. There are number of factors responsible for the variations in the density of population. Some of them have already being discussed in the preceding discussion. Even though, the nature of terrain, proportion of land under agriculture, degree of urbanization and industrialization are some of the important factors responsible for the variations in density of population in the Solapur district The density of population in rural areas ( ) In order to understand, the densities of rural population for the region under study as well as for different tahsils, for the last four decades, these have been represented in the table 3.9. The rural density of population for the year 1971 was 112 persons per square kilometer, which is much lower than the total density of the region as a whole. The lowest rural density was observed for the Karmala tahsil, while the highest for the Malshiras tahsil. In the year 1981, the rural density of population for region as a whole, was 123 persons per square kilometer. More or less, the similar pattern was observed as it was for the year Similar pattern was also found for the spatial variation in the rural density of population in the year It was highest of 175 for Malshiras tahsil and lowest of 94 for Mangalwedha tahsil. In the year 1981, seven tahsils consists of Karmala, Madha, Barshi, Mohol, Sangola, Mangalwedha and Akkalkot have shown rural density of population 110
34 Table 3.9 Tahsilwise rural density of population in Solapur district ( ) Sr. Tahsil Density of Population (Sq.Km.) No Karmala Madha Barshi North Solapur Mohol Pandharpur Malshiras Sangola Mangalwedha South Solapur Akkalkot District Total Source : Socio-economic Review of Solapur district (2001) below the region as a whole. On the other hand, remaining tahsils consist of North Solapur, Pandharpur, Malshiras and South Solapur has shown rural density above the region as a whole. (Fig. 3.8) In the year 1991, the rural density of population for the region as a whole was 156 persons per square kilometer as against 217 persons for the total density of population. This shows that there is much increase in density of rural population during the last two decades. Further, rural density is highest for Malshiras tahsil, while the lowest for the Karmala tahsil in the year The agricultural prosperity and other economic alied economic activities are responsible for the high rural density of population for different tahsils of the Solapur district. However, there are 111
35 112
36 wide variations in rural density of population within the various tahsils of Solapur district. Seven tahsils show higher rural density, while rest four tahsils show lower rural density than the region as a whole. For the year 2001, the rural density of population was 180 persons per square kilometer, while it was 156 persons per square kilometer in By and large similar trend was also observed for the year 2001, highest being for Malshiras and lowest for the Karmala. The reasons behind it are the higher geographical area for Karmala and lower development of secondary and tertiary sectors. Here, for Malshiras tahsil, the reasons for higher rural density are attributed to entire rural population of Malshiras tahsil which is treated, inspite of around one lakh population of Akluj. Since, it is divided into several gramphanchayats. It is a matter of surprised except, Malshiras and Pandharpur, all other tahsils of Solapur district have shown, the lower rural density of population than region as a whole The density of population in Urban area ( ): Further, an attempt has been made to understand variations in the urban density for region as a whole, as well as for different tahsils, during the last four decades. The urban density for district as a whole was 1767, which was much higher than the rural and total density of population. It has increased consistently due to various social and economic activities and became 2200 in the year 1981, and further increased to 2664 persons per square kilometer for the year Rapid industrialization and consequent urbanization has reflected in the high urban density of population in 2001, when it increased to 3512 persons per square kilometer. During the period , urban population has doubled for the district as a whole during the last four decades. 113
37 Table No Tahsilwise urban density of population in Solapur district ( ) Sr. Tahsil Density of Population (Sq.Km.) No Karmala Madha Barshi North Solapur Mohol Pandharpur Malshiras Sangola Mangalwedha South Solapur Akkalkot District Total Source : Socio-economic Review of Solapur district (2001) Similarly, urban density of population has been calculated for different tahsils of the district, for the same period. At the very outset, it should be mentioned that three tahsils namely Mohol, Malshiras and south Solapur have no urban settlement throughout the period, under consideration. Hence, no urban population was found in such tahsils. This has resulted, in the nil urban density of population for the period concerned. In the year 1971, among the various tahsils of Solapur district, North Solapur tahsil occupies the first position as regard to urban density of population, while it is followed by Pandharpur and Barshi on the one 114
38 hand, andthe lowest urban density was recorded for Mangalwedha and followed by Sangola and Madha tahsil on the other. North Solapur and Pandharpur are only two tahsils having urban density of population above the region average, while rest tahsils fall as regard to urban density below the region average. There are wide variations as regard to urban density within the different tahsils of Solapur district ranging between 1594 for Sangola and for North Solapur. These variations in the density of urban population vary due to the presence of Solapur city in North Solapur tahsil and low degree of industrialization and concequent urbanization in tahsils like Sangola and Mangalwedha. For the year 2001, the average urban density of the region was 3512, which was doubled during the last four decades. The density of urban population varies within the region from 2042 in Mangalwedha and for North Solapur tahsil. Madha, Barshi and Mangalwedha tahsil represents low urban density than the region as a whole, due to low degree of urbanization in such region while rest other tahsils have density of urban population much higher than district as a whole Regional Variations in Physiological Density: The simple density of population which is also known as an arithuctic density gives a simple quantitative relationship between man and land many times it does not give correct impression regarding pressure of population on land. Different ratio is physiological used to represent it in clear manner. One such ratio is physiological density, which is ratio between total population of the region and the total population of the region and the total cultivated or cropped area of the region. The physiological density is also known as nutritional density, which is high for industrialized and urbanized region of North Solapur 115
39 tahsils, while lowest for the Karmala tahsil. There are six tahsils consisting of Karmala, Madha, Mohol, Mangalwedha, South Solapur and Akkalkot having lower physiological density than the region as a whole. While rest of five tahsils consisting of Barshi, North Solapur, Pandharpur, Malshiras and Sangola, have recorded higher physiological density than the region as a whole. The physiological density represents the relationship between man and actual cultivated area, this shows that the low physiological density have much cultivated area per person. While higher the physiological density, lower is the cropped area per person in the district of Solapur. Agricultural Density: Another interesting ratio between man and land, which gives clearer picture regarding pressure of population on land, is agricultural density. In Solapur district, the region under study, the population, though largely depend on agriculture but does not depend entirely on agriculture. The working population has been grouped into various primary, secondary and tertiary workers. Of these the primary workers particularly engaged in cultivation and agricultural laboures or the workers concerned in agricultural activity, since they are entirely depend on agriculture. The sum of these two types of workers is taken as an agricultural population of the region. The ratio of agricultural population thus, and area under agriculture is called as agricultural density. This gives a clearer and relative realistic picture of the pressure of population on land. For the year 2001, the average agricultural density for a region as a whole was calculated 100. The North Solapur tahsil represents the highest value of agricultural density due to relatively low percentage of people engaged in the cultivation. The regions which show higher agricultural density than the region average are Akkalkot, South Solapur, Mangalwedha, Mohol and North Solapur. This clearly shows that in such tahsils, the ratio 116
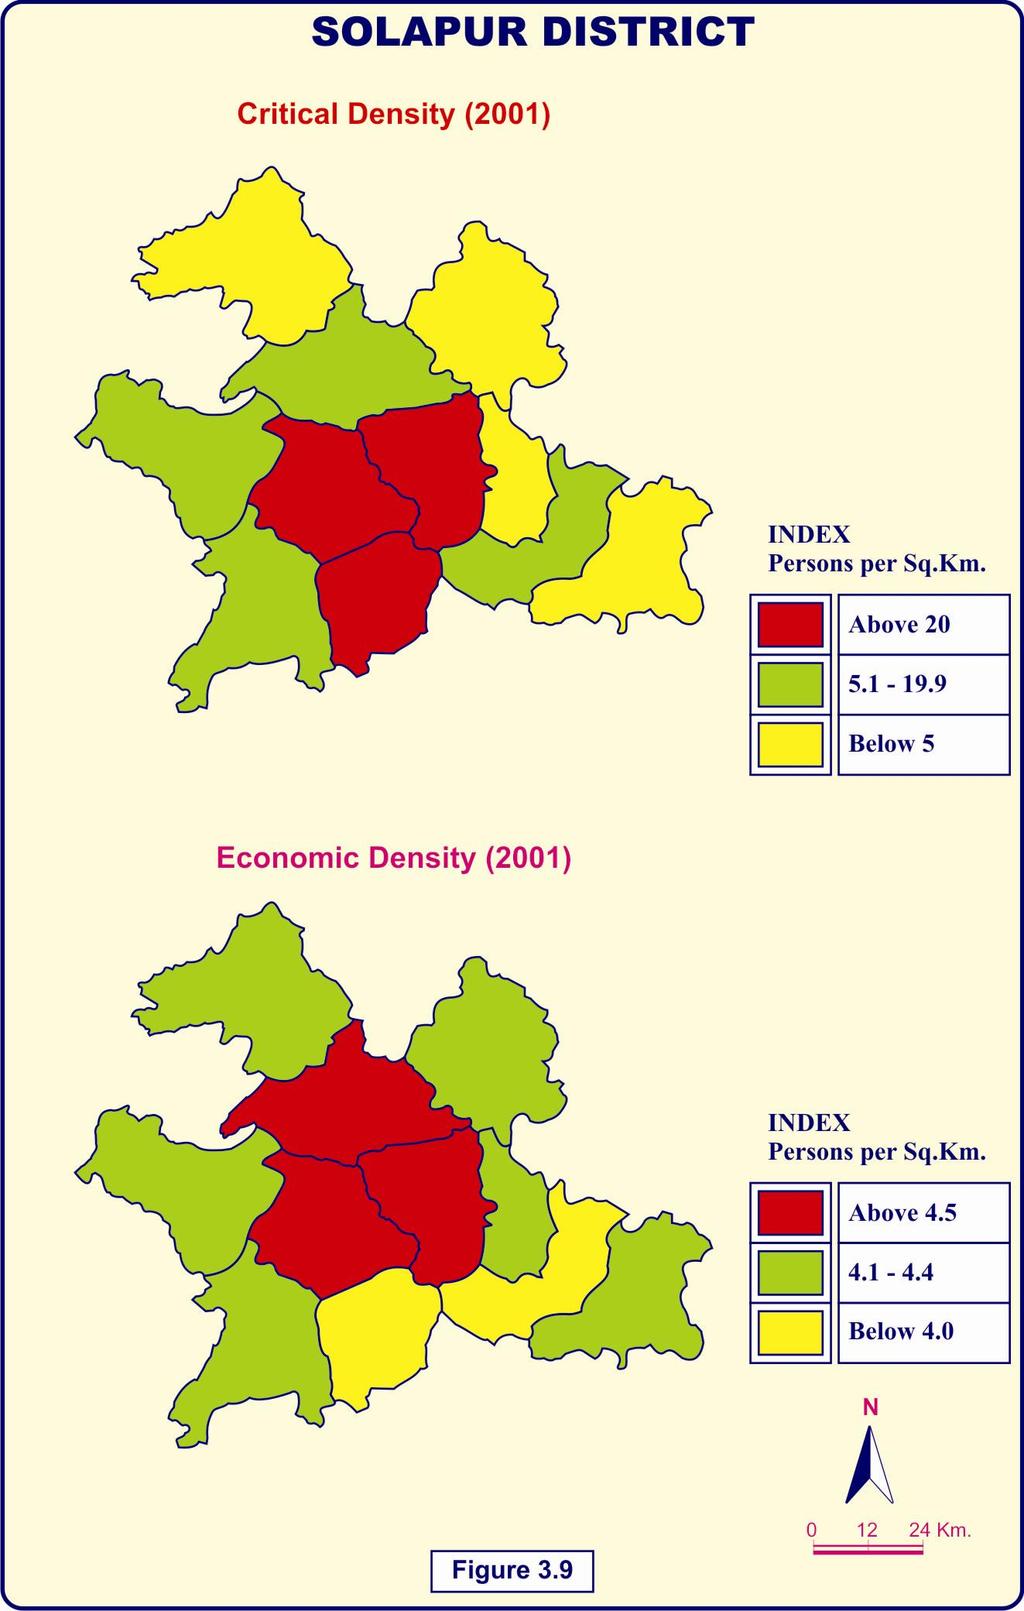
40 between man and land is higher due to enough availability of land for agriculture. Besides, the region showing lower agricultural density than the region average, where the proportion of the agricultural land due to physical constraint is relatively low, such tahsils are namely Sangola, Malshiras, Pandharpur, Barhsi, Madha and Karmala. In such regions, the proportion of waste land and in other category of land, which is not suitable for cultivation, is higher. Hence the ratio of agricultural land is lower than the district average. (fig. 3.10) Critical Density: Critical density has also been calculated for year 2001 with the help of following formula: C.D. = 100 ( C/F) x A/L C = Cultivated Area F = Fallow land A = Per capita planted acreage L = Percentage of cultivable land The critical density is another method to understand man land ratio. The ratio between cultivated area and fallow land on the one hand and per capita planted acreage and percentage of cultivable land on the other. From the values calculated for different tahsils we get an idea of the critical density. For the district as a whole the critical density was It was found higher for the Mangalwedha region in the south of the district and followed by Mohol and Pandharpur tahsil. Apart from these tahsil the south Solapur also depict higher critical density than the region average, while rest of other tahsils have much lower critical density than the region average. Due to various socio-economic reasons, it was lowest for Barshi and North Solapur tahsil. It may be due to the higher percentage of people belonging to urban sectors. Akkalkot, Malshras and 117
41 Sangola tahsils along with the Karmala and Madha have much lower critical density than the region as a whole. (Fig. 3.9) Sr. No. Table 3.11 Different types of densities in Solapur district Tahsil Physiological Density Agricultural Density Critical Density Economic Density 1. Karmala Madha Barshi North Solapur Mohol Pandharpur Malshiras Sangola Mangalwedha South Solapur Akkalkot District Total Source : Socio-economic Review of Solapur district (2001) Economic Density: Each one of the various methods given above reveals only particular aspects of man-land ratio. The relationship between man and land however, is very complex. This shows because in addition to agricultural resources, the region under study is endowed, with many other economic resources, which are used by the people to earn living for the day to life. Here, an attempt has been made to present a more realistic picture of the relationship between man and economic production by working out the total resources and peoples which is known as economic density. 118
42 119
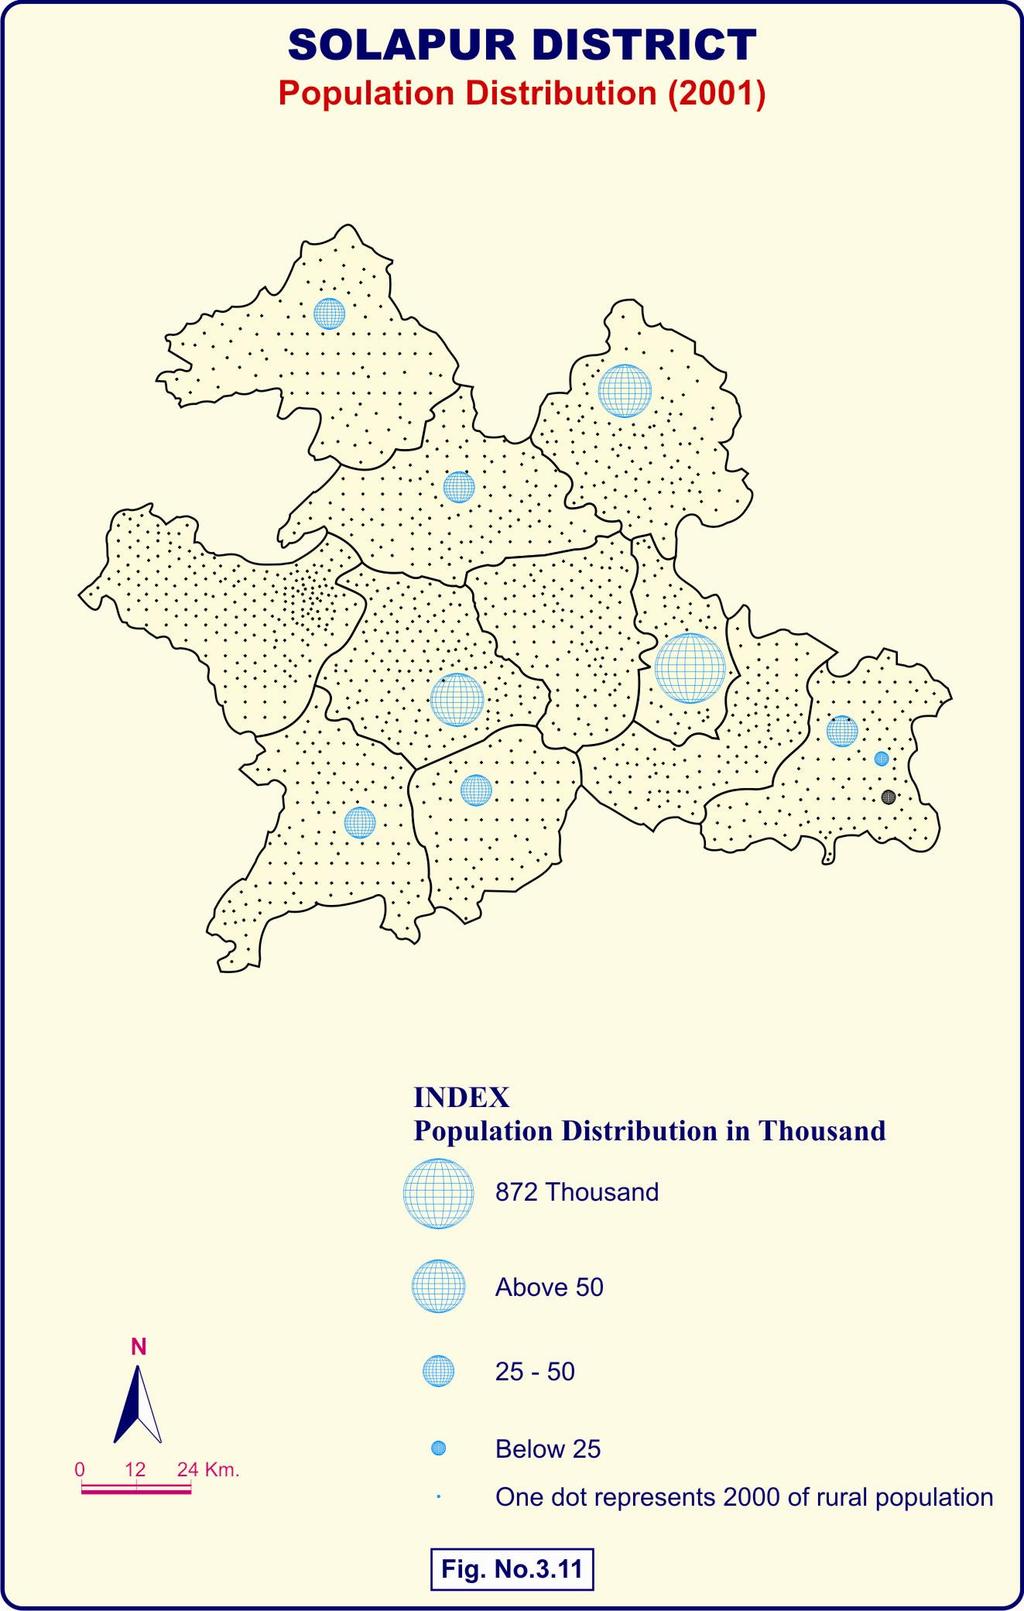
43 This more comprehensive ratio called a general economic density has been suggested by Simon. He took into account both the index of soil and population, and index of production. Thus economic density can be expressed as under: economic density = 100 x P/p where, P- is an index of population and p is an index of production. When this method was applied to different tahsils of Solapur district, there emerged a central belt running in the heart of the Solapur district consisting of the tahsil Madha, Pandharpur and Mohol, where it has the economic density more than 4.5. It means that in such tahsils, the indices of population are high in relation to indices of production. And several tahsils in the peripheral of the Solapur district consisting of Akkalkot, Barshi, Karmala, Malshiras and Sangola as well as North Solapur tahsils, where indices of population were lower in relation to indices of production and of an intermediate. The third category represented by the Mangalwedha and South Solapur tahsil, where the value of economic density was lowest. It may be concluded that the degree of industrialization and other allied secondary activities do not permit to high indices of production. The higher economic density means the overall exploitation of the natural resources in relation to population in that particular region. Lower the economic density, poor is the exploitation of natural resources by the people and high economic density means the maximum utilization of resources in such concerned region. 3.8 DISTRIBUTION OF POPULATION IN SOLAPUR DISTRICT: In Solapur district, according to 2001 census, 4.25 percent of the people live of the state of Maharashtra. There is close correlation between relief, usability of land, patterns of transportation network, nature of 120
44 economic activities and spatial distribution of population. Due to the impact of relief, the population is very thin along the hilly regions and along the foothills of Solapur district. While the valleyes of the major rivers like Bhima, Nira, Bhogavati and Maan, have relatively thicker population. The usability of land, which inturn influence by the nature of relief has enhanced this pattern further. Table 3.12 Distribution of Population in Solapur district ( ) Sr. Tahsil No. 1. Karmala Madha Barshi North Solapur Mohol Pandharpur Malshiras Sangola Mangalwedha South Solapur Akkalkot District Total Source : Socio-economic Review of Solapur district (2001) The impact of industrialization and consequent urbanization on the distribution of population clearly reveals, so that the urbanized area like North Solapur tahsil, Barshi, Pandharpur and Akkalkot have much thick population. It shows that the distribution of population is directly 121
45 influenced by the accessibility and the pattern of transportation network. The railway line passing through Solapur, Akkalkot, Mohol towards Bijapur and Chennai on the one hand and Kurduwadi towards Mumbai on the other, is responsible for the highly thick population in Solapur district. Table 3.13 Population distribution in Solapur district ( ) (Figures in percentage) Sr. No. Tahsil Karmala Madha Barshi North Solapur Mohol Pandharpur Malshiras Sangola Mangalwedha South Solapur Akkalkot District Total Source : Socio-economic Review of Solapur district (2001) 122
46 Population Distribution Population Distribution in Solapur district ( ) Series1 Series2 Series3 Series4 Tahsil Fig Table 3.14 Location quotients for Solapur district for 1981 and 2001 Sr. No. Tahsil % of Population in each tahsil 1981 % of Populatio n in each tahsil 2001 % of area to total area of the district Locati on quotie nt 1981 Locati on quotie nt 2001 Differe nce betwee n Karmala Madha Barshi N. Solapur Mohol Pandharpur Malshiras Sangola Mangalwedha S. Solapur Akkalkot District Total Source : Socio-economic Review of Solapur district (2001) 123
47 Similarly, along the national highway number nine and national highway number thirteen going to Pune-Solapur-Hyderabad and second Solapur-Bijapur have much thicker population in the district of Solapur. Table 3.15 Percentage of area and Population and its cumulative percentages Sr. No. Tahsil % of population % of area % of cumulative population % of cumulative area 1. North Solapur Malshiras Pandharpur Barshi Madha Akkalkot Sangola Mohol Karmala South Solapur Mangalwedha District Total Source : Socio-economic Review of Solapur district (2001) Tahsilwise percentage of total population ( ) The nature of distribution of population in Solapur district has been studied with the help of location quotients. The table 3.13 represents the location quotients for the year 1981 and 2001 for the district as a whole as well as for each tahsil. The highest 124
48 value of location quotient is for North Solapur tahsil, which is highly urbanized represent the values of 4.72 for the year 1981 and 4.99 for the year It shows, high concentration of population is found in North Solapur tahsil for the last two decades. On the other hand, the Karmala tahsil represent minimum lowest values of location quotients, shows the extent of low concentration of population. During two during last two decades the values varies from tahsil to tahsil depending upon the economic activities. The higher values of location quotients concentrate the high degree of economic activities and lower the values of location quotients, represent the least concentration of economic activities in such tahsils. The impact of industrialization and consequent urbanization on the distribution of population clearly reveals, so that the urbanized area like North Solapur tahsil, Barshi, Pandharpur and Akkalkot have much thick population. It shows that the distribution of population is directly influenced by the accessibility and the pattern of transportation network. The railway line passing through Solapur, Akkalkot, Mohol towards Bijapur and Chennai on the one hand and Kurduwadi towards Mumbai on the other, is responsible for the highly thick population in Solapur district. 125
49 126
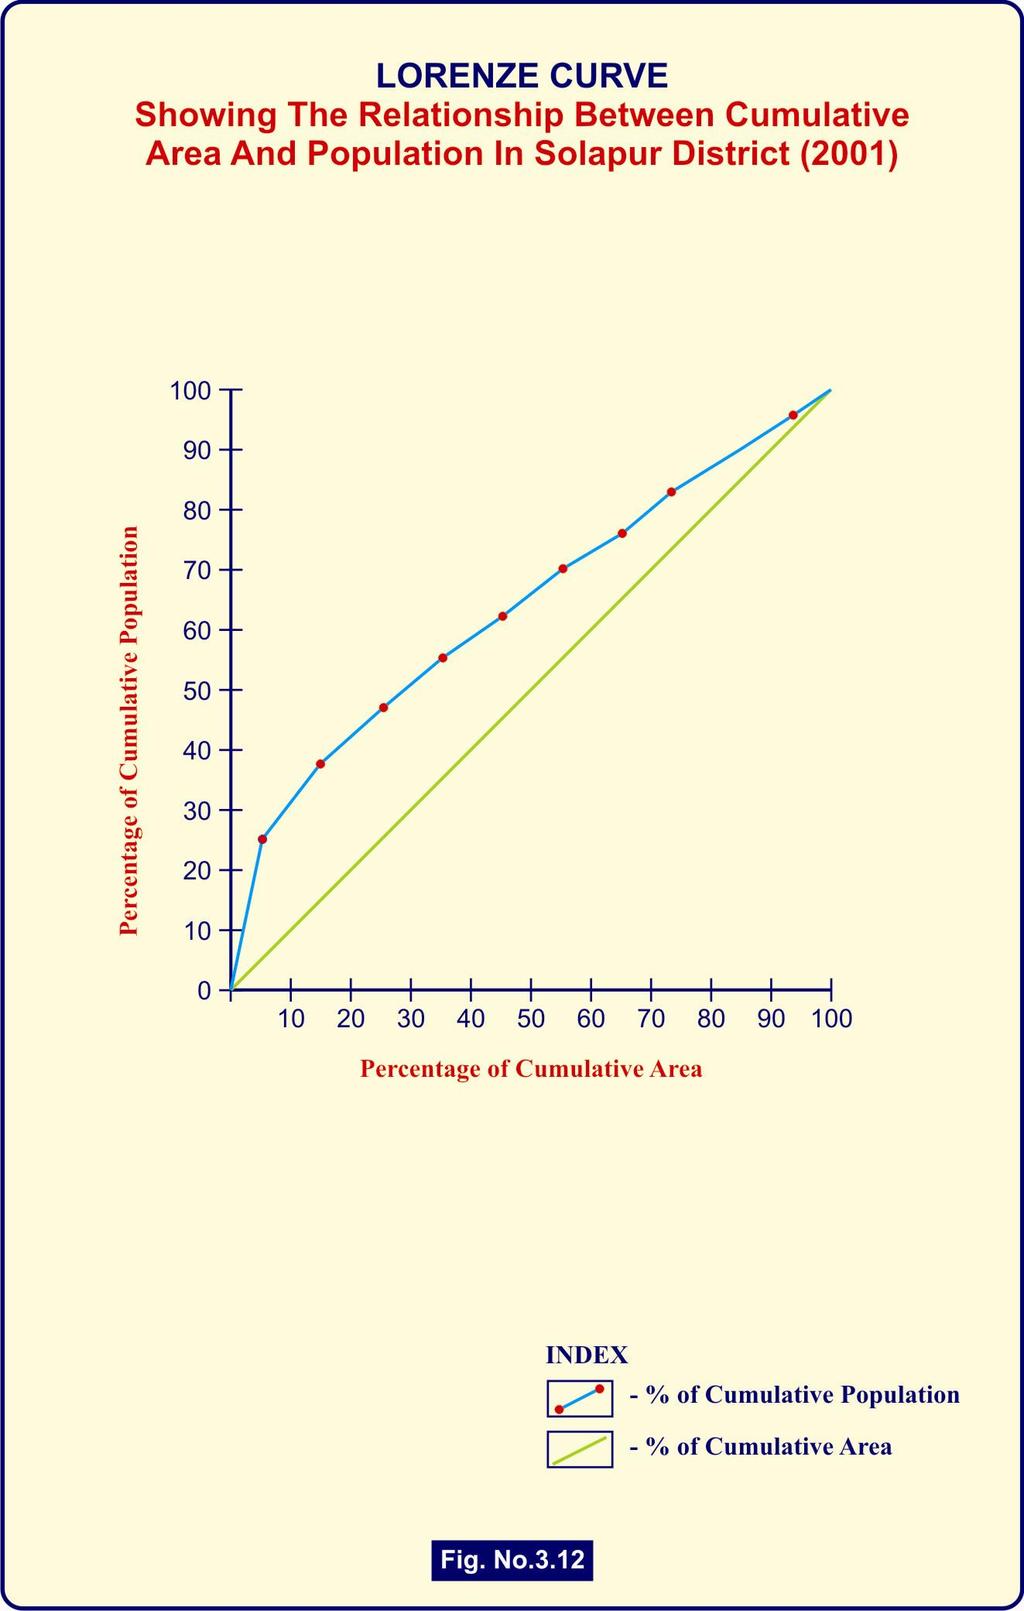
50 The table 3.14 indicates the percentage of population in each tahsil of the district. Similarly, the percentage of area shared by each tahsil of the total district is represented for the year Accordingly, the percentage of cumulative population and percentage of cumulative area also is represented in the same period. In order to understand, the relationship between the percentage of area and the population, a lornze curve has been prepared by taking the percentage of cumulative area on the 'x' axis and percentage of cumulative population on 'y' axis, the graph clearly indicates that in the district of Solapur 5 percent of area possess almost 25 percent population of the district. On the contrary, fifteen percent area contains 36 percent of population. Besides, almost 25 percent of area of district contain almost 50 percent of population contain of the district. And almost 50 percent population has above 75 percent of area. Apart from this, almost 75 percent area has 85 percent of population. (Fig. 3.12) This shows that the cumulative of each tahsil with the area and population gives an idea of the total geographical area in percentage on one hand and percentage of population on the other. The variability in area and population is represented by a lorenze curve, which represents the graph deviating form the line, which shows uniform distribution to a percent on 'y' axis. Due to the existence of Solapur city in the North Solapur tahsil the area is only 5 percent while the population above 25 percent of the district. The ratio between area and population though, is quite disturbed but not as in the case of North Solapur tahsil. 127
51 128
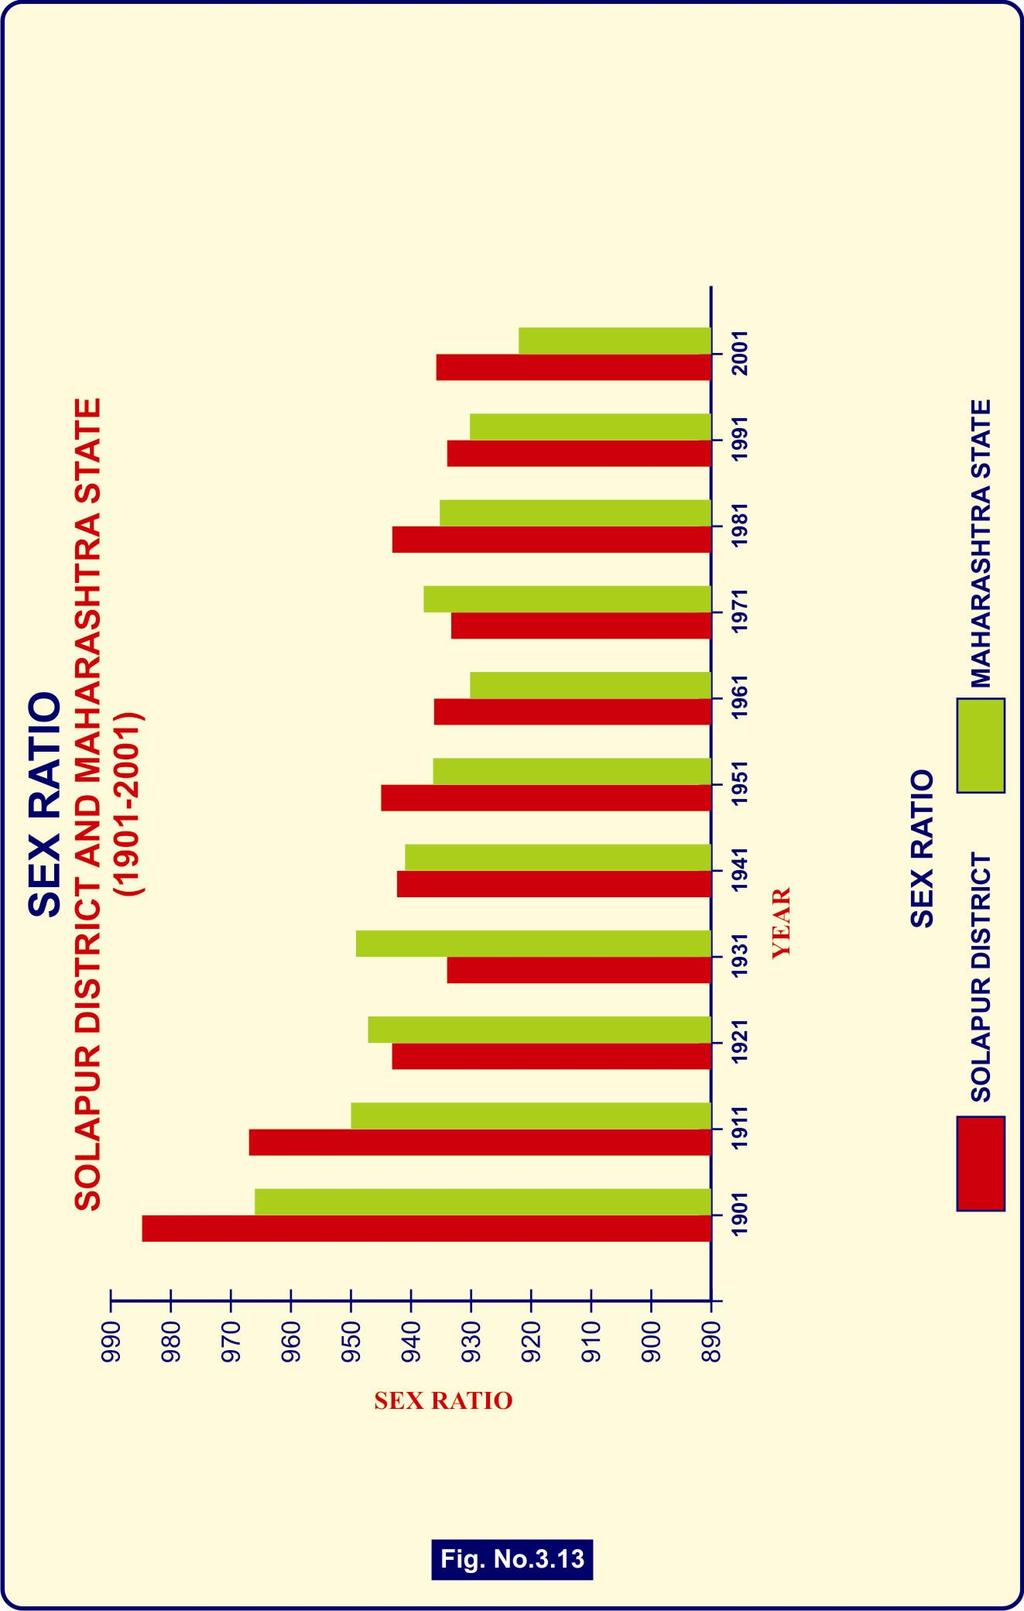
52 3.9 SEX COMPOSITION OF SOLAPUR DISTRICT: Of the demographic characteristics, the sex composition of a population is the most basic, since it influences, the marriage and growth rate of population. Some other important population characteristics, like migration, occupation structure etc are also influenced by the ratio between the sexes. Since, the roles of the two sexes are partly contrasting and partly complementary, the study of their ratio is of considerable interest to the population geographers. "Sex ratio is an index of socioeconomic conditions, revealing in an area and is useful tool for regional analysis". Sex ratio also influences the volume and nature of social need and employment and consumption pattern. Due to the considerable influence on many other demographic elements, the sex ratios are fundamental to geographical analysis of any region. Sex composition also influences fertility potential of the population, the labour participation and the types of jobs. In India, sex ratio is generally expressed in terms of number of females per 1000 males. Sex composition varies both in time and space. The variations in sex ratio are to a large extent determined by three factors such as, sex ratio at birth, differentials in mortality rate in two sexes and sex selectivity among migrants Sex ratio for Solapur district and Maharashtra: According to 2001 census, the population of Solapur district was, out of this, were male and were females. The sex-ratio works out to 935 per thousand males. This imbalance in sex ratio probably is due to relatively high mortality among the females and in migration of males on a large scale from other parts of the state of Maharashtra, which is generally dominated by males. Due to the influence of sex selective migration, the sex ratio for Solapur district as compared to the state of Maharashtra was significantly higher than that 129
53 for state of Maharashtra in the year In the year 1901, the sex ratio for Solapur district was estimated to 985, which was relatively higher than the state of Maharashtra. Same trend was also observed for the year For the next three decades particularly during , the sex ratio was recorded lower than the state of Maharashtra probably due to functioning of cotton textile mills in the Solapr city. Which have attracted only male workers to the Solapur city? In 1951, after the independence of country, the rapid industrialization in other parts of the state resulted higher sex ratio for Solapur district than the state of Maharashtra. In the next decade of 1961 the sex-ratios were equal for the state of Maharashtra and Solapur district, though these were substantially lower than the balanced sex-ratios. In the year 1971, the sex ratio was 933, slightly higher than the Maharashtra state. For the year 1981, further, it increased and became 943 for the region under study, while for Maharashtra it was lower than the district average. In the year 1991, more or less the sex ratio was equal for the both regions. In the year 2001, it slightly increased and became 936 as compared to Maharashtra when it was only 922 females per 1000 males. In short, it may be concluded that there have been wide variations in sex ratios during last ten decades, because in the year 1901, it was not much disturbed when it was 985 per thousand male for the district of Solapur, while in the most recent decade in 2001, the sex ratio declined substantially, and became as low as 936 respectively for the region under study. While for the state of Maharashtra, the sex ratio declined from 978 in the year 1901 to 922 in the year (3.13) 130
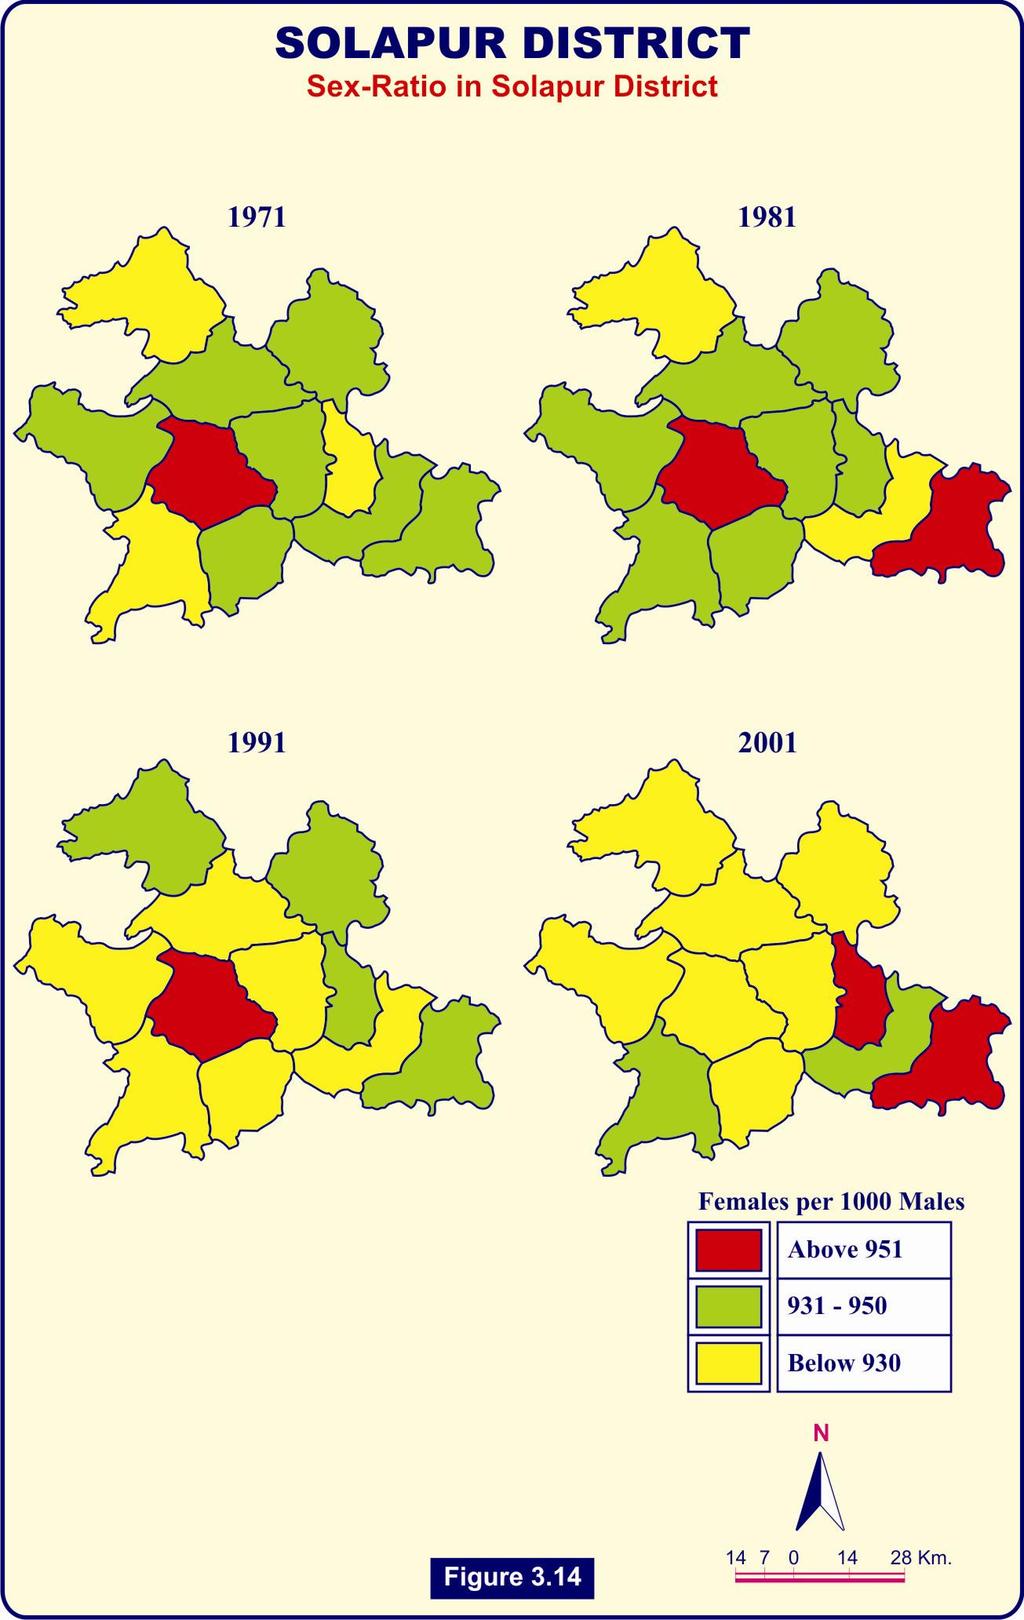
54 Table 3.16 Sex Ratio for Solapur district and Maharashtra ( ) Sr.No. Year Solapur District Maharashtra Source : Census of Solapur District (2001) Spatio Temporal Variation in Sex Ratio in Solapur district ( ): In order to understand, spatial variations in sex ratios in Solapur district, for the period , it was calculated for each tahsil of the region under study. For the year 1971, the sex ratio for the district as a whole was 933. There were four tahsils namely North Solapur, Malshiras, Sangola and South Solapur where it was lower than the region under study, while rest other tahsils have recorded sex ratios much higher than the district as a whole. It was highest for the Pandharpur tahsil while, lowest for North Solapur tahsil. It is higher for the tahsils which are having higher percentage of out migrants, particularly, of males to the city like Solapur and lower for the region, which have higher percentage of rural population. Similarly for the year 1981, the same trend was observed as for as the sex ratio is concerned. During 1981 year, it was 942 for the district as a whole. There were six tahsils namely North Solapur, Mohol, Malshiras, Sangola, Mangalwedha and South Solapur where sex ratio was 131
55 132
56 lower than the region as a whole, while rest of five tahsils recorded high sex ratio than the region as a whole. Again, Pandharpur represented higher sex ratio while North Solapur tahsil recorded lower sex ratio. (fig.3.14) In the year 1991, the situation was totally different, as the sex ratio declined substantially for certain regions, for example in Mangalwedha tahsil it came down to 915 as against 934 for the region under study. Except North and South Solapur tahsils, it has declined for all the tahsils of the district. It may be probably due to the improvement in decentralization of industries and spread of urban population in different parts of the region. This has also been due to decline in the rural urban migration in various parts of Solapur district. Table 3.17 Spatial variation in sex-ratio in Solapur district ( ) Sr. Tahsil Year No Karmala Madha Barshi North Solapur Mohol Pandharpur Malshiras Sangola Mangalwedha South Solapur Akkalkot District Total In the year 2001, the sex ratio for the district as a whole was 936 per thousand males which slightly increased for the year The North 133
57 Solapur tahsil represented the higher sex ratio in the region under study, while lowest for Pandharpur and Mangalwedha tahsils. Sangola represented the same sex ratio as it was for rest tahsils of the district which has shown lower sex ratio than the region average. In short, it may be stated that there are wide variations as regard to sex ratio within the region under study. Likewise, through time, sex ratios are substantially declining due to high percentage of female infant mortality in the region under study. Table 3.18 Tahsil wise sex ratio in Solapur district (2001) Sr. No Tahsil Total Rural Urban 1. Karmala Madha Barshi North Solapur Mohol Pandharpur Malshiras Sangola Mangalwedha South Solapur Akkalkot District Total
58 135
59 3.9.3 Spatial variation in rural urban sex ratio in Solapur District (2001):- In Solapur district, the rural and urban sex ratio differs considerably in the year The rural sex ratio was 925 for the district as a whole in the year However, there are wide variations within the district, as it was highest for the Akkalkot and lowest for the Pandharpur tahsil for rural areas. Overall rural sex-ratio is lower than the urban sex ratio except Sangola tahsil within the region under study. It is against expectation because rural urban migration dominated by male, should reduced the urban sex ratio than the rural sex ratio. (Table 3.17) The lower rural sex ratio in different tahsils of the Solapur district may be attributed to the high infant mortality among the females as a result of less availability of medical facilities and very much negligence of female children as regard to medical facilities in rural areas of the Solapur district. Another important reason may be high rate of maternal death in rural areas of Solapur district and also partly due to illiterate DAIS (Nurses) who look after delivery. On the contrary, the urban sex ratio for the district was 957 which is substantial higher than the rural sex ratio. For the Akkalkot tahsil, it was the highest and for Mangalwedha tahsil it was the lowest. North Solapur tahsil occupies second position as regard to urban sex ratio, among various tahsils of Solapur district. Mohol, Malshiras and South Solapur tahsils are entirely rural hence; the urban sex ratio is absent. Other tahsils of the district have lower sex ratio than the region under study. It is necessary to justify the high sex ratio in urban areas of the district. The medical facilities are much better in urban areas resulting in the low infant death. As a result, it is reflected in high sex ratio in district of Solapur. Secondly, the high percentage of literate people gives equal 136
60 attention towards both male and female children. This also is responsible for high sex ratio in urban areas than that of rural areas Decadal variations in Rural Urban sex ratio ( ): The temporal variations in rural-urban sex ratios for the Solapur district as a whole have been taken into consideration for the lost ten decades. As expected, the rural sex ratio, are higher than the urban sex ratios except for the year 1991 and This may be probably due to rural urban migration for the better employment oppurnities, available in the urban areas, particularly for the working males, who leave their families behind at home in rural areas. (Fig. 3.15) Table 3.19 Decade-wise variation in Rural-Urban sex ratio ( ) Sr. No Year Rural Sex Ratio Urban Sex Ratio
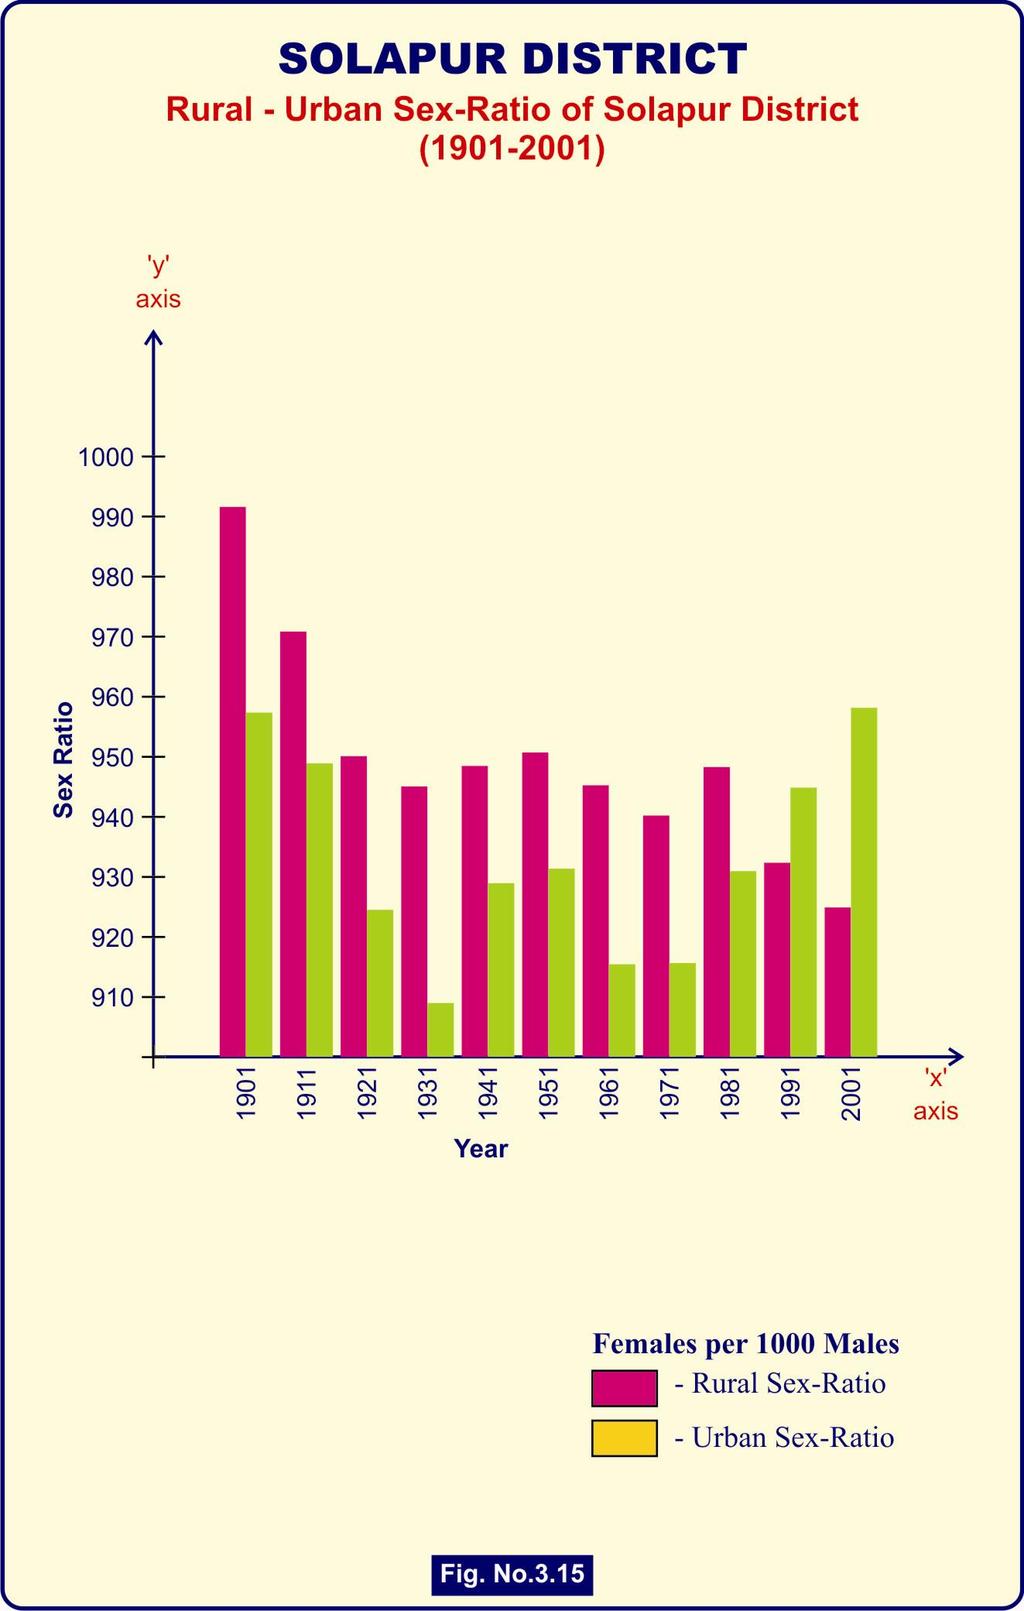
61 138
62 As a result of it, the rural sex ratios though, were higher than the urban sex ratios during the period 1901 to During the year 1991 to 2001, the urban sex ratio were recorded higher than the rural sex ratios perhaps due to better medical facilities and lower infant death rate of female in urban areas. Now days, due to social awareness and high rate of literacy in urban areas of Solapur district, might have resulted in the higher sex ratios in urban areas of the district AGE COMPOSITION OF SOLAPUR DISTRICT: Age composition is one of the most basic characteristics of a population. To a certain extent, the age of a person decides, what he needs does and thinks. Age composition influences many important aspects of community life, such as social attitudes, economic activities, mobility of people and political set up. Age composition is an important consideration in planning the educational, military and welfare programme of a region. Age structure of a population is a product of the post trends in fertility, mortality and migration; change in any one of them influences age composition of these changes, the fertility has a much greater impact on the age composition than the changes in mortality. This is because change in mortality influences all age group, while changes in fertility affect the base of the age structure. Three variables mentioned above are not completely independent; changes in any one of them are reflected in the remaining. Proportions of the people in different age groups are influenced by fertility rate. In economically and socially backward region, fertility rate is generally high, and hence, the proportions of younger age group are sizable. In such a region, expectancy of life is low and therefore, proportions of the people of old age group is a small on the other hand in economically developed regions fertility rates are low and 139
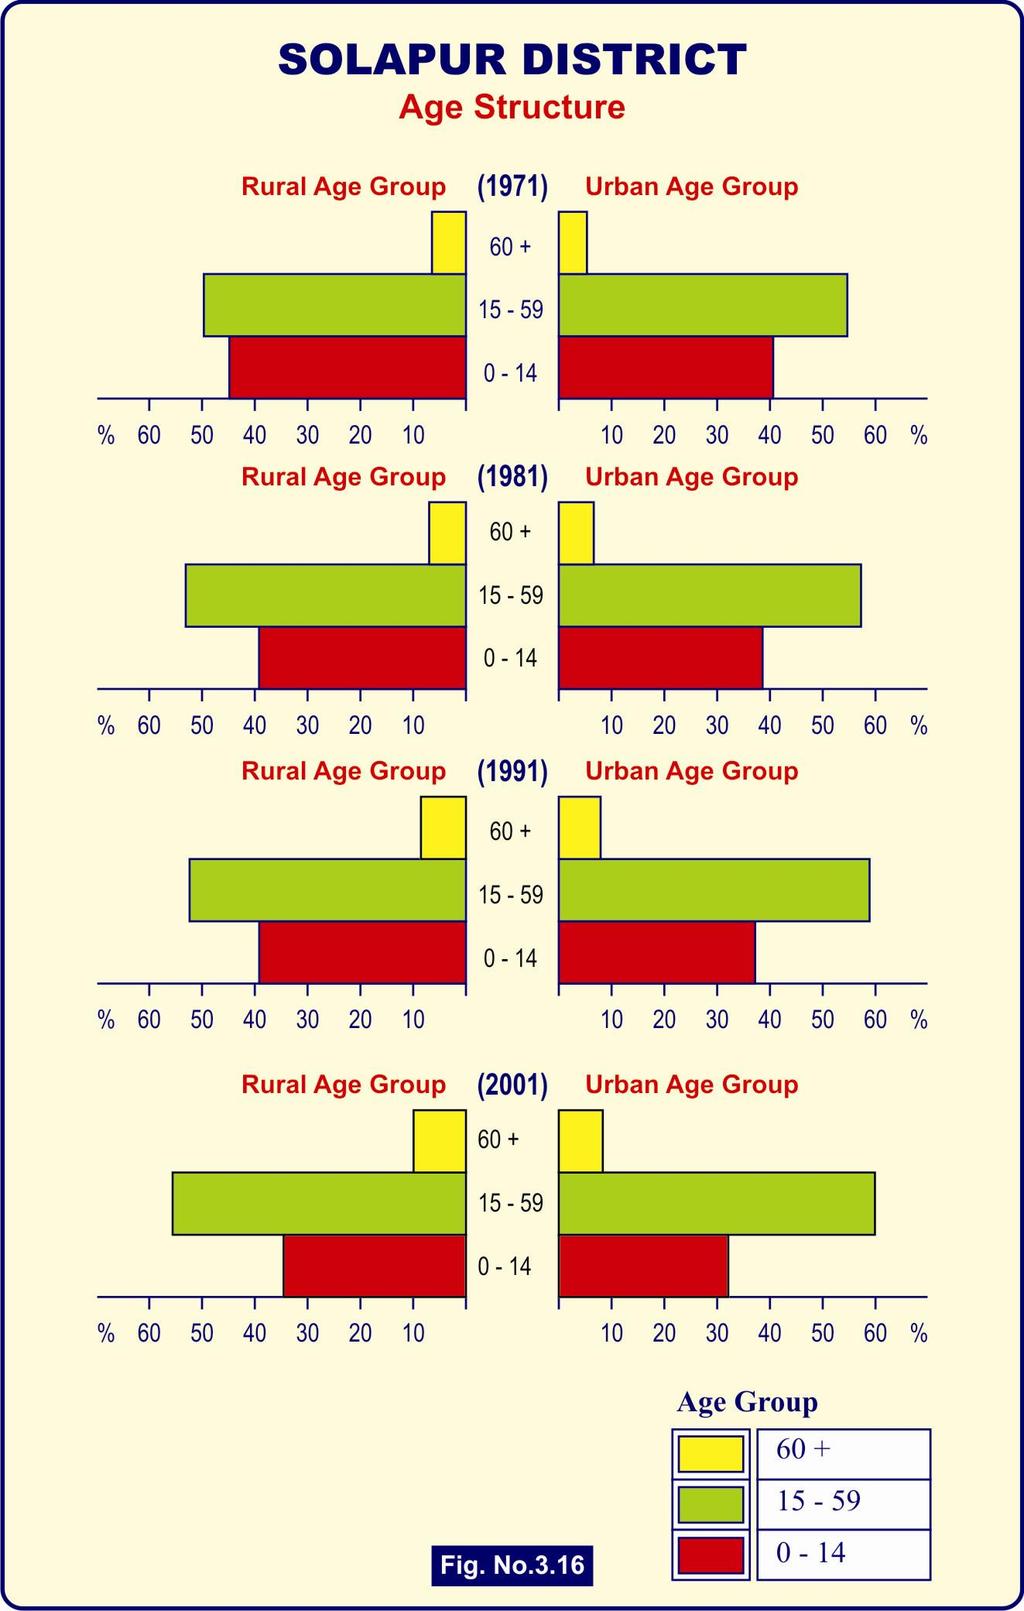
63 expectancy of life is high. In such regions, fertility rates are low hence, the proportion of people in young age group is small and that in old age is relatively large. Age composition is also influenced by age specific mortality rate. In economically developed region, morality is low for younger as well as older age groups. This results in high and continuously increasing proportion of people in higher age group. On the other hand, in economically backward region, mortality is generally declining. This results in higher proportion of people in younger groups. To some extent, migration also influences age composition of the population which is generally age and sex selective. Hence, age and sex composition of both at sources as well as at destination regions are altered. People in the working age groups are generally more mobile hence; migration that occurs due to economic reasons is more of age selective. This result in increase in proportions of people in the working age group in the destination regions, while there is corresponding decrease of the people in the working age group in the source region Age wise percentage of population:- The age group population gives an idea about the working and nonworking population for Solapur district, the percentage of population belonging to 0-14 years which are nonworking, and age group, are economically working population, as well as above 60 age group, it is also economically non working population have been calculated for total, rural and urban areas of the Solapur district for the last four decades. In the year 1971, the proportions of children below 14 years were percent of the total population and 6.02 percent were old people, rest percent were young and matured persons, who were engaged in economic activities. It is interesting to note that in comparison to urban areas and the rural area of district, the proportions of children below
64 years was high due to high birth rate in rural areas low literacy rate, whereas, the working population between age group was much lower in the rural areas of the Solapur district, perhaps, due to rural urban migration for the better employment opportunities. Similarly, the proportion of aged and old person was high for rural areas, probably due to returning of the working population after the retirement from urban areas to rural areas. (Table 3.19) In the year 1991, the proportions of childrens have declined from the previous decades, while it increased for the working population as well as for the old people. This fluctuation in the proportions of children, young and matured as well as for old people is attributed to differences in the birth and death rates. When the three age groups population of children, mature and old was compared between rural and urban then the proportions of children was much higher than urban areas in rural Table: 3.20 Age wise percentage of population Year Age Group Above Total Rural Urban Total Rural Urban Total Rural Urban Total Rural Urban
65 sectors of Solapur district. Due to in migration of the rural working population to urban areas of the Solapur district, the proportions of working population for better employment opportunities was recorded, substantially, higher in urban areas of the Solapur district. Further, in the year 1981, the proportion of old people was higher in rural areas. This is also because of migration of the retired people from urban to rural areas resulted in higher proportions of the old people in rural areas, as many times working population from the urban sectors go back to their native places in rural areas because of high cost of living in urban areas. In the year 1991, the pattern of population belonging to different three age groups was of the magnitude of for children, below 14 age, and percent for young and matured and 7.59 percent for old people for the district as a whole. The comparison between rural and urban areas as regard to age group was higher for rural areas both for children and old people, while it was lower for rural areas than the urban areas for working age group. For the year 2001, the percentage of children has declined for children tremendously from percent in 1971 to percent in the year This is probably due to decline in birth rate due to social awareness and the implimentation of family planning programs. On the contrary for the total, the percentage of working population has substantially increased from percent in 1971 to percent in the year Due to improvement in medical facilities, the expectancy of life has increased, both for rural and urban areas. As a result of it, the proportion of old people has remarkably increased from 6.02 percent in the year 1971, to 9.65 percent in the year
66 The comparison between rural and urban age group indicates the same pattern that is higher for children in rural areas and much higher for old age people of in rural areas. To a certain extent, the proportions of working population, the correspondingly increased form urban areas during the last four decades which became as high as percent in the year (Fig. 3.16) Dependency ratio for Solapur district:- The dependency ratio gives the picture of the burden on the society. In order to understand, the dependency burden for the district of Solapur as a whole, the dependency ratios were calculated for the total rural and urban areas for the years 1971, 1981, 1991 and In 1971, the dependency burden for Solapur district was percent. As, anticipated, it is high for rural areas, when compared with urban areas of Solapur district. This is probably due to high birth rate in rural areas and the out migration of the rural population belonging to rural working population to urban area for better employment opportunities. (Table 3.20) For the year 1981, the dependency burden was of the magnitude of percent, which went on declining for the next two decades and became as low as in the year When the dependency burden between rural and urban areas of Solapur district, were compared, it has been found higher for rural areas of the Solapur district for all the four decades. 143
67 144
68 Table 3.21 Dependency ratios for Solapur district ( ): Year Total Rural Urban One thing should be noted, that the dependency burden is continuously declining both for rural and urban areas during the last four decades. For rural areas, in the year 1971, it was and became as low as in the year Similarly, for urban areas it declined from in the year 1971 to in the year Now the question arises while the dependency burden is continuously declinning for both rural and urban areas during last four decades. Probably, this may be because of declining trend in birth rate and death rate. Secondly, change in the definition of working population. Now a day, permanent worker, marginal workers, are grouped by the census OCCUPATIONAL STRUCTURE IN SOLAPUR DISTRICT: All peoples consume, goods and services, but only some of them are engaged in productions of goods and services. Some of the persons do not participate in the work, because of age, either too old or too young or some other persons, because of physical or mental inability. The man power of a nation includes all such reasons, which could produce goods or services. More important than this is the economically active population called the working force which is that part of the manpower, which is actually engaged in productions, of economic goods and services. Several factors influence, the size of labor force, important 145
69 among them is definitions of workers, age composition, life expectancy and availability of work. As, these factors vary in different regions and different periods of times for the same region. The size of work force varies, spatially for different regions and temporally for the same region. Proportions of economically active population influence the nature and volume of production. Size and nature of economically active population is influenced by age composition, age of marriage, per capita income, size of family and the state of health. Due to high proportions of children in young age group and rapidly growing population of under developed regions, a proportion of active population is generally small. The dependency burden influences, the levels of saving, capital formations and consequently nature and volume of production. Size and nature of labor force indicates the levels of employment, already achieved. Rapid growth of population creates a higher supply of labor than its demand, leading to unemployment. Due to excessive population pressure, it is very difficult for underdeveloped regions like Solapur, to observe the increase in the labor force in gainful employment. According to the needs of the economy, the working population of a region gets distributed in different professions, broadly, grouped into primary, secondary and tertiary sectors of the economy. In the logical study of occupational structure of a region, it is essential to consider working population as the basic criterion because, working population is the active agency in the economic development of a region, through economic activities. The census authorities have classified workers in to nine industrial categories as under: 1. Cultivators 2. Agricultural Labors 146
70 3. Live stocks, forestry, fishing, hunting, plantation and allied activities. 4. Mining and quarrying. 5. Manufacturing, processing services and repairs a) House hold industry b) Other than house hold industry. 6. Construction 7. Trade and commerce 8. Transport, storage and communication 9. Other services Proportions of workers to total population in Solapur district ( ) The table concerned gives the proportions of workers broadly grouped into primary, secondary and tertiary workers for the year 1971, and 2001, for the district as a whole and for its various tahsils Primary workers:- In the year 1971, there were percent workers in the primary sectors, which declined substantially and became as low as percent in the year This decline in the proportions of primary worker may be attributed to the increase in the proportions of secondary and tertiary workers due to industrialization and consequent urbanization during the last four decades in the Solapur district. During the period , the percentage of primary workers, declined by 6.56 percent due to the mechanization in agricultural sector, reducing the number of workers in agricultural activities. This has also been observed, that the degree of industrialization in the district of Solapur and other parts of Maharashtra, as well, has contributed to out-migration of people from the rural sector to urban areas for better employment opportunities either in the secondary 147
71 and tertiary sectors. Surprisingly, during the period 1991, the primary worker has increased by 3.52 percent probably due to insecurity of workers in secondary and tertiary sectors and return of workers to their native places and excepting the primary work of agriculture. There after, the percentage of primary workers tremendously declined to percent in This may be, the reflection of least priority to primary sectors due to increase in the literacy and educational attainment, and better job opportunities in secondary sector. (Table 3.21) The spatial pattern of primary workers have shown, the tremendous variations ranging from percent for Mangalwedha in the year 1971 to percent for North Solapur tahsil. Within the district, the percentage of primary workers varies according to degree of industrialization as well as urbanization. Sr. No. Table: 3.22 Percentage of Primary Workers in Solapur district ( ) Tahsil Primary workers in percentage Karmala Madha Barshi North Solapur Mohol Pandharpur Malshiras Sangola Mangalwedha South Solapur Akkalkot District Total Source : Census of Solapur District (2001) 148
72 149
73 The tahsils, which are much urbanized, represent the low percentage of primary workers, where the proportion of urban population is higher, like North Solapur tahsil. Other tahsils, like Barshi and Pandharpur have also relatively low percentage of primary workers due to the economic activities in secondary and tertiary workers. In the year 1981, similar trend was also observed for various tahsils, the lowest percentage of primary workers was for North Solapur, while highest for the Karmala. With slight fluctuation the percentage of workers declined for most of the tasils of Solapur district in the year 1981, with exceptions of the year 1991; when, again the percentage of primary workers slightly increased for most of the tahsils, expect, Barshi and Pandharpur. In the year 2001, the similar trend was also observed for primary workers being lowest for the North Solapur and highest for Mohol. Though, the percentage of primary workers, fluctuate, with the degree of urbanization and industrialization in the district. (Fig. 3.17) Secondary Workers:- The proportions of secondary workers have also been calculated for the years 1971, 1981, 1991 and The proportion of secondary workers was percent, in 1971 for the region as a whole. As expected, it was highest for the North Solapur tahsil, due to the existence of Solapur city and lowest for the Mangalwedha for the year In the year 1981, the unbelievable decline in the percentage of secondary workers shows in North Solapur tahsil, when it declined from percent in 1971 to 5.88 to This decline in secondary workers particularly in Nort Solapur tahsil during , may by probably due to the closing down of cotton textile mills and spinning mills in and 150
74 around the Solapur city and secondly, the increase in the workers in the tertiary sectors like trade and transportation. There are wide fluctuations, in the workers of secondary sectors within the various tahsils of the Solapur district and lowest for South Solapur, while highest for the North Solapur tahsil. (Table 3.22) Sr. No. Table 3.23 Percentage of Secondary Workers in Solapur district ( ) Tahsil Secondary workers in percentage Karmala Madha Barshi North Solapur Mohol Pandharpur Malshiras Sangola Mangalwedha South Solapur Akkalkot District Total Source : Socio-economic review of Solapur district (2001) During the next period of the year 1991, was quite remarkable in the increase of secondary workers, as the proportion was percent in the year 1991 and it further increased to percent in the year This increase in the proportion of the secondary workers in the North Solapur tahsil may be due to the rejuvenation of power handloom and spinning mills in and around the Solapur city. More or less, the percentage of secondary workers was the same during the period 1991 and (Fig. 3.18) 151
75 152
76 Tertiary Workers:- The tertiary workers are those who are engaged in the services, trade, transportation and construction. For the year 1971, the percentage of tertiary workers for the Solapur district as a whole, was percent, which has doubled in the year This tremendous increase in the proportion of tertiary workers may be partly due to the tremendous increase in the tertiary workers for North Solapur tahsil. Due to closing of the cotton textile mills, large number of people became unemployed, eventually, they moved out to work for services in the trade, transportation and various services resulting in the higher proportion in this sector. For the next decades of 1991, surprisingly, the proportion of the tertiary workers declined and became for the district of the Solapur. This decline in tertiary workers may be attributed to the out migration of the people in other parts of Maharashtra and increase in the proportion of the secondary workers. (Table 3.23) A spatial variation, during the 1971, was due to the variations in the economic activities depending upon the degree of urbanization. It was highest for the North Solapur, as a result of Solapur city, while lowest for Mohol and South Solapur tahsil. Likewise Mangalwedha tahsil has also recorded lowest proportion of tertiary workers. There are wide variations in various tahsils and more than seventy percent tahsils have lower proportions than the region under study. As far as, the proportion of the tertiary workers is concerned, due to pilgrimage centre in Pandharpur, the tertiary workers are quite sizable. 153
77 Table 3.24 Percentage of Tertiary Workers in Solapur district ( ) Sr. Tahsil Tertiary workers in percentage No Karmala Madha Barshi North Solapur Mohol Pandharpur Malshiras Sangola Mangalwedha South Solapur Akkalkot District Total During the 1981, the North Solapur has shown percentage of tertiary workers, which is most surprising except for North Solapur tahsil, rest all other tahsils have shown lower percentage of tertiary workers than the region as a whole. Similar trend has also been observed, for the year1991. In this year also, no tahsil other than North Solapur has shown higher proportions than the region. Further, investigation of the tertiary workers in the year 2001, shows highest for the North Solapur, while lowest for South Solapur tahsil. Surprisingly, in this year also except, North Solapur tahsil, rest all other tahsils demonstrated much lower percentage of tertiary workers than the region under study. (Fig. 3.19) 154
78 155
79 3.12 LITERACY PATTERN IN SOLAPUR DISTRICT: Literacy is many times considered as a fairly relevant index of the socio-economic development of a region. The variations in literacy, many times indicate, the place of which a society is getting transformed. A level of literacy influences to a significant extent, the socio economic development of a region. Literacy also influences fertility, mortality, and economic composition of the population of a region. Without, an analysis of literacy pattern, therefore, a study of the population for plannning of a region is not complete. Definition of literacy varies from country to country. In India, all those persons who can read as well as write in any language of the world are classified as literate. Levels of literacy vary enormously from one country to other. Even within the same country, the levels of literacy vary between urban and rural areas, among males and females and also different occupational and social groups. A large number of socio economic factors, such as nature of economy, levels of urbanization, standard of living, place of females in society, educational opportunities and levels of technological development influence the literacy pattern Temporal Literacy Pattern in Solapur District ( ) The percentages of literates to the total population for the year 1971, 1981, 1991 and 2001 have been calculated for total rural and urban areas. In the year 1971, only percent literates were recorded, while those for urban areas and rural areas were of the magnitude of percent and percent respectively. It is expected, that due to the availability of educational facilities in the urban areas, the proportions of literate are higher, while for the rural areas, due to lack of educational facilities, the percentage of literate was low. Similarly, in the year 1981, when the pattern of literacy was of the order of percent for the total 156
80 literacy of the Solapur district, while for urban areas, it was percent, and for rural area it was percent. It must be noted that for all the concerned decades, the total literacy, have been increasing consistently and became of the order of percent and percent for the 1991 and 2001, respectively. While for urban areas, the literacy pattern was of the order of and percent respectively. For rural areas of Solapur district, though, it was higher than the previous decades but was lower than total and urban literacy for 1991 and (Table 3.24) (Fig. 3.20) Table: 3.25 Percentage of literates for Rural and Urban areas in Solapur District ( ) Sr. No Year Rural Urban Total Source: Socio-economic review of Solapur distritct Tahsilwise Literacy in Solapur District: For different tahsils of Solapur district, the percentage of literacy was also calculated for the last four decades. The average literacy for the region was percent for the 1971, being highest for the North Solapur tahsil, while lowest was for Mangalwedha tahsil. There are only four tahsils that show higher percentage of literates than the region average, these are in order of importance, North Solapur, Pandharpur, Barshi and Mohol. Rest of other tahsils represents low percentage of literates than the region average in the year
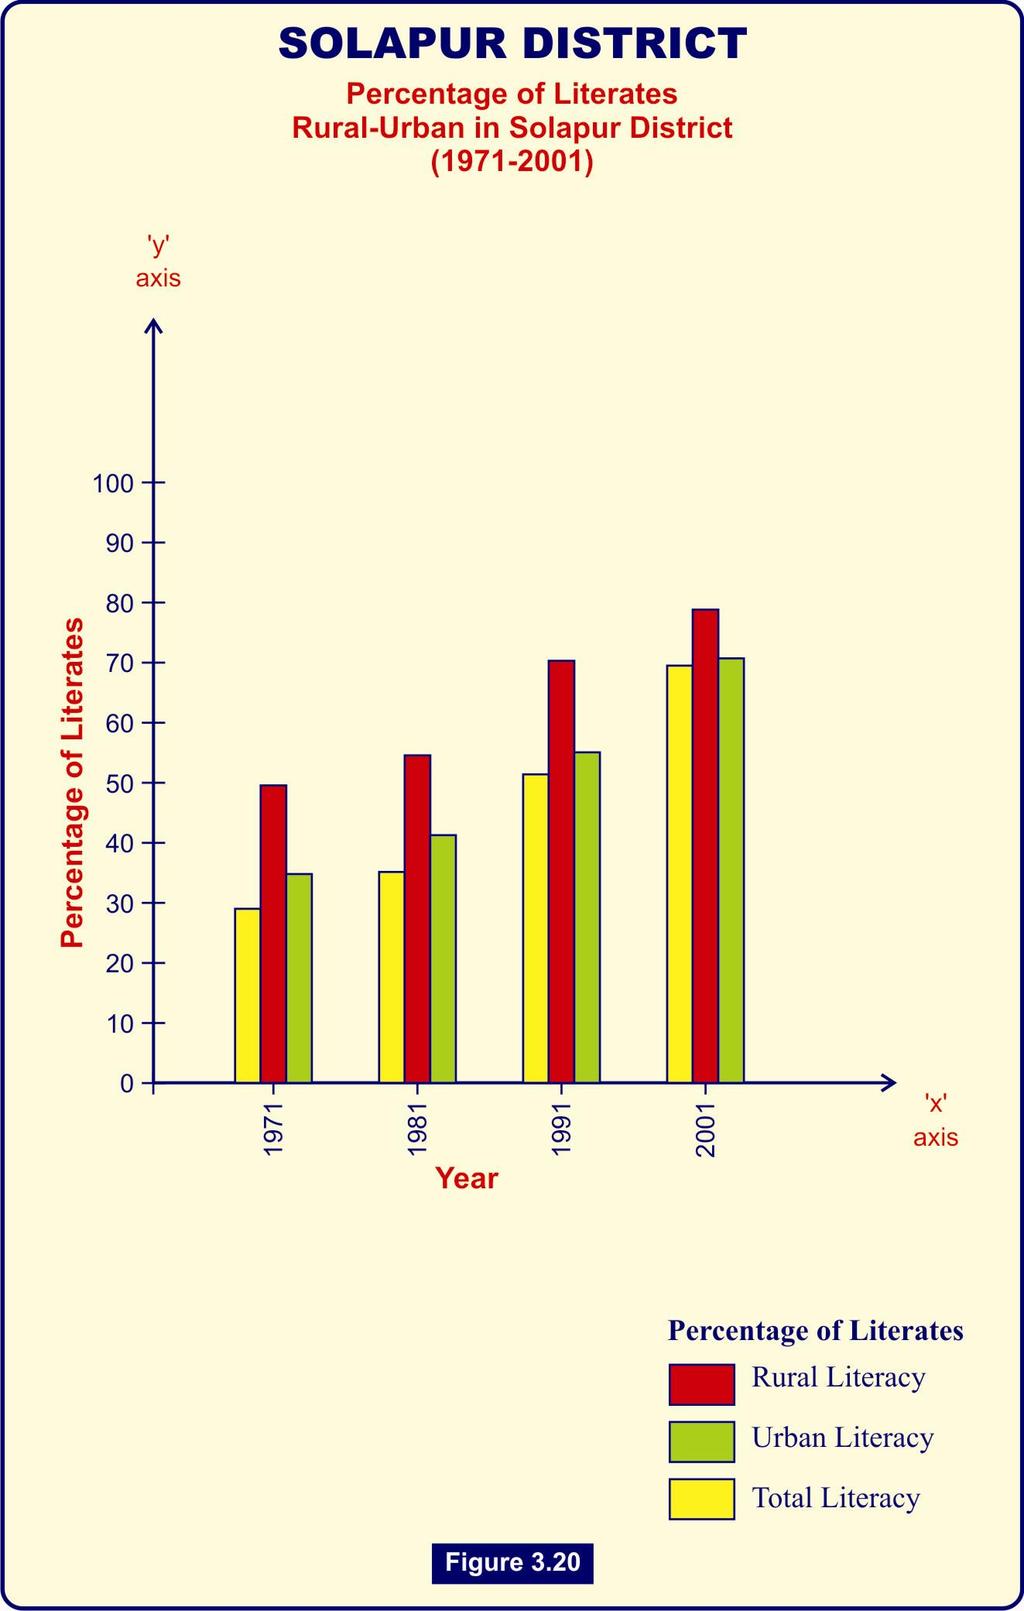
81 158
82 For the year 1981, the total literacy for the district was percent. North Solapur tahsil again retained the first position as regard to percentage of literates, while lowest again for the Mongalwedha tahsil. In this year, there were only two tahsils namely North Solapur and Barshi which were above the region average for the literacy, while rest other tahsils represented much lower percentage of literates below the average for the region. (Table 3.25) Table 3.26 Percent of literates to the total population in each tahsil of solapur district ( ) Sr. Tahsil Percentage of literates No Karmala Madha Barshi North Solapur Mohol Pandharpur Malshiras Sangola Mangalwedha South Solapur Akkalkot District Total Source : Socio-economic review of Solapur district (2001) 159
83 In the year 1991, the district total percentage for literates was estimated percent; North Solapur has occupied the first position as far as the total literacy within the various tahsils is concerned. In the year 1991, Akkalkot tahsil lagged behind than other tahsils of the district. There are wide variations in the percentage of literates within the district of Solapur. There are only two tahsils in the year 1991; having the higher proportion of literates than the region average and rest other tahsils were found below the region average. In the most recent decade for 2001, due to social awareness among the people, remarkable percentages of literate were recorded. For the district as a whole, the percentage of literate was observed percent, being highest for the North Solapur tahsil while lowest for the Sangola tahsil. In the north Brashi and in the central part of region, the northern Solapur tahsil and in western part of district, Malshiras depict higher percentage than the region average. One more point to note that due to social awareness among the people, most of the tahsils of Solapur district have recorded very astonishing percentage of literate in most of the tahsils and as a result of this, there are not so wide variations in the literacy rate within the different tahsils of the Solapur district. It may be stated that the primary education facilities are being made compulsory by the Government in order to improve the standard of living of the people. This has also been observed that now days, parents living in the rural areas, are taking increasing interest to teach their children without making any distinction between male and female child Tahsilwise Male literacy in Solapur district ( ): In the year 1971, the percentage of male literacy was calculated to percent. Within the district, the percentage of male literacy varies from one tahsil to another. The highest percentage of male literate was for 160
84 North Solapur tahsil, while the lowest was recorded for Mangalwedha. North Solapur tahsil due to the existence of Solapur city and number of educational institutions might have resulted in the high percentage of male literate, while due to less educational facilities resulted, lower percentage for Mangalwedha. Barshi and Pandharpur tahsil relatively having higher urban population have also shown relatively higher percentage which is more than 48 percent for both tahsils. There are four tahsils, namely, Karmala, Madha, South Solapur and Akkalkot which shown the percentage of literate between 40 to45 percent of male literates remaining tahsils of the district have except Mohol, the percentage of the male literate below 40 percent. This may be stated, that with the degree of urbanization and the percentage of secondary and tertiary workers, which have great bearing upon the male literacy rate in the year Similarly, in the year 1981, North Solapur represented higher percentage, while Mangalwedha represented lower percentage of male literates. The tehsils, having more than fifty percent male literates, were Madha, Barshi and Pandharpur and between fourty five to fifty percent male literates were found in Karmala, Mohal, Malshiras, Sangola and Mangalwedha tahsils. There were only two tahsils namely North Solapur and Barshi, which have shown higher percentage than region as a whole, while rest of tahsils represented below percentage of male literate than the region under study. There has been tremendous improvement in the rate of male literacy for the next two decade as the percent age of male literates became as high as percent for the year 1991, for the district as a whole. Three tahsils namely North Solapur, Barshi and Madha have shown higher percentage than the district as a whole. As expected, North Solapur occupies first rank, followed by Barshi and lowest percentage of male literate was recorded for Akkalkot tahsil in the Sourthern parts of 161
85 the district. Between 65 to 70 percent male literates were found in Karmala, Mohol, Pandharpur, Malshiras, Mangalwedha and South Solapur tahsils in the year And rest tahsils represented below 65 percent male literates in the year (fig. 3.21) Table 3.27 Percentage of male literates in each tahsil of Solapur district Sr. Percentage of Male literacy Tahsil No Karmala Madha Barshi North Solapur Mohol Pandharpur Malshiras Sangola Mangalwedha South Solapur Akkalkot District Total For the year 2001, due to improvement in educational facilities, there has been substaintial increase in most of the tahsils of the Solapur district as the percentage of male literates became as high as more than 82 percentages for the region as a whole. This impressive increase in male 162
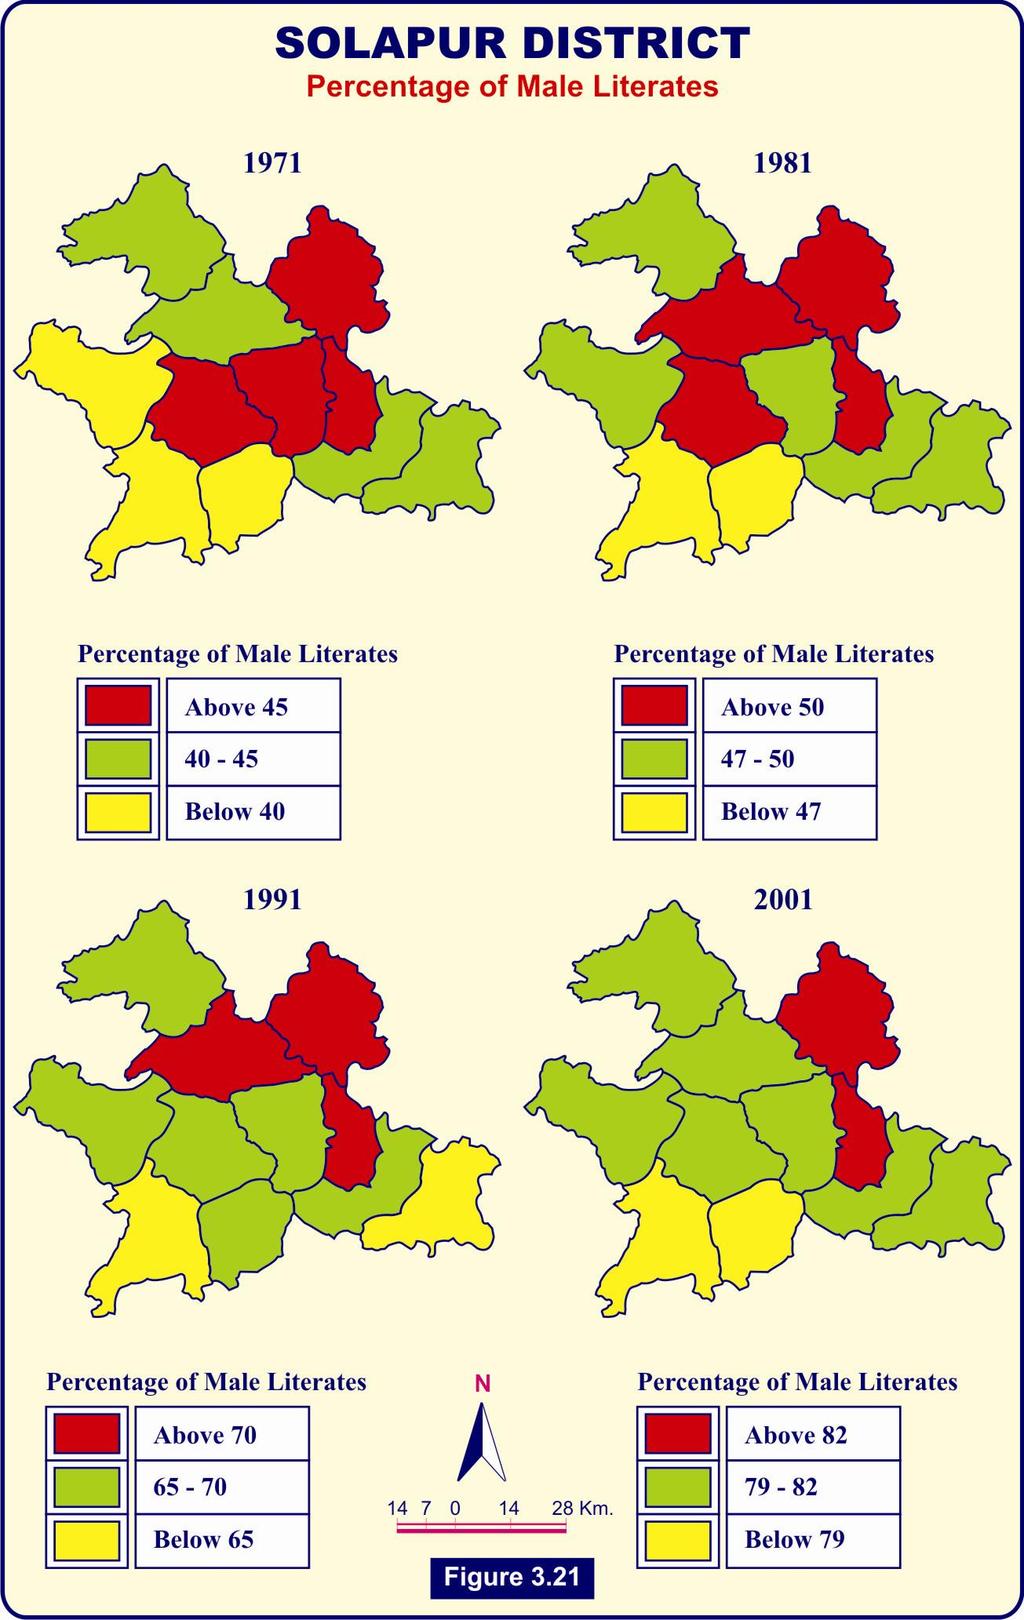
86 163
Spatial Distribution of Primary Health Centres in Solapur District of Maharashtra
 EUROPEAN ACADEMIC RESEARCH Vol. II, Issue 6/ September 2014 ISSN 2286-4822 www.euacademic.org Impact Factor: 3.1 (UIF) DRJI Value: 5.9 (B+) Spatial Distribution of Primary Health Centres in A. G. NIMASE
CHAPTERN-III DENSITY AND DISTRIBUTION OF POPULATION
 CHAPTERN-III DENSITY AND DISTRIBUTION OF POPULATION 3.1 Introduction. 3.2 Determinants of population Distribution and Density. 3.3 Trends of Population Density. 3.4 Variation in Density of Population for
MULTIPLE CHOICE. Choose the one alternative that best completes the statement or answers the question.
 Exam Name MULTIPLE CHOICE. Choose the one alternative that best completes the statement or answers the question. 1) One important feature of the world's population with the most significant future implications
CHAPTER VII PATTERNS OF URBANISATION
 7.1 INTRODUCTION CHAPTER VII PATTERNS OF URBANISATION Urbanisation has been regarded as an index of the level of socio-economic development of a country; hence, the study of urbanisation assumes importance
Post Independence Trends of Urbanization and Role of Small and Medium Towns in Maharashtra- A Geographical Analysis
 Post Independence Trends of Urbanization and Role of Small and Medium Towns in Maharashtra- A Geographical Analysis A careful and systematic study of the process of urbanization and related factors is
Spatio-temporal changes in literacy of Nandurbar district of Maharashtra, India
 2015; 1(10): 602-606 ISS Print: 2394-7500 ISS Online: 2394-5869 Impact Factor: 5.2 IJAR 2015; 1(10): 602-606 www.allresearchjournal.com Received: 23-07-2015 Accepted: 24-08-2015 RC Ahire Geography, Late
The Cultural Landscape: An Introduction to Human Geography, 10e (Rubenstein) Chapter 2 Population
 Chapter 2 Population") The Cultural Landscape: An Introduction to Human Geography, 10e (Rubenstein) Chapter 2 Population 1) One important feature of the world's population with the most significant future implications is that
The Cultural Landscape: An Introduction to Human Geography, 10e (Rubenstein) Chapter 2 Population 1) One important feature of the world's population with the most significant future implications is that
AS Population Change Question spotting
 AS Change Question spotting Changing rate of growth How the rate of growth has changed over the last 100 years Explain the reasons for these changes Describe global or national distribution. Study the
RubensteinCh. 2. Population
 RubensteinCh. 2 Population Icebreaker Imagining Billions Q1: The equator stretches approx. 25,000 miles around Earth. If each of the world s 6.8 billion people was allotted 1 yard of space. How many times
The trends and patterns of urbanization in the NCT of Delhi during
 International Journal of Interdisciplinary and Multidisciplinary Studies (IJIMS), 2015, Vol 2, No.4, 27-39. 27 Available online at http://www.ijims.com ISSN: 2348 0343 The trends and patterns of urbanization
A STUDY OF HUMAN DEVELOPMENT APPROACH TO THE DEVELOPMENT OF NORTH EASTERN REGION OF INDIA
 ABSTRACT A STUDY OF HUMAN DEVELOPMENT APPROACH TO THE DEVELOPMENT OF NORTH EASTERN REGION OF INDIA Human development by emphasizing on capability approach differs crucially from the traditional approaches
Downloaded from
 GIST OF THE LESSON: General patternsof population distribution in the world, density of population, factors influencing the distribution of population, population growth, trends in population growth, doubling
Geography - Grade 8. Unit A - Global Settlement: Patterns and Sustainability
 Geography - Grade 8 Geographical Thinking: Spatial Significance Patterns and Trends Interrelationships Geographic Perspective Geographic Inquiry: STEP 1 - Formulate Questions STEP 2 - Gather and Organize
The National Spatial Strategy
 Purpose of this Consultation Paper This paper seeks the views of a wide range of bodies, interests and members of the public on the issues which the National Spatial Strategy should address. These views
DENSITY OF POPULATION
 DENSITY OF POPULATION Chapter 4 The concept of population density is a simple concept of relating population size to the land area with a view to assessing crudely the pressure of population upon the resources
A Review of Concept of Peri-urban Area & Its Identification
 A Review of Concept of Peri-urban Area & Its Identification Ar. Manita Saxena Research Scholar Department of Architecture and Planning M.A.N.I.T, Bhopal Dr. Supriya Vyas Assistant Professor, Department
SRJIS/BIMONTHLY/S. A. BORUDE. ( ) APPLICATION OF SPATIAL VARIATION URBAN DENSITY MODEL: A STUDY OF AHMEDNAGAR CITY, MAHARASHTRA, INDIA
 APPLICATION OF SPATIAL VARIATION URBAN DENSITY MODEL: A STUDY OF AHMEDNAGAR CITY, MAHARASHTRA, INDIA") APPLICATION OF SPATIAL VARIATION URBAN DENSITY MODEL: A STUDY OF AHMEDNAGAR CITY, MAHARASHTRA, INDIA S.A. Borude, Assistant Professor, PG, Dept. of Geography, Ahmednagar College, Ahmednagar, Maharashtra.
APPLICATION OF SPATIAL VARIATION URBAN DENSITY MODEL: A STUDY OF AHMEDNAGAR CITY, MAHARASHTRA, INDIA S.A. Borude, Assistant Professor, PG, Dept. of Geography, Ahmednagar College, Ahmednagar, Maharashtra.
Urbanization in Japan since 1960 viewed from the DID Statistics
 Institute of Geography, Asahikawa Campus Hokkaido University of Education Asahikawa, 070-8621, Japan 1. Introduction Urban expansion is one of the most important features of land use/cover changes in the
Summary and Statistical Report of the 2007 Population and Housing Census Results 1
 Summary and Statistical Report of the 2007 Population and Housing Census Results 1 2 Summary and Statistical Report of the 2007 Population and Housing Census Results This document was printed by United
National Spatial Development Perspective (NSDP) Policy Coordination and Advisory Service
 Policy Coordination and Advisory Service") National Spatial Development Perspective (NSDP) Policy Coordination and Advisory Service 1 BACKGROUND The advances made in the First Decade by far supersede the weaknesses. Yet, if all indicators were
National Spatial Development Perspective (NSDP) Policy Coordination and Advisory Service 1 BACKGROUND The advances made in the First Decade by far supersede the weaknesses. Yet, if all indicators were
Chapter 10 Human Settlement Geography Book 1 Class 12
 CHAPTER 10 HUMAN SETTLEMENTS 1. RURAL, SUB URBAN AND URBAN SETTLEMENTS: This classification is common worldwide but the criteria differ from country to country. 5. Criteria for classification differs from
CHAPTER 2: KEY ISSUE 1 Where Is the World s Population Distributed? p
 CHAPTER 2: KEY ISSUE 1 Where Is the World s Population Distributed? p. 45-49 Always keep your vocabulary packet out whenever you take notes. As the term comes up in the text, add to your examples for the
The System of Xiaokang Indicators: A Framework to Measure China's Progress
 Int. Statistical Inst.: Proc. 58th World Statistical Congress, 2011, Dublin (Session CPS020) p.6359 The System of Xiaokang Indicators: A Framework to Measure China's Progress Qingzhe Lv E-mail: lvqz@gj.stats.cn
GEOGRAPHY Practice Answer Paper - 2
 GEOGRAPHY Practice Answer Paper - 2 Q.1) Select the correct option and rewrite the sentence : 4 1) According to Census 2011, the average population density of India is 382 persons per sq.km. 2) The rate
A Case Study of Regional Dynamics of China 中国区域动态案例研究
 A Case Study of Regional Dynamics of China 中国区域动态案例研究 Shuming Bao Spatial Data Center & China Data Center University of Michigan 1:00 PM - 2:00 PM, Tue, Feb 6, 2018 EST USA A Case Study of Regional Dynamics
ABSTRACT One of the serious problems that India facing today is the problem of regional disparities. It results in social, economic and political
 ABSTRACT One of the serious problems that India facing today is the problem of regional disparities. It results in social, economic and political instability. The current tension and strain in the Indian
Human Population Dynamics CAPT Embedded Task
 Name Per. Assigned Due Human Population Dynamics CAPT Embedded Task Essential Question: What factors influence population growth? The human population has existed for a little more than 500,000 years.
AP Human Geography Free-response Questions
 AP Human Geography Free-response Questions 2000-2010 2000-preliminary test 1. A student concludes from maps of world languages and religions that Western Europe has greater cultural diversity than the
CHAPTER - I INTRODUCTION. 1.2 Importance of Studies of Medical Geography
 1 CHAPTER - I INTRODUCTION 1.1 Medical Geography in General 1.2 Importance of Studies of Medical Geography 1.3 Review of Work done 1.4 Concept of Urban Medical Geography 1.5 Choice of Region and Topic
Urban Expansion and Loss of Agricultural Land: A Remote Sensing Based Study of Shirpur City, Maharashtra
 Cloud Publications International Journal of Advanced Remote Sensing and GIS 2017, Volume 6, Issue 1, pp. 2097-2102 ISSN 2320 0243, Crossref: 10.23953/cloud.ijarsg.113 Research Article Open Access Urban
Unit No-1&2. Settlement Geography
 Unit No-1&2 Settlement Geography TYPES OF SETTLEMENTS Rural Settlements - agriculture as the predominant occupation. Urban settlements - principal industries are secondary and tertiary. Rural Settlement:
Anne Buisson U.M.R. E.S.P.A.C.E. Ater, University of Provence
 LITERACY AND RELIGION : SOME GEOGRAPHICAL LINKS Anne Buisson U.M.R. E.S.P.A.C.E. Ater, University of Provence The idea of this paper is to understand links between literacy and religion in India, keeping
Development of modal split modeling for Chennai
 IJMTES International Journal of Modern Trends in Engineering and Science ISSN: 8- Development of modal split modeling for Chennai Mr.S.Loganayagan Dr.G.Umadevi (Department of Civil Engineering, Bannari
R E SEARCH HIGHLIGHTS
 Canada Research Chair in Urban Change and Adaptation R E SEARCH HIGHLIGHTS Research Highlight No.8 November 2006 THE IMPACT OF ECONOMIC RESTRUCTURING ON INNER CITY WINNIPEG Introduction This research highlight
Urbanisation and Socio-Economic Structure in Lakshadweep
 International Journal of Research in Geography (IJRG) Volume 3, Issue 3, 2017, PP 30-37 ISSN 2454-8685 (Online) http://dx.doi.org/10.20431/2454-8685.0303003 www.arcjournals.org Urbanisation and Socio-Economic
SPATIO-TEMPORAL ANALYSIS OF URBAN POPULATION GROWTH AND DISTRIBUTION IN AURANGABAD CITY
 International Journal of Research in Social Sciences Vol. 8 Issue 3, March 2018, ISSN: 2249-2496 Impact Factor: 7.081 Journal Homepage: Double-Blind Peer Reviewed Refereed Open Access International Journal
GIS in Locating and Explaining Conflict Hotspots in Nepal
 GIS in Locating and Explaining Conflict Hotspots in Nepal Lila Kumar Khatiwada Notre Dame Initiative for Global Development 1 Outline Brief background Use of GIS in conflict study Data source Findings
ESTIMATE THE REGRESSION COEFFICIENTS OF VARIABLES SPL. REFERENCE TO FERTILITY
 ESTIMATE THE REGRESSION COEFFICIENTS OF VARIABLES SPL. REFERENCE TO FERTILITY *Poonam Kumari, # Dr. Mukesh Joshi Research Scholar, Dept. of Mathematics, CMJ University, Shillong, Meghalaya HOD Department
UNIVERSITY OF KWAZULU-NATAL EXAMINATION: JUNE 2012 Howard College and Westville Campuses
 UNIVERSITY OF KWAZULU-NATAL EXAMINATION: JUNE 2012 Howard College and Westville Campuses SCHOOL : AGRICULTURE, EARTH AND ENVIRONMENTAL SCIENCES LEVEL : 1 MODULE : HUMAN ENVIRONMENTS CODE : GEOG 110 H1/W1
Measuring Disaster Risk for Urban areas in Asia-Pacific
 Measuring Disaster Risk for Urban areas in Asia-Pacific Acknowledgement: Trevor Clifford, Intl Consultant 1 SDG 11 Make cities and human settlements inclusive, safe, resilient and sustainable 11.1: By
Topic 4: Changing cities
 Topic 4: Changing cities Overview of urban patterns and processes 4.1 Urbanisation is a global process a. Contrasting trends in urbanisation over the last 50 years in different parts of the world (developed,
Summary and Implications for Policy
 Summary and Implications for Policy 1 Introduction This is the report on a background study for the National Spatial Strategy (NSS) regarding the Irish Rural Structure. The main objective of the study
ISSN The NEHU Journal, Vol XIV, No. 1, January - June 2016, pp
 ISSN. 0972-8406 The NEHU Journal, Vol XIV, No. 1, January - June 2016, pp. 69-86 69 Regional Imbalances in the Levels of Socio-Economic Development: A Case Study of Malda District, West Bengal CHAND SULTANA
Population Profiles
 U N D E R S T A N D I N G A N D E X P L O R I N G D E M O G R A P H I C C H A N G E MAPPING AMERICA S FUTURES, BRIEF 6 2000 2010 Population Profiles Atlanta, Las Vegas, Washington, DC, and Youngstown Allison
Frans Thissen Department of Geography, Planning and International Development Studies Rural Poverty in Flanders
 Frans Thissen Department of Geography, Planning and International Development Studies Rural Poverty in Flanders a diversity of poverty in a diversity of places Rural poverty research in Flanders Henk Meert
VII APPROACHES IN SELECTING A CORE SET OF INDICATORS
 HANDBOOK ON RURAL HOUSEHOLDS LIVELIHOOD AND WELL-BEING VII APPROACHES IN SELECTING A CORE SET OF INDICATORS VII.1 Introduction In Chapters III to VI of this Handbook, and in associated annexes, numerous
Opportunities and challenges of HCMC in the process of development
 Opportunities and challenges of HCMC in the process of development Lê Văn Thành HIDS HCMC, Sept. 16-17, 2009 Contents The city starting point Achievement and difficulties Development perspective and goals
Apéndice 1: Figuras y Tablas del Marco Teórico
 Apéndice 1: Figuras y Tablas del Marco Teórico FIGURA A.1.1 Manufacture poles and manufacture regions Poles: Share of employment in manufacture at least 12% and population of 250,000 or more. Regions:
It is clearly necessary to introduce some of the difficulties of defining rural and
 UNIT 2 CHANGING HUMAN ENVIRONMENTS G2 Theme 2 Investigating Settlement Change in MEDCs 2.1 What are the distinctive features of settlements? It is clearly necessary to introduce some of the difficulties
CARIBBEAN POPULATION AND DEVELOPMENT TRENDS AND INTERRELATIONS: A ASSESSMENT VOLUME 1
 LC/CAR/G.352 ECONOMIC COMMISSION FOR LATIN AMERICA AND THE CARIBBEAN Subregional Headquarters for the Caribbean ECLAC/CELADE DEMOGRAPHY UNIT jc:.'arlv'- H. CARIBBEAN POPULATION AND DEVELOPMENT TRENDS AND
Jun Tu. Department of Geography and Anthropology Kennesaw State University
 Examining Spatially Varying Relationships between Preterm Births and Ambient Air Pollution in Georgia using Geographically Weighted Logistic Regression Jun Tu Department of Geography and Anthropology Kennesaw
CH. 2 POPULATION AND HEALTH
 CH. 2 POPULATION AND HEALTH KNOW age distribution agricultural density arithmetic density Cairo Conference carrying capacity census child mortality rate contraception Cornucopians crude death rate (CDR)
Global Atmospheric Circulation. Past climate change and natural causes. Global climate change and human activity
 GCSE Geography Edexcel B Revision Checklist Paper 1. Global Geographical Issues Topic 1. Hazardous Earth Key Idea I know/ understand The world s climate system Global Atmospheric Circulation Past climate
TOPIC 8: POPULATION DISTRIBUTION AND URBANIZATION
 TOPIC 8: POPULATION DISTRIBUTION AND URBANIZATION Concept of population distribution Factors affecting population distribution and density Urbanization: Concept and issues associated Introduction WORLD
THE ROLE OF GEOSPATIAL TECHNOLOGY IN SOCIAL AMENITIES FOR RURAL DEVELOPMENT
 THE ROLE OF GEOSPATIAL TECHNOLOGY IN SOCIAL AMENITIES FOR RURAL DEVELOPMENT ANAND P. PANDIT, P.G. Department of Geography, New Arts Commerce and Science College, Ahmednagar. (MS) INDIA MADHUKAR R. KARALE
URBAN CHANGE DETECTION OF LAHORE (PAKISTAN) USING A TIME SERIES OF SATELLITE IMAGES SINCE 1972
 USING A TIME SERIES OF SATELLITE IMAGES SINCE 1972") URBAN CHANGE DETECTION OF LAHORE (PAKISTAN) USING A TIME SERIES OF SATELLITE IMAGES SINCE 1972 Omar Riaz Department of Earth Sciences, University of Sargodha, Sargodha, PAKISTAN. omarriazpk@gmail.com ABSTRACT
URBAN CHANGE DETECTION OF LAHORE (PAKISTAN) USING A TIME SERIES OF SATELLITE IMAGES SINCE 1972 Omar Riaz Department of Earth Sciences, University of Sargodha, Sargodha, PAKISTAN. omarriazpk@gmail.com ABSTRACT
ENVIRONMENTALLY ORIENTED PLANNING FOR HUMAN SETTLEMENTS
 40 TOPIC 7 ENVIRONMENTALLY ORIENTED PLANNING FOR HUMAN SETTLEMENTS Scope The process of rapid population growth and urbanization taking place in practically all the less developed countries will have an
Human Resources in North Coastal Andhra Pradesh- Prospects of Development in the Region
 International Journal of Humanities and Social Science Invention ISSN (Online): 2319 7722, ISSN (Print): 2319 7714 Volume 3 Issue 2 ǁ February. 2014ǁ PP.47-55 Human Resources in North Coastal Andhra Pradesh-
Energy Use in Homes. A series of reports on domestic energy use in England. Energy Efficiency
 Energy Use in Homes A series of reports on domestic energy use in England Energy Efficiency Energy Use in Homes A series of reports on domestic energy use in England This is one of a series of three reports
Changing Socio-Economic Profile of Thiruvananthapuram District, Kerala
 IOSR Journal Of Humanities And Social Science (IOSR-JHSS) Volume 19, Issue 1, Ver. VII (Jan. 2014), PP 04-11 e-issn: 2279-0837, p-issn: 2279-0845. Changing Socio-Economic Profile of Thiruvananthapuram
Operational Definitions of Urban, Rural and Urban Agglomeration for Monitoring Human Settlements
 Operational Definitions of Urban, Rural and Urban Agglomeration for Monitoring Human Settlements By Markandey Rai United Nations Human Settlements Programme PO Box-30030 Nairobi, Kenya Abstract The United
A Framework for the Study of Urban Health. Abdullah Baqui, DrPH, MPH, MBBS Johns Hopkins University
 This work is licensed under a Creative Commons Attribution-NonCommercial-ShareAlike License. Your use of this material constitutes acceptance of that license and the conditions of use of materials on this
SUSTAINABILITY - RELATED STRATEGIES AND URBAN SETTLEMENTS
 SUSTAINABILITY - RELATED STRATEGIES AND URBAN SETTLEMENTS KEY CONCEPTS: In this session, we will consider the following: Rural Development Programmes & Strategies Rural Development Programmes & Strategies
Indicators of sustainable development: framework and methodologies CSD Indicators of sustainable development 1996
 Indicators of sustainable development: framework and methodologies CSD Indicators of sustainable development 1996 Keywords: mountain areas, mountain development, natural resources management, sustainable
Analysis of travel-to-work patterns and the identification and classification of REDZs
 Analysis of travel-to-work patterns and the identification and classification of REDZs Dr David Meredith, Teagasc, Spatial Analysis Unit, Rural Economy Development Programme, Ashtown, Dublin 15. david.meredith@teagasc.ie
DATA DISAGGREGATION BY GEOGRAPHIC
 PROGRAM CYCLE ADS 201 Additional Help DATA DISAGGREGATION BY GEOGRAPHIC LOCATION Introduction This document provides supplemental guidance to ADS 201.3.5.7.G Indicator Disaggregation, and discusses concepts
The Cultural Landscape: Introduction to Human Geography Chapter 1 Thinking Geographically Chapter 2 Population
 The Cultural Landscape: Introduction to Human Geography Chapter 1 Thinking Geographically Chapter 2 Population 1) Scale is A) the system used by geographers to transfer locations from a globe to a map.
Mapping the Urban Farming in Chinese Cities:
 Submission to EDC Student of the Year Award 2015 A old female is cultivating the a public green space in the residential community(xiaoqu in Chinese characters) Source:baidu.com 2015. Mapping the Urban
ANALYZING CITIES & POPULATION: POPULATION GEOGRAPHY
 ANALYZING CITIES & POPULATION: POPULATION GEOGRAPHY Population Geography Population Geography study of the number, contribution, and distribution of human populations Demography the study of the characteristics
Human development is a well-being concept with its core being the capability
 www. epratrust.com Impact Factor : 0.998 p- ISSN : 2349-0187 e-issn : 2347-9671 January 2015 Vol - 3 Issue- 1 HUMAN DEVELOPMENT IN ASSAM- A DISTRICT LEVEL ANALYSIS Bishweshwar Bhattacharjee 1 1 Ph.D. Research
CBSE Question Paper 2010 GEOGRAPHY Class XII
 CBSE Question Paper 200 GEOGRAPHY Class XII Time allowed: 3 hours Maximum Marks: 70. Name any two areas of high latitudes in the world, where gathering economic activity is practiced. 2. Name the type
SOCIO-DEMOGRAPHIC INDICATORS FOR REGIONAL POPULATION POLICIES
 SOCIO-DEMOGRAPHIC INDICATORS FOR REGIONAL POPULATION POLICIES A CANADIAN PERSPECTIVE Marc Termote Université de Montréal Potsdam, DART Conference, September 3, 2012 3 STEPS 1. Defining the problem 2. Identifying
S. LEIVANG, MD. H. ALI AND S. SAGOLSEM
 Journal of Crop and Weed, 13(2): 136-143 (2017) Comparative socio-economic analysis of problems of livelihood security with respect to food security between rural and urban areas in Imphal West District
Unit 6: Development and Industrialization. Day 1: What is development?
 Unit 6: Development and Industrialization Day 1: What is development? What is Development? The process of improving the material conditions of people through the diffusion of knowledge and technology More
Population CHAPTER. Learning Outcomes. Where is the world s population distributed?
 CHAPTER 2 Population Learning Outcomes Where is the world s population distributed? 2.1.1: Identify the four regions where most of the world s human inhabitants are clustered. 2.1.2: List the main reasons
Write the numbers of the six questions you have attempted in the marks grid on the back cover of your answer booklet.
 X208/301 NATIONAL QUALIFICATIONS 2008 THURSDAY, 22 MAY 9.00 AM 10.30 AM GEOGRAPHY HIGHER Paper 1 Physical and Human Environments Six questions should be attempted, namely: all four questions in Section
Development from Representation? A Study of Quotas for the Scheduled Castes in India. Online Appendix
 Development from Representation? A Study of Quotas for the Scheduled Castes in India Online Appendix Francesca Refsum Jensenius December 1, 2014 1 Description of Data The constituency-level estimates of
AP Human Geography Free Response Questions Categorized
 AP Human Geography Free Response Questions Categorized 2002-2010 2. Population (13-17%) 3. Over the past 150 years, Europe has changed from a source to a destination region for international migration.
Discerning sprawl factors of Shiraz city and how to make it livable
 Discerning sprawl factors of Shiraz city and how to make it livable 1. Introduction: Iran territory has now been directly affected by urban land-uses which are shaping landscapes in cities and around them.
2/25/2019. Taking the northern and southern hemispheres together, on average the world s population lives 24 degrees from the equator.
 Where is the world s population? Roughly 88 percent of the world s population lives in the Northern Hemisphere, with about half north of 27 degrees north Taking the northern and southern hemispheres together,
Disaggregation according to geographic location the need and the challenges
 International Seminar On United Nations Global Geospatial Information Management Disaggregation according to geographic location the need and the challenges 6 th 7 th November 2018 Tribe Hotel, Nairobi,
DEPARTMENT OF GEOGRAPHY JANANAYAK CHANDRASHEKHAR UNIVERSITY, BALLIA. Course Structure for Ph.D. (Doctor of Philosophy) Admission Test
 Admission Test") DEPARTMENT OF GEOGRAPHY JANANAYAK CHANDRASHEKHAR UNIVERSITY, BALLIA Course Structure for Ph.D. (Doctor of Philosophy) Admission Test Department of Geography ACADEMIC SESSION -2018-19 JANANAYAK CHANDRASHEKHAR
DEPARTMENT OF GEOGRAPHY JANANAYAK CHANDRASHEKHAR UNIVERSITY, BALLIA Course Structure for Ph.D. (Doctor of Philosophy) Admission Test Department of Geography ACADEMIC SESSION -2018-19 JANANAYAK CHANDRASHEKHAR
UNIT 11 INTER STATE AND INTER DISTRICT IMBALANCES
 UNIT 11 INTER STATE AND INTER DISTRICT IMBALANCES Inter State and Inter District Imbalances Structure 11.0 Objectives 11.1 Introduction 11.2 Conceptual Bases to Understand the Issues of Regional Imbalances
2nd INTERNATIONAL CONFERENCE ON BUILT ENVIRONMENT IN DEVELOPING COUNTRIES (ICBEDC 2008)
") Aspects of Housing Development Analysis of the Impacts of Social & Economic Issues on Housing Physical Indicators (Case Study: The! nd District of Tehran) M. S. Shokouhi 1 and Toofan Jafari 2 1 Student
Aspects of Housing Development Analysis of the Impacts of Social & Economic Issues on Housing Physical Indicators (Case Study: The! nd District of Tehran) M. S. Shokouhi 1 and Toofan Jafari 2 1 Student
Key Issue 1: Where Are Services Distributed? INTRODUCING SERVICES AND SETTLEMENTS LEARNING OUTCOME DESCRIBE THE THREE TYPES OF SERVICES
 Revised 2017 NAME: PERIOD: Rubenstein: The Cultural Landscape (12 th edition) Chapter Twelve Services and Settlements (pages 430 thru 457) This is the primary means by which you will be taking notes this
Energy Use in Homes 2004
 Energy Use in Homes 2004 A series of reports on domestic energy use in England Space and Water Heating Energy Use in Homes 2004 A series of reports on domestic energy use in England This is one of a series
Remote Sensing and GIS Application in Change Detection Study Using Multi Temporal Satellite
 Cloud Publications International Journal of Advanced Remote Sensing and GIS 2013, Volume 2, Issue 1, pp. 374-378, Article ID Tech-181 ISSN 2320-0243 Case Study Open Access Remote Sensing and GIS Application
In April of 1949 the Population Commission of the Economic
 ANNOTATIONS THE DETERMINANTS AND CONSEQUENCES OF POPULATION TRENDS In April of 1949 the Population Commission of the Economic and Social Council of the United Nations recommended that.. the Secretary-General
AP Human Geography Chapter 2: Population
 Population Concentrations AP Human Geography Key Issue 1 Where is the World s Population Distributed? Pgs. 44 53 1. The world s population is highly clustered, or concentrated in certain regions. FOUR
Rural Urban Disparity of Literacy in Murshidabad District, WB, India
 International Research Journal of Social Sciences ISSN 2319 3565 Rural Urban Disparity of Literacy in Murshidabad District, WB, India Abstract Debasish Roy 1 and Anushri Mondal 2 1 Geography, Ahiran Hemangini
Dynamic Links between Economy and Human Development: A Study of Indian States. Santanu Ray. Abstract
 Dynamic Links between Economy and Human Development: A Study of Indian States Santanu Ray Abstract Background: Economic growth, in recent development paradigm, has been identified as the necessary but
A.P. Human Geography
 A.P. Human Geography 2012-2013 Instructor: Chris Vitt Brief Description of Course AP Human Geography is designed to provide students with a learning experience equivalent to that obtained in most college
Estimation of Travel demand from the city commuter region of Muvattupuzha municipal area Mini.M.I 1 Dr.Soosan George.T 2 Rema Devi.M.
 Estimation of Travel demand from the city commuter region of Muvattupuzha municipal area Mini.M.I 1 Dr.Soosan George.T 2 Rema Devi.M. 3 Professor, Department of Civil Engg., M.A.College of Engg, Kothamangalam,
TOWARDS STRATEGIC SPATIAL PLANNING IN JAMAICA: THE NATIONAL SPATIAL PLAN
 TOWARDS STRATEGIC SPATIAL PLANNING IN JAMAICA: THE NATIONAL SPATIAL PLAN JIEP 5th Biennial Conference on the Environment: Balancing National Development and Environmental Protection June 6, 2011 Jamaica
Links between socio-economic and ethnic segregation at different spatial scales: a comparison between The Netherlands and Belgium
 Links between socio-economic and ethnic segregation at different spatial scales: a comparison between The Netherlands and Belgium Bart Sleutjes₁ & Rafael Costa₂ ₁ Netherlands Interdisciplinary Demographic
Declaration Population and culture
 Declaration Population and culture The ministers of the parties to the Alpine Convention regard the socio-economic and socio-cultural aspects mentioned in Article 2, Paragraph 2, Item a., as being central
ESPON public database
 ESPON public database - tables and indicators overview - NUTS-Reference: NUTS 0 reference NUTS 1 reference NUTS 2 reference NUTS 3 reference ESPON basic indicators: Area NUTS 2 Area in square kilometer
Introduction to Development. Indicators and Models
 Introduction to Development Indicators and Models First World vs. Third World Refers to economic development Diversity and complexity of economy High per capita income Developed during the Cold War First
CHANGES IN THE STRUCTURE OF POPULATION AND HOUSING FUND BETWEEN TWO CENSUSES 1 - South Muntenia Development Region
 TERITORIAL STATISTICS CHANGES IN THE STRUCTURE OF POPULATION AND HOUSING FUND BETWEEN TWO CENSUSES 1 - South Muntenia Development Region PhD Senior Lecturer Nicu MARCU In the last decade, a series of structural
USING DOWNSCALED POPULATION IN LOCAL DATA GENERATION
 USING DOWNSCALED POPULATION IN LOCAL DATA GENERATION A COUNTRY-LEVEL EXAMINATION CONTENT Research Context and Approach. This part outlines the background to and methodology of the examination of downscaled