Bushkill Creek 3 rd Street Dam Removal Analysis
|
|
|
- Rodney Howard
- 5 years ago
- Views:
Transcription
1 Bushkill Creek 3 rd Street Dam Removal Analysis HEC HMS Runoff and Routing Model Stephen Beavan, Melanie DeFazio, David Gold, Peter Mara and Dan Moran CE 421: Hydrology Fall 2010 December 15, 2010
2 Contents 1. Objectives and Tasks Site Description Methods Sub basin Modeling NRCS Curve Numbers Time of Concentration Baseflow Reach Modeling Reservoir Modeling Results and Discussion Results Limitations References Appendices Appendix A Curve Number Tables Appendix B Time of Concentration Data Appendix C Baseflow Calculations for Bushkill Creek Appendix D Reach K Value Calculations Appendix E Flood Stage Areas for 3 rd St. Dam Appendix F Stage Discharge Table Spreadsheet Calculations Appendix G HEC HMS Results 1
3 1. Objectives and Tasks To determine the effect of removing the 3 rd Street Dam on peak flows in the Bushkill Creek, a model of the Bushkill Creek Watershed and the 3 rd Street Dam was created using HEC HMS (ACOE, 2001). In order to use this program, it was first necessary to complete extensive work within ArcGIS and AutoCAD. 1.1 Objective The goal of this report is to determine the difference in peak outflows, with and without the presence of the dam, for various design storm hydrographs. 1.2 Tasks Delineate the Bushkill Creek Watershed, divide into sub basins Determine the land cover, soil type and time of concentration within each sub basin Determine the stage storage relationship at the 3 rd Street Dam, as well as the stagedischarge relationship Develop an accurate estimation of the Bushkill Creek s base flow using data from nearby watersheds Develop a HEC HMS model of the watershed, reaches and reservoir Rout storm hydrographs with and without the dam 2. Site Description The Bushkill Creek Watershed encompasses an area of almost eighty square miles. The watershed and its corresponding topography can be seen in Figure 1. 2


4 FIGURE 1 BUSHKILL CREEK WATERSHED (DIGITAL TOPO MAPS) The 3 rd Street Dam, owned by Lafayette College, is adjacent to the College s downtown arts campus. The surrounding area includes scattered woods, but primarily consists of paved streets and buildings. Lafayette s main campus sits on the hill above the Bushkill Creek and drains directly into the creek. Figure 2 shows the area directly upstream of the dam. FIGURE 2 LAND UPSTREAM OF 3RD STREET DAM 3


5 Figure 3 and Figure 4 show the dam under both baseflow and stormflow conditions, respectively. FIGURE 3 DAM UNDER BASEFLOW CONDITIONS (LYONS, C.) FIGURE 4 DAM UNDER STORMFLOW CONDITIONS (BRANDES, D.) 3. Methods Using HEC HMS, storm routing hydrographs were developed for the Bushkill Creek at the site of the 3 rd Street Dam. HEC HMS creates a basin model which consists of a system of interconnected sub basins, reaches, junctions and reservoirs (ACOE, 2001). This basin model was paired with meteorological data to simulate runoff for the 2 yr through 100 yr storms. 4
6 3.1 Sub basin Modeling ArcGIS was used in the preliminary stages of the project to develop inputs for the HEC HMS sub basin models. These inputs include curve number, time of concentration and area. To obtain these values, it was first necessary to divide the Bushkill Creek Watershed into subbasins. Based on smaller tributaries throughout the Bushkill Creek Watershed, eight sub basins were delineated. The sub basins and their given names are shown Figure 5 below. The Belfast, Forks, and Easton sub basins contain reaches of the Bushkill Creek, which were also critical for the HEC HMS model. The HEC HMS model basin containing both the sub basins and reaches are shown in Figure 6. FIGURE 5 SUB BASINS WITHIN THE BUSHKILL CREEK WATERSHED (NOT TO SCALE) 5
 and soil type (LVPC) were determined.")
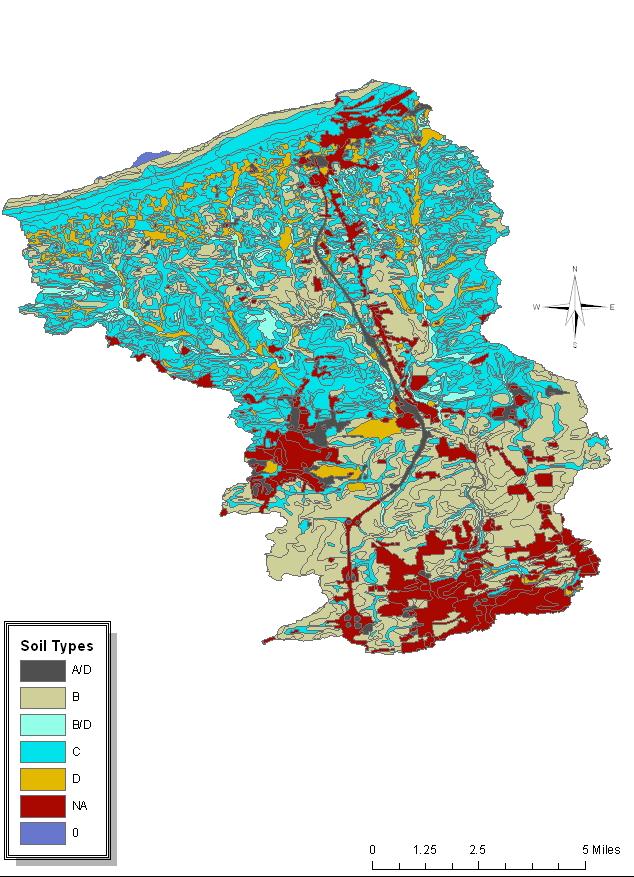
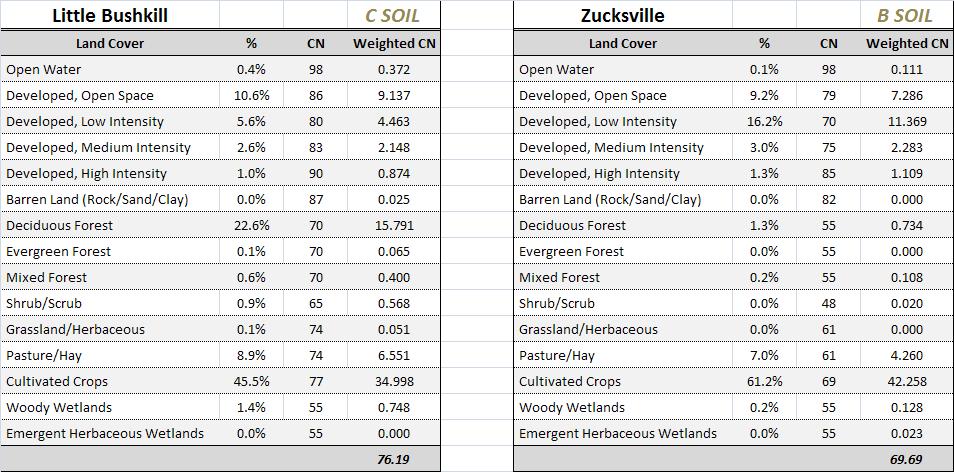
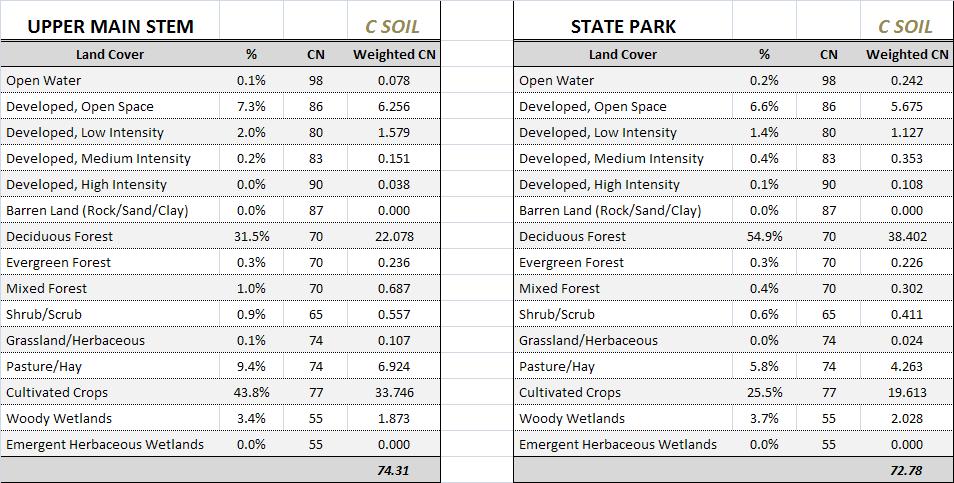
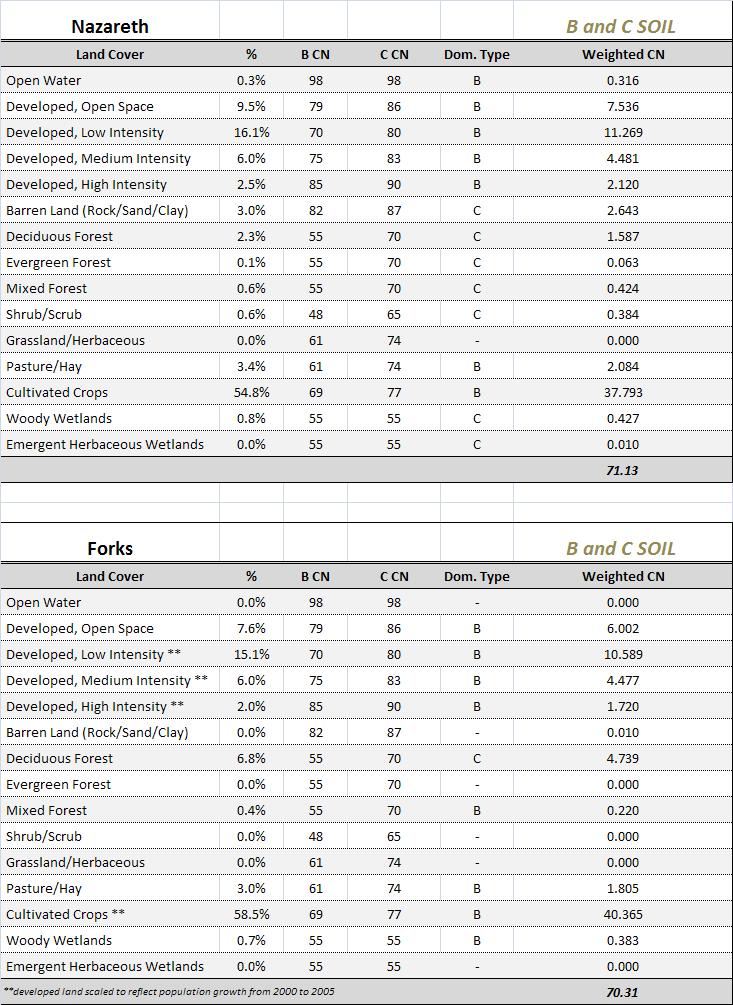
7 FIGURE 6 HEC HMS REPRESENTATION OF THE BUSHKILL CREEK WATERSHED NRCS Curve Numbers Runoff curve number (NRCS, 1986) depends on land cover and soil type. Within each sub basin, the corresponding land usage (LCI NLCD, 2001) and soil type (LVPC) were determined. In several cases, the specific land usage of a sub watershed was distributed over multiple soil classifications. The most dominant soil throughout the watershed was used to determine the inputs for the curve number calculations, except for Nazareth and Forks. For these watersheds, the percentages of B and C soils were almost equal, so it was necessary to distinguish the land 6
8 usage within each soil type and weight the corresponding inputs accordingly. The land use layer used was based off data from the year 2000 and did not account for population growth and development since that time. From population data for Bushkill municipalities, it was found that the only significant population growth had occurred in Forks Township, which had experienced a 52.7% growth in population from 2000 to In order to account for this, the developed area in the Forks sub watershed was increased by 52.7%. This area was subtracted from cultivated crops, Forks most prominent land cover. Using the NRCS TR 55 Curve Numbers, the relative curve number for each watershed was calculated. The assumptions and full curve number tables can be seen in Appendix A. The higher curve numbers reflect the amount of developed land in each watershed. Although some sub basins have less developed land, C type soils will typically produce larger curve numbers. The distribution of various land cover and soil types within the Bushkill Creek Watershed can also be seen in Appendix A. DISCUSS POPULATION GROWTH Time of Concentration The time of concentration is the time that is required for water falling on the most remote part of the watershed to reach the outlet point of the watershed. Time of concentration can be calculated using the SCS lag method (Mays, 2005) Where: L = length of watershed S = Y = slope of watershed It was necessary to determine the slope and length of each sub basin and reach to ultimately find the time of concentration. The lengths were determined by tracing polylines along flow channels in ArcGIS. Sub basin slopes were also determined using ArcGIS. Both of these measurements were based on a 10 m digital elevation model (DEM) (USGS, 2010). 7
9 The results of the time of concentration calculations can be found in Appendix B Baseflow The baseflow, an important input into the HEC HMS watershed model, was estimated using data from USGS stream gauges on three nearby rivers; Jordan Creek, Monocacy Creek and Little Lehigh Creek. Mean monthly baseflow data was found on the USGS website. First the flows were scaled to the Bushkill Creek watershed area. Then the three baseflows were weighted based on their watershed characteristics. The three watershed characteristics that influenced the weighting were: the percent carbonate bedrock, percent urban area and percent forested area. These characteristic values can be found in Appendix C. The percent urban area and percent forested area for the Bushkill Creek were calculated using the land use data in ArcGIS, while the percent carbonate bedrock was determined using geological data in ArcGIS. Both sets of data were from the Lehigh Valley Planning Commission. For each of the creeks, besides the Jordan Creek, the percent carbonate was the highest percentage out of the three relevant characteristics. A weight of 0.5 was given to the Little Lehigh Creek because its percent carbonate was closest to that of the Bushkill Creek, while a weight of 0.4 was given to the Monocacy Creek. Since the percent carbonate of the Jordan Creek was drastically different than the Bushkill Creek, a weighting of 0.1 was assigned. Using these weights and the scaled baseflows, a weighted average monthly baseflow was found. A table illustrating the weighting of each creek can be found in Appendix C, along with estimated monthly baseflow of the Bushkill Creek. 3.2 Reach Modeling The sub basins in the HEC HMS model are connected by a series of reaches. As the flow moves down a reach, the peak flow of the storm s hydrograph is reduced and delayed. The amount that the peak is diminished and delayed is called channel routing. The river reaches were 8
10 routed using the Muskingum method. This method requires a K value which is estimated by the travel time through the reach, K L/V. The velocity in the channel was estimated using Manning s equation: Where: V = velocity n = Manning s n value R h = the hydraulic radius S = the Slope in ft/ft Uniform flow was assumed for this equation. The Manning s n value was estimated at 0.04 for each reach (Mays, 2005). The Hydraulic Radius, R h, was estimated using Google Earth maps and assuming the river channel to be trapezoidal. The slopes of reaches were calculated using elevations from USGS topographical maps, as they were found to be more accurate than the DEM. A table of resulting K values can be found in Appendix D. The Muskingum method also requires a weighting factor x, which was given its typical value of Reservoir Modeling Stage Area Relationship The 3 rd Street Dam storage was modeled using the stage area relationship determined in AutoCAD from the survey results. The four largest upstream dams, Lions Park Dam, Crayola Dam, Rockwood Pigments and Easton Public Works Dam appeared to be of similar size to the 3 rd Street Dam, and since no stage storage and outflow data were available, the sizing data of 9


11 the 3 rd Street Dam was used throughout. The location of these dams can be seen below in Figure 7. FIGURE 7: LOCATION OF UPSTREAM DAMS Survey points surrounding the dam were found from the Bushkill Creek Survey Report, Nov 2010 ; contour lines from these points were created using AutoCAD Civil 3D to develop the stage area relationship. The contours can be seen below in Figure 8. FIGURE 8 CONTOURS OF FLOOD STAGES AT DAM LOCATION 10
12 The contours were drawn at every half foot. The elevation of the dam is 170 feet; thus, the areas from elevations of 170 ft to ft were considered. However, these areas did not represent the actual flood stage areas, because west of the dam, there are several islands that need to be included in the area calculations. If the water elevation was below the highest elevation of the islands, then the areas of the islands were subtracted from the contour areas. These flood stage areas were used in the HEC HMS model of the watershed s reservoir. The final flood stage area relationship can be found in Appendix E. After preliminary runs of the HEC HMS model, we found that it was necessary to delineate additional higher flood stage areas due to the water level rising higher than initially expected. Using the contours shape file from the LVPC GIS database, contours and flood stage areas at 185 ft, 190 ft, 195 ft, and 200 ft were added Dam Discharge Modeling An elevation discharge table was needed as the second input to HEC HMS reservoir model. Historically the dam had a raceway on the north side that is about 5 feet above the top of the dam. Today this raceway is filled in with concrete. Whenever the creek floods, water flows over the raceway and the slope further up the bank of the creek, which is covered in rip rap. The picture previously shown in Figure 3 was taken while standing on the raceway during baseflow conditions. Figure 4 shows water flowing over the raceway. In extreme floods, water may flow over the paved areas in the floodplain as well. A table showing the height of water over the dam (h) vs. flow over the dam (Q) was needed to properly model how water would exit the reservoir. As shown in Figure 9, the cross section of the dam was split into 4 sections: 11
13 FIGURE 9 3 RD STREET DAM CROSS SECTION Section 2, which is the dam itself, was treated as a weir using the equation, Where: Weir coefficient (C w ) = 4 h = height of water above the dam Length of the weir (L w ) = 52 feet Q C hl w 2/3 w The other sections were treated as open channels, so flow was determined using Manning s equation: 1.49 Q AR S n 2/3 1/2 h Where n = manning coefficient of roughness (weighted by percent wetted perimeter of a certain material) A = cross sectional area of flow (ft 2 ) R = A/P (hydraulic radius where P = wetted perimeter) S = slope (A value of ft/ft was used, which is the average slope of the lowest reach of creek) The flow from each section was summed to get the full flow for each elevation. The spreadsheets used to make these calculations can be found in Appendix F. 12

14 4. Results and Limitations 4.1 Results Table 1 summarizes the results from the HEC HMS model, while Appendix G includes hydrographs for the 2, 10, 25, 50, and 100 year storms with storage plots for each storm, along with an example of a raw output from HEC HMS. TABLE 1 HEC HMS MODEL PEAK FLOW RESULTS * *Level pond routing assumptions built into HEC HMS routing model are violated at highest flows due to negligible detention storage Our results show very little change in peak flows with removal of the dam. This leads to the conclusion that the dam does not provide enough storage to have a significant effect on the flooding. This finding is supported by the estimated storage volume calculation in Technical Release 55, Urban Hydrology for Small Watersheds. According to NRCS TR 55, the ratio of outflow to inflow of a detention basin (q o /q i ) is related to the ratio of storage volume to total runoff volume (V s /V r ) by the relationship shown in Figure
15 FIGURE 10 APPROXIMATE DETENTION BASIN ROUTING FOR RAINFALL TYPES I, IA, II AND III (NRCS, 1986) The actual ratio of storage volume to total runoff for the 3 rd Street Dam is for the 2 year return period. This ratio is so diminutive that it does not appear on the graph above. The smallest storage volume to runoff volume ratio to appear on the graph is 0.18 (for Type II storms as in the Lehigh Valley). Using the actual runoff volume generated by this watershed for the 2 year storm, the storage volume would have to be over 100 times higher (a value of 765 ac ft) to reach a value on the chart above. These calculations can be seen below for the 2 year design storm. : V V.18 : V ac ft : V 765 ac ft.. % These calculations support the findings that dam removal will have no significant effect on the peak discharge of the creek. 14
16 4.2 Limitations While our results show that the dam has negligible effect on the peak flows, some assumptions had to be made during our work. LVPC recently developed a HEC HMS model of the Bushkill Creek for 1990 land use data, which yielded lower peak flow values than what was predicted by our model. The difference between these values may be due to difference in CN values as the flows from our model are based on higher adjusted CN values. To determine the magnitude of this error, the HEC HMS model was adjusted to give the same output as the LVPC 2 year storm. This resulted in a ratio of storage volume to total runoff of , which is higher than the ratio of determined by our model, but is still much too low to result in a significant reduction in peak flows. Some assumptions were necessary to calculate the different curve numbers for the land use data. The curve numbers used were subjectively scaled to account for the provided GIS land use layer, which was later discovered to be out of date. The amount of development and impervious surface area within the watershed has changed significantly within the past twenty years. Channel widths, side slopes and depths were estimated based on aerial views provided by Google Earth. The side slopes and depths were assumed to be consistent throughout the entire creek. These estimates might have led to inaccurate K values. Also, the n values were based on basic knowledge of the Bushkill Creek and may not reflect the actual conditions. The properties of the other dams on the creek were assumed to be equal to those of the 3 rd Street Dam, because site specific data was not available. The stage discharge table for the 3 rd St. Dam may have had some inaccuracies in its modeling. Exact dimensions, slopes and materials were not available without more extensive field work, so some assumptions were made. 15
17 Never the less, none of these factors are likely to change the overall conclusions of the modeling, that the 3 rd St. Dam has a negligible impact on peak flows in the Bushkill Creek. 16
18 5. References Free Printable Topo Maps Instant Access to Topographic Maps. Web. 10 Dec < topo maps.com/>. LVPC (2009). Lehigh and Northampton Counties Digital Geographic Data Disc. (CD ROM), LVPC, Allentown, PA. Mays, Larry W. (2005). Water Resources Engineering, 1 st Ed., Wiley, New Jersey NRCS, (1986). Technical Release 55. Urban Hydrology for Small Watersheds, Washington D.C. The USGS Land Cover Institute (LCI). National Land Cover Dataset. 10 Dec < U.S. Geological Survey. Nazareth Quadrangle, Pennsylvania. 1:24, Minute Series. Washington D.C.: USGS, U.S. Geological Survey. Easton Quadrangle, Pennsylvania. 1:24, Minute Series. Washington D.C.: USGS, USGS (2010). Seamless Data Warehouse. USGS, < (Oct. 27, 2010). U.S. Geological Survey. Wind Gap Quadrangle, Pennsylvania. 1:24, Minute Series. Washington D.C.: USGS, US Army Corps of Engineers (ACOE) (2001). Hydrologic Modeling System HEC HMS, Version 2.1. Galaxy Runtime Components by Visix Software, Inc. 17

19 Appendix A Curve Number Inputs 18
20 19
21 20
22 21
23 22
24 Appendix B Time of Concentration Data TABLE B.1: TIME OF CONCENTRATION CALCULATIONS INPUTS Little Bushkill Zucksville Nazareth Belfast Forks Easton Upper Main Stem State Park Length (ft) Slope (deg) Slope (%) CN S T c (hr)
25 Appendix C Baseflow Calculations TABLE C.1: CREEK CHARACTERISTICS Little Lehigh Creek Jordan Creek Monocacy Creek Bushkill Creek Area (sq. mi) % Forested % Urban Area % Carbonate Weight TABLE C.2: AREA SCALED BASEFLOW BY MONTH LOCAL USGS GAGED STREAMS (ALL FLOWS IN CFS) Jan Feb Mar Apr May Jun Jul Aug Sept Oct Nov Dec Little Lehigh Jordan scaled Monocacy Scaled Average Weighted average
26 250 Monthly Baseflows 200 Baseflow (cfs) Month Little Lehigh Jordan scaled Monocacy Scaled Estimated Bushkill FIGURE C 1: BASEFLOWS BY MONTH 25
27 Appendix D K Calculations TABLE D.1: MUSKINGUM K VALUE CALCULATIONS Reach Length (ft) n Rh (ft) S V (ft/s) V (ft/hr) K (HR) n (sub reaches) TABLE D.2: REACH SLOPES Belfast Forks Easton Slope (%)

28 Appendix E Flood Stage Areas for 3 rd St. Dam TABLE F.1: FLOOD STAGE AREAS 27
29 APPENDIX G: HEC-HMS RESULTS Project: Bushkill Simulation Run: 2 year new dam Reservoir: 3rd Street Dam Start of Run: 21Nov2010, 00:00 Basin Model: Bushkill Creek End of Run: 24Nov2010, 00:00 Meteorologic Model: 2yrSCS Compute Time: 13Dec2010, 14:30:24 Control Specifications: 2yr Volume Units: IN Computed Results Peak Inflow : (CFS) Date/Time of Peak Inflow : 21Nov2010, 20:30 Peak Outflow : (CFS) Date/Time of Peak Outflow : 21Nov2010, 20:30 Total Inflow : 1.00 (IN) Peak Storage : 4.4 (AC FT) Total Outflow : 1.00 (IN) Peak Elevation : 6.1 (FT)
30 Reservoir "3rd Street Dam" Results for Run "2 year new dam" Storage (AC-FT) Elev (FT) 4,000 3,000 Flow (CFS) 2,000 1,000 00:00 12:00 00:00 12:00 00:00 12:00 00:00 21Nov Nov Nov2010 Run:2 year new dam Element:3RD STREET DAM Result:Storage Run:2 year new dam Element:3RD STREET DAM Result:Pool Elevation Run:2 year new dam Element:3RD STREET DAM Result:Outflow Run:2 year new dam Element:3RD STREET DAM Result:Combined Inflow
31 Reservoir "3rd Street Dam" Results for Run "10 year new dam" Storage (AC-FT) Elev (FT) 10,000 8,000 Flow (CFS) 6,000 4,000 2, :00 12:00 00:00 12:00 00:00 12:00 00:00 21Nov Nov Nov2010 Run:10 YEAR NEW DAM Element:3RD STREET DAM Result:Storage Run:10 YEAR NEW DAM Element:3RD STREET DAM Result:Pool Elevation Run:10 YEAR NEW DAM Element:3RD STREET DAM Result:Outflow Run:10 YEAR NEW DAM Element:3RD STREET DAM Result:Combined Inflow
32 Storage (AC-FT) Flow (CFS) ,000 12,000 10,000 8,000 6,000 4,000 2,000 Reservoir "3rd Street Dam" Results for Run "25 year new dam" 0 00:00 12:00 00:00 12:00 00:00 12:00 00:00 21Nov Nov Nov Elev (FT) Run:25 YEAR NEW DAM Element:3RD STREET DAM Result:Storage Run:25 YEAR NEW DAM Element:3RD STREET DAM Result:Pool Elevation Run:25 YEAR NEW DAM Element:3RD STREET DAM Result:Outflow Run:25 YEAR NEW DAM Element:3RD STREET DAM Result:Combined Inflow
33 Reservoir "3rd Street Dam" Results for Run "50 year new dam" Storage (AC-FT) Elev (FT) ,000 12,000 Flow (CFS) 8,000 4,000 00:00 12:00 00:00 12:00 00:00 12:00 00:00 21Nov Nov Nov2010 Run:50 YEAR NEW DAM Element:3RD STREET DAM Result:Storage Run:50 YEAR NEW DAM Element:3RD STREET DAM Result:Pool Elevation Run:50 YEAR NEW DAM Element:3RD STREET DAM Result:Outflow Run:50 YEAR NEW DAM Element:3RD STREET DAM Result:Combined Inflow
34 35 30 Reservoir "3rd Street Dam" Results for Run "100 year new dam" Storage (AC-FT) Elev (FT) ,000 15,000 Flow (CFS) 10,000 5, :00 12:00 00:00 12:00 00:00 12:00 00:00 21Nov Nov Nov2010 Run:100 YEAR NEW DAM Element:3RD STREET DAM Result:Storage Run:100 YEAR NEW DAM Element:3RD STREET DAM Result:Outflow Run:100 YEAR NEW DAM Element:3RD STREET DAM Result:Pool Elevation Run:100 YEAR NEW DAM Element:3RD STREET DAM Result:Combined Inflow
Section 4: Model Development and Application
 Section 4: Model Development and Application The hydrologic model for the Wissahickon Act 167 study was built using GIS layers of land use, hydrologic soil groups, terrain and orthophotography. Within
INFLOW DESIGN FLOOD CONTROL SYSTEM PLAN 40 C.F.R. PART PLANT YATES ASH POND 2 (AP-2) GEORGIA POWER COMPANY
 GEORGIA POWER COMPANY") INFLOW DESIGN FLOOD CONTROL SYSTEM PLAN 40 C.F.R. PART 257.82 PLANT YATES ASH POND 2 (AP-2) GEORGIA POWER COMPANY EPA s Disposal of Coal Combustion Residuals from Electric Utilities Final Rule (40 C.F.R.
INFLOW DESIGN FLOOD CONTROL SYSTEM PLAN 40 C.F.R. PART 257.82 PLANT YATES ASH POND 2 (AP-2) GEORGIA POWER COMPANY EPA s Disposal of Coal Combustion Residuals from Electric Utilities Final Rule (40 C.F.R.
Objectives: After completing this assignment, you should be able to:
 Data Analysis Assignment #1 Evaluating the effects of watershed land use on storm runoff Assignment due: 21 February 2013, 5 pm Objectives: After completing this assignment, you should be able to: 1) Calculate
HYDROLOGIC AND WATER RESOURCES EVALUATIONS FOR SG. LUI WATERSHED
 HYDROLOGIC AND WATER RESOURCES EVALUATIONS FOR SG. LUI WATERSHED 1.0 Introduction The Sg. Lui watershed is the upper part of Langat River Basin, in the state of Selangor which located approximately 20
ARTICLE 5 (PART 2) DETENTION VOLUME EXAMPLE PROBLEMS
 DETENTION VOLUME EXAMPLE PROBLEMS") ARTICLE 5 (PART 2) DETENTION VOLUME EXAMPLE PROBLEMS Example 5.7 Simple (Detention Nomograph) Example 5.8 Offsite and Unrestricted Areas (HEC-HMS) Example 5.9 Ponds in Series w/ Tailwater (HEC-HMS) Example
ARTICLE 5 (PART 2) DETENTION VOLUME EXAMPLE PROBLEMS Example 5.7 Simple (Detention Nomograph) Example 5.8 Offsite and Unrestricted Areas (HEC-HMS) Example 5.9 Ponds in Series w/ Tailwater (HEC-HMS) Example
INTRODUCTION TO HEC-HMS
 INTRODUCTION TO HEC-HMS Hydrologic Engineering Center- Hydrologic Modeling System US Army Corps of Engineers Hydrologic Engineering Center HEC-HMS Uses Schematics Enter properties: watershed, rivers (reaches),
Workshop: Build a Basic HEC-HMS Model from Scratch
 Workshop: Build a Basic HEC-HMS Model from Scratch This workshop is designed to help new users of HEC-HMS learn how to apply the software. Not all the capabilities in HEC-HMS are demonstrated in the workshop
REDWOOD VALLEY SUBAREA
 Independent Science Review Panel Conceptual Model of Watershed Hydrology, Surface Water and Groundwater Interactions and Stream Ecology for the Russian River Watershed Appendices A-1 APPENDIX A A-2 REDWOOD
9. PROBABLE MAXIMUM PRECIPITATION AND PROBABLE MAXIMUM FLOOD
 9. PROBABLE MAXIMUM PRECIPITATION AND PROBABLE MAXIMUM FLOOD 9.1. Introduction Due to the size of Watana Dam and the economic importance of the Project to the Railbelt, the Probable Maximum Flood (PMF)
A GIS-based Approach to Watershed Analysis in Texas Author: Allison Guettner
 Texas A&M University Zachry Department of Civil Engineering CVEN 658 Civil Engineering Applications of GIS Instructor: Dr. Francisco Olivera A GIS-based Approach to Watershed Analysis in Texas Author:
Advanced /Surface Hydrology Dr. Jagadish Torlapati Fall 2017 MODULE 2 - ROUTING METHODS
 Routing MODULE - ROUTING METHODS Routing is the process of find the distribution of flow rate and depth in space and time along a river or storm sewer. Routing is also called Flow routing or flood routing.
INTRODUCTION TO HYDROLOGIC MODELING USING HEC-HMS
 INTRODUCTION TO HYDROLOGIC MODELING USING HEC-HMS By Thomas T. Burke, Jr., PhD, PE Luke J. Sherry, PE, CFM Christopher B. Burke Engineering, Ltd. October 8, 2014 1 SEMINAR OUTLINE Overview of hydrologic
PENNSYLVANIA DEPARTMENT OF TRANSPORTATION ENGINEERING DISTRICT 3-0
 PENNSYLVANIA DEPARTMENT OF TRANSPORTATION ENGINEERING DISTRICT 3-0 LYCOMING COUNTY S.R.15, SECTION C41 FINAL HYDROLOGIC AND HYDRAULIC REPORT STEAM VALLEY RUN STREAM RELOCATION DATE: June, 2006 REVISED:
UPPER COSUMNES RIVER FLOOD MAPPING
 UPPER COSUMNES RIVER FLOOD MAPPING DRAFT BASIC DATA NARRATIVE FLOOD INSURANCE STUDY SACRAMENTO COUTY, CALIFORNIA Community No. 060262 November 2008 Prepared By: CIVIL ENGINEERING SOLUTIONS, INC. 1325 Howe
PRELIMINARY DRAFT FOR DISCUSSION PURPOSES
 Memorandum To: David Thompson From: John Haapala CC: Dan McDonald Bob Montgomery Date: February 24, 2003 File #: 1003551 Re: Lake Wenatchee Historic Water Levels, Operation Model, and Flood Operation This
George Mason University Department of Civil, Environmental and Infrastructure Engineering
 George Mason University Department of Civil, Environmental and Infrastructure Engineering Dr. Celso Ferreira Prepared by Lora Baumgartner December 2015 Revised by Brian Ross July 2016 Exercise Topic: Getting
STREUVER FIDELCO CAPPELLI, LLC YONKERS DOWNTOWN DEVELOPMENT PHASE 1. DRAFT ENVIRONMENTAL IMPACT STATEMENT For: PALISADES POINT
 STREUVER FIDELCO CAPPELLI, LLC YONKERS DOWNTOWN DEVELOPMENT PHASE 1 DRAFT ENVIRONMENTAL IMPACT STATEMENT For: PALISADES POINT Prepared by: PAULUS, SOKOLOWSKI & SARTOR STORMWATER MANAGEMENT 1. Methodology
LOCATED IN INDIAN RIVER COUNTY PREPARED FOR S.J.R.W.M.D. AND F.W.C.D. DECEMBER, 2003 Updated 2007 Updated May 2014 PREPARED BY
 FELLSMERE WATER CONTROL DISTRICT EAST MASTER DRAINAGE PLAN AND STORMWATER HYDROLOGIC ANALYSIS OF THE GRAVITY DRAINAGE SYSTEM LOCATED BETWEEN THE EAST BOUNDARY, LATERAL U, THE MAIN CANAL, AND DITCH 24 LOCATED
Chapter 10 - Sacramento Method Examples
 Chapter 10 Sacramento Method Examples Introduction Overview This chapter presents two example problems to demonstrate the use of the Sacramento method. These example problems use the SACPRE and HEC-1 computer
The effectiveness of the Natural Resource Conservation Service (NRCS) and Huff rainfall distribution methods for use in detention basin design
 and Huff rainfall distribution methods for use in detention basin design") Scholars' Mine Masters Theses Student Theses and Dissertations Spring 2010 The effectiveness of the Natural Resource Conservation Service (NRCS) and Huff rainfall distribution methods for use in detention
Scholars' Mine Masters Theses Student Theses and Dissertations Spring 2010 The effectiveness of the Natural Resource Conservation Service (NRCS) and Huff rainfall distribution methods for use in detention
Attachment B to Technical Memorandum No.2. Operations Plan of Ross Valley Detention Basins
 Attachment B to Technical Memorandum No.2 Operations Plan of Ross Valley Detention Basins Operations Plan of Ross Valley Detention Basins Stetson Engineers Inc. January 26, 2011 1.0 Introduction Achieving
Rucker Pond. Background
 Rucker Pond Background The Rucker Basin consists of two subbasins (East and West) that drain to a single area known as Rucker Pond. Both subbasins have the same hydraulic parameters, but have different
ISSN Vol.03,Issue.10 May-2014, Pages:
 www.semargroup.org, www.ijsetr.com ISSN 2319-8885 Vol.03,Issue.10 May-2014, Pages:2187-2191 YIN YIN HTWE 1, AYE AYE THANT 2 1 Dept of Civil Engineering, Mandalay Technological University, Mandalay, Myanmar,
REMOTE SENSING AND GEOSPATIAL APPLICATIONS FOR WATERSHED DELINEATION
 REMOTE SENSING AND GEOSPATIAL APPLICATIONS FOR WATERSHED DELINEATION Gaurav Savant (gaurav@engr.msstate.edu) Research Assistant, Department of Civil Engineering, Lei Wang (lw4@ra.msstate.edu) Research
Determination of Urban Runoff Using ILLUDAS and GIS
 Texas A&M University Department of Civil Engineering Instructor: Dr. Francisco Olivera CVEN689 Applications of GIS to Civil Engineering Determination of Urban Runoff Using ILLUDAS and GIS Tae Jin Kim 03.
YELLOWSTONE RIVER FLOOD STUDY REPORT TEXT
 YELLOWSTONE RIVER FLOOD STUDY REPORT TEXT TECHNICAL REPORT Prepared for: City of Livingston 411 East Callender Livingston, MT 59047 Prepared by: Clear Creek Hydrology, Inc. 1627 West Main Street, #294
Designing a Dam for Blockhouse Ranch. Haley Born
 Designing a Dam for Blockhouse Ranch Haley Born CE 394K GIS in Water Resources Term Paper Fall 2011 Table of Contents Introduction... 1 Data Sources... 2 Precipitation Data... 2 Elevation Data... 3 Geographic
FORECAST-BASED OPERATIONS AT FOLSOM DAM AND LAKE
 FORECAST-BASED OPERATIONS AT FOLSOM DAM AND LAKE 255 237 237 237 217 217 217 200 200 200 0 163 131 Bridging the Gap163Conference 255 0 132 255 0 163 122 The Dana on Mission Bay San Diego, CA January 28,
Notes: Space for as many as two segments per flow type can be used for each worksheet. Include a map, schematic, or description of flow segments.
 Worksheet 3: Time of Concentration (Tc) or travel time (Tt) Project By Date Location Checked Date Check one: Present Developed Check one: Tc Tt through subarea Notes: Space for as many as two segments
Stream Discharge and the Water Budget
 Regents Earth Science Unit 6: Water Cycle & Climate Name: Lab # Stream Discharge and the Water Budget Introduction: The United States Geological Survey (USGS) measures and publishes values for the daily
Chapter 5 CALIBRATION AND VERIFICATION
 Chapter 5 CALIBRATION AND VERIFICATION This chapter contains the calibration procedure and data used for the LSC existing conditions model. The goal of the calibration effort was to develop a hydraulic
NRC Workshop Probabilistic Flood Hazard Assessment (PFHA) Jan 29-31, Mel Schaefer Ph.D. P.E. MGS Engineering Consultants, Inc.
 Jan 29-31, Mel Schaefer Ph.D. P.E. MGS Engineering Consultants, Inc.") Stochastic Event Flood Model (SEFM) Stochastic Modeling of Extreme Floods A Hydrological Tool for Analysis of Extreme Floods Mel Schaefer Ph.D. P.E. MGS Engineering Consultants, Inc. Olympia, WA NRC Workshop
Stochastic Event Flood Model (SEFM) Stochastic Modeling of Extreme Floods A Hydrological Tool for Analysis of Extreme Floods Mel Schaefer Ph.D. P.E. MGS Engineering Consultants, Inc. Olympia, WA NRC Workshop
3.0 TECHNICAL FEASIBILITY
 3.0 TECHNICAL FEASIBILITY 3.1 INTRODUCTION To enable seasonal storage and release of water from Lake Wenatchee, an impoundment structure would need to be constructed on the lake outlet channel. The structure
******************* Project Description ******************* File Name... NAAF Stormwater Improvement Project 11_21_2014.SPF
 Autodesk Storm and Sanitary Analysis 2014 - Version 8.1.62 (Build 1) ----------------- *** Project Description *** File Name... NAAF Stormwater Improvement Project 11_21_2014.SPF Analysis Options Flow
THE PENNSYLVANIA STATE UNIVERSITY SCHREYER HONORS COLLEGE DEPARTMENT OF CIVIL AND ENVIRONMENTAL ENGINEERING. MATT BACHMAN Spring 2012
 THE PENNSYLVANIA STATE UNIVERSITY SCHREYER HONORS COLLEGE DEPARTMENT OF CIVIL AND ENVIRONMENTAL ENGINEERING IMPROVING FLOOD FORECASTING AND WATER CONTROL VIA HEC-HMS AND HEC-RAS CALIBRATION MATT BACHMAN
GRAPEVINE LAKE MODELING & WATERSHED CHARACTERISTICS
 GRAPEVINE LAKE MODELING & WATERSHED CHARACTERISTICS Photo Credit: Lake Grapevine Boat Ramps Nash Mock GIS in Water Resources Fall 2016 Table of Contents Figures and Tables... 2 Introduction... 3 Objectives...
A distributed runoff model for flood prediction in ungauged basins
 Predictions in Ungauged Basins: PUB Kick-off (Proceedings of the PUB Kick-off meeting held in Brasilia, 2 22 November 22). IAHS Publ. 39, 27. 267 A distributed runoff model for flood prediction in ungauged
TSEGI WASH 50% DESIGN REPORT
 TSEGI WASH 50% DESIGN REPORT 2/28/2014 Daniel Larson, Leticia Delgado, Jessica Carnes I Table of Contents Acknowledgements... IV 1.0 Project Description... 1 1.1 Purpose... 1 Figure 1. Erosion of a Headcut...
Lower Tuolumne River Accretion (La Grange to Modesto) Estimated daily flows ( ) for the Operations Model Don Pedro Project Relicensing
 Estimated daily flows ( ) for the Operations Model Don Pedro Project Relicensing") Lower Tuolumne River Accretion (La Grange to Modesto) Estimated daily flows (1970-2010) for the Operations Model Don Pedro Project Relicensing 1.0 Objective Using available data, develop a daily time series
Lower Tuolumne River Accretion (La Grange to Modesto) Estimated daily flows (1970-2010) for the Operations Model Don Pedro Project Relicensing 1.0 Objective Using available data, develop a daily time series
January 22, Coronado National Forest 300 West Congress Street Tucson, AZ Jim Upchurch, Forest Supervisor. Dear Mr.
 January 22, 2015 Coronado National Forest 300 West Congress Street Tucson, AZ 85701 Attn: Jim Upchurch, Forest Supervisor Dear Mr. Upchurch: In your letter dated January 16, 2015, you requested that Hudbay
Continuing Education Course #101 Drainage Design with WinTR-55
 1 of 5 Continuing Education Course #101 Drainage Design with WinTR-55 1. WinTR-55 uses the Kinematic Wave method for calculating storm runoff rates and volumes. 2. According to the Velocity Method, the
Illinois State Water Survey Division
 Illinois State Water Survey Division SURFACE WATER SECTION SWS Miscellaneous Publication 108 SEDIMENT YIELD AND ACCUMULATION IN THE LOWER CACHE RIVER by Misganaw Demissie Champaign, Illinois June 1989
Project Description. Project Options. End Analysis On... Apr 26, :00:00. Rainfall Details
 Project Description File Name... 323 - Att Pond 3 East PIPES ONLY.SPF Project Options Flow Units... Elevation Type... Hydrology Method... EPA SWMM Infiltration Method... Link Routing Method... Enable Overflow
StreamStats: Delivering Streamflow Information to the Public. By Kernell Ries
 StreamStats: Delivering Streamflow Information to the Public By Kernell Ries U.S. Department of the Interior U.S. Geological Survey MD-DE-DC District 410-238-4317 kries@usgs.gov StreamStats Web Application
GISHydro2000: A Tool for Automated Hydrologic Analysis in Maryland. G. E. Moglen 1
 GISHydro2000: A Tool for Automated Hydrologic Analysis in Maryland G. E. Moglen 1 1 Department of Civil and Environmental Engineering, University of Maryland, College Park, MD 20742; PH (301) 405-1964;
Hydrologic Modeling System HEC-HMS
 Hydrologic Engineering Center Hydrologic Modeling System HEC-HMS Quick Start Guide Version 3.3 September 2008 Approved for Public Release Distribution Unlimited CPD-74D REPORT DOCUMENTATION PAGE Form Approved
LOMR SUBMITTAL LOWER NEHALEM RIVER TILLAMOOK COUNTY, OREGON
 LOMR SUBMITTAL LOWER NEHALEM RIVER TILLAMOOK COUNTY, OREGON Prepared for: TILLAMOOK COUNTY DEPARTMENT OF COMMUNITY DEVELOPMENT 1510-B THIRD STREET TILLAMOOK, OR 97141 Prepared by: 10300 SW GREENBURG ROAD,
Modeling the Effects of Climate and Land Cover Change in the Stoney Brook Subbasin of the St. Louis River Watershed
 Modeling the Effects of Climate and Land Cover Change in the Stoney Brook Subbasin of the St. Louis River Watershed Joe Johnson and Jesse Pruette 214 NASA Research Internship Geospatial Technologies Program
APPENDIX B HYDROLOGY
 APPENDIX B HYDROLOGY TABLE OF CONTENTS 1.0 INTRODUCTION... 1 2.0 PROBABLE MAXIMUM PRECIPITATION (PMP)... 1 3.0 DESIGN FLOW CALCULATION... 1 4.0 DIVERSION CHANNEL SIZING... 2 5.0 REFERENCES... 4 LIST OF
Technical Memorandum No
 Pajaro River Watershed Study in association with Technical Memorandum No. 1.2.10 Task: Evaluation of Four Watershed Conditions - Sediment To: PRWFPA Staff Working Group Prepared by: Gregory Morris and
Development of the Hydrologic Model
 Kick-off meeting on enhancing hydrological data management and exchange procedures Water and Climate Adaptation Plan (WATCAP) for Sava River Basin Development of the Hydrologic Model David Heywood Team
PECKMAN RIVER BASIN, NEW JERSEY FLOOD RISK MANAGEMENT FEASIBILITY STUDY. Hydrology Appendix. New York District
 PECKMAN RIVER BASIN, NEW JERSEY FLOOD RISK MANAGEMENT FEASIBILITY STUDY Hydrology Appendix New York District May 2018 Table of Contents 1.0 OBJECTIVE OF STUDY... 1 2.0 WATERSHED DESCRIPTION... 1 3.0 PRIOR
FORM A GEOGRAPHY 1114 LABORATORY FINAL EXAM Teaching Assistant SAMPLE Lab Meeting. Place all answers on the answer sheet; 2 points per question
 FORM A GEOGRAPHY 1114 NAME LABORATORY FINAL EXAM Teaching Assistant SAMPLE Lab Meeting Place all answers on the answer sheet; 2 points per question FORMULAS PPT = (PET-D) + S ± = Δ SOIL G = V H Q = V A
DRAINAGE REPORT FOR THORNTON SELF STORAGE THORNTON, COLORADO
 DRAINAGE REPORT FOR THORNTON SELF STORAGE THORNTON, COLORADO Prepared by: Bowman Consulting 603 Park Point Dr. Suite 100 Golden, CO 80401 (303)-801-2900 June 29, 2015 Revised August 14, 2015 CERTIFICATE
CAUSES FOR CHANGE IN STREAM-CHANNEL MORPHOLOGY
 CAUSES FOR CHANGE IN STREAM-CHANNEL MORPHOLOGY Chad A. Whaley, Department of Earth Sciences, University of South Alabama, MobileAL, 36688. E-MAIL: caw408@jaguar1.usouthal.edu The ultimate goal of this
Changing Hydrology under a Changing Climate for a Coastal Plain Watershed
 Changing Hydrology under a Changing Climate for a Coastal Plain Watershed David Bosch USDA-ARS, Tifton, GA Jeff Arnold ARS Temple, TX and Peter Allen Baylor University, TX SEWRU Objectives 1. Project changes
Homework 10. Logan Dry Canyon Detention Basin Design Case Study Date: 4/14/14 Due: 4/25/14
 Homework 10. Logan Dry Canyon Detention Basin Design Case Study Date: 4/14/14 Due: 4/25/14 Section 1: Case Study Introduction This case study serves as an integrative problem based learning exercise. In
Stormwater Guidelines and Case Studies. CAHILL ASSOCIATES Environmental Consultants West Chester, PA (610)
") Stormwater Guidelines and Case Studies CAHILL ASSOCIATES Environmental Consultants West Chester, PA (610) 696-4150 www.thcahill.com Goals and Challenges for Manual State Stormwater Policy More Widespread
Stormwater Guidelines and Case Studies CAHILL ASSOCIATES Environmental Consultants West Chester, PA (610) 696-4150 www.thcahill.com Goals and Challenges for Manual State Stormwater Policy More Widespread
2015 Fall Conditions Report
 2015 Fall Conditions Report Prepared by: Hydrologic Forecast Centre Date: December 21 st, 2015 Table of Contents Table of Figures... ii EXECUTIVE SUMMARY... 1 BACKGROUND... 2 SUMMER AND FALL PRECIPITATION...
AN ASSESSMENT OF THE IMPACT OF RETENTION PONDS
 AN ASSESSMENT OF THE IMPACT OF RETENTION PONDS FOR SEDIMENT TRAPPING IN THE ADA CREEK AND LONGWOOD COVE USING REMOTELY SENSED DATA AND GIS ANALYSIS Sudhanshu Sekhar Panda Associate Professor, GIS/Env.
4. GIS Implementation of the TxDOT Hydrology Extensions
 4. GIS Implementation of the TxDOT Hydrology Extensions A Geographic Information System (GIS) is a computer-assisted system for the capture, storage, retrieval, analysis and display of spatial data. It
Appendix E Guidance for Shallow Flooding Analyses and Mapping
 Appendix E Guidance for Shallow Flooding Analyses and Mapping E.1 Introduction Different types of shallow flooding commonly occur throughout the United States. Types of flows that result in shallow flooding
Hydrogeology and Simulated Effects of Future Water Use and Drought in the North Fork Red River Alluvial Aquifer: Progress Report
 Hydrogeology and Simulated Effects of Future Water Use and Drought in the North Fork Red River Alluvial Aquifer: Progress Report Developed in partnership with the Oklahoma Water Resources Board S. Jerrod
Fenhe (Fen He) Map of River. Table of Basic Data. China 10
 Map of River. Table of Basic Data. China 10") Fenhe (Fen He) Map of River Table of Basic Data Name(s): Fenhe (in Huanghe River) Location: Shanxi Province, Northern China Area: 39,471 km 2 Origin: Mt. Guancen (2,147 m) Outlet: Huanghe Serial No. :
Fenhe (Fen He) Map of River Table of Basic Data Name(s): Fenhe (in Huanghe River) Location: Shanxi Province, Northern China Area: 39,471 km 2 Origin: Mt. Guancen (2,147 m) Outlet: Huanghe Serial No. :
LOMR SUBMITTAL LOWER NESTUCCA RIVER TILLAMOOK COUNTY, OREGON
 LOMR SUBMITTAL LOWER NESTUCCA RIVER TILLAMOOK COUNTY, OREGON Prepared for: TILLAMOOK COUNTY DEPARTMENT OF COMMUNITY DEVELOPMENT 1510-B THIRD STREET TILLAMOOK, OR 97141 Prepared by: 10300 SW GREENBURG ROAD,
Submitted to: St. Johns River Power Park New Berlin Road Jacksonville, FL 32226
 RUN-ON/RUN-OFF CONTROL SYSTEM PLAN RUN-ON AND RUN-OFF CONTROL SYSTEM PLAN St. Johns River Power Park Byproduct Storage Area B Phase I Development Submitted to: St. Johns River Power Park 11201 New Berlin
 Red River Flooding June 2015 Caddo and Bossier Parishes Presented by: Flood Technical Committee Where the Rain Falls Matters I-30 versus I-20 I-20 Backwater and Tributary Floods (Localized) 2016 Flood
Development and Land Use Change in the Central Potomac River Watershed. Rebecca Posa. GIS for Water Resources, Fall 2014 University of Texas
 Development and Land Use Change in the Central Potomac River Watershed Rebecca Posa GIS for Water Resources, Fall 2014 University of Texas December 5, 2014 Table of Contents I. Introduction and Motivation..4
Predictive Model of Rainfall-Runoff: A Case Study of the Sanaga Basin at Bamendjin Watershed in Cameroon
 Predictive Model of Rainfall-Runoff: A Case Study of the Sanaga Basin at Bamendjin Watershed in Cameroon Terence Kibula Lukong (Corresponding author) Hydrology Division, AES SONEL Douala, P.O. Box 433,
Study 16.5 Probable Maximum Flood (PMF)
") Initial Study Report Meeting Study 16.5 Probable Maximum Flood (PMF) October 22, 2014 Prepared by 10/22/2014 1 Study 16.5 Objectives Develop a site-specific PMP to be used for the derivation of the PMF
Initial Study Report Meeting Study 16.5 Probable Maximum Flood (PMF) October 22, 2014 Prepared by 10/22/2014 1 Study 16.5 Objectives Develop a site-specific PMP to be used for the derivation of the PMF
Study 16.5 Probable Maximum Flood (PMF)
") Initial Study Report Meeting Study 16.5 Probable Maximum Flood (PMF) March 30, 2016 Prepared by 3/30/2016 1 Study 16.5 Status ISR documents (ISR Part D Overview): Status: Initial Study Report: Parts A,
Initial Study Report Meeting Study 16.5 Probable Maximum Flood (PMF) March 30, 2016 Prepared by 3/30/2016 1 Study 16.5 Status ISR documents (ISR Part D Overview): Status: Initial Study Report: Parts A,
Near Real-Time Runoff Estimation Using Spatially Distributed Radar Rainfall Data. Jennifer Hadley 22 April 2003
 Near Real-Time Runoff Estimation Using Spatially Distributed Radar Rainfall Data Jennifer Hadley 22 April 2003 Introduction Water availability has become a major issue in Texas in the last several years,
Civil Engineering 394K: Topic 3 Geographic Information Systems (GIS) in Water Resources Engineering FALL 2014
 in Water Resources Engineering FALL 2014") Civil Engineering 394K: Topic 3 Geographic Information Systems (GIS) in Water Resources Engineering TERM PROJECT REPORT Reinvestigation of the Halloween Flood and Hydrologic Modeling of the Onion Creek
Civil Engineering 394K: Topic 3 Geographic Information Systems (GIS) in Water Resources Engineering TERM PROJECT REPORT Reinvestigation of the Halloween Flood and Hydrologic Modeling of the Onion Creek
MODULE 8 LECTURE NOTES 2 REMOTE SENSING APPLICATIONS IN RAINFALL-RUNOFF MODELLING
 MODULE 8 LECTURE NOTES 2 REMOTE SENSING APPLICATIONS IN RAINFALL-RUNOFF MODELLING 1. Introduction The most common application of the remote sensing techniques in the rainfall-runoff studies is the estimation
Hydrologic Modeling System HEC-HMS
 Hydrologic Engineering Center Hydrologic Modeling System HEC-HMS Quick Start Guide Version 3.5 August 2010 Approved for Public Release Distribution Unlimited CPD-74D REPORT DOCUMENTATION PAGE Form Approved
!"#$%&&'()*+#$%(,-./0*)%(!
*+#$%(,-./0*)%(!") 8:30 Sign in Hoosic River Revival Coalition!"#$%&&'()*+#$%(,-./0*)%(! 12-#30+4/#"5-(60 9:00 Welcome and Introductions 9:15 Goals for Today s Program: A Description of the Planning Process 9:30 First Session:
8:30 Sign in Hoosic River Revival Coalition!"#$%&&'()*+#$%(,-./0*)%(! 12-#30+4/#"5-(60 9:00 Welcome and Introductions 9:15 Goals for Today s Program: A Description of the Planning Process 9:30 First Session:
Valenciano Reservoir Safe Yield Study. Prepared by: CSA Architects & Engineers, LLP
 Valenciano Reservoir Safe Yield Study Prepared by: CSA Architects & Engineers, LLP CSA Group Prepared for: Puerto Rico Aqueduct and Sewer Authority Planning TABLE OF CONTENTS 1 Introduction...1 1.1 Safe
Field Observations and One-Dimensional Flow Modeling of Summit Creek in Mack Park, Smithfield, Utah
 Intermountain Center for River Rehabilitation and Restoration, Utah State University 31 July 2018 Field Observations and One-Dimensional Flow Modeling of Summit Creek in Mack Park, Smithfield, Utah I.
LESSON HEC-HMS
 LESSON 2.2 - HEC-HMS Introduction: TEAM 8 SCS method: The input data: Thiessen Polygons: Concentration Lag Time: SCS Method: Calculation of CN: Result figures: CONSTRUCTING HYDROGRAPH WITH HEC-HMS: Rainfall
This site will utilize an infiltration berm to manage the two-year/24-hour volume increase.
 Gates TETRA TECH, INC. By: RH Date: 1/30/2017 Subject: Gates Road Checked By: JB Date: 2/1/2017 PCSM Design and Evaluation PURPOSE: The purpose of these calculations is to design a Post-Construction Stormwater
Floodplain modeling. Ovidius University of Constanta (P4) Romania & Technological Educational Institute of Serres, Greece
 Romania & Technological Educational Institute of Serres, Greece") Floodplain modeling Ovidius University of Constanta (P4) Romania & Technological Educational Institute of Serres, Greece Scientific Staff: Dr Carmen Maftei, Professor, Civil Engineering Dept. Dr Konstantinos
Floodplain modeling Ovidius University of Constanta (P4) Romania & Technological Educational Institute of Serres, Greece Scientific Staff: Dr Carmen Maftei, Professor, Civil Engineering Dept. Dr Konstantinos
Hydrologic Modelling of the Upper Malaprabha Catchment using ArcView SWAT
 Hydrologic Modelling of the Upper Malaprabha Catchment using ArcView SWAT Technical briefs are short summaries of the models used in the project aimed at nontechnical readers. The aim of the PES India
Folsom Dam Water Control Manual Update Joint Federal Project, Folsom Dam
 Folsom Dam Water Control Manual Update Joint Federal Project, Folsom Dam Public Workshop May 25, 2016 Sacramento Library Galleria 828 I Street, Sacramento, CA US Army Corps of Engineers BUILDING STRONG
The 2 nd Annual Gobeshona Conference Future Changes of Flash Flood in the North East Region of Bangladesh using HEC-HMS Modeling
 The 2 nd Annual Gobeshona Conference 2016 Future Changes of Flash Flood in the North East Region of Bangladesh using HEC-HMS ing By- Shammi Haque 1*, Mutasim Billah 1, Afiya Narzis 2, A.K.M. Saiful Islam
This site will utilize an infiltration berm to manage the two-year/24-hour volume increase.
 High Street TETRA TECH, INC. By: RH Date: 1/30/2017 Subject: High Street Checked By: JB Date: 2/1/2017 PCSM Design and Evaluation PURPOSE: The purpose of these calculations is to design a Post-Construction
Hydrologic Conditions in the Delaware River Basin
 Hydrologic Conditions in the Delaware River Basin April : Flooding in Lambertville, New Jersey Aerial photo used with permission of www.elevated-images.com Annual Report Prepared by Operations Staff June
Watershed concepts for community environmental planning
 Purpose and Objectives Watershed concepts for community environmental planning Dale Bruns, Wilkes University USDA Rural GIS Consortium May 2007 Provide background on basic concepts in watershed, stream,
The Geometric and Hydraulic Simulation of Detention Dams by Integrating HEC-HMS and GIS (Case Study: Neka River Drainage Basin)
") Current World Environment Vol. 10(Special Issue 1), 842-851 (2015) The Geometric and Hydraulic Simulation of Detention Dams by Integrating HEC-HMS and GIS (Case Study: Neka River Drainage Basin) Arman
Current World Environment Vol. 10(Special Issue 1), 842-851 (2015) The Geometric and Hydraulic Simulation of Detention Dams by Integrating HEC-HMS and GIS (Case Study: Neka River Drainage Basin) Arman
MARMOT CREEK BASIN: MANAGING FORESTS FOR WATER
 MARMOT CREEK BASIN: MANAGING FORESTS FOR WATER CABIN AND TWIN CREEK EXPERIMENTS 1962-1987 MARMOT CREEK SUBBASINS Subbasin Drainage Treatment Area (ha) (completion date) Cabin Creek 212 (50%)* Commercial
URBAN WATERSHED RUNOFF MODELING USING GEOSPATIAL TECHNIQUES
 URBAN WATERSHED RUNOFF MODELING USING GEOSPATIAL TECHNIQUES DST Sponsored Research Project (NRDMS Division) By Prof. M. GOPAL NAIK Professor & Chairman, Board of Studies Email: mgnaikc@gmail.com Department
Pennypack Creek Watershed Act 167 Study
 Pennypack Creek Watershed Act 167 Study Progress Report December 17, 2009 Jeffrey Featherstone jeffrey.featherstone@temple.edu Mahbubur Meenar meenar@temple.edu Rick Fromuth richard.fromuth@temple.edu
Appendix C. Questionnaire Summary of Responses Geographic Information Systems
 Appendix C Questionnaire Summary of Responses Geographic Information Systems 1. Is your agency using or planning use of GIS for: a. general mapping (e.g. highway routes, political boundaries, etc.) b.
Modeling of a River Basin Using SWAT Model and SUFI-2
 Modeling of a River Basin Using SWAT Model and SUFI-2 NINA OMANI MASOUD TAJRISHY AHMAD ABRISHAMCHI Sharif University of Technology, Tehran, Iran Karkheh Dam, Iran 1 Area of Gharasu Sub-basin : 5793 km2
CE394k.3 - ArcGIS in Water Resources Term Project Update, Fall 2012
 CE394k.3 - ArcGIS in Water Resources Term Project Update, Fall 2012 Project Description: Prepared by Nick Brethorst October 29, 2012 ArcGIS Mapping of the Six Basins Watershed in, CA The Six Basins refers
Appendix D. Model Setup, Calibration, and Validation
 . Model Setup, Calibration, and Validation Lower Grand River Watershed TMDL January 1 1. Model Selection and Setup The Loading Simulation Program in C++ (LSPC) was selected to address the modeling needs
Rong Jiang. Map of River. Table of Basic Data. China 14. Serial No. : China-14
 Rong Jiang Map of River Table of Basic Data Name(s): Rong Jiang Location: Guangdong Province, Coastways China Area: 4,408 km 2 Serial No. : China-14 N 23 11' ~ 23 55' E 115 37' ~ 116 38' Length of the
STORMWATER REPORT FRITO LAY SUBDIVISION NO. 3
 STORMWATER REPORT FRITO LAY SUBDIVISION NO. 3 May 2018 STORMWATER REPORT I. Subdivision Data a. The parcel is adjacent to the existing Frito Lay property in Topeka; and the subject plat application encompasses
Lecture 14: Floods. Key Questions
 Lecture 14: Floods Key Questions 1. What is an upstream flood? 2. What is a downstream flood? 3. What were the setup conditions that cause floods? 4. What is a 100-year flood? 5. How are 100-year flood
July, International SWAT Conference & Workshops
 July, 212 212 International SWAT Conference & Workshops Hydrological Modelling of Kosi and Gandak Basins using SWAT Model S. Dutta, Pritam Biswas, Sangita Devi, Suresh A Karth and Bimlesh kumar, Ganga
Pompton Lakes Dam Downstream Effects of the Floodgate Facility. Joseph Ruggeri Brian Cahill Michael Mak Andy Bonner
 Pompton Lakes Dam Downstream Effects of the Joseph Ruggeri Brian Cahill Michael Mak Andy Bonner ASFPM 2013: Overview Page 2 Overview Page 3 Overview Page 4 Overview Page 5 Overview - Historical Pompton