Sampling in Concentrated Clusters
|
|
|
- Randell Oliver
- 5 years ago
- Views:
Transcription
1 Sampling in Concentrated Clusters A Study of Informal SMEs in Uganda Bilal Zia (DECRG)
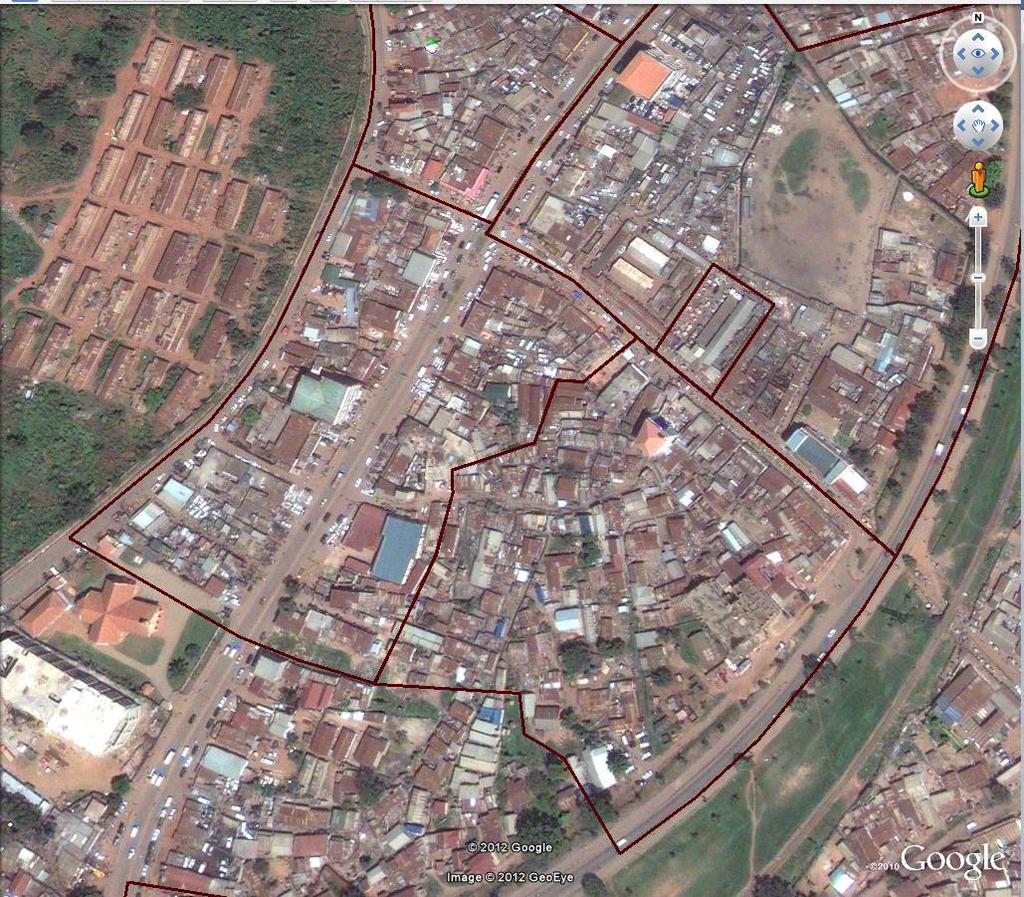
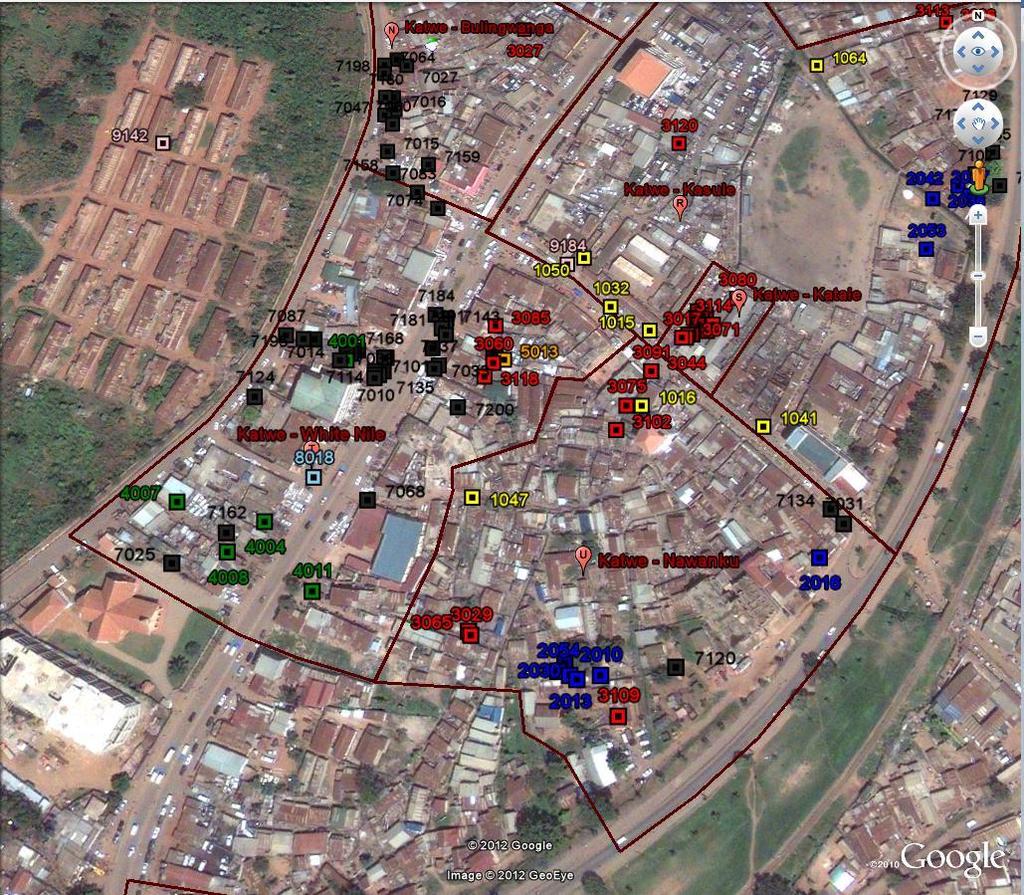
2 Context We are evaluating technical and business training for informal small scale enterprises in Uganda These SMEs operate in concentrated industrial pockets in the outskirts of Kampala Fairly diverse occupations 9 separate industry types covered Sampling frame is all SMEs that are part of the Katwe Small Scale Industries Association (KASSIDA)
3 Distribution of Sample Prop. Of Sample Sector 1: Barbershop/Hair Salon Sector 2: Carpentry Sector 3: Catering Sector 4: Fitting and machinery Sector 5: Electricals Sector 6: Foundry and forgery Sector 7: Metal fabrication Sector 8: Shoe making and repair Sector 9: Tailoring and knitting 0.263
4 Evaluation 101 Quick Review Important to establish a counterfactual group in order to assess impact We are implementing randomized evaluation where treatment of training is randomly assigned Hence, by design treatment status is not correlated with any socioeconomic/demographic/business factors
5 What is the Unit of Randomization? All else equal, we want to randomize at the lowest level possible i.e. individual level. This maximizes power and reduces required sample size. Satisfies small budgets. Can we do this here?
6 What is the Unit of Randomization? All else equal, we want to randomize at the lowest level possible i.e. individual level. This maximizes power and reduces required sample size. Satisfies small budgets. Can we do this here? What is the potential problem?
7 Randomize This!

8 What a Cluster!!
9
10
11 Spillovers Sampling/Evaluation Challenge: How to disentangle effects of training from peer learning? Clearly we have to move away from individual randomization to Group level randomization But how to form groups?
12 Spillovers Sampling/Evaluation Challenge: How to disentangle effects of training from peer learning? Clearly we have to move away from individual randomization to Group level randomization But how to form groups?
13 Spillovers Sampling/Evaluation Challenge: How to disentangle effects of training from peer learning? Clearly we have to move away from individual randomization to Group level randomization But how to form groups?
14 Spillovers Sampling/Evaluation Challenge: How to disentangle effects of training from peer learning? Clearly we have to move away from individual randomization to Group level randomization But how to form groups?
15 Making Sense of Clusters Clustering of firms to avoid immediate spillovers due to physical proximity How to form clusters? Lump firms together by sector Within sector, use qualitative methods to understand range of information sharing (e.g. sharing tools, workers, business knowledge) Intra-cluster correlation for outcomes we care about likely v. high After extensive qualitative work: 20m rule + Major road rule In the end we have 228 clusters across 9 sectors Randomization at cluster level
16 Making Sense of Clusters Clustering of firms to avoid immediate spillovers due to physical proximity How to form clusters? Lump firms together by sector Within sector, use qualitative methods to understand range of information sharing (e.g. sharing tools, workers, business knowledge) Intra-cluster correlation for outcomes we care about likely v. high After extensive qualitative work: 20m rule + Major road rule In the end we have 228 clusters across 9 sectors Randomization at cluster level
17 Making Sense of Clusters Clustering of firms to avoid immediate spillovers due to physical proximity How to form clusters? Lump firms together by sector Within sector, use qualitative methods to understand range of information sharing (e.g. sharing tools, workers, business knowledge) Intra-cluster correlation for outcomes we care about likely v. high After extensive qualitative work: 20m rule + Major road rule In the end we have 228 clusters across 9 sectors Randomization at cluster level
18 Making Sense of Clusters Clustering of firms to avoid immediate spillovers due to physical proximity How to form clusters? Lump firms together by sector Within sector, use qualitative methods to understand range of information sharing (e.g. sharing tools, workers, business knowledge) Intra-cluster correlation for outcomes we care about likely v. high After extensive qualitative work: 20m rule + Major road rule In the end we have 228 clusters across 9 sectors Randomization at cluster level
19 Making Sense of Clusters Clustering of firms to avoid immediate spillovers due to physical proximity How to form clusters? Lump firms together by sector Within sector, use qualitative methods to understand range of information sharing (e.g. sharing tools, workers, business knowledge) Intra-cluster correlation for outcomes we care about likely v. high After extensive qualitative work: 20m rule + Major road rule In the end we have 228 clusters across 9 sectors Randomization at cluster level
20 Making Sense of Clusters Clustering of firms to avoid immediate spillovers due to physical proximity How to form clusters? Lump firms together by sector Within sector, use qualitative methods to understand range of information sharing (e.g. sharing tools, workers, business knowledge) Intra-cluster correlation for outcomes we care about likely v. high After extensive qualitative work: 20m rule + Major road rule In the end we have 228 clusters across 9 sectors Randomization at cluster level
21
22
23 Summary Physical proximity often makes individual data less unique If we care about precise treatment effects, then we have to move to higher level of analysis In our case, this was done by forming clusters based on physical proximity and conducting analysis at cluster level As an aside, note that networks do not necessarily depend on physical proximity alone and we are studying that explicitly.
Chapter 9 - Key Issues 1 & 2: Why does development vary among countries? Why does development vary by gender? p
 Chapter 9 - Key Issues 1 & 2: Why does development vary among countries? Why does development vary by gender? p. 301-313 Enduring Understanding B. Measures of development are used to understand patterns
Practical sampling. Aidan Coville Development Impact Evaluation (DIME), World Bank
, World Bank") Practical sampling Aidan Coville Development Impact Evaluation (DIME), World Bank IE Target for Growth Impact Evaluation Workshop Mexico City, 1 March 2017 *This presentation draws from work from Laura
Practical sampling Aidan Coville Development Impact Evaluation (DIME), World Bank IE Target for Growth Impact Evaluation Workshop Mexico City, 1 March 2017 *This presentation draws from work from Laura
CHAPTER 4 AGGLOMERATION ECONOMIES., (Werner Hirsch)
") CHAPTER 4 AGGLOMERATION ECONOMIES The city is the place where everything affects everything else., (Werner Hirsch) 4.1 INTRODUCTION The purpose of this chapter is to analyse the operation and structure
CHAPTER 4 AGGLOMERATION ECONOMIES The city is the place where everything affects everything else., (Werner Hirsch) 4.1 INTRODUCTION The purpose of this chapter is to analyse the operation and structure
Sampling : Error and bias
 Sampling : Error and bias Sampling definitions Sampling universe Sampling frame Sampling unit Basic sampling unit or elementary unit Sampling fraction Respondent Survey subject Unit of analysis Sampling
Non-Inferiority Tests for the Ratio of Two Proportions in a Cluster- Randomized Design
 Chapter 236 Non-Inferiority Tests for the Ratio of Two Proportions in a Cluster- Randomized Design Introduction This module provides power analysis and sample size calculation for non-inferiority tests
Modeling firms locational choice
 Modeling firms locational choice Giulio Bottazzi DIMETIC School Pécs, 05 July 2010 Agglomeration derive from some form of externality. Drivers of agglomeration can be of two types: pecuniary and non-pecuniary.
Location Patterns of Manufacturing Industries in Tunisia
 Location Patterns of Manufacturing Industries in Tunisia Wided Mattoussi WIDER development conference: Think development Think WIDER Parallel session Made in Africa Motivation Firms enjoy positive externalities
BeMInE Jyväskylä University School of Business and Economics
 BeMInE Jyväskylä University School of Business and Economics 26.10.2016 Hannu Tervo Timo Tohmo Mika Haapanen Esa Storhammar Jutta Viinikainen Olle Westerlund (Umeå University 1 Urban growth processes and
Planning for Economic and Job Growth
 Planning for Economic and Job Growth Mayors Innovation Project Winter 2012 Meeting January 21, 2012 Mary Kay Leonard Initiative for a Competitive Inner City AGENDA The Evolving Model for Urban Economic
Review of Lectures 1, 2 and 3
 Physics 22000 General Physics Lecture 5 Applying Newton s Laws Fall 2016 Semester Prof. Matthew Jones 1 Review of Lectures 1, 2 and 3 Algebraic description of linear motion with constant acceleration:
A4. Methodology Annex: Sampling Design (2008) Methodology Annex: Sampling design 1
 Methodology Annex: Sampling design 1") A4. Methodology Annex: Sampling Design (2008) Methodology Annex: Sampling design 1 Introduction The evaluation strategy for the One Million Initiative is based on a panel survey. In a programme such as
A4. Methodology Annex: Sampling Design (2008) Methodology Annex: Sampling design 1 Introduction The evaluation strategy for the One Million Initiative is based on a panel survey. In a programme such as
Entrepreneurship on islands and other peripheral regions. Specific Contract No 6511 implementing Framework contract No CDR/DE/16/2015/
 Entrepreneurship on islands and other peripheral regions Specific Contract No 6511 implementing Framework contract No CDR/DE/16/2015/ Aims of this study: To analyse the particular challenges and obstacles
Difference in regional productivity and unbalance in regional growth
 Difference in regional productivity and unbalance in regional growth Nino Javakhishvili-Larsen and Jie Zhang - CRT, Denmark, Presentation at 26 th International input-output conference in Brazil Aim of
Tools for Regional Economic Development: Regional I/O Models & Cluster Identification
 Tools for Regional Economic Development: Regional I/O Models & Cluster Identification Brian Richard, PhD Center for Governmental Studies Northern Illinois University brichard@niu.edu Outline Comparison
CEPA Working Paper No
 CEPA Working Paper No. 15-06 Identification based on Difference-in-Differences Approaches with Multiple Treatments AUTHORS Hans Fricke Stanford University ABSTRACT This paper discusses identification based
Use of GIS in road sector analysis
 Use of GIS in road sector analysis Uwe Deichmann, DECRG March 30, 2007 Transport Forum and Learning Week 2007 Transport Measurement Matters Indicators of Performance and Impact Geographic information Using
Game Theory and Algorithms Lecture 2: Nash Equilibria and Examples
 Game Theory and Algorithms Lecture 2: Nash Equilibria and Examples February 24, 2011 Summary: We introduce the Nash Equilibrium: an outcome (action profile) which is stable in the sense that no player
Location theory and clusters. Dr. Hans Koster Assistant professor
 Dr. Hans Koster Assistant professor 1 Internal economies of scale (EofS) can lead to Trading cities (EofS in transport) Factory cities (EofS in production) But where do cities emerge? Why is Colombo located
Sampling and Sample Size. Shawn Cole Harvard Business School
 Sampling and Sample Size Shawn Cole Harvard Business School Calculating Sample Size Effect Size Power Significance Level Variance ICC EffectSize 2 ( ) 1 σ = t( 1 κ ) + tα * * 1+ ρ( m 1) P N ( 1 P) Proportion
IDE Research Bulletin
 http://www.ide.go.jp IDE Research Bulletin Research Summary based on papers prepared for publication in academic journals with the aim of contributing to the academia Empirical studies on industrial clusters
Geospatial Science and Technology Model Courses and Certificate:
 Geospatial Science and Technology Model Courses and Certificate: Guidelines and Tools to Align Curriculum to Workforce Needs Ann Johnson Associate Director gisajohnson@delmar.edu Funded by National Science
Module 9: Sampling IPDET. Sampling. Intro Concepts Types Confidence/ Precision? How Large? Intervention or Policy. Evaluation Questions
 IPDET Module 9: Sampling Sampling Intervention or Policy Evaluation Questions Design Approaches Data Collection Intro Concepts Types Confidence/ Precision? How Large? Introduction Introduction to Sampling
Econometric analysis of models with social interactions
 Brendan Kline (UT-Austin, Econ) and Elie Tamer (Harvard, Econ) 2017 - Please see the paper for more details, citations, etc. The setting Social interactions or peer effects, or spillovers, or...: My outcome/choice
A User s Guide to the Federal Statistical Research Data Centers
 A User s Guide to the Federal Statistical Research Data Centers Mark Roberts Professor of Economics and Director PSU FSRDC September 2016 M. Roberts () RDC User s Guide September 2016 1 / 14 Outline Introduction
Zanesville Campus Programs. Career Coloring Book
 Zanesville Campus Programs Career Coloring Book The Applied Engineering & Machining Program offers students the chance to learn manual and CNC machining skills in a state-of-the-art facility. The Auto
Ludwig Maximilians Universität München 15 th January, International R&D Competition, Spillovers and Firms Economic Performance
 INNO-tec Workshop Ludwig Maximilians Universität München 15 th January, 2004 International R&D Competition, Spillovers and Firms Economic Performance Prof. Dr. Michele Cincera Université Libre de Bruxelles
The World Bank Senegal Tourism and Enterprise Development Project (P146469)
") Public Disclosure Authorized AFRICA Senegal Trade & Competitiveness Global Practice IBRD/IDA Investment Project Financing FY 2017 Seq No: 1 ARCHIVED on 03-Nov-2017 ISR29333 Implementing Agencies: Republic
Public Disclosure Authorized AFRICA Senegal Trade & Competitiveness Global Practice IBRD/IDA Investment Project Financing FY 2017 Seq No: 1 ARCHIVED on 03-Nov-2017 ISR29333 Implementing Agencies: Republic
The Role of Transitways in Our Region s Economic Competitiveness. The 23rd CTS Annual Research Conference St. Paul, MN May 23, 2012
 The Role of Transitways in Our Region s Economic Competitiveness The 23rd CTS Annual Research Conference St. Paul, MN May 23, 2012 1 2 Twin Cities Competitive Clusters 3 Competitive Clusters interconnected
Lecture 9: Location Effects, Economic Geography and Regional Policy
 Lecture 9: Location Effects, Economic Geography and Regional Policy G. Di Bartolomeo Index, EU-25 = 100 < 30 30-50 50-75 75-100 100-125 >= 125 Canarias (E) Guadeloupe Martinique RÈunion (F) (F) (F) Guyane
June Further Evidence on the Contribution of Services Outsourcing to the Decline in Manufacturing s Employment Share in Canada
 June 2016 1 151 Slater Street, Suite 710 Ottawa, Ontario K1P 5H3 (613) 233-8891 info@csls.ca CENTRE FOR THE STUDY OF LIVING STANDARDS Further Evidence on the Contribution of Services Outsourcing to the
E S T 2005 METRO BAR & BISTRO P E R T H AUSTRALIA
 E S T 2005 METRO BAR & BISTRO 3 3 MOUNTS BAY RD P E R T H AUSTRALIA 6000 + 6 1 8 9485 1218 I N F O@METROBARANDBISTRO.COM.AU W W W.METROBARANDBISTRO.COM.AU F A C E B O O K. C O M / M E T R O B A R A N D
Growth Curve Modeling Approach to Moderated Mediation for Longitudinal Data
 Growth Curve Modeling Approach to Moderated Mediation for Longitudinal Data JeeWon Cheong Department of Health Education & Behavior University of Florida This research was supported in part by NIH grants
Apéndice 1: Figuras y Tablas del Marco Teórico
 Apéndice 1: Figuras y Tablas del Marco Teórico FIGURA A.1.1 Manufacture poles and manufacture regions Poles: Share of employment in manufacture at least 12% and population of 250,000 or more. Regions:
Methodological issues in the development of accessibility measures to services: challenges and possible solutions in the Canadian context
 Methodological issues in the development of accessibility measures to services: challenges and possible solutions in the Canadian context Alessandro Alasia 1, Frédéric Bédard 2, and Julie Bélanger 1 (1)
The World Bank Competitiveness and Enterprise Development Project (CEDP) (P130471)
 (P130471)") Public Disclosure Authorized AFRICA Uganda Trade & Competitiveness Global Practice IBRD/IDA Specific Investment Loan FY 2013 Seq No: 9 ARCHIVED on 22-Aug-2017 ISR26931 Implementing Agencies: Government
Public Disclosure Authorized AFRICA Uganda Trade & Competitiveness Global Practice IBRD/IDA Specific Investment Loan FY 2013 Seq No: 9 ARCHIVED on 22-Aug-2017 ISR26931 Implementing Agencies: Government
3. When a researcher wants to identify particular types of cases for in-depth investigation; purpose less to generalize to larger population than to g
 Chapter 7: Qualitative and Quantitative Sampling Introduction Quantitative researchers more concerned with sampling; primary goal to get a representative sample (smaller set of cases a researcher selects
Uganda - National Panel Survey
 Microdata Library Uganda - National Panel Survey 2013-2014 Uganda Bureau of Statistics - Government of Uganda Report generated on: June 7, 2017 Visit our data catalog at: http://microdata.worldbank.org
MODULE 4 1 of 7. C. macro-economics - aggregate indicators of international, national, or regional economic performance and their interrelationships.
 MODULE 4 1 of 7 SPATIAL ECONOMICS: URBANIZATION AND DEVELOPMENT I. Space in economics II. Historical context: urbanization, innovation, and development III. Micro-economics perspective: - internal structure
OCCUPANT BEHAVIOR OF WINDOW OPENING AND CLOSING IN OFFICE BUILDINGS: DATA MINING APPROACHES. Simona D Oca. December 8 th, Washington DC
 OCCUPANT BEHAVIOR OF WINDOW OPENING AND CLOSING IN OFFICE BUILDINGS: DATA MINING APPROACHES December 8 th, Washington DC T H E C R E D I B I L I T Y G A P O F B U I L D I N G E N E R G Y C O N S U M P
METRO BAR & BISTRO CHRISTMAS 2018
 E S T 2005 METRO BAR & BISTRO CHRISTMAS 2018 3 3 MOUNTS BAY RD P E R T H AUSTRALIA 6000 + 6 1 8 9485 1218 I N F O@METROBARANDBISTRO.COM.AU W W W.METROBARANDBISTRO.COM.AU F A C E B O O K. C O M / M E T
Applied Statistics in Business & Economics, 5 th edition
 A PowerPoint Presentation Package to Accompany Applied Statistics in Business & Economics, 5 th edition David P. Doane and Lori E. Seward Prepared by Lloyd R. Jaisingh McGraw-Hill/Irwin Copyright 2015
CHARTING SPATIAL BUSINESS TRANSFORMATION
 CHARTING SPATIAL BUSINESS TRANSFORMATION An in-depth look at the business patterns of GIS and location intelligence adoption in the private sector EXECUTIVE SUMMARY The global use of geographic information
TERMS OF REFERENCE CONSULTANCY TO DEVELOP CLIMATE PRODUCTS AND SERVICES FOR THE CARIBBEAN TOURISM INDUSTRY (FEASIBILITY STUDY)
") Appendix 2 TERMS OF REFERENCE CONSULTANCY TO DEVELOP CLIMATE PRODUCTS AND SERVICES FOR THE CARIBBEAN TOURISM INDUSTRY (FEASIBILITY STUDY) 1. BACKGROUND 1.01 The Caribbean tourism product depends largely
Appendix 2 TERMS OF REFERENCE CONSULTANCY TO DEVELOP CLIMATE PRODUCTS AND SERVICES FOR THE CARIBBEAN TOURISM INDUSTRY (FEASIBILITY STUDY) 1. BACKGROUND 1.01 The Caribbean tourism product depends largely
2014 SM4 Revision Questions Distributions
 2014 SM4 Revision Questions Distributions Normal Q1. Professor Halen has 184 students in his college mathematics class. The scores on the semester exam are normally distributed with a mean of 72.3 and
Gene Network Science Diagrammatic Cell Language and Visual Cell
 Gene Network Science Diagrammatic Cell Language and Visual Cell Mr. Tan Chee Meng Scientific Programmer, System Biology Group, Bioinformatics Institute Overview Introduction Why? Challenges Diagrammatic
More on Roy Model of Self-Selection
 V. J. Hotz Rev. May 26, 2007 More on Roy Model of Self-Selection Results drawn on Heckman and Sedlacek JPE, 1985 and Heckman and Honoré, Econometrica, 1986. Two-sector model in which: Agents are income
Functional territories in a eastern Norway and western Sweden perspective Armagh 16. November
 Functional territories in a eastern Norway and western Sweden perspective Armagh 16. November Dr. Bjørnar Sæther Professor in Human Geography Eastern Norway Research Institute (ENRI) University of Oslo
Econometric Causality
 Econometric (2008) International Statistical Review, 76(1):1-27 James J. Heckman Spencer/INET Conference University of Chicago Econometric The econometric approach to causality develops explicit models
Chapter 3 Probability Distribution
 Chapter 3 Probability Distribution Probability Distributions A probability function is a function which assigns probabilities to the values of a random variable. Individual probability values may be denoted
Advanced Techniques for Mining Structured Data: Process Mining
 Advanced Techniques for Mining Structured Data: Process Mining Frequent Pattern Discovery /Event Forecasting Dr A. Appice Scuola di Dottorato in Informatica e Matematica XXXII Problem definition 1. Given
The World Bank Competitiveness and Enterprise Development Project (CEDP) (P130471)
 (P130471)") Public Disclosure Authorized AFRICA Uganda Trade & Competitiveness Global Practice IBRD/IDA Specific Investment Loan FY 2013 Seq No: 10 ARCHIVED on 29-Sep-2017 ISR29438 Implementing Agencies: Government
Public Disclosure Authorized AFRICA Uganda Trade & Competitiveness Global Practice IBRD/IDA Specific Investment Loan FY 2013 Seq No: 10 ARCHIVED on 29-Sep-2017 ISR29438 Implementing Agencies: Government
Cultural Data in Planning and Economic Development. Chris Dwyer, RMC Research Sponsor: Rockefeller Foundation
 Cultural Data in Planning and Economic Development Chris Dwyer, RMC Research Sponsor: Rockefeller Foundation A Decade of Attempts to Quantify Arts and Culture Economic impact studies Community indicators
A spatial scan statistic for multinomial data
 A spatial scan statistic for multinomial data Inkyung Jung 1,, Martin Kulldorff 2 and Otukei John Richard 3 1 Department of Epidemiology and Biostatistics University of Texas Health Science Center at San
Introduction to causal identification. Nidhiya Menon IGC Summer School, New Delhi, July 2015
 Introduction to causal identification Nidhiya Menon IGC Summer School, New Delhi, July 2015 Outline 1. Micro-empirical methods 2. Rubin causal model 3. More on Instrumental Variables (IV) Estimating causal
Introduction to Boosting and Joint Boosting
 Introduction to Boosting and Learning Systems Group, Caltech 2005/04/26, Presentation in EE150 Boosting and Outline Introduction to Boosting 1 Introduction to Boosting Intuition of Boosting Adaptive Boosting
Making space for a more foundational construction sector in Brussels
 Making space for a more foundational construction sector in Brussels Sarah De Boeck, David Bassens & Michael Ryckewaert Social innovation in the Foundational Economy Cardiff, 5 th of September 2018 1.
Challenges and Successes in Sharing Geospatial Data in Africa
 Challenges and Successes in Sharing Geospatial Data in Africa 2018 GeoNode Summit Torino, Italy March 26-28, 2018 Bernard Justus Muhwezi Manager, Geo-Information Services Uganda Bureau of Statistics, Kampala,
Commercialisation. Lessons learned from Dutch weather market
 Commercialisation Lessons learned from Dutch weather market Where information comes together weather traffic public transport Weather, traffic and public transport. Daily actual information that influences
An Alternative to the Global City?
 DIETER LÄPPLE HafenCity University Hamburg Institute for Urban and Regional Economics The German Metropolitan System - An Alternative to the Global City? BERLIN AN URBAN EXPERIMENT? Berlin, 10. und 11.
Review of Panel Data Model Types Next Steps. Panel GLMs. Department of Political Science and Government Aarhus University.
 Panel GLMs Department of Political Science and Government Aarhus University May 12, 2015 1 Review of Panel Data 2 Model Types 3 Review and Looking Forward 1 Review of Panel Data 2 Model Types 3 Review
Empirical approaches in public economics
 Empirical approaches in public economics ECON4624 Empirical Public Economics Fall 2016 Gaute Torsvik Outline for today The canonical problem Basic concepts of causal inference Randomized experiments Non-experimental
Agglomeration Externalities and Growth in Urban Industries
 Department of Economic History Bachelor Thesis 2011-05-25 Author: Thor Berger Supervisor: Kerstin Enflo Agglomeration Externalities and Growth in Urban Industries - empirical evidence from Sweden, 1896-1910
Stochastic calculus for summable processes 1
 Stochastic calculus for summable processes 1 Lecture I Definition 1. Statistics is the science of collecting, organizing, summarizing and analyzing the information in order to draw conclusions. It is a
Harvard University. Rigorous Research in Engineering Education
 Statistical Inference Kari Lock Harvard University Department of Statistics Rigorous Research in Engineering Education 12/3/09 Statistical Inference You have a sample and want to use the data collected
How data revolution is shaping retail networks today Esri User Conference 2016
 www.pwc.com How data revolution is shaping retail networks today Esri User Conference 2016 Data revolution is here! PwC 2 What does it mean? Did you know Due to the lack of analytical skills companies
Generative Learning. INFO-4604, Applied Machine Learning University of Colorado Boulder. November 29, 2018 Prof. Michael Paul
 Generative Learning INFO-4604, Applied Machine Learning University of Colorado Boulder November 29, 2018 Prof. Michael Paul Generative vs Discriminative The classification algorithms we have seen so far
Exploratory Factor Analysis and Principal Component Analysis
 Exploratory Factor Analysis and Principal Component Analysis Today s Topics: What are EFA and PCA for? Planning a factor analytic study Analysis steps: Extraction methods How many factors Rotation and
WP6 Early estimates of economic indicators. WP6 coordinator: Tomaž Špeh, SURS ESSNet Big data: BDES 2018 Sofia 14.,
 WP6 Early estimates of economic indicators WP6 coordinator: Tomaž Špeh, SURS ESSNet Big data: BDES 2018 Sofia 14.,15.5.2018 WP6 objectives Outline Summary of activities carried out and results achieved
A A ( ) I #$ % E% %' (%) 1999,.
 I #$ % E% %' (%) 1999,.") A A ( ) I E 1999 Å. 2 A............5. A...5....8 1. E E Å......10 1.1 E...10 1.2 Å...10 1.3 Å...10 2.............11 2.1 / / / E E...11 2.2 E...12 2.3 Å E E (LIFE- LONG LEARNING)...13 2.4 (FLEXIBLE) A Å...14
A A ( ) I E 1999 Å. 2 A............5. A...5....8 1. E E Å......10 1.1 E...10 1.2 Å...10 1.3 Å...10 2.............11 2.1 / / / E E...11 2.2 E...12 2.3 Å E E (LIFE- LONG LEARNING)...13 2.4 (FLEXIBLE) A Å...14
Job Training Partnership Act (JTPA)
") Causal inference Part I.b: randomized experiments, matching and regression (this lecture starts with other slides on randomized experiments) Frank Venmans Example of a randomized experiment: Job Training
Causal inference Part I.b: randomized experiments, matching and regression (this lecture starts with other slides on randomized experiments) Frank Venmans Example of a randomized experiment: Job Training
To identify Zanjan food and beverage clusters
 Sustainability Today 261 To identify Zanjan food and beverage clusters S. Hagh Nazari Agriculture Faculty of Zanjan University, Iran Abstract Nowadays, industrial clusters have attracted the public attention
Predictive analysis on Multivariate, Time Series datasets using Shapelets
 1 Predictive analysis on Multivariate, Time Series datasets using Shapelets Hemal Thakkar Department of Computer Science, Stanford University hemal@stanford.edu hemal.tt@gmail.com Abstract Multivariate,
Predicting Sequences: Structured Perceptron. CS 6355: Structured Prediction
 Predicting Sequences: Structured Perceptron CS 6355: Structured Prediction 1 Conditional Random Fields summary An undirected graphical model Decompose the score over the structure into a collection of
Business Statistics: A First Course
 Business Statistics: A First Course 5 th Edition Chapter 7 Sampling and Sampling Distributions Basic Business Statistics, 11e 2009 Prentice-Hall, Inc. Chap 7-1 Learning Objectives In this chapter, you
Econometrics (60 points) as the multivariate regression of Y on X 1 and X 2? [6 points]
![Econometrics (60 points) as the multivariate regression of Y on X 1 and X 2? [6 points]](/thumbs/72/66990660.jpg "Econometrics (60 points) as the multivariate regression of Y on X 1 and X 2? [6 points]") Econometrics (60 points) Question 7: Short Answers (30 points) Answer parts 1-6 with a brief explanation. 1. Suppose the model of interest is Y i = 0 + 1 X 1i + 2 X 2i + u i, where E(u X)=0 and E(u 2 X)=
Econometrics (60 points) Question 7: Short Answers (30 points) Answer parts 1-6 with a brief explanation. 1. Suppose the model of interest is Y i = 0 + 1 X 1i + 2 X 2i + u i, where E(u X)=0 and E(u 2 X)=
On the Ellison Glaeser geographic concentration index
 University of Illinois at Urbana-Champaign From the SelectedWorks of Edward J Feser 2000 On the Ellison Glaeser geographic concentration index Edward J Feser, University of North Carolina at Chapel Hill
Exponents Drill. Warm-up Problems. Problem 1 If (x 3 y 3 ) -3 = (xy) -z, what is z? A) -6 B) 0 C) 1 D) 6 E) 9. Problem 2 36 =?
 -3 = (xy) -z, what is z? A) -6 B) 0 C) 1 D) 6 E) 9. Problem 2 36 =?") Exponents Drill Warm-up Problems Problem 1 If (x 3 y 3 ) -3 = (xy) -z, what is z? A) -6 B) 0 C) 1 D) 6 E) 9 Problem 2 3 36 4 4 3 2 =? A) 0 B) 1/36 C) 1/6 D) 6 E) 36 Problem 3 3 ( xy) =? 6 6 x y A) (xy)
Exponents Drill Warm-up Problems Problem 1 If (x 3 y 3 ) -3 = (xy) -z, what is z? A) -6 B) 0 C) 1 D) 6 E) 9 Problem 2 3 36 4 4 3 2 =? A) 0 B) 1/36 C) 1/6 D) 6 E) 36 Problem 3 3 ( xy) =? 6 6 x y A) (xy)
Programme: B. Tech. Fashion Technology
 VIT Fashion Institute of Technology (VFIT) CURRICULUM [Curriculum for Applied Learning (CAL)] [2016-17 Batch Onwards] Programme: Course Distribution (180 Credits) Discipline % Credits UC UE PC PE Engineering
MAPPING DATA AND INFORMATION SYSTEMS AVAILABILITY AGAINST THE SDGs
 MAPPING DATA AND INFORMATION SYSTEMS AVAILABILITY AGAINST THE SDGs Imelda Atai Musana Uganda Bureau of Statistics imelda.atai@ubos.org Date: November 2015 1 Introduction Uganda Lies Astride the Equator
Systems of Linear Equations and Inequalities
 Systems of Linear Equations and Inequalities Alex Moore February 4, 017 1 What is a system? Now that we have studied linear equations and linear inequalities, it is time to consider the question, What
Hypothesis Tests and Estimation for Population Variances. Copyright 2014 Pearson Education, Inc.
 Hypothesis Tests and Estimation for Population Variances 11-1 Learning Outcomes Outcome 1. Formulate and carry out hypothesis tests for a single population variance. Outcome 2. Develop and interpret confidence
Development. ECON 8830 Anant Nyshadham
 Development ECON 8830 Anant Nyshadham Projections & Regressions Linear Projections If we have many potentially related (jointly distributed) variables Outcome of interest Y Explanatory variable of interest
"Natural" Cultural Districts and Neighborhood Revitalization
 University of Pennsylvania ScholarlyCommons Culture and Community Revitalization: A Collaboration Social Impact of the Arts Project 6-2009 "Natural" Cultural Districts and Neighborhood Revitalization Mark
COMP 551 Applied Machine Learning Lecture 3: Linear regression (cont d)
") COMP 551 Applied Machine Learning Lecture 3: Linear regression (cont d) Instructor: Herke van Hoof (herke.vanhoof@mail.mcgill.ca) Slides mostly by: Class web page: www.cs.mcgill.ca/~hvanho2/comp551 Unless
COMP 551 Applied Machine Learning Lecture 3: Linear regression (cont d) Instructor: Herke van Hoof (herke.vanhoof@mail.mcgill.ca) Slides mostly by: Class web page: www.cs.mcgill.ca/~hvanho2/comp551 Unless
Economics 2450A: Public Economics Section 8: Optimal Minimum Wage and Introduction to Capital Taxation
 Economics 2450A: Public Economics Section 8: Optimal Minimum Wage and Introduction to Capital Taxation Matteo Paradisi November 1, 2016 In this Section we develop a theoretical analysis of optimal minimum
General Examination in Macroeconomic Theory
 General Examination in Macroeconomic Theory Fall 2003 You have FOUR hours Solve all questions The exam has 4 parts Each part has its own sheet Please spend the following time on each part I 60 minutes
National Statistics 2001 Area Classifications
 National Statistics 2001 Area Classifications John Charlton, ONS see http://neighbourhood.statistics.gov.uk areaclassifications@ons.gov.uk Copyright ONS What are the Area Classifications Summarise 2001
PHYS 3220 Tutorials S. Goldhaber, S. Pollock, and the Physics Education Group University of Colorado, Boulder
 Energy and the Art of Sketching Wave Functions 1 I: Sketching wave functions A. Review: The figure to the right shows an infinite square well potential (V = 0 from L/2 to L/2 and is infinite everywhere
Evidence on the linkages between productivity, agglomeration economies, and transport
 Evidence on the linkages between productivity, agglomeration economies, and transport Institute for Transport Planning and Systems (IVT) Seminar, 7 th May 2009 Patricia C. Melo Centre for Transport Studies,
Applying Machine Learning Algorithms to Support Root Cause Analysis An Experimental Study in Automotive Engineering
 Applying Machine Learning Algorithms to Support Root Cause Analysis An Experimental Study in Automotive Engineering Duc Tien, Vu 15.09.2017, Munich Advisor: Martin Kleehaus (TUM) Dr. Valentin Solotych
ICT and Economic Growth in Spain
 ICT and Economic Growth in Spain 1985-2002 Matilde Mas and Javier Quesada (Universitat de Valencia & Ivie*) Abstract Using new sectoral data on investment and capital services we carry out a growth accounting
The Design of a University System
 The Design of a University System Gianni De Fraja University of Leicester, Università di Roma Tor Vergata and CEPR Paola Valbonesi Università di Padova Public Economics UK 27 May 2011 Abstract This paper
Analysis of travel-to-work patterns and the identification and classification of REDZs
 Analysis of travel-to-work patterns and the identification and classification of REDZs Dr David Meredith, Teagasc, Spatial Analysis Unit, Rural Economy Development Programme, Ashtown, Dublin 15. david.meredith@teagasc.ie
AFRICA AND THE KNOWLEDGE ECONOMY
 AFRICA AND THE KNOWLEDGE ECONOMY Module Regions in Globalization: Africa and the Near east Wednesday, 9-11 am NSG, S 113 Moodle: https://moodle2.uni-leipzig.de/course/view.php?id=659 Dr. Ute Rietdorf E-mail:
Stochastic Variance Reduction for Nonconvex Optimization. Barnabás Póczos
 1 Stochastic Variance Reduction for Nonconvex Optimization Barnabás Póczos Contents 2 Stochastic Variance Reduction for Nonconvex Optimization Joint work with Sashank Reddi, Ahmed Hefny, Suvrit Sra, and
Spatial patterns of non-agricultural employment growth in rural Mexico during the 90s
 Spatial patterns of non-agricultural employment growth in rural Mexico during the 90s Caridad Araujo, Alain de Janvry and Elisabeth Sadoulet Department of Agricultural and Resource Economics University
Blue Growth: The Adriatic and Ionian Region
 Blue Growth: The Adriatic and Ionian Region Maritime Clusters: types of support and areas for cooperation AQUAE VENICE 2015 EXPO Matteo Bocci, Ecorys Venice, 28 th September 2015 Structure of this intervention
Upper Egypt Local Development PforR (P157395)
") Public Disclosure Authorized MIDDLE EAST AND NORTH AFRICA Egypt, Arab Republic of Social, Urban, Rural and Resilience Global Practice Global Practice Requesting Unit: MNC03 Responsible Unit: GSU11 IBRD/IDA
Public Disclosure Authorized MIDDLE EAST AND NORTH AFRICA Egypt, Arab Republic of Social, Urban, Rural and Resilience Global Practice Global Practice Requesting Unit: MNC03 Responsible Unit: GSU11 IBRD/IDA
Incorporating ArcGIS Pro in your Curriculum
 AAG, Boston 2017 April 5, 2017 Incorporating ArcGIS Pro in your Curriculum Geri Miller Agenda Concerns Acknowledged Learning curve ArcGIS Pro does not have all the tools (perception) Licensing and offline
15 TH ANNUAL ACI RISK MANAGEMENT CONFERENCE SESSION 1A
 15 TH ANNUAL ACI RISK MANAGEMENT CONFERENCE SESSION 1A MANAGING WORKERS COMPENSATION IN AN AIRPORT ENVIRONMENT PRESENTED BY: JEFF HOLLINGSWORTH, RISK MANAGER, CSP, CPCU PORT OF SEATTLE SEATTLE-TACOMA INTERNATIONAL