Hypothesis Tests and Estimation for Population Variances. Copyright 2014 Pearson Education, Inc.
|
|
|
- Buddy King
- 6 years ago
- Views:
Transcription

1 Hypothesis Tests and Estimation for Population Variances 11-1
2 Learning Outcomes Outcome 1. Formulate and carry out hypothesis tests for a single population variance. Outcome 2. Develop and interpret confidence interval estimates for a population variance. Outcome 3. Formulate and carry out hypothesis tests for the difference between two population variances. 11-2
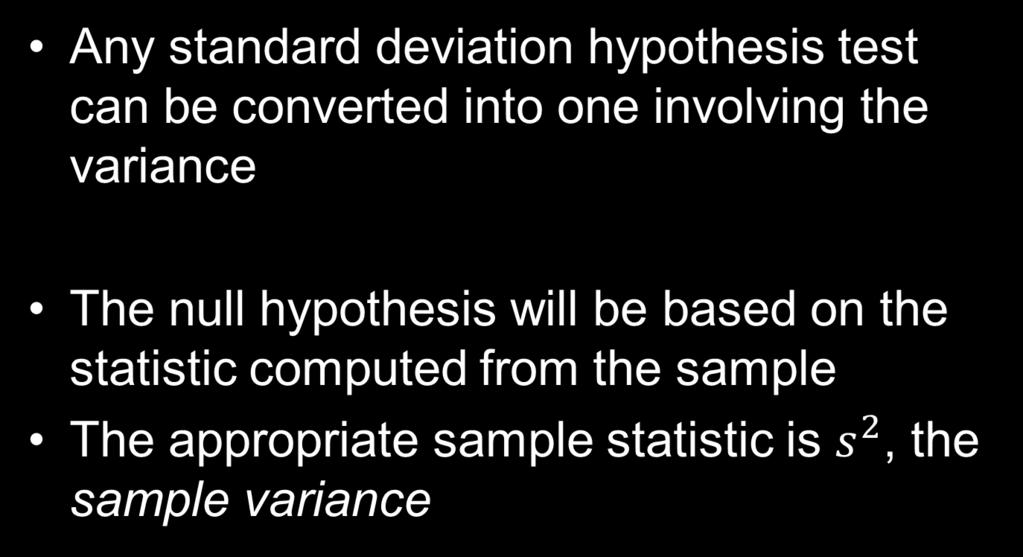
3 11.1 Hypothesis Tests and Estimation for a Single Population Variance When measuring variation, the standard deviation is used as the measure because it is measured in the same units as the mean There is no statistical test directly tests the standard deviation The chi-square test that can be used to test the population variance 11-3


4 Hypothesis for a Single Population Variance 11-4

5 Hypothesis for a Single Population Variance 11-5

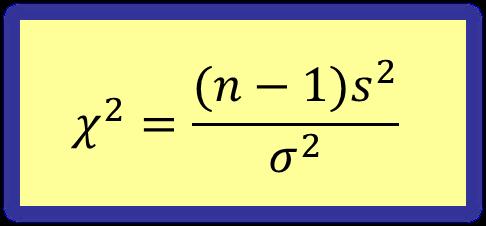
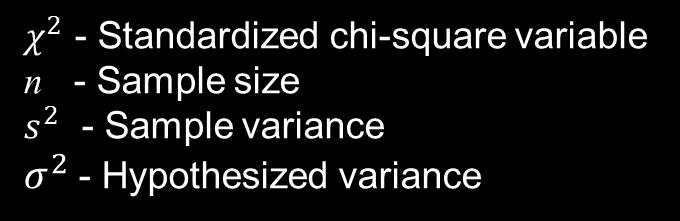
6 Chi-Square Test for a Single Population Variance 11-6
7 Finding the Critical Value The critical value, chi-square table 2 χ α, is found from the χ 2 Do not reject H 0 2 Reject H 0 χ α 11-7
8 Hypothesis Tests for a Single Population Variance Hypothesis Tests for Population Variance 2 χ 1 α Don t reject H 0 χ 2 Don t reject H 0 Reject H 0 χ2 Don t reject H χ α χ 1 α /2 χ α /2 Reject H 0 χ 2 Reject H 0 Reject H

9 Hypothesis Tests for a Single Population Variance 11-9


10 One-Tailed Hypotheses Tests for a Population Variance - Example The company does small moving jobs for businesses and private residential customers. Looking at past records, the operations manager has determined the mean job time for a properly trained moving crew is 2 hours, with a standard deviation not to exceed 0.5 hour. Suppose the operations manager took a random sample of 20 service calls and found a variance of 0.33 hours squared. Compute the test statistic Decision and conclusion 11-10


11 Two-Tailed Hypotheses Tests for a Population Variance - Example The company is experimenting with devices that can be used to store solar energy. Engineers have determined that one particular storage design will yield an average of 88 minutes per cell with a standard deviation of 6 minutes. They also have made some modifications to the design and are interested in determining whether this change has impacted the standard deviation either up or down. A random sample of 12 individual storage cells containing the modified design have been used


12 Two-Tailed Hypotheses Tests for a Population Variance - Example Compute the test statistic Decision and conclusion 11-12


13 Confidence Interval Estimate for a Population Variance Confidence Interval α/2 α/


14 11.2 Hypothesis Tests for Two Population Variances Hypothesis Tests for Two Population Variance F-Test Statistic for Testing whether Two Populations Have Equal Variances 11-14
15 The F-Distribution F-distribution is formed by the ratio of two independent chi-square variables F-distribution is determined by its degrees of freedom Assumptions: The populations are normally distributed The samples are randomly and independently selected 11-15
16 Formulating the F-Ratio To use the F-distribution table, for a two-tailed test, always place the larger sample variance in the numerator. This will make the calculated F- value greater than 1.0 and push the F-value toward the upper tail of the F-distribution. For the one-tailed test, examine the alternative hypothesis. For the population that is predicted (based on the alternative hypothesis) to have the larger variance, place that sample variance in the numerator


17 Hypothesis Tests for Two Population Variances α 0 F 0 F Do not Reject H 0 Do not reject H 0 reject H 0 F α F α/2 Reject H 0 Rejection region for one-tailed test: Rejection region for two-tailed test: The larger sample variance in the numerator 11-17
18 Hypothesis Tests for Two Population Variances Step 1: Specify the population parameter of interest Step 2: Formulate the appropriate null and alternative hypotheses Step 3: Specify the level of significance Step 4: Construct the rejection region, and specify the critical value(s). To determine the critical value(s) from the F-distribution, either Excel s F.INV.RT function or the F-table can be used. The degrees of freedom are: D 1 = Numerator sample size 1 D 2 = Denominator sample size
19 Hypothesis Tests for Two Population Variances Step 5: Compute the test statistic which is formed by the ratio of the two sample variances. Select random samples from each population of interest, determine whether the assumptions have been satisfied, and compute the test statistic Step 6: Reach the decision: Compare the test statistic to the critical value(s) and reach a conclusion with respect to the null hypothesis Step 7: Draw the conclusion 11-19


20 Hypothesis Tests for Two Population Variances - Example Transportation agency is concerned about the waiting times for passengers who use the downtown transit center. Of particular interest is whether there is a difference in the standard deviations in waiting times at concourses A and B. Compute the test statistic Decision and conclusion 11-20


21 How to Do It in Excel? 1. Open file. 2. Select Data > Data Analysis. 3. Select F-Test Two Sample Variances. 4. Define the data range for the two variables. 5. Specify Alpha. 6. Specify output location. 7. Click OK

22 All rights reserved. No part of this publication may be reproduced, stored in a retrieval system, or transmitted, in any form or by any means, electronic, mechanical, photocopying, recording, or otherwise, without the prior written permission of the publisher. Printed in the United States of America
MBA 605, Business Analytics Donald D. Conant, Ph.D. Master of Business Administration
 t-distribution Summary MBA 605, Business Analytics Donald D. Conant, Ph.D. Types of t-tests There are several types of t-test. In this course we discuss three. The single-sample t-test The two-sample t-test
HYPOTHESIS TESTING. Hypothesis Testing
 MBA 605 Business Analytics Don Conant, PhD. HYPOTHESIS TESTING Hypothesis testing involves making inferences about the nature of the population on the basis of observations of a sample drawn from the population.
Chapter 7: Hypothesis Testing - Solutions
 Chapter 7: Hypothesis Testing - Solutions 7.1 Introduction to Hypothesis Testing The problem with applying the techniques learned in Chapter 5 is that typically, the population mean (µ) and standard deviation
Analysis of Variance
 Analysis of Variance Chapter 12 McGraw-Hill/Irwin Copyright 2013 by The McGraw-Hill Companies, Inc. All rights reserved. Learning Objectives LO 12-1 List the characteristics of the F distribution and locate
Hypothesis Testing: One Sample
 Hypothesis Testing: One Sample ELEC 412 PROF. SIRIPONG POTISUK General Procedure Although the exact value of a parameter may be unknown, there is often some idea(s) or hypothesi(e)s about its true value
Section 9.5. Testing the Difference Between Two Variances. Bluman, Chapter 9 1
 Section 9.5 Testing the Difference Between Two Variances Bluman, Chapter 9 1 This the last day the class meets before spring break starts. Please make sure to be present for the test or make appropriate
Statistics for Managers Using Microsoft Excel 7 th Edition
 Statistics for Managers Using Microsoft Excel 7 th Edition Chapter 8 Confidence Interval Estimation Statistics for Managers Using Microsoft Excel 7e Copyright 2014 Pearson Education, Inc. Chap 8-1 Learning
Introduction to Business Statistics QM 220 Chapter 12
 Department of Quantitative Methods & Information Systems Introduction to Business Statistics QM 220 Chapter 12 Dr. Mohammad Zainal 12.1 The F distribution We already covered this topic in Ch. 10 QM-220,
Statistics for Managers using Microsoft Excel 6 th Edition
 Statistics for Managers using Microsoft Excel 6 th Edition Chapter 13 Simple Linear Regression 13-1 Learning Objectives In this chapter, you learn: How to use regression analysis to predict the value of
12.10 (STUDENT CD-ROM TOPIC) CHI-SQUARE GOODNESS- OF-FIT TESTS
 CHI-SQUARE GOODNESS- OF-FIT TESTS") CDR4_BERE601_11_SE_C1QXD 1//08 1:0 PM Page 1 110: (Student CD-ROM Topic) Chi-Square Goodness-of-Fit Tests CD1-1 110 (STUDENT CD-ROM TOPIC) CHI-SQUARE GOODNESS- OF-FIT TESTS In this section, χ goodness-of-fit
CDR4_BERE601_11_SE_C1QXD 1//08 1:0 PM Page 1 110: (Student CD-ROM Topic) Chi-Square Goodness-of-Fit Tests CD1-1 110 (STUDENT CD-ROM TOPIC) CHI-SQUARE GOODNESS- OF-FIT TESTS In this section, χ goodness-of-fit
Chapter Seven: Multi-Sample Methods 1/52
 Chapter Seven: Multi-Sample Methods 1/52 7.1 Introduction 2/52 Introduction The independent samples t test and the independent samples Z test for a difference between proportions are designed to analyze
CBA4 is live in practice mode this week exam mode from Saturday!
 Announcements CBA4 is live in practice mode this week exam mode from Saturday! Material covered: Confidence intervals (both cases) 1 sample hypothesis tests (both cases) Hypothesis tests for 2 means as
AMS7: WEEK 7. CLASS 1. More on Hypothesis Testing Monday May 11th, 2015
 AMS7: WEEK 7. CLASS 1 More on Hypothesis Testing Monday May 11th, 2015 Testing a Claim about a Standard Deviation or a Variance We want to test claims about or 2 Example: Newborn babies from mothers taking
1 Binomial Probability [15 points]
![1 Binomial Probability [15 points]](/thumbs/80/81467318.jpg "1 Binomial Probability [15 points]") Economics 250 Assignment 2 (Due November 13, 2017, in class) i) You should do the assignment on your own, Not group work! ii) Submit the completed work in class on the due date. iii) Remember to include
Economics 250 Assignment 2 (Due November 13, 2017, in class) i) You should do the assignment on your own, Not group work! ii) Submit the completed work in class on the due date. iii) Remember to include
Comparing Means from Two-Sample
 Comparing Means from Two-Sample Kwonsang Lee University of Pennsylvania kwonlee@wharton.upenn.edu April 3, 2015 Kwonsang Lee STAT111 April 3, 2015 1 / 22 Inference from One-Sample We have two options to
Classroom Activity 7 Math 113 Name : 10 pts Intro to Applied Stats
 Classroom Activity 7 Math 113 Name : 10 pts Intro to Applied Stats Materials Needed: Bags of popcorn, watch with second hand or microwave with digital timer. Instructions: Follow the instructions on the
Ch. 7 Statistical Intervals Based on a Single Sample
 Ch. 7 Statistical Intervals Based on a Single Sample Before discussing the topics in Ch. 7, we need to cover one important concept from Ch. 6. Standard error The standard error is the standard deviation
Section 11: Quantitative analyses: Linear relationships among variables
 Section 11: Quantitative analyses: Linear relationships among variables Australian Catholic University 214 ALL RIGHTS RESERVED. No part of this work covered by the copyright herein may be reproduced or
Statistical Analysis for QBIC Genetics Adapted by Ellen G. Dow 2017
 Statistical Analysis for QBIC Genetics Adapted by Ellen G. Dow 2017 I. χ 2 or chi-square test Objectives: Compare how close an experimentally derived value agrees with an expected value. One method to
T.I.H.E. IT 233 Statistics and Probability: Sem. 1: 2013 ESTIMATION AND HYPOTHESIS TESTING OF TWO POPULATIONS
 ESTIMATION AND HYPOTHESIS TESTING OF TWO POPULATIONS In our work on hypothesis testing, we used the value of a sample statistic to challenge an accepted value of a population parameter. We focused only
An inferential procedure to use sample data to understand a population Procedures
 Hypothesis Test An inferential procedure to use sample data to understand a population Procedures Hypotheses, the alpha value, the critical region (z-scores), statistics, conclusion Two types of errors
POLI 443 Applied Political Research
 POLI 443 Applied Political Research Session 6: Tests of Hypotheses Contingency Analysis Lecturer: Prof. A. Essuman-Johnson, Dept. of Political Science Contact Information: aessuman-johnson@ug.edu.gh College
7.2 One-Sample Correlation ( = a) Introduction. Correlation analysis measures the strength and direction of association between
 Introduction. Correlation analysis measures the strength and direction of association between") 7.2 One-Sample Correlation ( = a) Introduction Correlation analysis measures the strength and direction of association between variables. In this chapter we will test whether the population correlation
7.2 One-Sample Correlation ( = a) Introduction Correlation analysis measures the strength and direction of association between variables. In this chapter we will test whether the population correlation
ME3620. Theory of Engineering Experimentation. Spring Chapter IV. Decision Making for a Single Sample. Chapter IV
 Theory of Engineering Experimentation Chapter IV. Decision Making for a Single Sample Chapter IV 1 4 1 Statistical Inference The field of statistical inference consists of those methods used to make decisions
Our true, holographic blueprint of the human matrix system
 ABIGAIL S INSIGHTS THE SOVEREIGN HUMAN MATRIX TEMPLATE Our true, holographic blueprint of the human matrix system ABIGAIL PATTMAN All rights reserved. No part of this publication may be copied, reproduced,
Visual interpretation with normal approximation
 Visual interpretation with normal approximation H 0 is true: H 1 is true: p =0.06 25 33 Reject H 0 α =0.05 (Type I error rate) Fail to reject H 0 β =0.6468 (Type II error rate) 30 Accept H 1 Visual interpretation
Six Sigma Black Belt Study Guides
 Six Sigma Black Belt Study Guides 1 www.pmtutor.org Powered by POeT Solvers Limited. Analyze Correlation and Regression Analysis 2 www.pmtutor.org Powered by POeT Solvers Limited. Variables and relationships
Hypothesis for Means and Proportions
 November 14, 2012 Hypothesis Tests - Basic Ideas Often we are interested not in estimating an unknown parameter but in testing some claim or hypothesis concerning a population. For example we may wish
CIVL /8904 T R A F F I C F L O W T H E O R Y L E C T U R E - 8
 CIVL - 7904/8904 T R A F F I C F L O W T H E O R Y L E C T U R E - 8 Chi-square Test How to determine the interval from a continuous distribution I = Range 1 + 3.322(logN) I-> Range of the class interval
Section 9.4. Notation. Requirements. Definition. Inferences About Two Means (Matched Pairs) Examples
 Examples") Objective Section 9.4 Inferences About Two Means (Matched Pairs) Compare of two matched-paired means using two samples from each population. Hypothesis Tests and Confidence Intervals of two dependent means
Objective Section 9.4 Inferences About Two Means (Matched Pairs) Compare of two matched-paired means using two samples from each population. Hypothesis Tests and Confidence Intervals of two dependent means
Chi-Squared Tests. Semester 1. Chi-Squared Tests
 Semester 1 Goodness of Fit Up to now, we have tested hypotheses concerning the values of population parameters such as the population mean or proportion. We have not considered testing hypotheses about
Study Ch. 9.3, #47 53 (45 51), 55 61, (55 59)
, 55 61, (55 59)") GOALS: 1. Understand that 2 approaches of hypothesis testing exist: classical or critical value, and p value. We will use the p value approach. 2. Understand the critical value for the classical approach
GOALS: 1. Understand that 2 approaches of hypothesis testing exist: classical or critical value, and p value. We will use the p value approach. 2. Understand the critical value for the classical approach
Single Sample Means. SOCY601 Alan Neustadtl
 Single Sample Means SOCY601 Alan Neustadtl The Central Limit Theorem If we have a population measured by a variable with a mean µ and a standard deviation σ, and if all possible random samples of size
Institute of Actuaries of India
 Institute of Actuaries of India Subject CT3 Probability & Mathematical Statistics May 2011 Examinations INDICATIVE SOLUTION Introduction The indicative solution has been written by the Examiners with the
Verification and Validation. CS1538: Introduction to Simulations
 Verification and Validation CS1538: Introduction to Simulations Steps in a Simulation Study Problem & Objective Formulation Model Conceptualization Data Collection Model translation, Verification, Validation
Lecture 2. Estimating Single Population Parameters 8-1
 Lecture 2 Estimating Single Population Parameters 8-1 8.1 Point and Confidence Interval Estimates for a Population Mean Point Estimate A single statistic, determined from a sample, that is used to estimate
INTERVAL ESTIMATION AND HYPOTHESES TESTING
 INTERVAL ESTIMATION AND HYPOTHESES TESTING 1. IDEA An interval rather than a point estimate is often of interest. Confidence intervals are thus important in empirical work. To construct interval estimates,
Econ 325: Introduction to Empirical Economics
 Econ 325: Introduction to Empirical Economics Chapter 9 Hypothesis Testing: Single Population Ch. 9-1 9.1 What is a Hypothesis? A hypothesis is a claim (assumption) about a population parameter: population
Exam 2 (KEY) July 20, 2009
 July 20, 2009") STAT 2300 Business Statistics/Summer 2009, Section 002 Exam 2 (KEY) July 20, 2009 Name: USU A#: Score: /225 Directions: This exam consists of six (6) questions, assessing material learned within Modules
STAT 2300 Business Statistics/Summer 2009, Section 002 Exam 2 (KEY) July 20, 2009 Name: USU A#: Score: /225 Directions: This exam consists of six (6) questions, assessing material learned within Modules
LECTURE 5 HYPOTHESIS TESTING
 October 25, 2016 LECTURE 5 HYPOTHESIS TESTING Basic concepts In this lecture we continue to discuss the normal classical linear regression defined by Assumptions A1-A5. Let θ Θ R d be a parameter of interest.
GEOMETRIC -discrete A discrete random variable R counts number of times needed before an event occurs
 STATISTICS 4 Summary Notes. Geometric and Exponential Distributions GEOMETRIC -discrete A discrete random variable R counts number of times needed before an event occurs P(X = x) = ( p) x p x =,, 3,...
Chi Square Analysis M&M Statistics. Name Period Date
 Chi Square Analysis M&M Statistics Name Period Date Have you ever wondered why the package of M&Ms you just bought never seems to have enough of your favorite color? Or, why is it that you always seem
χ L = χ R =
 Chapter 7 3C: Examples of Constructing a Confidence Interval for the true value of the Population Standard Deviation σ for a Normal Population. Example 1 Construct a 95% confidence interval for the true
DISPLAYING THE POISSON REGRESSION ANALYSIS
 Chapter 17 Poisson Regression Chapter Table of Contents DISPLAYING THE POISSON REGRESSION ANALYSIS...264 ModelInformation...269 SummaryofFit...269 AnalysisofDeviance...269 TypeIII(Wald)Tests...269 MODIFYING
Preparing Spatial Data
 13 CHAPTER 2 Preparing Spatial Data Assessing Your Spatial Data Needs 13 Assessing Your Attribute Data 13 Determining Your Spatial Data Requirements 14 Locating a Source of Spatial Data 14 Performing Common
9-7: THE POWER OF A TEST
 CD9-1 9-7: THE POWER OF A TEST In the initial discussion of statistical hypothesis testing the two types of risks that are taken when decisions are made about population parameters based only on sample
2011 Pearson Education, Inc
 Statistics for Business and Economics Chapter 7 Inferences Based on Two Samples: Confidence Intervals & Tests of Hypotheses Content 1. Identifying the Target Parameter 2. Comparing Two Population Means:
Sample file. Page 1 of 18. Copyright 2013 A+ Interactive MATH (an A+ TutorSoft Inc. company), All Rights Reserved.
, All Rights Reserved.") www.aplustutorsoft.com Page 1 of 18 Telling Time to the Quarter-hour Lesson, Worksheet & Solution Guide Release 7 A+ Interactive Math (By A+ TutorSoft, Inc.) Email: info@aplustutorsoft.com www.aplustutorsoft.com
www.aplustutorsoft.com Page 1 of 18 Telling Time to the Quarter-hour Lesson, Worksheet & Solution Guide Release 7 A+ Interactive Math (By A+ TutorSoft, Inc.) Email: info@aplustutorsoft.com www.aplustutorsoft.com
The Purpose of Hypothesis Testing
 Section 8 1A:! An Introduction to Hypothesis Testing The Purpose of Hypothesis Testing See s Candy states that a box of it s candy weighs 16 oz. They do not mean that every single box weights exactly 16
Independent Samples ANOVA
 Independent Samples ANOVA In this example students were randomly assigned to one of three mnemonics (techniques for improving memory) rehearsal (the control group; simply repeat the words), visual imagery
CONTINUOUS RANDOM VARIABLES
 the Further Mathematics network www.fmnetwork.org.uk V 07 REVISION SHEET STATISTICS (AQA) CONTINUOUS RANDOM VARIABLES The main ideas are: Properties of Continuous Random Variables Mean, Median and Mode
How do we compare the relative performance among competing models?
 How do we compare the relative performance among competing models? 1 Comparing Data Mining Methods Frequent problem: we want to know which of the two learning techniques is better How to reliably say Model
CH.9 Tests of Hypotheses for a Single Sample
 CH.9 Tests of Hypotheses for a Single Sample Hypotheses testing Tests on the mean of a normal distributionvariance known Tests on the mean of a normal distributionvariance unknown Tests on the variance
CHAPTER 10 Comparing Two Populations or Groups
 CHAPTER 10 Comparing Two Populations or Groups 10.1 Comparing Two Proportions The Practice of Statistics, 5th Edition Starnes, Tabor, Yates, Moore Bedford Freeman Worth Publishers Comparing Two Proportions
LAB 2. HYPOTHESIS TESTING IN THE BIOLOGICAL SCIENCES- Part 2
 LAB 2. HYPOTHESIS TESTING IN THE BIOLOGICAL SCIENCES- Part 2 Data Analysis: The mean egg masses (g) of the two different types of eggs may be exactly the same, in which case you may be tempted to accept
Sampling distribution of t. 2. Sampling distribution of t. 3. Example: Gas mileage investigation. II. Inferential Statistics (8) t =
 t =") 2. The distribution of t values that would be obtained if a value of t were calculated for each sample mean for all possible random of a given size from a population _ t ratio: (X - µ hyp ) t s x The result
2. The distribution of t values that would be obtained if a value of t were calculated for each sample mean for all possible random of a given size from a population _ t ratio: (X - µ hyp ) t s x The result
16.400/453J Human Factors Engineering. Design of Experiments II
 J Human Factors Engineering Design of Experiments II Review Experiment Design and Descriptive Statistics Research question, independent and dependent variables, histograms, box plots, etc. Inferential
Example. χ 2 = Continued on the next page. All cells
 Section 11.1 Chi Square Statistic k Categories 1 st 2 nd 3 rd k th Total Observed Frequencies O 1 O 2 O 3 O k n Expected Frequencies E 1 E 2 E 3 E k n O 1 + O 2 + O 3 + + O k = n E 1 + E 2 + E 3 + + E
Department of Economics. Business Statistics. Chapter 12 Chi-square test of independence & Analysis of Variance ECON 509. Dr.
 Department of Economics Business Statistics Chapter 1 Chi-square test of independence & Analysis of Variance ECON 509 Dr. Mohammad Zainal Chapter Goals After completing this chapter, you should be able
Advanced Experimental Design
 Advanced Experimental Design Topic Four Hypothesis testing (z and t tests) & Power Agenda Hypothesis testing Sampling distributions/central limit theorem z test (σ known) One sample z & Confidence intervals
Sampling, Confidence Interval and Hypothesis Testing
 Sampling, Confidence Interval and Hypothesis Testing Christopher Grigoriou Executive MBA HEC Lausanne 2007-2008 1 Sampling : Careful with convenience samples! World War II: A statistical study to decide
Prepared by: Prof. Dr Bahaman Abu Samah Department of Professional Development and Continuing Education Faculty of Educational Studies Universiti
 Prepared by: Prof. Dr Bahaman Abu Samah Department of Professional Development and Continuing Education Faculty of Educational Studies Universiti Putra Malaysia Serdang Use in experiment, quasi-experiment
Hypothesis testing. Data to decisions
 Hypothesis testing Data to decisions The idea Null hypothesis: H 0 : the DGP/population has property P Under the null, a sample statistic has a known distribution If, under that that distribution, the
Performance Evaluation and Comparison
 Outline Hong Chang Institute of Computing Technology, Chinese Academy of Sciences Machine Learning Methods (Fall 2012) Outline Outline I 1 Introduction 2 Cross Validation and Resampling 3 Interval Estimation
Probability Methods in Civil Engineering Prof. Dr. Rajib Maity Department of Civil Engineering Indian Institution of Technology, Kharagpur
 Probability Methods in Civil Engineering Prof. Dr. Rajib Maity Department of Civil Engineering Indian Institution of Technology, Kharagpur Lecture No. # 36 Sampling Distribution and Parameter Estimation
Non-parametric methods
 Eastern Mediterranean University Faculty of Medicine Biostatistics course Non-parametric methods March 4&7, 2016 Instructor: Dr. Nimet İlke Akçay (ilke.cetin@emu.edu.tr) Learning Objectives 1. Distinguish
CHAPTER 17 CHI-SQUARE AND OTHER NONPARAMETRIC TESTS FROM: PAGANO, R. R. (2007)
") FROM: PAGANO, R. R. (007) I. INTRODUCTION: DISTINCTION BETWEEN PARAMETRIC AND NON-PARAMETRIC TESTS Statistical inference tests are often classified as to whether they are parametric or nonparametric Parameter
FROM: PAGANO, R. R. (007) I. INTRODUCTION: DISTINCTION BETWEEN PARAMETRIC AND NON-PARAMETRIC TESTS Statistical inference tests are often classified as to whether they are parametric or nonparametric Parameter
Paper Reference. Statistics S4 Advanced/Advanced Subsidiary. Friday 19 June 2009 Afternoon Time: 1 hour 30 minutes
 Centre No. Candidate No. Paper Reference(s) 6686/01 Edexcel GCE Statistics S4 Advanced/Advanced Subsidiary Friday 19 June 2009 Afternoon Time: 1 hour 30 minutes Materials required for examination Mathematical
Exam Empirical Methods VU University Amsterdam, Faculty of Exact Sciences h, February 12, 2015
 Exam Empirical Methods VU University Amsterdam, Faculty of Exact Sciences 18.30 21.15h, February 12, 2015 Question 1 is on this page. Always motivate your answers. Write your answers in English. Only the
Chapter Eight: Assessment of Relationships 1/42
 Chapter Eight: Assessment of Relationships 1/42 8.1 Introduction 2/42 Background This chapter deals, primarily, with two topics. The Pearson product-moment correlation coefficient. The chi-square test
Paper Reference R. Statistics S4 Advanced/Advanced Subsidiary. Friday 21 June 2013 Morning Time: 1 hour 30 minutes
 Centre No. Candidate No. Paper Reference(s) 6686/01R Edexcel GCE Statistics S4 Advanced/Advanced Subsidiary Friday 21 June 2013 Morning Time: 1 hour 30 minutes Materials required for examination Mathematical
POLI 443 Applied Political Research
 POLI 443 Applied Political Research Session 4 Tests of Hypotheses The Normal Curve Lecturer: Prof. A. Essuman-Johnson, Dept. of Political Science Contact Information: aessuman-johnson@ug.edu.gh College
Review: General Approach to Hypothesis Testing. 1. Define the research question and formulate the appropriate null and alternative hypotheses.
 1 Review: Let X 1, X,..., X n denote n independent random variables sampled from some distribution might not be normal!) with mean µ) and standard deviation σ). Then X µ σ n In other words, X is approximately
Chapter 8 Student Lecture Notes 8-1. Department of Economics. Business Statistics. Chapter 12 Chi-square test of independence & Analysis of Variance
 Chapter 8 Student Lecture Notes 8-1 Department of Economics Business Statistics Chapter 1 Chi-square test of independence & Analysis of Variance ECON 509 Dr. Mohammad Zainal Chapter Goals After completing
10.2: The Chi Square Test for Goodness of Fit
 10.2: The Chi Square Test for Goodness of Fit We can perform a hypothesis test to determine whether the distribution of a single categorical variable is following a proposed distribution. We call this
Section 9.1 (Part 2) (pp ) Type I and Type II Errors
 (pp ) Type I and Type II Errors") Section 9.1 (Part 2) (pp. 547-551) Type I and Type II Errors Because we are basing our conclusion in a significance test on sample data, there is always a chance that our conclusions will be in error.
Section 9.1 (Part 2) (pp. 547-551) Type I and Type II Errors Because we are basing our conclusion in a significance test on sample data, there is always a chance that our conclusions will be in error.
Last two weeks: Sample, population and sampling distributions finished with estimation & confidence intervals
 Past weeks: Measures of central tendency (mean, mode, median) Measures of dispersion (standard deviation, variance, range, etc). Working with the normal curve Last two weeks: Sample, population and sampling
Chapter 12: Inference about One Population
 Chapter 1: Inference about One Population 1.1 Introduction In this chapter, we presented the statistical inference methods used when the problem objective is to describe a single population. Sections 1.
Elementary Statistics in Social Research Essentials Jack Levin James Alan Fox Third Edition
 Elementary Statistics in Social Research Essentials Jack Levin James Alan Fox Third Edition Pearson Education Limited Edinburgh Gate Harlow Essex CM20 2JE England and Associated Companies throughout the
Chapter 3. Comparing two populations
 Chapter 3. Comparing two populations Contents Hypothesis for the difference between two population means: matched pairs Hypothesis for the difference between two population means: independent samples Two
PSY 305. Module 3. Page Title. Introduction to Hypothesis Testing Z-tests. Five steps in hypothesis testing
 Page Title PSY 305 Module 3 Introduction to Hypothesis Testing Z-tests Five steps in hypothesis testing State the research and null hypothesis Determine characteristics of comparison distribution Five
" M A #M B. Standard deviation of the population (Greek lowercase letter sigma) σ 2
 σ 2") Notation and Equations for Final Exam Symbol Definition X The variable we measure in a scientific study n The size of the sample N The size of the population M The mean of the sample µ The mean of the
Notation and Equations for Final Exam Symbol Definition X The variable we measure in a scientific study n The size of the sample N The size of the population M The mean of the sample µ The mean of the
Chapter 8. Inferences Based on a Two Samples Confidence Intervals and Tests of Hypothesis
 Chapter 8 Inferences Based on a Two Samples Confidence Intervals and Tests of Hypothesis Copyright 2018, 2014, and 2011 Pearson Education, Inc. Slide - 1 Content 1. Identifying the Target Parameter 2.
Problem Set 4 - Solutions
 Problem Set 4 - Solutions Econ-310, Spring 004 8. a. If we wish to test the research hypothesis that the mean GHQ score for all unemployed men exceeds 10, we test: H 0 : µ 10 H a : µ > 10 This is a one-tailed
You may not use your books/notes on this exam. You may use calculator.
 MATH 450 Fall 2018 Review problems 12/03/18 Time Limit: 60 Minutes Name (Print: This exam contains 6 pages (including this cover page and 5 problems. Check to see if any pages are missing. Enter all requested
The Chi-Square Distributions
 MATH 183 The Chi-Square Distributions Dr. Neal, WKU The chi-square distributions can be used in statistics to analyze the standard deviation σ of a normally distributed measurement and to test the goodness
Summary of Chapter 7 (Sections ) and Chapter 8 (Section 8.1)
 and Chapter 8 (Section 8.1)") Summary of Chapter 7 (Sections 7.2-7.5) and Chapter 8 (Section 8.1) Chapter 7. Tests of Statistical Hypotheses 7.2. Tests about One Mean (1) Test about One Mean Case 1: σ is known. Assume that X N(µ, σ
Summary of Chapter 7 (Sections 7.2-7.5) and Chapter 8 (Section 8.1) Chapter 7. Tests of Statistical Hypotheses 7.2. Tests about One Mean (1) Test about One Mean Case 1: σ is known. Assume that X N(µ, σ
Tables Table A Table B Table C Table D Table E 675
 BMTables.indd Page 675 11/15/11 4:25:16 PM user-s163 Tables Table A Standard Normal Probabilities Table B Random Digits Table C t Distribution Critical Values Table D Chi-square Distribution Critical Values
Marketing Research Session 10 Hypothesis Testing with Simple Random samples (Chapter 12)
") Marketing Research Session 10 Hypothesis Testing with Simple Random samples (Chapter 12) Remember: Z.05 = 1.645, Z.01 = 2.33 We will only cover one-sided hypothesis testing (cases 12.3, 12.4.2, 12.5.2,
Marketing Research Session 10 Hypothesis Testing with Simple Random samples (Chapter 12) Remember: Z.05 = 1.645, Z.01 = 2.33 We will only cover one-sided hypothesis testing (cases 12.3, 12.4.2, 12.5.2,
Statistics for Managers Using Microsoft Excel/SPSS Chapter 8 Fundamentals of Hypothesis Testing: One-Sample Tests
 Statistics for Managers Using Microsoft Excel/SPSS Chapter 8 Fundamentals of Hypothesis Testing: One-Sample Tests 1999 Prentice-Hall, Inc. Chap. 8-1 Chapter Topics Hypothesis Testing Methodology Z Test
Chapter 7 Comparison of two independent samples
 Chapter 7 Comparison of two independent samples 7.1 Introduction Population 1 µ σ 1 1 N 1 Sample 1 y s 1 1 n 1 Population µ σ N Sample y s n 1, : population means 1, : population standard deviations N
LECTURE 5. Introduction to Econometrics. Hypothesis testing
 LECTURE 5 Introduction to Econometrics Hypothesis testing October 18, 2016 1 / 26 ON TODAY S LECTURE We are going to discuss how hypotheses about coefficients can be tested in regression models We will
Chapter 10. Chapter 10. Multinomial Experiments and. Multinomial Experiments and Contingency Tables. Contingency Tables.
 Chapter 10 Multinomial Experiments and Contingency Tables 1 Chapter 10 Multinomial Experiments and Contingency Tables 10-1 1 Overview 10-2 2 Multinomial Experiments: of-fitfit 10-3 3 Contingency Tables:
ASSIGNMENT 3 SIMPLE LINEAR REGRESSION. Old Faithful
 ASSIGNMENT 3 SIMPLE LINEAR REGRESSION In the simple linear regression model, the mean of a response variable is a linear function of an explanatory variable. The model and associated inferential tools
Chap The McGraw-Hill Companies, Inc. All rights reserved.
 11 pter11 Chap Analysis of Variance Overview of ANOVA Multiple Comparisons Tests for Homogeneity of Variances Two-Factor ANOVA Without Replication General Linear Model Experimental Design: An Overview
Chapte The McGraw-Hill Companies, Inc. All rights reserved.
 12er12 Chapte Bivariate i Regression (Part 1) Bivariate Regression Visual Displays Begin the analysis of bivariate data (i.e., two variables) with a scatter plot. A scatter plot - displays each observed
While you wait: Enter the following in your calculator. Find the mean and sample variation of each group. Bluman, Chapter 12 1
 While you wait: Enter the following in your calculator. Find the mean and sample variation of each group. Bluman, Chapter 12 1 Chapter 12 Analysis of Variance McGraw-Hill, Bluman, 7th ed., Chapter 12 2
10/4/2013. Hypothesis Testing & z-test. Hypothesis Testing. Hypothesis Testing
 & z-test Lecture Set 11 We have a coin and are trying to determine if it is biased or unbiased What should we assume? Why? Flip coin n = 100 times E(Heads) = 50 Why? Assume we count 53 Heads... What could
Lecture 7: Hypothesis Testing and ANOVA
 Lecture 7: Hypothesis Testing and ANOVA Goals Overview of key elements of hypothesis testing Review of common one and two sample tests Introduction to ANOVA Hypothesis Testing The intent of hypothesis
Statistics for Managers using Microsoft Excel 6 th Edition
 Statistics for Managers using Microsoft Excel 6 th Edition Chapter 3 Numerical Descriptive Measures 3-1 Learning Objectives In this chapter, you learn: To describe the properties of central tendency, variation,