Using GIS: to analyze vector borne disease. David Attaway Esri
|
|
|
- Bertina Nichols
- 5 years ago
- Views:
Transcription


1 Using GIS: to analyze vector borne disease David Attaway Esri


2 Why do I care?


3 Example: YELP Most of us have used it Most of us let it help guide our decisions Most see it helpful But. How does this relate to Medical Geography?


4 When we search for Restaurants. Behind the scenes: All locations are being RANKED


5 When we search for Pizza. Behind the scenes: All locations are being RANKED
6 How about we do this with GIS?
7 Similarity Search identifies which candidate features are most similar or most dissimilar to one or more input features based on feature attributes
8 potential store locations
9 potential store locations high performing store
10 LocID PopDensity AvIncome DistToCompetition Rank by how similar they are to based on: LocID PopDensity AvIncome DistToCompetition

11 LocID PopDensity AvIncome DistToCompetition Rank by how similar they are to based on: PopDensity AvIncome DistToCompetition LocID PopDensity AvIncome DistToCompetition
12
13
) Temperature seasonality")
14 Methodology Similarity Search Model - Dengue Utilize Similarity Search: Elevation Population density Bioclimatic variables Standardize variables Run model in ArcGIS (1) (2) Layer ALT BIO1 BIO2 BIO4 BIO5 BIO6 BIO9 BIO10 * BIO12 BIO13 BIO14 BIO15 BIO19 LNDSCN_POP Description Elevation data Annual mean temperature Mean diurnal range (mean of monthly (max temp - min temp)) Temperature seasonality (standard deviation *100) Max temperature of warmest month Min temperature of coldest month Mean temperature of driest quarter Mean temperature of warmest quarter Annual precipitation Precipitation of wettest month Precipitation of driest month Precipitation seasonality (coefficient of variation) Precipitation of coldest quarter 2011 Landscan population density data
15 Mosquito Locations (365 Survey sites 167 cells) Dengue Outbreaks ( ) (4 Locations 120 Cells) Elevation Data Similarity Search Tool Population Density Bioclimatic Layers Similarity Search based on averages of 287 points Similarity Search based on 287 individual iterations Similarity Search Averages Map Comparison Discussion and Results Similarity Search 287 Iterations Combined Map
16 Factor Parameters Count Total UNIVARIATE MODELS Percentage Included Elevation ALT 1800 (meters) % Minimum Temperature MinTemp 100 (10 C) % Human Population Density* POP > % Land Cover (2009) GLC 11 (Irrigated Crops) AND GLC 190 (Artificial areas) % Maximum Temperature MaxTemp 300 (30 C) % Max Precipitation Average BIO13 > 0, BIO16> 0, AND BIO (55mm) % Distance from Water** WBD 200km % Min Precipitation Average BIO14 > 20 (.2mm) AND BIO17 > % BIVARIATE MODELS Elevation AND Min Temp ALT 1800 (meters) AND MinTemp 10 C % Min Temp AND Population* MinTemp 10 C AND POP > % Elevation AND Max Temp ALT 1800 (meters) AND MaxTemp 30 C % Land Cover AND Population* GLC 11 (Irrigated Crops) AND GLC 190 (Artificial areas) AND POP > % Max Temp AND Human Population Density* MaxTemp 30 C AND POP > % Land Cover AND Min Temp GLC 11 (Irrigated Crops) AND GLC 190 (Artificial areas) AND MinTemp 10 C % Elevation AND Population* ALT 1800 (meters) AND POP > % Land Cover AND Max Temp GLC 11 (Irrigated Crops) AND GLC 190 (Artificial areas) AND Max Temp 300 (30 C) % Elevation AND Max Precipitation ALT 1800 (meters) AND MaxPrecip Avg Parameters % Min Temp AND Max Precip MinTemp 10 C AND MaxPrecip Avg Parameters % Elevation AND Precip (Max OR Min) ALT 1800 (meters) AND MaxPrecip Avg Parameters OR MinPrecip Avg Parameters % Land Cover AND Max Precipitation GLC 11 (Irrigated Crops) AND GLC 190 (Artificial areas) AND MaxPrecip % Max Temp AND Max Precip MaxTemp 30 C AND MaxPrecip Avg Parameters % MinTemp AND MinPrecip MinTemp 10 C AND MinPrecip Avg Parameters % Land Cover AND Min Precipitation GLC 11 (Irrigated Crops) AND GLC 190 (Artificial areas) AND MinPrecip Avg Parameters %


17 Results 195,573, ,442 Points Points (! Mosquito and Outbreak Reference Points SIMRANK High : 100% Low : 0% _^( _^ Capital Major Towns Major Roads Waterbodies Countries

18 Predictive Analysis

19 ArcGIS Predictive Analysis Tools Add-In Capabilities Predictive Analysis Tools Predict suitable locations, and travel routes Extremely fast to accommodate iterative analysis Auto-generate analysis based on historic data Repeatable and shareable workflows Easy to use

20 Versatility Predictive Analysis Tools

21

22

23
 Model can easily be modified as conditions")
24 Results: Africa PA Tools Analysis Allowed determination in Africa for: High suitable Somewhat suitable Limited suitability Highly unsuitable Not suitable Increased efficiency Provided localized analysis (1km x 1km) Model can easily be modified as conditions change
 Model easily modified Red - Limited the spatial bias Red -")
25 Comparison QFIT vs. Query Editor Expression Models Human population density Localized analysis (1km x 1km) Model easily modified Red - Limited the spatial bias Red - Captured 67% of reported dengue data Red - Captured 83% of reported dengue data w/ 3km buffer Blue - Captured 86% of reported dengue data


26 Method that draws on temperature, precipitation, elevation, land cover, and population density variables to identify locations suitable for mosquito activity year-round.

27
Modelling Bluetongue vectors occurence using GIS and Remote Sensing techniques. Martins H., Nunes T., Boinas F.
 Modelling Bluetongue vectors occurence using GIS and Remote Sensing techniques Martins H., Nunes T., Boinas F. Introduction Objectives Spatial modelling of Culicoides imicola occurence Compare modelling
GIS CONFERENCE MAKING PLACE MATTER Decoding Health Data with Spatial Statistics
 esri HEALTH AND HUMAN SERVICES GIS CONFERENCE MAKING PLACE MATTER Decoding Health Data with Spatial Statistics Flora Vale Jenora D Acosta Wait a minute Wait a minute Where is Lauren?? Wait a minute Where
Colorado State University, Fort Collins, CO Weather Station Monthly Summary Report
 Colorado State University, Fort Collins, CO Weather Station Monthly Summary Report Month: December Year: 2016 Temperature: Mean T max was 39.7 F which is 3.1 below the 1981-2010 normal for the month. This
Introducing GIS analysis
 1 Introducing GIS analysis GIS analysis lets you see patterns and relationships in your geographic data. The results of your analysis will give you insight into a place, help you focus your actions, or
Colorado State University, Fort Collins, CO Weather Station Monthly Summary Report
 Colorado State University, Fort Collins, CO Weather Station Monthly Summary Report Month: December Year: 2017 Temperature: Mean T max was 47.2 F which is 4.4 above the 1981-2010 normal for the month. This
Display and analysis of weather data from NCDC using ArcGIS
 Display and analysis of weather data from NCDC using ArcGIS Helen M. Cox Associate Professor Geography Department California State University, Northridge and Stephen Krug Graduate Student Geography Department
Colorado State University, Fort Collins, CO Weather Station Monthly Summary Report
 Colorado State University, Fort Collins, CO Weather Station Monthly Summary Report Month: February Year: 2017 Webcam catching a hawk watching over the station. Temperature: Mean T max was 54.4 F which
Champaign-Urbana 2001 Annual Weather Summary
 Champaign-Urbana 2001 Annual Weather Summary ILLINOIS STATE WATER SURVEY 2204 Griffith Dr. Champaign, IL 61820 wxobsrvr@sws.uiuc.edu Maria Peters, Weather Observer January: After a cold and snowy December,
University of Lusaka
 University of Lusaka BSPH 315 Health Mapping & GIS Topic: Background of GIS Content: 1. Aim of the course 2. What do you know about GIS? 3. Difference between geographic data and geographic information
Colorado State University, Fort Collins, CO Weather Station Monthly Summary Report
 Colorado State University, Fort Collins, CO Weather Station Monthly Summary Report Month: January Year: 2019 Temperature: Mean T max was 47.2 F which is 3.0 above the 1981-2010 normal for the month. This
Cambridge International Examinations Cambridge International General Certificate of Secondary Education
 Cambridge International Examinations Cambridge International General Certificate of Secondary Education *86769654* GEOGRAPHY 46/4 Paper 4 Alternative to Coursework May/June 4 Candidates answer on the Question
Climate Regions. Combining Climate Graphs and Köppen s Classification
 Lab 15 Climate Regions Combining knowledge of the global patterns behind the major climatic controls, this lab will teach students how to construct climate graphs and then allow them to explore patterns
Monthly Long Range Weather Commentary Issued: July 18, 2014 Steven A. Root, CCM, President/CEO
 Monthly Long Range Weather Commentary Issued: July 18, 2014 Steven A. Root, CCM, President/CEO sroot@weatherbank.com JUNE 2014 REVIEW Climate Highlights The Month in Review The average temperature for
Population, Landscape and Climate Estimates (PLACE)
") National Aggregates of Geospatial Data Collection: Population, Landscape and Climate Estimates (PLACE) Version II May 8, 2007 Socioeconomic Data and Applications Center (SEDAC) Center for International
National Aggregates of Geospatial Data Collection: Population, Landscape and Climate Estimates (PLACE) Version II May 8, 2007 Socioeconomic Data and Applications Center (SEDAC) Center for International
YACT (Yet Another Climate Tool)? The SPI Explorer
? The SPI Explorer") YACT (Yet Another Climate Tool)? The SPI Explorer Mike Crimmins Assoc. Professor/Extension Specialist Dept. of Soil, Water, & Environmental Science The University of Arizona Yes, another climate tool for
YACT (Yet Another Climate Tool)? The SPI Explorer Mike Crimmins Assoc. Professor/Extension Specialist Dept. of Soil, Water, & Environmental Science The University of Arizona Yes, another climate tool for
New England Climate Indicator Maps
 New England Climate Indicator Maps Maps of New England depicting region-wide change in 26 climate indicators for current conditions compared to end of the century for two different global greenhouse gas
Application of Geographic Information Systems for Government School Sites Selection
 Rs. 3000,00 Application of Geographic Information Systems for Government School Sites Selection by K. D. Nethsiri Jayaweera M.Sc. Library - USJP 1111111111111111 210975 2014 210873 Application of Geographic
Average temperature ( F) World Climate Zones. very cold all year with permanent ice and snow. very cold winters, cold summers, and little rain or snow
 World Climate Zones. very cold all year with permanent ice and snow. very cold winters, cold summers, and little rain or snow") P r e v i e w Look carefully at the climagraph of Mumbai, India. What is the wettest month (or months) in Mumbai? What is the driest month (or months) in Mumbai? What effects might this city s climate
P r e v i e w Look carefully at the climagraph of Mumbai, India. What is the wettest month (or months) in Mumbai? What is the driest month (or months) in Mumbai? What effects might this city s climate
Fire Susceptibility Analysis Carson National Forest New Mexico. Can a geographic information system (GIS) be used to analyze the susceptibility of
 be used to analyze the susceptibility of") 1 David Werth Fire Susceptibility Analysis Carson National Forest New Mexico Can a geographic information system (GIS) be used to analyze the susceptibility of Carson National Forest, New Mexico to forest
1 David Werth Fire Susceptibility Analysis Carson National Forest New Mexico Can a geographic information system (GIS) be used to analyze the susceptibility of Carson National Forest, New Mexico to forest
Historical and Projected Future Climatic Trends in the Great Lakes Region
 Historical and Projected Future Climatic Trends in the Great Lakes Region Jeffrey A. Andresen Dept. of Geography, Environment, and Spatial Sciences Michigan State University Flooding along I-696 Warren,
Regional dry-season climate changes due to three decades of Amazonian deforestation
 In the format provided by the authors and unedited. SUPPLEMENTARY INFORMATION DOI:./NCLIMATE Regional dry-season climate changes due to three decades of Amazonian deforestation Jaya problemkhanna by using
Cape Verde. General Climate. Recent Climate. UNDP Climate Change Country Profiles. Temperature. Precipitation
 UNDP Climate Change Country Profiles C. McSweeney 1, M. New 1,2 and G. Lizcano 1 1. School of Geography and Environment, University of Oxford. 2. Tyndall Centre for Climate Change Research http://country-profiles.geog.ox.ac.uk
GIS Level 2. MIT GIS Services
 GIS Level 2 MIT GIS Services http://libraries.mit.edu/gis Email: gishelp@mit.edu TOOLS IN THIS WORKSHOP - Definition Queries - Create a new field in the attribute table - Field Calculator - Add XY Data
Determination of Urban Runoff Using ILLUDAS and GIS
 Texas A&M University Department of Civil Engineering Instructor: Dr. Francisco Olivera CVEN689 Applications of GIS to Civil Engineering Determination of Urban Runoff Using ILLUDAS and GIS Tae Jin Kim 03.
Anatrytone logan. Species Distribution Model (SDM) assessment metrics and metadata Common name: Delaware Skipper Date: 17 Nov 2017 Code: anatloga
 assessment metrics and metadata Common name: Delaware Skipper Date: 17 Nov 2017 Code: anatloga") Anatrytone logan Species Distribution Model (SDM) assessment metrics and metadata Common name: Delaware Skipper Date: 17 Nov 2017 Code: anatloga fair TSS=0.74 ability to find new sites This SDM incorporates
Anatrytone logan Species Distribution Model (SDM) assessment metrics and metadata Common name: Delaware Skipper Date: 17 Nov 2017 Code: anatloga fair TSS=0.74 ability to find new sites This SDM incorporates
DATA APPLIANCE FOR ARCGIS
 DATA APPLIANCE FOR ARCGIS Data Appliance for ArcGIS Provides Access to Multi-Scale Basemaps Down to Medium Scale Levels Worldwide And Large Scale for Most of the World The Data Appliance includes Several
Nitrogen limitation as a driver of genome size evolution in a group of karst plants
 Supporting information Nitrogen limitation as a driver of genome size evolution in a group of karst plants Ming Kang, Jing Wang, Hongwen Huang Key Laboratory of Plant Resources Conservation and Sustainable
How GIS Can Help With Tribal Safety Planning
 How GIS Can Help With Tribal Safety Planning Thomas A. Horan, PhD Brian Hilton, PhD Arman Majidi, MAIS Center for Information Systems and Technology Claremont Graduate University Goals & Objectives This
Meteorology. Circle the letter that corresponds to the correct answer
 Chapter 3 Worksheet 1 Meteorology Name: Circle the letter that corresponds to the correct answer 1) If the maximum temperature for a particular day is 26 C and the minimum temperature is 14 C, the daily
Monthly Long Range Weather Commentary Issued: APRIL 18, 2017 Steven A. Root, CCM, Chief Analytics Officer, Sr. VP,
 Monthly Long Range Weather Commentary Issued: APRIL 18, 2017 Steven A. Root, CCM, Chief Analytics Officer, Sr. VP, sroot@weatherbank.com MARCH 2017 Climate Highlights The Month in Review The average contiguous
Geospatial Analysis and Optimization Techniques to Select Site for New Business: The Case Study of Washtenaw County, Michigan, USA
 International Journal of Sciences: Basic and Applied Research (IJSBAR) ISSN 2307-4531 (Print & Online) http://gssrr.org/index.php?journal=journalofbasicandapplied ---------------------------------------------------------------------------------------------------------------------------
Climate Trends and Variations Bulletin Winter
 Climate Trends and Variations Bulletin Winter 2014 2015 This bulletin summarizes recent climate data and presents it in a historical context. It first examines the national average temperature for the
Spatial Analyst. By Sumita Rai
 ArcGIS Extentions Spatial Analyst By Sumita Rai Overview What does GIS do? How does GIS work data models Extension to GIS Spatial Analyst Spatial Analyst Tasks & Tools Surface Analysis Surface Creation
2016 Irrigated Crop Production Update
 2016 Irrigated Crop Production Update Mapping Climate Trends and Weather Extremes Across Alberta for the Period 1950-2010 Stefan W. Kienzle Department of Geography University of Lethbridge, Alberta, Canada
Champaign-Urbana 1999 Annual Weather Summary
 Champaign-Urbana 1999 Annual Weather Summary ILLINOIS STATE WATER SURVEY 2204 Griffith Dr. Champaign, IL 61820 wxobsrvr@sws.uiuc.edu Maria Peters, Weather Observer A major snowstorm kicked off the new
Monthly Long Range Weather Commentary Issued: May 15, 2014 Steven A. Root, CCM, President/CEO
 Monthly Long Range Weather Commentary Issued: May 15, 2014 Steven A. Root, CCM, President/CEO sroot@weatherbank.com APRIL 2014 REVIEW Climate Highlights The Month in Review The average temperature for
Physical Features of Monsoon Asia. 192 Unit 7 Teachers Curriculum Institute 60 N 130 E 140 E 150 E 60 E 50 N 160 E 40 N 30 N 150 E.
 50 N 60 E 70 E 80 E 90 E 100 E 60 N 110 E 120 E 130 E 140 E 150 E 50 N 160 E 40 N 40 N 30 N 60 E 30 N 150 E Tropic of Cancer 20 N Tropic of Cancer 20 N 10 N 10 N 0 Equator 0 Equator 10 S 10 S 0 500 1,000
GIS for ChEs Introduction to Geographic Information Systems
 GIS for ChEs Introduction to Geographic Information Systems AIChE Webinar John Cirucci 1 GIS for ChEs Introduction to Geographic Information Systems What is GIS? Tools and Methods Applications Examples
SEPTEMBER 2013 REVIEW
 Monthly Long Range Weather Commentary Issued: October 21, 2013 Steven A. Root, CCM, President/CEO sroot@weatherbank.com SEPTEMBER 2013 REVIEW Climate Highlights The Month in Review The average temperature
Climate Change Impact on Air Temperature, Daily Temperature Range, Growing Degree Days, and Spring and Fall Frost Dates In Nebraska
 EXTENSION Know how. Know now. Climate Change Impact on Air Temperature, Daily Temperature Range, Growing Degree Days, and Spring and Fall Frost Dates In Nebraska EC715 Kari E. Skaggs, Research Associate
Champaign-Urbana 2000 Annual Weather Summary
 Champaign-Urbana 2000 Annual Weather Summary ILLINOIS STATE WATER SURVEY 2204 Griffith Dr. Champaign, IL 61820 wxobsrvr@sws.uiuc.edu Maria Peters, Weather Observer January: January started on a mild note,
ABSTRACT I. INTRODUCTION II. OBJECTIVES
 2017 IJSRSET Volume 3 Issue 1 Print ISSN: 2395-1990 Online ISSN : 2394-4099 Themed Section: Engineering and Technology GIS Based Urban Road Network Analysis in Khartoum Center Mohamed ElAmin Ahmed Babiker,
The Pennsylvania Observer
 The Pennsylvania Observer The Pennsylvania Observer September 16, 2004 Recap of Pennsylvania's weather from August 6 - September 12, 2004. http://pasc.met.psu.edu/pa_climatologist/nl/archive/20040916/sec1.php
The Framework and Application of Geographic Information Systems (GIS)
") The Framework and Application of Geographic Information Systems (GIS) The Framework and Application of Geographic Information Systems (GIS) Part I The Geographic Framework The Geographic Framework Spatial
The Framework and Application of Geographic Information Systems (GIS) The Framework and Application of Geographic Information Systems (GIS) Part I The Geographic Framework The Geographic Framework Spatial
APPLICATIONS OF DOWNSCALING: HYDROLOGY AND WATER RESOURCES EXAMPLES
 APPLICATIONS OF DOWNSCALING: HYDROLOGY AND WATER RESOURCES EXAMPLES Dennis P. Lettenmaier Department of Civil and Environmental Engineering For presentation at Workshop on Regional Climate Research NCAR
ArcGIS for Desktop. ArcGIS for Desktop is the primary authoring tool for the ArcGIS platform.
 ArcGIS for Desktop ArcGIS for Desktop ArcGIS for Desktop is the primary authoring tool for the ArcGIS platform. Beyond showing your data as points on a map, ArcGIS for Desktop gives you the power to manage
About places and/or important events Landmarks Maps How the land is, hills or flat or mountain range Connected to maps World Different countries
 What do you think you know about geography? About places and/or important events Landmarks Maps How the land is, hills or flat or mountain range Connected to maps World Different countries What do you
Python Raster Analysis. Kevin M. Johnston Nawajish Noman
 Python Raster Analysis Kevin M. Johnston Nawajish Noman Outline Managing rasters and performing analysis with Map Algebra How to access the analysis capability - Demonstration Complex expressions and optimization
ENVIRONMENTAL STRUCTURE AND FUNCTION: CLIMATE SYSTEM Vol. I - Objective Empiric Classifications of Earth s Climate - E.I.
 OBJECTIVE EMPIRIC CLASSIFICATIONS OF EARTH S CLIMATE E.I.Khlebnikova Main Geophysical Observatory, St.Petersburg, Russia Keywords: actual evapotranspiration, aridity index, evapotranspiration, humidity
Climate Dataset: Aitik Closure Project. November 28 th & 29 th, 2018
 1 Climate Dataset: Aitik Closure Project November 28 th & 29 th, 2018 Climate Dataset: Aitik Closure Project 2 Early in the Closure Project, consensus was reached to assemble a long-term daily climate
ZUMWALT WEATHER AND CLIMATE ANNUAL REPORT ( )
") ZUMWALT WEATHER AND CLIMATE ANNUAL REPORT (26-29) FINAL DRAFT (9 AUGUST 21) J.D. HANSEN 1, R.V. TAYLOR 2, AND V.S. JANSEN 3 INTRODUCTION The Zumwalt Prairie in northeastern Oregon is a unique grassland
ZUMWALT WEATHER AND CLIMATE ANNUAL REPORT (26-29) FINAL DRAFT (9 AUGUST 21) J.D. HANSEN 1, R.V. TAYLOR 2, AND V.S. JANSEN 3 INTRODUCTION The Zumwalt Prairie in northeastern Oregon is a unique grassland
Applying Earth System Forecasts For Climate Change To Inform Conservation Planning Of The East African Great Lakes
 Applying Earth System Forecasts For Climate Change To Inform Conservation Planning Of The East African Great Lakes S. Asefi, D. Lawrence, P. Lawrence, A. Seimon, S. Talbot 1- University Of Virginia Department
Guide to Frontier Weather Graphics and Data Files
 Guide to Frontier Weather Graphics and Data Files This document provides a listing of all weather graphics and data files that are available as of June 2012 along with file location paths on the Frontier
ANSWER KEY. Part I: Weather and Climate. Lab 16 Answer Key. Explorations in Meteorology 72
 ANSWER KEY Part I: Weather and Climate Table 2 lists the maximum and minimum temperatures (in F) and precipitation (in inches) for every day during April 2003 at Fairbanks, Alaska. You will compare your
EVALUATION OF ALGORITHM PERFORMANCE 2012/13 GAS YEAR SCALING FACTOR AND WEATHER CORRECTION FACTOR
 EVALUATION OF ALGORITHM PERFORMANCE /3 GAS YEAR SCALING FACTOR AND WEATHER CORRECTION FACTOR. Background The annual gas year algorithm performance evaluation normally considers three sources of information
Marche Region Climate Analysis by Danilo Tognetti 1
 Marche Region. 2016 Climate Analysis by Danilo Tognetti 1 With the contribution of eight consecutive high monthly temperature records set from January to August, and the remainder of the months ranking
The Weather Wire. Current Colorado Snowpack. Contents:
 The Weather Wire January 2019 Volume 26 Number 1 Contents: Current Colorado Snowpack Denver Snowfall Since 1999-2000 Denver 2018 Climate Review Drought Monitor December Summary/Statistics January Preview
(Severe) Thunderstorms and Climate HAROLD BROOKS NOAA/NSSL
 Thunderstorms and Climate HAROLD BROOKS NOAA/NSSL") (Severe) Thunderstorms and Climate HAROLD BROOKS NOAA/NSSL HAROLD.BROOKS@NOAA.GOV Big questions How and why are weather hazards distributed? Are things changing in time and will they? Begin with thunderstorm
(Severe) Thunderstorms and Climate HAROLD BROOKS NOAA/NSSL HAROLD.BROOKS@NOAA.GOV Big questions How and why are weather hazards distributed? Are things changing in time and will they? Begin with thunderstorm
Geography 281 Map Making with GIS Project Four: Comparing Classification Methods
 Geography 281 Map Making with GIS Project Four: Comparing Classification Methods Thematic maps commonly deal with either of two kinds of data: Qualitative Data showing differences in kind or type (e.g.,
Weather History on the Bishop Paiute Reservation
 Weather History on the Bishop Paiute Reservation -211 For additional information contact Toni Richards, Air Quality Specialist 76 873 784 toni.richards@bishoppaiute.org Updated 2//214 3:14 PM Weather History
Remote Sensing Geographic Information Systems Global Positioning Systems
 Remote Sensing Geographic Information Systems Global Positioning Systems Assessing Seasonal Vegetation Response to Drought Lei Ji Department of Geography University of Nebraska-Lincoln AVHRR-NDVI: July
The xmacis Userʼs Guide. Keith L. Eggleston Northeast Regional Climate Center Cornell University Ithaca, NY
 The xmacis Userʼs Guide Keith L. Eggleston Northeast Regional Climate Center Cornell University Ithaca, NY September 22, 2004 Updated September 9, 2008 The xmacis Userʼs Guide The xmacis program consists
Regional Centre for Mapping of Resources for Development (RCMRD), Nairobi, Kenya
, Nairobi, Kenya") Regional Centre for Mapping of Resources for Development (RCMRD), Nairobi, Kenya Introduction to GIS (2 weeks: 10 days) Intakes: 8 th January, 6 th February, 5th March, 3 rd. April 9 th, May 7 th, June
Regional Centre for Mapping of Resources for Development (RCMRD), Nairobi, Kenya Introduction to GIS (2 weeks: 10 days) Intakes: 8 th January, 6 th February, 5th March, 3 rd. April 9 th, May 7 th, June
Your web browser (Safari 7) is out of date. For more security, comfort and. the best experience on this site: Update your browser Ignore
 is out of date. For more security, comfort and. the best experience on this site: Update your browser Ignore") Your web browser (Safari 7) is out of date. For more security, comfort and Activityengage the best experience on this site: Update your browser Ignore Introduction to GIS What is a geographic information
Your web browser (Safari 7) is out of date. For more security, comfort and Activityengage the best experience on this site: Update your browser Ignore Introduction to GIS What is a geographic information
Web GIS Based Disaster Portal Project ESRI INDIA
 Web GIS Based Disaster Portal Project ESRI INDIA Contents Requirements Overview Product Technology Used KSNDMC Application Architecture Tool Developed Benefits for the End User Problems faced during implementation
Marine Transportation and Ocean Use
 Marine Transportation and Ocean Use Data Needs for Multi-Disciplinary Long-Term Planning 4 th Biennial TRB-CMTS Research and Development Conference Matt Campo Rutgers University 6/22/2016 Overview What
Some preliminary results from Climex and Maxent distribution modelling of Drosophila suzukii. Version 2.
 Some preliminary results from Climex and Maxent distribution modelling of Drosophila suzukii. Version 2. Changes from Version 1: Oregon locations where D. suzukii is found now georeferenced. Maxent model
Regional Centre for Mapping of Resources for Development (RCMRD), Nairobi, Kenya
, Nairobi, Kenya") Regional Centre for Mapping of Resources for Development (RCMRD), Nairobi, Kenya Introduction GIS ( 2 weeks: 10 days) Intakes: 7 th Jan, 4 th Feb,4 th March, 1 st April 6 th May, 3 rd June, 1 st July,
Regional Centre for Mapping of Resources for Development (RCMRD), Nairobi, Kenya Introduction GIS ( 2 weeks: 10 days) Intakes: 7 th Jan, 4 th Feb,4 th March, 1 st April 6 th May, 3 rd June, 1 st July,
Promoting Rainwater Harvesting in Caribbean Small Island Developing States Water Availability Mapping for Grenada Preliminary findings
 Promoting Rainwater Harvesting in Caribbean Small Island Developing States Water Availability Mapping for Grenada Preliminary findings National Workshop Pilot Project funded by The United Nations Environment
September 2018 Volume: 01, No: 9. Office of the Maryland State Climatologist. Department of Atmospheric and Oceanic Science
 Office of the Maryland State Climatologist Department of Atmospheric and Oceanic Science 4254 Stadium Dr, College Park, MD 20742 www.atmos.umd.edu/~climate PRECIPITATION Based on the National Centers for
Current Climate Trends and Implications
 Current Climate Trends and Implications Dr. Mark Seeley Professor emeritus Department of Soil, Water, and Climate University of Minnesota St Paul, MN 55108 Crop Insurance Conference September 12, 2018
Regional Climate Change Effects Report
 Regional Climate Change Effects Report Aug 6, 2010 Robert Kafalenos, FHWA U.S. Department of Transportation Federal Highway Administration 1 Past Performance does not guarantee future returns Past weather
ARUBA CLIMATOLOGICAL SUMMARY 2014 PRECIPITATION
 ARUBA CLIMATOLOGICAL SUMMARY 2014 PRECIPITATION The total amount of rainfall recorded at Reina Beatrix International Airport for the year 2014 was 309.2 mm. This is 34.4 % below normal ( Figure 1 ). During
Southern Africa Growing Season : Recovery Hampered by Floods and Drought?
 Southern Africa Growing Season 2016-2017: Recovery Hampered by Floods and Drought? HIGHLIGHTS Good performance of the current growing season (October 2016 - April 2017) is badly needed for Southern Africa
October Precipitation Statistics (124 Years) Rank: Figure 2: Historical October precipitation time series for Maryland.
 Rank: Figure 2: Historical October precipitation time series for Maryland.") PRECIPITATION Based on the National Centers for Environmental Information (NCEI), Office of the Maryland State the statewide total October precipitation was 3.88 inches, which was 1.01 inches less than
PRECIPITATION Based on the National Centers for Environmental Information (NCEI), Office of the Maryland State the statewide total October precipitation was 3.88 inches, which was 1.01 inches less than
GIS and Remote Sensing
 Spring School Land use and the vulnerability of socio-ecosystems to climate change: remote sensing and modelling techniques GIS and Remote Sensing Katerina Tzavella Project Researcher PhD candidate Technology
Detecting Climate Change through Means and Extremes
 Detecting Climate Change through Means and Extremes New Mexico Supercomputing Challenge Final Report April 6, 2016 Team 55 Los Alamos Middle School Team Member: Lillian Petersen Teacher: Adam Drew Mentor:
THE WINTER OF JUST HOW WEIRD WAS IT EXACTLY?
 Courtesy Reuters Buffalo New York THE WINTER OF 2013-2014 JUST HOW WEIRD WAS IT EXACTLY? Eyad Atallah and John Gyakum McGill University Some Headlines Certainly for large portions of southern Canada and
Regional Centre for Mapping of Resources for Development (RCMRD), Nairobi, Kenya. Introduction GIS ( 2 weeks: 10 days)
, Nairobi, Kenya. Introduction GIS ( 2 weeks: 10 days)") Regional Centre for Mapping of Resources for Development (RCMRD), Nairobi, Kenya Introduction GIS ( 2 weeks: 10 days) Intakes: 8 th Jan, 6 th Feb,5 th March, 3 rd April 9 th, May 7 th, June 4 th, July
Regional Centre for Mapping of Resources for Development (RCMRD), Nairobi, Kenya Introduction GIS ( 2 weeks: 10 days) Intakes: 8 th Jan, 6 th Feb,5 th March, 3 rd April 9 th, May 7 th, June 4 th, July
2 Precipitation and Evaporation
 Zone 7 Water Agency 2.1 Program Description 2 Precipitation and Evaporation This section describes Zone 7's Climatological Monitoring Program which tracks rainfall and evaporation in the Valley. Zone 7
Climatographs. Suggested Activity. Conduct an Investigation 1-1C on page 30. Climatograph Tofino, British Columbia, 49ºN. Average Precipitation (mm)
") BCS10_C01_F 3/11/08 12:44 P Page 16 Climatographs Conduct an Investigation 1-1C on page 30 onth verage Precipitation (mm) verage Temperature ( C) F S O N D 436 382 3 249 16 138 77 94 134 340 47 462 4 6
BCS10_C01_F 3/11/08 12:44 P Page 16 Climatographs Conduct an Investigation 1-1C on page 30 onth verage Precipitation (mm) verage Temperature ( C) F S O N D 436 382 3 249 16 138 77 94 134 340 47 462 4 6
CAS GE 365 Introduction to Geographical Information Systems. The Applications of GIS are endless
 Spring 2007 CAS GE 365 Introduction to Geographical Information Systems Boston University Department of Geography and Environment The Applications of GIS are endless images from www.esri.com CAS GE 365
BIOLOGY EOC Georgia Milestones Guide. By Flavia Johnson and Patsy Kraj
 BIOLOGY EOC 2018 Georgia Milestones Guide By Flavia Johnson and Patsy Kraj WHAT S THE EOC?! EOC stands for End Of Course and is also know as the Georgia Milestones End-of-Course Assessments The EOC is
Global climate model scenarios downscaled for Canada. David Price Northern Forestry Centre, Edmonton CIF e-lecture, 14 March 2012
 Global climate model scenarios downscaled for Canada David Price Northern Forestry Centre, Edmonton CIF e-lecture, 14 March 2012 Acknowledgements Slide 2 Dan McKenney Marty Siltanen Pia Papadopol Kevin
GED 554 IT & GIS INTRODUCTION TO THE COURSE CHAPTER 1
 GED 554 IT & GIS INTRODUCTION TO THE COURSE CHAPTER 1 March 1, 2013 Lines before starting class 1. Initial Introductions 2. Usage of the building 3. Assistance 4. Timetable 5. Curriculum 6. Introduction
Resilience potential of the Ethiopian coffee sector under climate change
 In the format provided by the authors and unedited. SUPPLEMENTARY INFORMATION VOLUME: 3 ARTICLE NUMBER: 17081 Resilience potential of the Ethiopian coffee sector under climate change Justin Moat 1,2 *,
The Climate of Grady County
 The Climate of Grady County Grady County is part of the Central Great Plains, encompassing some of the best agricultural land in Oklahoma. Average annual precipitation ranges from about 33 inches in northern
Climate Downscaling 201
 Climate Downscaling 201 (with applications to Florida Precipitation) Michael E. Mann Departments of Meteorology & Geosciences; Earth & Environmental Systems Institute Penn State University USGS-FAU Precipitation
By Abdulraheem M.Baabbad. Supervisor: Dr.Bager Al-Ramadan
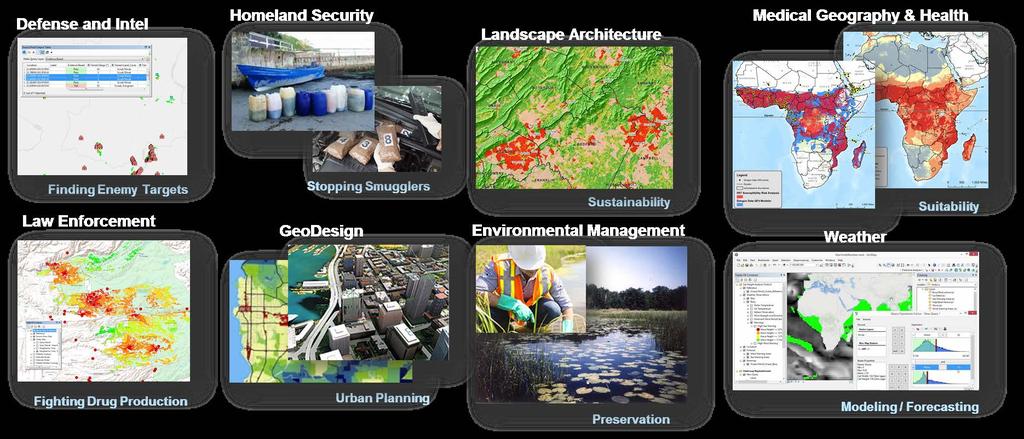
 By Abdulraheem M.Baabbad Supervisor: Dr.Bager Al-Ramadan OUTLINE Health GIS Health GIS Application Emergency Vehicles Allocation: A case study Health GIS Innovative structureto access,integrate,visualize
Geography for the 2020 Round of Census
 Boundaries Key Census Data EA Id Population Male Female EA Id Area EA Id Num HH Avg HH size Geography for the 2020 Round of Census Linda Peters, Esri lpeters@esri.com Integration of Statistical and Geospatial
Use of Geospatial data for disaster managements
 Use of Geospatial data for disaster managements Source: http://alertsystemsgroup.com Instructor : Professor Dr. Yuji Murayama Teaching Assistant : Manjula Ranagalage What is GIS? A powerful set of tools
A summary of the weather year based on data from the Zumwalt weather station
 ZUMWALT PRAIRIE WEATHER 2016 A summary of the weather year based on data from the Zumwalt weather station Figure 1. An unusual summer storm on July 10, 2016 brought the second-largest precipitation day
Spatial Variation in Local Road Pedestrian and Bicycle Crashes
 2015 Esri International User Conference July 20 24, 2015 San Diego, California Spatial Variation in Local Road Pedestrian and Bicycle Crashes Musinguzi, Abram, Graduate Research Assistant Chimba,Deo, PhD.,
Monthly Long Range Weather Commentary Issued: APRIL 25, 2016 Steven A. Root, CCM, Chief Analytics Officer, Sr. VP, sales
 Monthly Long Range Weather Commentary Issued: APRIL 25, 2016 Steven A. Root, CCM, Chief Analytics Officer, Sr. VP, sales sroot@weatherbank.com MARCH 2016 Climate Highlights The Month in Review The March
Review Materials. Student Guide March 11, Reassessment Items
 Review Materials Student Guide March 11, 2011 Exams Covered: 4th Grade Math Quarter 2 Assessment - Dec. 15, 4th Grade Qrt 3 Math Assessment - Marh 2011, Qtr. 1 Assessment - October Advanced Options: Grades:
Regional Centre for Mapping of Resources for Development (RCMRD), Nairobi, Kenya. Introduction GIS (2 weeks: 10 days)
, Nairobi, Kenya. Introduction GIS (2 weeks: 10 days)") Regional Centre for Mapping of Resources for Development (RCMRD), Nairobi, Kenya Introduction GIS (: 10 days) Intake Dates: 9 th Jan, 6 th Feb, 6 th Mar, 3 rd April, 8 th May, 5 th June, 3 rd July, 2017
Regional Centre for Mapping of Resources for Development (RCMRD), Nairobi, Kenya Introduction GIS (: 10 days) Intake Dates: 9 th Jan, 6 th Feb, 6 th Mar, 3 rd April, 8 th May, 5 th June, 3 rd July, 2017
Arizona Climate Summary
 Arizona Climate Summary April 2014 Summary of conditions for March 2014 March 2014 Temperature and Precipitation Summary March 1 st 16 th : We started off the month of March with a significant precipitation
The Weather Wire. Current Colorado Snowpack. Contents:
 The Weather Wire December 2018 Volume 25 Number 12 Contents: Current Colorado Snowpack Drought Monitor November Summary/Statistics December Preview Snowfall Totals Current Colorado Snowpack Although snowfall
CAPE FARM MAPPER - an integrated spatial portal
 CAPE FARM MAPPER - an integrated spatial portal Skukuza Dr Mike Wallace June 2017 Overview of GIS applications in WCDoA Spatial information and technology has become indispensable across a wide range of
Colorado CoCoRaHS. Colorado CoCoRaHS. Because Every Drop Counts! November 2014 Volume 2, Issue 11
 U.S. PRECIPITATION (% OF AVERAGE) LOOKING BACK AT OCTOBER 2014 October was a fairly dry month for much of the nation with the exception of the Pacific Northwest, portions of New England and the Tennessee