Eva Strand and Leona K. Svancara Landscape Dynamics Lab Idaho Coop. Fish and Wildlife Research Unit
|
|
|
- James Sparks
- 5 years ago
- Views:
Transcription
1 More on Habitat Models Eva Strand and Leona K. Svancara Landscape Dynamics Lab Idaho Coop. Fish and Wildlife Research Unit


2 Area of occupancy Range - spatial limits within which a species can be found Distribution - finer-scale depiction of a species spatial patterning Habitat - combination of resources and conditions that promote occupancy, survival, and reproduction Morrison and Hall 2002

3 Modeling Approaches Deductive and Inductive modeling approaches
4 Methods of Reasoning Theory Hypothesis Observation Confirmation Deduction Reasoning Theory Hypothesis Pattern Observation Induction Reasoning
5 Lambing Habitat Model degrees aspect degrees slope <=1000m from streams >=2 ha (20,000 m2) NLCD = 12,31,33,51,71
6 Deductive Models
7 Properties of Deduction In a valid deductive argument, all of the content of the conclusion is present If the premises are true, the conclusion must be true Deductive validity is an all-or-nothing matter; Deductive validity is an all or nothing matter; validity does not come in degrees. An argument is totally valid, or it is invalid.

8 Inductive Model? Probability of use = f ( aspect, slope, distance to water,..)
9 Inductive Models
10 Properties of Induction The conclusion of an inductive argument has content that goes beyond the content of its premises A correct inductive argument may have true premises and a false conclusion. Induction is not necessarily truth preserving New premises may completely undermine a strong inductive argument Inductive arguments come in different degrees of strength
11 Examples of Models Generalized Linear Model (GLM) Generalized Additive Model (GAM) Classification and Regression Tree (CART) Minimum Distance Model Domain Modelling Domain (DOMAIN) Genetic Algorithm for Rule-set Production (GARP) Ecological Niche Factor Analysis (ENFA) Maximum Entropy Modeling


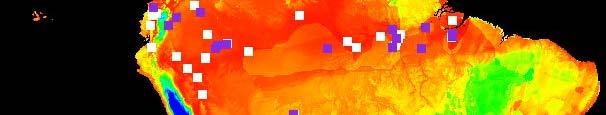
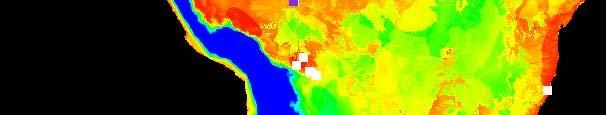

12 Output from MAXENT ton.edu/~schapire/m axent/
13 ISSUES OF SCALE AND ACCURACY Eva Strand and Leona K. Svancara Landscape Dynamics Lab Idaho Coop. Fish and Wildlife Research Unit


14 Map Scale Craig Mountain State of Idaho North America Fine scale Mid scale Broad scale
15 Effects of Scale USGS standard formats Raster 1: 24, m 1: 100, m 1: 250, m 40 ft i t bl 40 ft is an acceptable error for the USGS 1:24,000 scale topo maps.
16 1:24k topo with streams at 1:100k and 1:250k
17 Dworshak Dam Landsat 7 imagery at 30 m resolution Aster imagery at 15 m resolution
18 U of I Campus SPOT imagery 10 m resolution Orthophoto at 1 m resolution


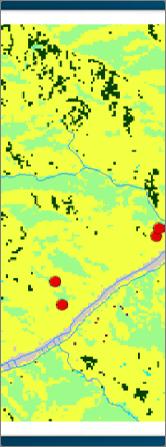
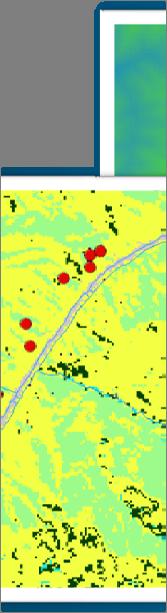
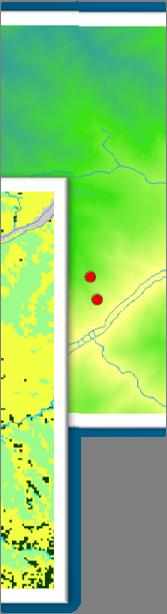
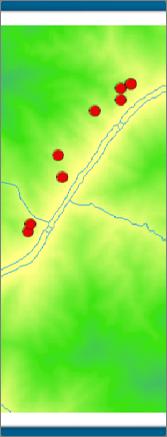
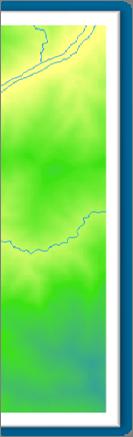
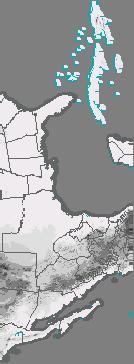
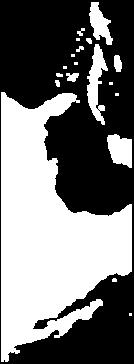
19 Smith Creek Watershed MMU = 1 ha Riparian 110 ha


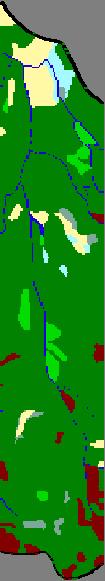
20 Smith Creek Watershed Grid 30 m cell size Riparian 110 ha
21 Smith Creek Watershed Grid 100 m cell size Riparian 104 ha

22 Smith Creek Watershed Grid 500 m cell size Riparian 104 ha
23 How does the scale of the data affect your analysis? Habitat area overestimated 30 m pixels 90 m pixels Habitat area underestimated or lost
24 Accuracy Assessments 1980 s -- Models and model predictions independent first tested against data s -- Increased attention given to management spotted owl) assessments of models developed in a context. (eg Alldredge and Ratti 1986, Verner et al 1986, Thomas and Taylor 1990, Scott et al 2002
25 Model Errors Omission : species was detected but not predicted (Type II error) Commission: species was predicted but not detected (Type I error) Actual Error: model is inappropriate p for the species Apparent Error: incomplete surveys Leona K. Svancara
26 Testing Accuracy Actual Present Absent Present Model Absent Correct Omission Present (OM) (CP) Correct Commission Absent (CO) (CA) %O Omission i = %C Commission i = OM / (CP + OM) CO / (CP + CO)
27 Errors Causes of False Commission i Failure to sample appropriate spatial or temporal strata Inadequate q sampling effort Univ of Idaho Ineffective or inappropriate survey technique
28 Model Errors Statistical models derived from field data tend to under predict species occurrences. Habitat association models derived from literature and expert review tend to over predict. Hepinstall et al 2002 Predicting Species Occurrences
29 Accuracy & Sample Size Reliability y asymptotes around 1000 independent observations Small sample sizes cause instability At small sample sizes, apparent error can account for 55% of commission error Univ of Idaho Scott et al, eds Predicting Species Occurrences
30 Small sample sizes preclude reliable estimates of accuracy of habitat relationship models for rare species. Karl et al 2002, Predicting Species Occurrences: Issues of Accuracy and Scale Univ of Idaho
31 Useful Criteria Precision ability to replicate system parameters Accuracy how well it reflects reality Generality ability to represent a range of systems Sensitivity parameters match real-world variables Adaptability possibilities for future development
32 Accuracy Assessment An Example


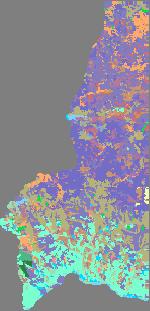
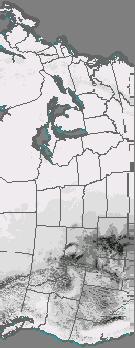
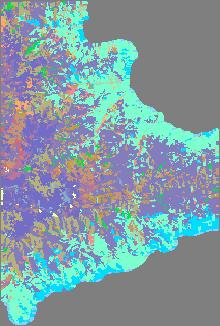
33 Landsat 5 imagery, July 1992 Current Creek Hurry Back Creek Succession in a Western Juniper / Sagebrush Steppe Mosaic Smith Creek Red Canyon Creek


34 Accuracy can be assessed using GPS ground control points


 62.5 45.55 60.00 57.1 13.33 28.9 22.6 Producer s accuracy 37.5 54.5 40.0 42.")
35 Assessment Map classification from Landsat TM imagery Low sage Mtn big sage Ground classification, GPS points Stand Open Young initiat. young multistory woodl woodl Old multistrata Junipermahog -any Sum Com missi on error Low sagebrush Mountain big sagebrush Stand initiation woodland Open young woodland User accuracy Young multi-story woodland Old multi-strata woodland Juniper-mountainmahogany Sum Omission error Error (%) Producer s accuracy Error (%) Landsat TM Aerial photo Total points: Accurate points: Percent accuracy: Kappa statistic:
36 Errors in Assessing Accuracy Variation in classifying data on the ground Incorrect location due to GPS errors Changes in vegetation between map creation and collection o of ground control o data Variation in interpretation of aerial photos Ground control points were taken in an area smaller than the minimum mapping unit of the map
37 APPROPRIATE QUESTIONS & EXPECTATIONS
38 What data should I use? Are you Comparing the use of grass vs shrub vegetation? Or Bunchgrass vs Yellow Star Thistle? L ki f l h? O Looking for seasonal change? Or change over decades?
39 At what scale? That depends on The scale perceived by the species The scope of the question Data availability Knowledge about a species does not always match available GIS & RS data.
40 Broad NALC SPOT IKONOS LandSat Fine Hyperspectral LIDAR Specific General Question
41 How accurate is it? Polygons are not homogenous units and lines are not real Pixel vs Point GIS & RS generally squeeze a round peg into a square hole.


42 Some Thoughts Models should be viewed as testable hypotheses not the truth Know what level of error you re willing to accept (errors multiply)
NR402 GIS Applications in Natural Resources. Lesson 9: Scale and Accuracy
 NR402 GIS Applications in Natural Resources Lesson 9: Scale and Accuracy 1 Map scale Map scale specifies the amount of reduction between the real world and the map The map scale specifies how much the
Looking at the big picture to plan land treatments
 Looking at the big picture to plan land treatments Eva Strand Department of Rangeland Ecology and Management University of Idaho evas@uidaho.edu, http://www.cnr.uidaho.edu/range Why land treatment planning?
One of the many strengths of a GIS is that you can stack several data layers on top of each other for visualization or analysis. For example, if you
 One of the many strengths of a GIS is that you can stack several data layers on top of each other for visualization or analysis. For example, if you overlay a map of the habitat for an endangered species
Spatial Process VS. Non-spatial Process. Landscape Process
 Spatial Process VS. Non-spatial Process A process is non-spatial if it is NOT a function of spatial pattern = A process is spatial if it is a function of spatial pattern Landscape Process If there is no
ArcGIS Role in Maxent Modeling
 ArcGIS Role in Maxent Modeling Christopher Woods Christopher.R.Woods @leidos.com Carpinteria, CA Modeling Remember that all models are wrong; the practical question is how wrong do they have to be to not
Describing Greater sage-grouse (Centrocercus urophasianus) Nesting Habitat at Multiple Spatial Scales in Southeastern Oregon
 Nesting Habitat at Multiple Spatial Scales in Southeastern Oregon") Describing Greater sage-grouse (Centrocercus urophasianus) Nesting Habitat at Multiple Spatial Scales in Southeastern Oregon Steven Petersen, Richard Miller, Andrew Yost, and Michael Gregg SUMMARY Plant
Describing Greater sage-grouse (Centrocercus urophasianus) Nesting Habitat at Multiple Spatial Scales in Southeastern Oregon Steven Petersen, Richard Miller, Andrew Yost, and Michael Gregg SUMMARY Plant
A Small Migrating Herd. Mapping Wildlife Distribution 1. Mapping Wildlife Distribution 2. Conservation & Reserve Management
 A Basic Introduction to Wildlife Mapping & Modeling ~~~~~~~~~~ Rev. Ronald J. Wasowski, C.S.C. Associate Professor of Environmental Science University of Portland Portland, Oregon 8 December 2015 Introduction
Development of statewide 30 meter winter sage grouse habitat models for Utah
 Development of statewide 30 meter winter sage grouse habitat models for Utah Ben Crabb, Remote Sensing and Geographic Information System Laboratory, Department of Wildland Resources, Utah State University
Mapping Willow Distribution Across the Northern Range of Yellowstone National Park
 Mapping Willow Distribution Across the Northern Range of Yellowstone National Park 2004 Final Report Jeremy P. Shive and Robert L. Crabtree Yellowstone Ecological Research Center April 1, 2004 Table of
Bryan F.J. Manly and Andrew Merrill Western EcoSystems Technology Inc. Laramie and Cheyenne, Wyoming. Contents. 1. Introduction...
 Comments on Statistical Aspects of the U.S. Fish and Wildlife Service's Modeling Framework for the Proposed Revision of Critical Habitat for the Northern Spotted Owl. Bryan F.J. Manly and Andrew Merrill
Eva Strand CNR Remote Sensing and GIS Lab
 Eva Strand CNR Remote Sensing and GIS Lab Habitat map Available habitat Habitat Hectares Percent Habitat 1 38079.9 55.1 Habitat 2 2740.5 4.0 Habitat 3 2692.8 3.9 Habitat 4 24533.1 35.5 Habitat 5 1072.8
NR402 GIS Applications in Natural Resources
 NR402 GIS Applications in Natural Resources Lesson 2 - Vector Data Coordinate-based data structures commonly used to represent map objects. Each object is represented as a list of X,Y coordinates Examples
Geospatial Data, Services, and Products. National Surveying, mapping and geospatial conference
 Geospatial Data, Services, and Products Federal Programs -- USDA NRCS National Surveying, mapping and geospatial conference March 15, 2016 NRCS Applications using Geosaptial Products & Services Field
Resolving habitat classification and structure using aerial photography. Michael Wilson Center for Conservation Biology College of William and Mary
 Resolving habitat classification and structure using aerial photography Michael Wilson Center for Conservation Biology College of William and Mary Aerial Photo-interpretation Digitizing features of aerial
Wetland Mapping. Wetland Mapping in the United States. State Wetland Losses 53% in Lower US. Matthew J. Gray University of Tennessee
 Wetland Mapping Caribbean Matthew J. Gray University of Tennessee Wetland Mapping in the United States Shaw and Fredine (1956) National Wetlands Inventory U.S. Fish and Wildlife Service is the principle
Data Fusion and Multi-Resolution Data
 Data Fusion and Multi-Resolution Data Nature.com www.museevirtuel-virtualmuseum.ca www.srs.fs.usda.gov Meredith Gartner 3/7/14 Data fusion and multi-resolution data Dark and Bram MAUP and raster data Hilker
Use of Thematic Mapper Satellite Imagery, Hemispherical Canopy Photography, and Digital Stream Lines to Predict Stream Shading
 Use of Thematic Mapper Satellite Imagery, Hemispherical Canopy Photography, and Digital Stream Lines to Predict Stream Shading David Nagel GIS Analyst Charlie Luce Research Hydrologist Bárbara Gutiérrez
Note: This validation is designed to test the accuracy of the mapping process (i.e. the map models) not the accuracy of the map itself.
 not the accuracy of the map itself.") Ecological Classes and Criteria for Assigning Fuzzy Set Values Fuzzy set validation assessment is being used to evaluate land cover mapping by comparing the label of reference point to map. The validation
Ecological Classes and Criteria for Assigning Fuzzy Set Values Fuzzy set validation assessment is being used to evaluate land cover mapping by comparing the label of reference point to map. The validation
The Use of GIS in Habitat Modeling
 Amy Gottfried NRS 509 The Use of GIS in Habitat Modeling In 1981, the U.S. Fish and Wildlife Service established a standard process for modeling wildlife habitats, the Habitat Suitability Index (HSI) and
REMOTE SENSING ACTIVITIES. Caiti Steele
 REMOTE SENSING ACTIVITIES Caiti Steele REMOTE SENSING ACTIVITIES Remote sensing of biomass: Field Validation of Biomass Retrieved from Landsat for Rangeland Assessment and Monitoring (Browning et al.,
Errors in GIS. Errors in GIS. False: If its digital, it must be correct, or at least more correct than a manual product
 Errors in GIS GIS is like children s art..? Errors in GIS False: If its digital, it must be correct, or at least more correct than a manual product Data errors are common in GIS: Errors from (pre-digital)
Introduction to Geographic Information Systems (GIS): Environmental Science Focus
: Environmental Science Focus") Introduction to Geographic Information Systems (GIS): Environmental Science Focus September 9, 2013 We will begin at 9:10 AM. Login info: Username:!cnrguest Password: gocal_bears Instructor: Domain: CAMPUS
Introduction to Geographic Information Systems (GIS): Environmental Science Focus September 9, 2013 We will begin at 9:10 AM. Login info: Username:!cnrguest Password: gocal_bears Instructor: Domain: CAMPUS
Quality and Coverage of Data Sources
 Quality and Coverage of Data Sources Objectives Selecting an appropriate source for each item of information to be stored in the GIS database is very important for GIS Data Capture. Selection of quality
Remote detection of giant reed invasions in riparian habitats: challenges and opportunities for management planning
 Remote detection of giant reed invasions in riparian habitats: challenges and opportunities for management planning Maria do Rosário Pereira Fernandes Forest Research Centre, University of Lisbon Number
What Do You See? FOR 274: Forest Measurements and Inventory. Area Determination: Frequency and Cover
 What Do You See? Message of the Day: Many options exist to determine the size, area, or extent of a feature on a landscape FOR 274: Forest Measurements and Inventory Lecture 7: Measures of Land Area Frequency
The Road to Data in Baltimore
 Creating a parcel level database from high resolution imagery By Austin Troy and Weiqi Zhou University of Vermont, Rubenstein School of Natural Resources State and local planning agencies are increasingly
USE OF RADIOMETRICS IN SOIL SURVEY
 USE OF RADIOMETRICS IN SOIL SURVEY Brian Tunstall 2003 Abstract The objectives and requirements with soil mapping are summarised. The capacities for different methods to address these objectives and requirements
Watershed concepts for community environmental planning
 Purpose and Objectives Watershed concepts for community environmental planning Dale Bruns, Wilkes University USDA Rural GIS Consortium May 2007 Provide background on basic concepts in watershed, stream,
UNCERTAINTY AND ERRORS IN GIS
 Christos G. Karydas,, Dr. xkarydas@agro.auth.gr http://users.auth.gr/xkarydas Lab of Remote Sensing and GIS Director: Prof. N. Silleos School of Agriculture Aristotle University of Thessaloniki, GR 1 UNCERTAINTY
Managing Grizzly Bear Data. ESRI 2009 International User Conference, San Diego, California Presented by: Julie Duval, July 15, 2009
 Managing Grizzly Bear Data ESRI 2009 International User Conference, San Diego, California Presented by: Julie Duval, July 15, 2009 Agenda 1) Overview of the Foothills Research Institute 2) Grizzly Bear
The Attribute Accuracy Assessment of Land Cover Data in the National Geographic Conditions Survey
 The Attribute Accuracy Assessment of Land Cover Data in the National Geographic Conditions Survey Xiaole Ji a, *, Xiao Niu a Shandong Provincial Institute of Land Surveying and Mapping Jinan, Shandong
Appendix J Vegetation Change Analysis Methodology
 Appendix J Vegetation Change Analysis Methodology Regional Groundwater Storage and Recovery Project Draft EIR Appendix-J April 2013 APPENDIX J- LAKE MERCED VEGETATION CHANGE ANALYSIS METHODOLOGY Building
Coastal Riparian Buffers Analysis
 Final Report To the EPA Office of Long Island Sound 1. Title Coastal Riparian Buffers Analysis EPA Grant Number: LI 97128801-0 2. Grantee Organization and Contact Name: Emily Wilson, Geospatial Research
Course overview. Grading and Evaluation. Final project. Where and When? Welcome to REM402 Applied Spatial Analysis in Natural Resources.
 Welcome to REM402 Applied Spatial Analysis in Natural Resources Eva Strand, University of Idaho Map of the Pacific Northwest from http://www.or.blm.gov/gis/ Where and When? Lectures Monday & Wednesday
Digital Elevation Models (DEM)
") Digital Elevation Models (DEM) Digital representation of the terrain surface enable 2.5 / 3D views Rule #1: they are models, not reality Rule #2: they always include some errors (subject to scale and data
Digital Elevation Models (DEM) Digital representation of the terrain surface enable 2.5 / 3D views Rule #1: they are models, not reality Rule #2: they always include some errors (subject to scale and data
REVEGETATION TRENDS AND LESSONS MONTANA COAL
 REVEGETATION TRENDS AND LESSONS MONTANA COAL The secret of managing is to keep the guys who hate you away from the guys who are undecided. Casey Stengel Can't anybody here play this game? Casey Stengel
RESEARCH METHODOLOGY
 III. RESEARCH METHODOLOGY 3.1. Time and Research Area The field work was taken place in primary forest around Toro village in Lore Lindu National Park, Indonesia. The study area located in 120 o 2 53 120
Data Quality and Uncertainty
 Data Quality and Uncertainty The power of GIS analysis is based on the assembly of layers of data, but as data layers increase, errors multiply - quality decreases. Garbage in, garbage out. High quality
Alaska Center for Climate Assessment and Policy
 Alaska Center for Climate Assessment and Policy Welcome to the webinar: CONNECTING ALASKA LANDSCAPES INTO THE FUTURE December 8, 2009 10 AM (ADT) By Nancy Fresco, Scenarios Network for Alaska Planning
What are the five components of a GIS? A typically GIS consists of five elements: - Hardware, Software, Data, People and Procedures (Work Flows)
") LECTURE 1 - INTRODUCTION TO GIS Section I - GIS versus GPS What is a geographic information system (GIS)? GIS can be defined as a computerized application that combines an interactive map with a database
LECTURE 1 - INTRODUCTION TO GIS Section I - GIS versus GPS What is a geographic information system (GIS)? GIS can be defined as a computerized application that combines an interactive map with a database
The Future of Soil Mapping using LiDAR Technology
 The Future of Soil Mapping using LiDAR Technology Jessica Philippe Soil Scientist/GIS Specialist March 24, 2016 Natural Resources Conservation Service Helping People Help the Land Area 12-STJ covers parts
Modeling Fish Assemblages in Stream Networks Representation of Stream Network Introduction habitat attributes Criteria for Success
 Modeling Fish Assemblages in Stream Networks Joan P. Baker and Denis White Western Ecology Division National Health & Environmental Effects Research Laboratory U.S. Environmental Protection Agency baker.joan@epa.gov
Capabilities and Limitations of Land Cover and Satellite Data for Biomass Estimation in African Ecosystems Valerio Avitabile
 Capabilities and Limitations of Land Cover and Satellite Data for Biomass Estimation in African Ecosystems Valerio Avitabile Kaniyo Pabidi - Budongo Forest Reserve November 13th, 2008 Outline of the presentation
Little Blackfoot TPA 2009 Sediment and Habitat Assessment QAQC Review March 9, 2010
 Little Blackfoot TPA 2009 Sediment and Habitat Assessment QAQC Review March 9, 2010 1.0 PROJECT OVERVIEW Sediment and habitat monitoring in the Little Blackfoot TPA was conducted in July of 2009 as outlined
Detecting Landscape Changes in High Latitude Environments Using Landsat Trend Analysis: 2. Classification
 1 Detecting Landscape Changes in High Latitude Environments Using Landsat Trend Analysis: 2. Classification Ian Olthof and Robert H. Fraser Canada Centre for Mapping and Earth Observation Natural Resources
ANALYSIS EXERCISE 1 SOLUTIONS
 ANALYSIS EXERCISE 1 SOLUTIONS 1. (a) Let B The main course will be beef. F The main course will be fish. P The vegetable will be peas. C The vegetable will be corn. The logical form of the argument is
Application of Remote Sensing and Global Positioning Technology for Survey and Monitoring of Plant Pests
 Application of Remote Sensing and Global Positioning Technology for Survey and Monitoring of Plant Pests David Bartels, Ph.D. USDA APHIS PPQ CPHST Mission Texas Laboratory Spatial Technology and Plant
Conservative bias in classification accuracy assessment due to pixelby-pixel comparison of classified images with reference grids
 INT. J. REMOTE SENSING, 1995, VOL. 16, No.3, 581-587 Conservative bias in classification accuracy assessment due to pixelby-pixel comparison of classified images with reference grids D. L. VERBYLA and
Preliminary Calculation of Landscape Integrity in West Virginia Based on Distance from Weighted Disturbances
 Preliminary Calculation of Landscape Integrity in West Virginia Based on Distance from Weighted Disturbances Michael Dougherty and Elizabeth Byers Technical Support and Wildlife Diversity Units, Wildlife
2015 KANSAS LAND COVER PATTERNS PHASE I - FINAL REPORT
 2015 KANSAS LAND COVER PATTERNS PHASE I - FINAL REPORT Kansas Applied Remote Sensing Program Kansas Biological Survey University of Kansas Lawrence, Kansas 66047 January 13, 2017 Report Prepared by: Dana
BIODIVERSITY CONSERVATION HABITAT ANALYSIS
 BIODIVERSITY CONSERVATION HABITAT ANALYSIS A GIS Comparison of Greater Vancouver Regional Habitat Mapping with Township of Langley Local Habitat Mapping Preface This report was made possible through the
NR402 GIS Applications in Natural Resources
 NR402 GIS Applications in Natural Resources Lesson 1 Introduction to GIS Eva Strand, University of Idaho Map of the Pacific Northwest from http://www.or.blm.gov/gis/ Welcome to NR402 GIS Applications in
This is trial version
 Journal of Rangeland Science, 2012, Vol. 2, No. 2 J. Barkhordari and T. Vardanian/ 459 Contents available at ISC and SID Journal homepage: www.rangeland.ir Full Paper Article: Using Post-Classification
Web Soil Survey National Cooperative Soil Survey
 122 14' 27'' W () 122 13' 37'' W 40 8' 40'' N 564700 564800 564900 565000 565100 565200 565300 565400 565500 565600 565700 565800 40 8' 40'' N 4443400 4443500 4443600 4443700 4443800 4443900 4444000 4443400
The Nature of Geographic Data
 4 The Nature of Geographic Data OVERVIEW Elaborates on the spatial is special theme Focuses on how phenomena vary across space and the general nature of geographic variation Describes the main principles
Technical Drafting, Geographic Information Systems and Computer- Based Cartography
 Technical Drafting, Geographic Information Systems and Computer- Based Cartography Project-Specific and Regional Resource Mapping Services Geographic Information Systems - Spatial Analysis Terrestrial
Using GIS to locate hotspots for bluefin tuna
 Using GIS to locate hotspots for bluefin tuna Rob Schick 1 & Molly Lutcavage 2 1 Southwest Fisheries Science Center/Santa Cruz Lab 2 UNH Department of Zoology Bluefin and SST fronts We looked at 3 years
Modeling the Change of Mangrove Forests in Irrawaddy Delta, South Myanmar
 International Journal of Sciences: Basic and Applied Research (IJSBAR) ISSN 2307-4531 (Print & Online) http://gssrr.org/index.php?journal=journalofbasicandapplied ---------------------------------------------------------------------------------------------------------------------------
Outcrop suitability analysis of blueschists within the Dry Lakes region of the Condrey Mountain Window, North-central Klamaths, Northern California
 Outcrop suitability analysis of blueschists within the Dry Lakes region of the Condrey Mountain Window, North-central Klamaths, Northern California (1) Introduction: This project proposes to assess the
Estimating Stream Gradient Using NHD Stream Lines and DEM Data
 Estimating Stream Gradient Using NHD Stream Lines and DEM Data David Nagel, John M. Buffington, and Daniel Isaak U.S. Forest Service, Rocky Mountain Research Station Boise Aquatic Sciences Lab Boise, ID
USING GIS CARTOGRAPHIC MODELING TO ANALYSIS SPATIAL DISTRIBUTION OF LANDSLIDE SENSITIVE AREAS IN YANGMINGSHAN NATIONAL PARK, TAIWAN
 CO-145 USING GIS CARTOGRAPHIC MODELING TO ANALYSIS SPATIAL DISTRIBUTION OF LANDSLIDE SENSITIVE AREAS IN YANGMINGSHAN NATIONAL PARK, TAIWAN DING Y.C. Chinese Culture University., TAIPEI, TAIWAN, PROVINCE
Big Chino Valley Pumped Storage Project (FERC No ) Vegetation Mapping and Habitat Assessment Study Plan
 Vegetation Mapping and Habitat Assessment Study Plan") March 21, 2018 1.0 Introduction Big Chino Valley Pumped Storage LLC (BCV), a subsidiary of ITC Holdings Corp. (ITC), submitted a preliminary permit application to the Federal Energy Regulatory Commission
March 21, 2018 1.0 Introduction Big Chino Valley Pumped Storage LLC (BCV), a subsidiary of ITC Holdings Corp. (ITC), submitted a preliminary permit application to the Federal Energy Regulatory Commission
Application of Remote Sensing Techniques for Change Detection in Land Use/ Land Cover of Ratnagiri District, Maharashtra
 IOSR Journal of Applied Geology and Geophysics (IOSR-JAGG) e-issn: 2321 0990, p-issn: 2321 0982.Volume 3, Issue 6 Ver. II (Nov. - Dec. 2015), PP 55-60 www.iosrjournals.org Application of Remote Sensing
Using Grassland Vegetation Inventory Data
 Adam Moltzahn Eastern Short-Horned Lizard Using Grassland Vegetation Inventory Data The GVI represents the Government of Alberta s comprehensive biophysical, anthropogenic and land-use inventory of the
Introduction-Overview. Why use a GIS? What can a GIS do? Spatial (coordinate) data model Relational (tabular) data model
 data model Relational (tabular) data model") Introduction-Overview Why use a GIS? What can a GIS do? How does a GIS work? GIS definitions Spatial (coordinate) data model Relational (tabular) data model intro_gis.ppt 1 Why use a GIS? An extension
Introduction-Overview Why use a GIS? What can a GIS do? How does a GIS work? GIS definitions Spatial (coordinate) data model Relational (tabular) data model intro_gis.ppt 1 Why use a GIS? An extension
Page 1 of 8 of Pontius and Li
 ESTIMATING THE LAND TRANSITION MATRIX BASED ON ERRONEOUS MAPS Robert Gilmore Pontius r 1 and Xiaoxiao Li 2 1 Clark University, Department of International Development, Community and Environment 2 Purdue
An Automated Object-Oriented Satellite Image Classification Method Integrating the FAO Land Cover Classification System (LCCS).
.") An Automated Object-Oriented Satellite Image Classification Method Integrating the FAO Land Cover Classification System (LCCS). Ruvimbo Gamanya Sibanda Prof. Dr. Philippe De Maeyer Prof. Dr. Morgan De
An Automated Object-Oriented Satellite Image Classification Method Integrating the FAO Land Cover Classification System (LCCS). Ruvimbo Gamanya Sibanda Prof. Dr. Philippe De Maeyer Prof. Dr. Morgan De
Development of Riparian Maps for Sonoma County Long Term Riparian Corridor Conservation. Mark Tukman & Dylan Loudon Tukman Geospatial
 L A N D F O R Development of Riparian Maps for Sonoma County Long Term Riparian Corridor Conservation Mark Tukman & Dylan Loudon Tukman Geospatial L I F E Mark Background on functional riparian mapping
Types of spatial data. The Nature of Geographic Data. Types of spatial data. Spatial Autocorrelation. Continuous spatial data: geostatistics
 The Nature of Geographic Data Types of spatial data Continuous spatial data: geostatistics Samples may be taken at intervals, but the spatial process is continuous e.g. soil quality Discrete data Irregular:
Appendix I Feasibility Study for Vernal Pool and Swale Complex Mapping
 Feasibility Study for Vernal Pool and Swale Complex Mapping This page intentionally left blank. 0 0 0 FEASIBILITY STUDY BY GIC AND SAIC FOR MAPPING VERNAL SWALE COMPLEX AND VERNAL POOLS AND THE RESOLUTION
Using the Web Soil Survey Resilience and Resistance Score Sheet Soils Report
 Using the Resilience and Resistance Score Sheet Soils Report 1. Go to http://websoilsurvey.nrcs.usda.gov/app/ and click on the Start WSS button. 2. Create an Area of Interest (AOI) using any of the available
Application of GIS and remote sensing in conservation of vernal pools
 Priyanka Patel NRS 509 12/16/2014 Application of GIS and remote sensing in conservation of vernal pools Vernal pools are small temporary water bodies that contain water for some parts of the year. They
Steve Pye LA /22/16 Final Report: Determining regional locations of reference sites based on slope and soil type. Client: Sonoma Land Trust
 Steve Pye LA 221 04/22/16 Final Report: Determining regional locations of reference sites based on slope and soil type. Client: Sonoma Land Trust Deliverables: Results and working model that determine
Remote Sensing and Geospatial Application for Wetlands Mapping, Assessment, and Mitigation
 Remote Sensing and Geospatial Application for Wetlands Mapping, Assessment, and Mitigation Hydrology Soils MSU Seminar Series Remote Sensing and Geospatial Applications September 4, 2002 Vegetation NEPA
MODELING LIGHTNING AS AN IGNITION SOURCE OF RANGELAND WILDFIRE IN SOUTHEASTERN IDAHO
 MODELING LIGHTNING AS AN IGNITION SOURCE OF RANGELAND WILDFIRE IN SOUTHEASTERN IDAHO Keith T. Weber, Ben McMahan, Paul Johnson, and Glenn Russell GIS Training and Research Center Idaho State University
USING HYPERSPECTRAL IMAGERY
 USING HYPERSPECTRAL IMAGERY AND LIDAR DATA TO DETECT PLANT INVASIONS 2016 ESRI CANADA SCHOLARSHIP APPLICATION CURTIS CHANCE M.SC. CANDIDATE FACULTY OF FORESTRY UNIVERSITY OF BRITISH COLUMBIA CURTIS.CHANCE@ALUMNI.UBC.CA
TAKING THE " " OUT OF "GROUND TRUTH": OBJECTIVE ACCURACY ASSESSMENT. Timothy B. Hill GIS/Remote Sensing Analyst Geographic Resource Solutions, USA
 TAKING THE " " OUT OF "GROUND TRUTH": OBJECTIVE ACCURACY ASSESSMENT Timothy B. Hill GIS/Remote Sensing Analyst Geographic Resource Solutions, USA ABSTRACT Interest in remotely sensed data as a source for
Summary Description Municipality of Anchorage. Anchorage Coastal Resource Atlas Project
 Summary Description Municipality of Anchorage Anchorage Coastal Resource Atlas Project By: Thede Tobish, MOA Planner; and Charlie Barnwell, MOA GIS Manager Introduction Local governments often struggle
Nikki Sacha. NRS 509 Restoration Ecology
 Nikki Sacha NRS 509 Restoration Ecology There were several ways that GIS was incorporated into restoration ecology that was repeated in the eight articles that I reviewed. The first was that it served
Using Remote Sensing to Map the Evolution of Marsh Vegetation in the South Bay of San Francisco
 Using Remote Sensing to Map the Evolution of Marsh Vegetation in the South Bay of San Francisco Brian Fulfrost Design, Community and Environment (DC&E) 6 th Annual Bay-Delta Science Conference PROJECT
Web Soil Survey National Cooperative Soil Survey
 121 52' 18'' W Irrigated Capability Class Sutter County, California () 121 51' 49'' W 597600 597700 597800 597900 598000 598100 598200 39 6' 27'' N 39 6' 27'' N 39 5' 57'' N 4328400 4328500 4328600 4328700
Cripps Ranch 76+/- Acres Orchard Development Opportunity Dixon, CA. Presented By:
 Cripps Ranch 76+/- Acres Orchard Development Opportunity Dixon, CA Presented By: Cripps Ranch 76+/- Acres Orchard Development Opportunity Dixon, CA Location: This property is located at 5663 Dally Road
The USGS Upper Delaware Decision Support System (DSS) for Ecological Flows
 for Ecological Flows") The USGS Upper Delaware Decision Support System (DSS) for Ecological Flows Kelly O. Maloney, Heather S. Galbraith, Jeffrey Cole, & Carrie Blakeslee Northern Appalachian Research Lab, Wellsboro PA Colin
The USGS Upper Delaware Decision Support System (DSS) for Ecological Flows Kelly O. Maloney, Heather S. Galbraith, Jeffrey Cole, & Carrie Blakeslee Northern Appalachian Research Lab, Wellsboro PA Colin
Improvement of the National Hydrography Dataset for Parts of the Lower Colorado Region and Additional Areas of Importance to the DLCC
 Improvement of the National Hydrography Dataset for Parts of the Lower Colorado Region and Additional Areas of Importance to the DLCC Carlos Reyes-Andrade California State University, Northridge September
Land cover research, applications and development needs in Slovakia
 Land cover research, applications and development needs in Slovakia Andrej Halabuk Institute of Landscape Ecology Slovak Academy of Sciences (ILE SAS) Štefánikova 3, 814 99 Bratislava, Slovakia Institute
GIS IN ECOLOGY: ANALYZING RASTER DATA
 GIS IN ECOLOGY: ANALYZING RASTER DATA Contents Introduction... 2 Raster Tools and Functionality... 2 Data Sources... 3 Tasks... 4 Getting Started... 4 Creating Raster Data... 5 Statistics... 8 Surface
Project Leader: Project Partners:
 UTILIZING LIDAR TO MAP HIGH PRIORITY WOODLAND HABITAT IN ARKANSAS DEVELOPING METHODOLOGY AND CONDUCTING A PILOT PROJECT IN THE OZARK HIGHLANDS TO MAP CURRENT EXTENT, SIZE AND CONDITION Project Summary
An Internet-based Agricultural Land Use Trends Visualization System (AgLuT)
") An Internet-based Agricultural Land Use Trends Visualization System (AgLuT) Prepared for Missouri Department of Natural Resources Missouri Department of Conservation 07-01-2000-12-31-2001 Submitted by
An Internet-based Agricultural Land Use Trends Visualization System (AgLuT) Prepared for Missouri Department of Natural Resources Missouri Department of Conservation 07-01-2000-12-31-2001 Submitted by
Mapping and Modeling for Regional Planning
 Mapping and Modeling for Regional Planning Carol W. Witham Sacramento Valley Chapter California Native Plant Society contributors: David Ackerly John Dittes Julie Evens Josephine Guardino Robert F. Holland
Case Study: Ecological Integrity of Grasslands in the Apache Highlands Ecoregion
 Standard 9: Screen all target/biodiversity element occurrences for viability or ecological integrity. Case Study: Ecological Integrity of Grasslands in the Apache Highlands Ecoregion Summarized from: Marshall,
USING LANDSAT IN A GIS WORLD
 USING LANDSAT IN A GIS WORLD RACHEL MK HEADLEY; PHD, PMP STEM LIAISON, ACADEMIC AFFAIRS BLACK HILLS STATE UNIVERSITY This material is based upon work supported by the National Science Foundation under
Department of Biological Sciences, Murray State University, Murray, Kentucky 42071, USA
 1 Department of Biological Sciences, Murray State University, Murray, Kentucky 42071, USA 2 Fondazione Edmund Mach, Research and Innovation Center, Department of Biodiversity and Molecular Ecology, GIS
Appendix 2b. NRCS Soil Survey
 Appendix 2b NRCS Soil Survey 118 19' 25'' W Nonirrigated Capability Class Antelope Valley Area, California (Del Sur Solar Site) 118 17' 28'' W 378900 379200 379500 379800 380100 380400 380700 381000 381300
Land cover/land use mapping and cha Mongolian plateau using remote sens. Title. Author(s) Bagan, Hasi; Yamagata, Yoshiki. Citation Japan.
 Bagan, Hasi; Yamagata, Yoshiki. Citation Japan.") Title Land cover/land use mapping and cha Mongolian plateau using remote sens Author(s) Bagan, Hasi; Yamagata, Yoshiki International Symposium on "The Imp Citation Region Specific Systems". 6 Nove Japan.
Title Land cover/land use mapping and cha Mongolian plateau using remote sens Author(s) Bagan, Hasi; Yamagata, Yoshiki International Symposium on "The Imp Citation Region Specific Systems". 6 Nove Japan.
EO Information Services. Assessing Vulnerability in the metropolitan area of Rio de Janeiro (Floods & Landslides) Project
 Project") EO Information Services in support of Assessing Vulnerability in the metropolitan area of Rio de Janeiro (Floods & Landslides) Project Ricardo Armas, Critical Software SA Haris Kontoes, ISARS NOA World
EO Information Services in support of Assessing Vulnerability in the metropolitan area of Rio de Janeiro (Floods & Landslides) Project Ricardo Armas, Critical Software SA Haris Kontoes, ISARS NOA World
A Method to Improve the Accuracy of Remote Sensing Data Classification by Exploiting the Multi-Scale Properties in the Scene
 Proceedings of the 8th International Symposium on Spatial Accuracy Assessment in Natural Resources and Environmental Sciences Shanghai, P. R. China, June 25-27, 2008, pp. 183-188 A Method to Improve the
Remote sensing of sealed surfaces and its potential for monitoring and modeling of urban dynamics
 Remote sensing of sealed surfaces and its potential for monitoring and modeling of urban dynamics Frank Canters CGIS Research Group, Department of Geography Vrije Universiteit Brussel Herhaling titel van
Post-fire Recovery of Sagebrush Communities: Assessment using SPOT5 and Very Large-Scale Aerial Imagery
 Post-fire Recovery of Sagebrush Communities: Assessment using SPOT5 and Very Large-Scale Aerial Imagery Temuulen Tsagaan Sankey, GIS Training and Research Center, Idaho State University, 921 South 8 th
Evaluating Wildlife Habitats
 Lesson C5 4 Evaluating Wildlife Habitats Unit C. Animal Wildlife Management Problem Area 5. Game Animals Management Lesson 4. Evaluating Wildlife Habitats New Mexico Content Standard: Pathway Strand: Natural
Tutorial: Species Modeling Approach. Scott Fleury ICF International April 13, 2011
 Tutorial: Species Modeling Approach Scott Fleury ICF International April 13, 2011 Filling the Data Gaps: The Role of Species Distribution Modeling Why develop species distribution models? To provide an