Erosion Modeling: Use of Multiple-Return and Bare-Earth LIDAR Data to. Identify Bare Areas Susceptible to Erosion
|
|
|
- Kerry Bryan
- 5 years ago
- Views:
Transcription
1 Erosion Modeling: Use of Multiple-Return and Bare-Earth LIDAR Data to Identify Bare Areas Susceptible to Erosion MacRidge, Training Area J, Fort Bragg, NC Brent D. Fogleman April 28, 2009
2 Abstract Accelerated erosion of military training lands is one of the largest environmental challenges encountered by U.S. Army land managers. Many military installations experience common erosion-related problems. Only a handful of installations track erosion through quantified methods. Given the mission and the right tools, land managers could explicitly quantify the erosion effects on their installation. Controlling erosion is achieved in only two ways: reduce the erosive forces applied to the soil, or reduce the erodibility of the soil. Indefinitely halting military training on these lands is contrary to their intended use, so land managers must find the delicate balance of mitigating soil erosion without significantly impeding Soldier training opportunities. This study was initiated to quantify the effects and rates of soil erosion on military training lands through the exploration of new techniques utilizing a Geographic Information System (GIS). The primary objective is to develop a simplified land cover classification to identify bare areas susceptible to erosion. This method computes the difference between multiple return Light Detection and Ranging (LIDAR) data and bare-earth LIDAR to derive a vegetation-height raster map. The derived vegetation-height raster is recoded and applied to a modified Revised Universal Soil Loss Equation (RUSLE3d) as the cover factor, or C-factor. This analysis will serve as a decision-making tool that will aid land managers in their decision process. 2
3 Introduction Accelerated erosion of military training lands is one of the largest environmental challenges encountered by U.S. Army land managers. Many military installations experience common erosion-related problems. Only a handful of installations track erosion through quantified methods. Most installations track erosion through qualified methods (Harmon and Doe, 2001). In these cases, descriptors are used and temporal comparisons made without scientific monitoring. Given the mission and the right tools, land managers could explicitly quantify the erosion effects on their installation. They would provide reputable advice to garrison commanders and their staff concerning best management practices to preserve these valuable training resources. Soil erosion can be categorized into three stages: detachment, transport and deposition. The first two stages define the mechanics of soil erosion, while the third occurs only when sufficient energy is no longer generated to transport particles (Morgan, 2005). Two factors determine the magnitude of erosion: erosivity of the rainfall, runoff, and wind; and erodibility of the soil. Explained well by Toy, Foster and Renard, 2002: Erosivity is a measure of the forces applied to the soil that cause erosion, and erodibility is a measure of the susceptibility of the soil to erosive forces. Detachment occurs when the erosive force(s) energy surpasses the erodibility threshold of the soil at which point particles become detached and are susceptible to transport. Transport occurs while the energy retained by the erosive force(s) is greater than the friction created by the surface over which the agent moves. Controlling erosion is achieved in only two ways: reduce the erosive forces applied to the soil, or reduce the erodibility of the soil. When the problem is identified and quantified, the delicate balance between enacting conservation and training priorities ensues. Removing 3
4 Soldier-induced erosive forces indefinitely from military training sites is counterproductive to their purpose, so land managers must consider alternative options to supplement management even when erosive forces may be reduced. Land managers will likely implement a combination of these principles using a variety of methods. Many erosion modeling techniques have been developed to quantify the effects of erosion. A plethora of equations are associated with these methods. While no particular method maintains fame as the perfect model, the original Universal Soil Loss Equation (USLE) developed in 1954 by the Science and Education Administration in cooperation with Purdue University (USDA Ag Handbook 537) and the new Revised Universal Soil Loss Equation (RUSLE) is a launch point for detachment capacity limited erosion modeling. The RUSLE computes the average annual erosion expected on field slopes as: (1) Where A is the computed soil loss per unit of area, R is rainfall and runoff erosivity factor, K is the soil-erodibility factor, L is slope-length factor, S is slope-steepness factor, C is the cover and management factor and P is the erosion-control practice factor (Wischmeier and Smith, 1978). The erosion models in this project use a modification of RUSLE, referred to as RUSLE3d, in which the slope length and slope steepness are combined into an LS-factor that replaces slope length with upslop e area: 1 U.. (2) Where U is the upslope area per unit width (measure of water flow, m 2 /m), β is the slope angle in degrees, 22.1m is the length of the standard USLE plot, 0.09=9% is the slope of the standard USLE plot, m and n are empirical constants. Exponential constants have range m = and n = (Neteler and Mitasova, 2008). 4
5 A second model is used to predict the spatial distribution of erosion and deposition. The Unit Stream Power-based Erosion Deposition (USPED) model assumes steady state overland flow with uniform rainfall and that the erosion process is transport capacity limited (Mitasova, et al., 2002). Neteler and Mitasova, 2008, and Mitasova, et al., 2002, set up the model in the form of two equations. The model combines the RUSLE parameters and upslope contributing area per unit width U to estimate sediment flow as: (3) Where R~i m, KCP~Kt and LS=A m and m= , n= The exponents m and n control the relative influence of water and slope to reflect the impact of different types of flow. The net erosion/deposition is computed as a change in sediment flow rate expressed by a divergence in sediment flow in the x and y directions: (4) Where α is aspect in degrees. This study was initiated to quantify the effects and rates of soil erosion on military training lands through the exploration of new techniques utilizing a Geographic Information System (GIS). The Geographic Resources Analysis Support System, or GRASS, is the GIS used to compute the erosion models and analyze the results. The primary objective is to develop a simplified land cover classification to identify areas void of vegetation and thus susceptible to erosion. This method computes the difference between multiple-return LIDAR (Light Detection and Ranging) and bare-earth LIDAR to derive a vegetation-height raster map. The derived vegetation-height raster is recoded and applied to the RUSLE as the cover factor, or C-factor. The goal is to derive a raster that distinguishes cover types well enough to be applied to the RUSLE3d as parameter C. Additionally, deriving the raster should be more efficient then other 5

6 land classification methods. Other classification methods include supervised and unsupervised classification and are supported by several software, including GRASS, ArcInfo Workstation by Environmental Systems Research Institute (ESRI), and IMAGINE by ERDAS, Inc.. Conducting classifications in these systems can be cumbersome and requires a level of user interaction commensurate with the desired fidelity of the outcome. Study Area The study area comprises 55 acres along MacRidge in Training Area J on Fort Bragg Military Reservation, North Carolina. The training area is heavily used due to its easy access and close proximity to the cantonment area. Heavy use by has caused significant erosion, particularly in the area just south of the landing zone near MacRidge. Figure 1. The study site. MacRidge, Training Area J, Fort Bragg, NC. 6
7 The 30-year average ( ) annual rainfall at Fort Bragg is inches. Rainfall is fairly evenly distributed throughout the year. The wettest month is July, averaging 5.74 inches (NOAA). Table year average rainfall at Fort Bragg. The soils in this area are Ultisols. A representative sample of Ultisols soil from a different location revealed that at a depth interval of 0-12 cm, the soil is composed of 72.4 percent sand, 15.3 percent silt, and 12.3 percent clay (USDA Handbook 436, p ). The soil can be characterized as fine sandy loam. The area with the least vegetation and most susceptible to erosion is on high ground. The fact that there is no canopy, very little vegetation, fine sandy loam soil and gentle slopes in all directions indicate the area is subjected to rill erosion. Data Bare-earth LIDAR data from 2004 was retrieved from the North Carolina Floodplain Mapping Information System (online). One tile was required for the study site (be go txt). The data is ASCII text files in comma-delimited X,Y,Z coordinates. The coordinate system is North Carolina State Plane feet (FIPS 3200) referenced to the North American Datum of 1983 (NAD83), GRS80 ellipsoid. 7
. Credit is to Dr.")
8 Figure 2. Bare-earth LIDAR of the tile at 1-meter resolution. The multiple return data is from the North Carolina and FEMA coordinated LIDARbased floodplain mapping project beginning in The data set is from Phase1B (NC_Phase1b_35079a1b3.txt). Credit is to Dr. Mitasova for securing the dataset and conducting some of the pre-processessing tasks, such as conversion to ASCII through LAS and projecting in state plane meters. 8

9 Figure 3. Multiple-return LIDAR of a subset of the tile at 1-meter resolution. Orthophotographs were not immediately available due to the secure nature of the military installation. Imagery used for general reference and general land cover comparison were obtained through Google Earth. A paper military installation map is a useful reference for man-made features, as most digital data sets are masked by the installation boundary. Map: 1:50,000 Fort Bragg East Military Installation Map (1998), Edition 1-NIMA, Series V742S, Sheet Fort Bragg East, Projection Transverse Mercator, Horizontal Datum and Ellipsoid WGS84. Methods Preprocessing The bare-earth LIDAR data were downloaded as ASCII text files in comma-delimited X,Y,Z coordinates. The study area region boundaries are contained within one dataset, negating the need for batch processing several files. A region extent larger than the study area is defined 9
10 and the resolution set to six feet. The file is imported into GRASS using the mean method. GRASS computs the binned DEM in which the output is a vector point file. The region is set to the new DEM and resolution set to six feet. The new DEM is interpolated using regularized spline with tension and smoothing set to default parameters (tension=40 and no smoothing). The minimum number of points for approximation in a segment is set to 120 and maximum number of points in a segment set to 35. The resulting DEM displayed with shaded relief, reveals a high resolution image of the study area and indicates that the data was useable. Upon further processessing, it was decided in consultation with Dr. Mitasova to project the data to NC State Plane meters in order for the GRASS modules to properly process the data in metric distance measurements. Additional processing is required to project the data into NC State Plane meters. The vector point file is projected to NC State Plane meters by running the command from a GRASS Project Location in NC State Plane meters. The Z-values (elevation) are scaled from feet to meters. The region is set to the new DEM and resolution set to one meter. The DEM is interpolated several times using regularized spline with tension, adjusting the tension and smoothing factors for the iterations. The first DEM interpolated tension=30, smoothing=0.5 and is viewed as a shaded relief map to see what is there (Fig. 4). The data appears suitable for modeling. The next DEM interpolated has tension=500, smoothing=1.5 (Fig. 5). The third DEM interpolated has tension=900 and smoothing=2.0 (Fig. 6). This DEM is selected for the initial erosion model. 10


11 Figure 4. 2D and 3D bare-earth LIDAR at 1-meter resolution, tension=30, smoothing=0.5 Figure 5. 2D and 3D bare-earth LIDAR at 1-meter resolution, tension=500, smoothing=1.5 Figure 6. 2D and 3D bare-earth LIDAR at 1-meter resolution, tension=900, smoothing=2.0 11
. Figure 7. 2D and 3D bare-earth LIDAR at 2-meter resolution, tension=350, smoothing=2.")

12 An additional set of DEMs are interpolated at two-meter resolution to facilitate modeling. The DEM interpolated with tension=350 and smoothing=2.5 is ultimately used in a second erosion model (Fig. 7). Figure 7. 2D and 3D bare-earth LIDAR at 2-meter resolution, tension=350, smoothing=2.5 Trial erosion model This initial erosion model is a useful gauge to determine the appropriate DEM resolution and C-factor recode table values. This model was conducted with a 1-meter resolution DEM. The model accounts for all the elements of the RUSLE3d as: R = 270 K = 0.35 LS (computed as 3D LS-factor with exponential values m=0.6 and n=1.2) C = recoded result of (MR LIDAR) (BE LIDAR) (see Appendix A for C_factor_recode_table_for_MR_BE_mt900.txt) P = 1 12


 3d LS-factor.")
13 The sharp change from red to green in the derived C-factor raster may be a result of varying data points per grid cell (Fig. 9b). This phenomenon was the primary deciding factor to conduct the model with a 2-meter resolution DEM. Figure 8. (a) Wetness index for study area at 1-meter resolution. (b) 3d LS-factor. Red areas in the flow paths indicate greater erosion potential. (a) (b) 13
 Recoded MR-BE LIDAR for us in RUSLE3d as the C-factor.")
 soil loss computed with derived C-factor.")
. (a) (b) Figure 11. (a) Sediment flow rate.")
 Net erosion and deposition.")
14 Figure 9. (a) Resulting raster from MR-BE LIDAR. (b) Recoded MR-BE LIDAR for us in RUSLE3d as the C-factor. (a) (b) Figure 10. Soil loss comparison. (a) soil loss computed with derived C-factor. (b) soil loss computed with a standard C-factor of 1.1 (bare soil). (a) (b) Figure 11. (a) Sediment flow rate. Magenta areas indicate greater sediment flow. (b) Net erosion and deposition. Red areas indicate more erosion and blue areas indicate more deposition. 14
15 Improved erosion model The two-meter resolution DEM erosion model renders a smoother and more fluid model than the previous one-meter resolution model. The research undertaken during the course of this project resulted in a familiarity and knowledge of the RUSLE3d variables which aided their refinement. The updated RUSLE3d model components were: R = 310 K = 0.28 LS (computed as 3D LS-factor with exponential values m=0.6 and n=1.0) C = recoded result of (MR LIDAR) (BE LIDAR) (see Appendix A for C_factor_recode_table_for_MR_BE_2m.txt) P = 1 The R-factor for this area is visually interpolated as 310 from the adjusted R R -factor isoerodent map of the Eastern United States (Renard et al., 1996). The manner in which K-factor is derived is very complicated and some level of subjectivity is apparently necessary. When computing the USLE, the relative erodibilities of key soils table (Wischemeier and Smith, 1965) in the U.S. Dept of Interior s Erosion and Sedimentation Manual list the K-factor for fine sandy loam between 0.22 and The revised equation results in a larger K-factor. Based on the soil description at the study site, and interpolation from several K-factor tables describing fine sandy loam, a K-factor of 0.28 is used. LS exponential value m is associated with rill formation. The MR-BE raster reveals that over 45 percent of the study area has vegetation height equal to or near zero, indicating bare ground (Table 2). For the purposes of this model, bare ground is 15
16 equated to disturbed areas; therefore, m=0.6 (Mitasova, et al., 2002). Due to the fact that slopes angles are below the standard plot slope angle of 9 percent, the LS exponential value n=1.0 is used. The C-factor is employed dynamically across the study areas. The resulting cell values from MR-BE LIDAR rasters are recoded based on land cover height. Recoded value for each cell is the C-factor for that cell. Table 2. Percent of land area vegetation height from MR-BE LIDAR. 16
 Wetness index for study area")
 3d LS-factor.")

 Resulting raster from MR-BE")
17 (a) (b) Figure 12. (a) Wetness index for study area at 2-meter resolution. (b) 3d LS-factor. Red areas indicate greater erosion potential. (a) (b) Figure 13. (a) Resulting raster from MR-BE LIDAR. (b) Recoded MR-BE LIDAR for us in RUSLE3d as the C-factor. 17


18 Figure 14. A subset of the resulting raster from MR-BE LIDAR (Fig. 13a) that depicts vegetation height at the particular cell. The area at the top-right is grass, but has values of zero indicating bare ground. (a) (b) Figure 15. Soil loss comparison. (a) soil loss computed with derived C-factor. (b) soil loss computed with a standard C-factor of 1.1 (bare soil). 18
. Figure 17. Net erosion and deposition.")
.")

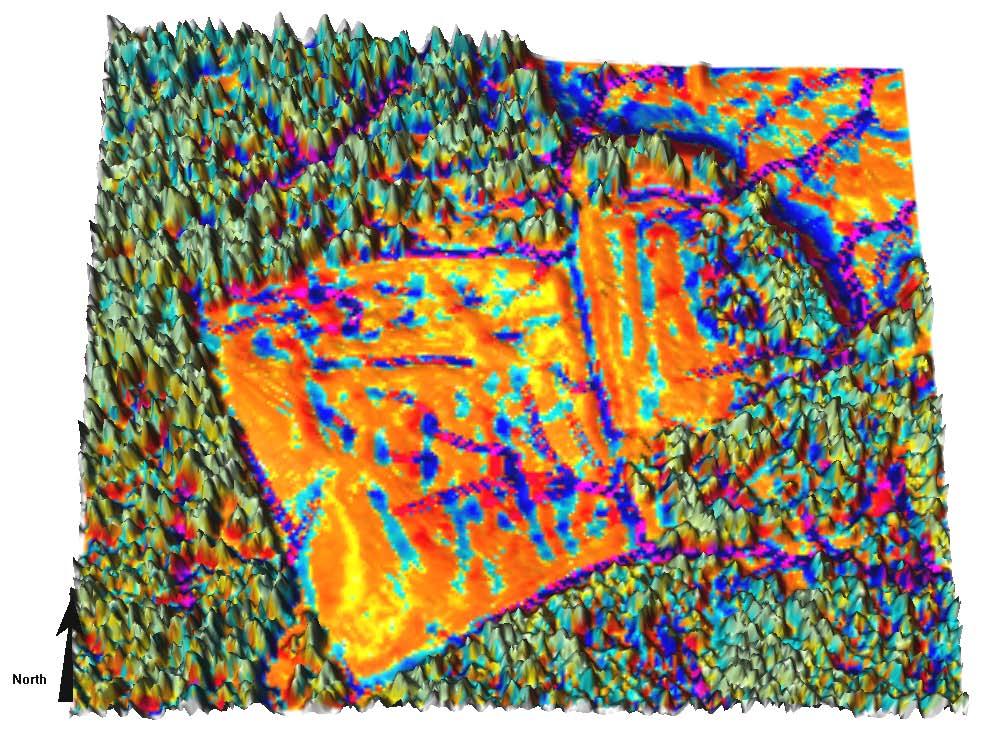
19 Figure 16. Sediment flow rate. Magenta areas indicate greater sediment flow. (Views north and south as indicated by north arrow). Figure 17. Net erosion and deposition. Red areas indicate more erosion and blue areas indicate more deposition. (Views north and south as indicated by north arrow). Results Deriving the C-factor dynamically across all raster cells is a challenging proposition. The resulting raster from the MR-BE LIDAR produces promising images. The bare spots as viewed from imagery are in fact rendered as cell value 0, or near zero as expected. The highest values of 20 meters are reasonable, as there are some tall pine trees bordering the study site. From this 19
20 perspective, the process certainly returns vegetation height and is an indicator of vegetation presence or absence. What this model fails to recognize in its current state is the difference between bare ground (disturbed soil) and low-lying vegetation, such as grass (Fig. 14). Areas with very short grass were recognized by the model as bare ground, when in fact they likely have a C-factor of as opposed to bare soil values of (smaller number equates to less erosion potential) (Haan, Barfield and Hayes, 1994). GRASS version (native install for Windows) was used to execute the models. GRASS version 6.4 (express install) was available at the time of this study and attempts to complete an erosion model failed. Primarily, the command r.watershed fails to execute. Additionally, visualization production was made cumbersome due to problems with legend text and the inability to launch NVIZ, the 3D-viewer. Conclusion The recoding process for C-factor is a task that requires much attention to detail and great familiarity with the land cover of the study area. Refinements must be made to capitalize on the method of using MR-BE LIDAR. It is unclear if refinements in recoding the MR - BE LIDAR raster will solely suffice to serve the purpose of land cover type as relates to soil erodibility. Further experimentation with recoding and tuning the tension of the DEMs is required to confirm or rule out the use of this technique in erosion modeling. Future work includes developing a military training erosion ramp chart. to quantify the effects of varying military training practices, so that commanders and U.S. Army land managers can plan collaboratively concerning training intensity, type and duration in respective training areas. The idea is to apply a P-factor to the RUSLE to account for training events that have been categorized and valued based on their erosivity. Table 7-3 in Soil Erosion by Toy, et al. which 20
21 summarizes water erosion-control practices (Toy, et al., 2002) inspired the idea of using this erosion ramp chart as a P-factor value when calculating erosion with RUSLE3d. Initial values will be extrapolated from text until such time that empirical data is collected. 21


22 Appendix A: C-Factor Recode Tables The values in the table below were used as a guide to develop the subsequent recode tables. The following recode table was used to recode the MR-BE LIDAR raster map for the 1-meter resolution erosion model. 22

23 The following recode table was used to recode the MR-BE LIDAR raster map for the 2-meter resolution erosion model. 23


 24")
24 Appendix B: Additional Images The following 3D images further depict the results from the 2-meter resolution erosion model. NVIZ recoded C-factor over BE DEM (N and S views) NVIZ recoded C-factor over MR DEM (N and S views) 24
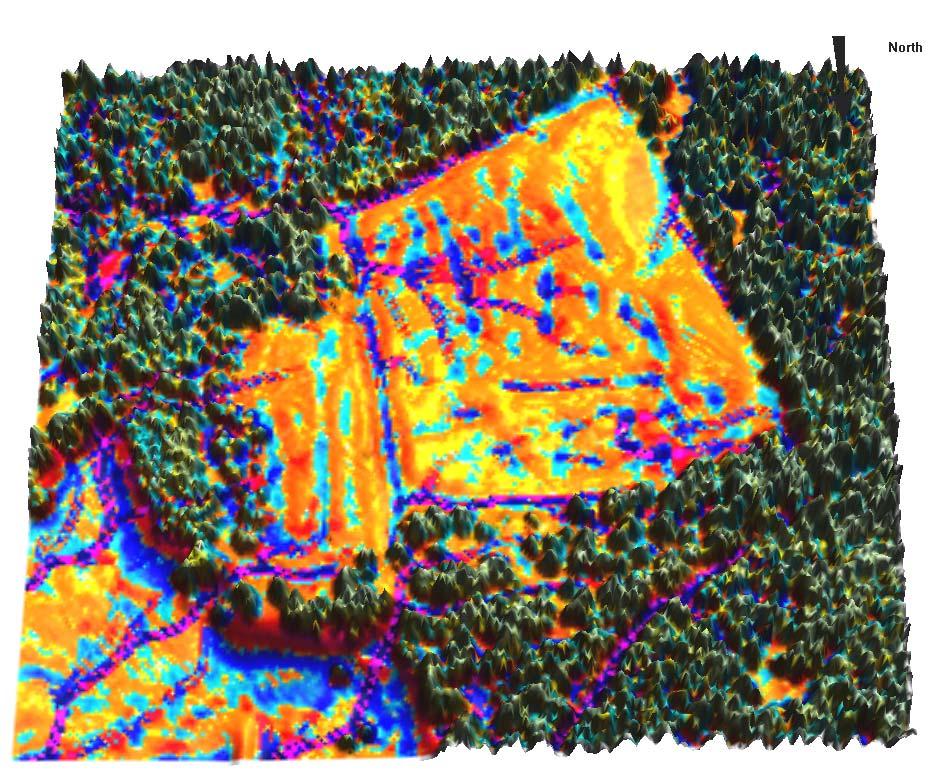
25 NVIZ Erosion/deposition overlayed MR DEM (N and S views) 25
26 Appendix C: GRASS Commands and Rules Grass commands and rules are included in the digital portfolio. 26
27 References Google Earth. Fort Bragg imagery of study site Haan, C.T., Barfield, B.J., and Hayes, J.C. (1994). Design Hydrology Sedimentology for Small Catchments. San Diego, CA: Academic Press. Harmon, R.S., & Doe, W.W., III (Eds.). (2001). Landscape Erosion and Evolution Modeling. New York: Kluwer Academic / Plenum Publishers. Mitasova, H. Lecture: Modeling Landscape Processes: Hydrology and Erosion. MEA592A. North Carolina State University, Raleigh. 31 Mar Mitasova, H., and Brown, W. M., Johnston, D.M. (2002). Terrain Modeling and Soil Erosion Simulation Final Report. Final report for USA CERL. University of Illinois, Urbana- Champaign, IL. Morgan, R.P.C. (2005). Soil Erosion and Conservation (3 rd ed.). Malden, MA: Blackwell Publishing. Neteler, M., and Mitasova, H. (2008). Open Source GIS: A GRASS GIS Approach (3 rd ed.). New York: Springer NOAA National Weather Service Forecast Office, Raleigh, NC. NOWData link. Downloaded 27 Apr, 2009 < North Carolina Floodplain Mapping Information System. Cumberland County Bare Earth LIDAR <ftp://ftp1.ncem.org/data_requests/county_lidar_data/cumberlandcountybe/>. Renard, K.G., Foster, G.R., Weesies, G.A., McCool, D.K., & Yoder, D.C. Predicting Soil Erosion by Water: A Guide to Conservation Planning With the Revised Universal Soil Loss Equation (RUSLE). USDA, Agriculture Handbook No Washington, D.C.: GPO, Toy, T.J., Foster, G.R., and Renard, K.G. (2002). Soil Erosion: Processes, Prediction, Measurement, and Control. New York: John Wiley & Sons. United States Dept of the Interior. Erosion and Sedimentation Manual. Washington: GPO, United States Dept of Agriculture. Soil Taxonomy: A Basic System of Soil Classification for Making and Interpreting Soil Surveys. USDA Agricultural Handbook No Washington, D.C.: GPO, 1999 Wischmeier, W.H., and Smith, D.D. (1978). Predicting Rainfall Erosion Losses: A Guide to Conservation Planning. USDA, Agriculture Handbook No Washington, D.C.: GPO 27
Review Using the Geographical Information System and Remote Sensing Techniques for Soil Erosion Assessment
 Polish J. of Environ. Stud. Vol. 19, No. 5 (2010), 881-886 Review Using the Geographical Information System and Remote Sensing Techniques for Soil Erosion Assessment Nuket Benzer* Landscape Architecture
used to transport sediments throughout the lands. In this regard, understanding erosion is
 David Rounce GIS in Water Resources 11/23/2010 Erosion Potential in Travis County INTRODUCTION Erosion has played a vital role in the morphology of the Earth as its processes have been used to transport
GIS APPLICATIONS IN SOIL SURVEY UPDATES
 GIS APPLICATIONS IN SOIL SURVEY UPDATES ABSTRACT Recent computer hardware and GIS software developments provide new methods that can be used to update existing digital soil surveys. Multi-perspective visualization
Web-based Tools for Soil Erosion Assessment/Management
 Web-based Tools for Soil Erosion Assessment/Management Glenn O Neil GIS Specialist Institute of Water Research Michigan State University Managing and Understanding Sediments in Your Watershed Workshop
Soil Map Boulder County Area, Colorado (Planet Blue Grass) Web Soil Survey National Cooperative Soil Survey
 Web Soil Survey National Cooperative Soil Survey") 475910 476000 476090 476180 476270 476360 105 16' 21'' W 476450 476540 476630 476720 476810 4453350 4453440 4453260 4453350 4453170 4453260 4453080 4453170 4453080 475820 475910 4452990 476000 476090 476180
475910 476000 476090 476180 476270 476360 105 16' 21'' W 476450 476540 476630 476720 476810 4453350 4453440 4453260 4453350 4453170 4453260 4453080 4453170 4453080 475820 475910 4452990 476000 476090 476180
Zonal Analysis: A GIS lecture tutorial. Prof. Yuji MURAYAMA, PhD. Mr. Ronald C. ESTOQUE, MSc.
 1 Zonal Analysis: A GIS lecture tutorial Prof. Yuji MURAYAMA, PhD. Mr. Ronald C. ESTOQUE, MSc. 2011 Contents, Data & Software Used Contents 2 1. Introduction 2. Basic concepts & definitions 3. Zonal analysis
Trail Flow: Analysis of Drainage Patterns Affecting a Mountain Bike Trail
 Andy Belcher BAE 590 Professor Huffman 12.9.11 Location Trail Flow: Analysis of Drainage Patterns Affecting a Mountain Bike Trail The location of the project area rests in the Cary area of Wake County,
Updating Slope Topography During Erosion Simulations with the Water Erosion Prediction Project
 This paper was peer-reviewed for scientific content. Pages 882-887. In: D.E. Stott, R.H. Mohtar and G.C. Steinhardt (eds). 2001. Sustaining the Global Farm. Selected papers from the 10th International
Soil Erosion Calculation using Remote Sensing and GIS in Río Grande de Arecibo Watershed, Puerto Rico
 Soil Erosion Calculation using Remote Sensing and GIS in Río Grande de Arecibo Watershed, Puerto Rico Alejandra M. Rojas González Department of Civil Engineering University of Puerto Rico at Mayaguez.
GeoWEPP Tutorial Appendix
 GeoWEPP Tutorial Appendix Chris S. Renschler University at Buffalo - The State University of New York Department of Geography, 116 Wilkeson Quad Buffalo, New York 14261, USA Prepared for use at the WEPP/GeoWEPP
Multiscale Simulation of Land Use Impact on Soil Erosion and Deposition Patterns
 This paper was peer-reviewed for scientific content. Pages 1163-1169. In: D.E. Stott, R.H. Mohtar and G.C. Steinhardt (eds). 2001. Sustaining the Global Farm. Selected papers from the 10th International
NR402 GIS Applications in Natural Resources
 NR402 GIS Applications in Natural Resources Lesson 1 Introduction to GIS Eva Strand, University of Idaho Map of the Pacific Northwest from http://www.or.blm.gov/gis/ Welcome to NR402 GIS Applications in
MONITORING AND MODELING NATURAL AND ANTHROPOGENIC TERRAIN CHANGE
 MONITORING AND MODELING NATURAL AND ANTHROPOGENIC TERRAIN CHANGE Spatial analysis and simulations of impact on landscape processess Helena MITASOVA, Russell S. HARMON, David BERNSTEIN, Jaroslav HOFIERKA,
Existing NWS Flash Flood Guidance
 Introduction The Flash Flood Potential Index (FFPI) incorporates physiographic characteristics of an individual drainage basin to determine its hydrologic response. In flash flood situations, the hydrologic
Classification of Erosion Susceptibility
 GEO327G: GIS & GPS Applications in Earth Sciences Classification of Erosion Susceptibility Denali National Park, Alaska Zehao Xue 12 3 2015 2 TABLE OF CONTENTS 1 Abstract... 3 2 Introduction... 3 2.1 Universal
EVALUATION OF MIGRATION OF HEAVY METAL CONTAINING SEDIMENT RESULTING FROM WATER EROSION USING A GEO- INFORMATION MODEL
 EVALUATION OF MIGRATION OF HEAVY METAL CONTAINING SEDIMENT RESULTING FROM WATER EROSION USING A GEO- INFORMATION MODEL János Tamás, Elza Kovács University of Debrecen, Centre of Agricultural Sciences Department
Hydric Rating by Map Unit Harrison County, Mississippi. Web Soil Survey National Cooperative Soil Survey
 89 9' 7'' W 89 8' 38'' W 30 34' 13'' N 30 33' 57'' N 3383480 3383560 3383640 3383720 3383800 3383880 3383960 293640 293720 293800 293880 293960 294040 294120 294200 294280 294360 3383480 3383560 3383640
Transactions on Information and Communications Technologies vol 18, 1998 WIT Press, ISSN
 STREAM, spatial tools for river basins, environment and analysis of management options Menno Schepel Resource Analysis, Zuiderstraat 110, 2611 SJDelft, the Netherlands; e-mail: menno.schepel@resource.nl
A GIS-based Approach to Watershed Analysis in Texas Author: Allison Guettner
 Texas A&M University Zachry Department of Civil Engineering CVEN 658 Civil Engineering Applications of GIS Instructor: Dr. Francisco Olivera A GIS-based Approach to Watershed Analysis in Texas Author:
4. GIS Implementation of the TxDOT Hydrology Extensions
 4. GIS Implementation of the TxDOT Hydrology Extensions A Geographic Information System (GIS) is a computer-assisted system for the capture, storage, retrieval, analysis and display of spatial data. It
Development and Land Use Change in the Central Potomac River Watershed. Rebecca Posa. GIS for Water Resources, Fall 2014 University of Texas
 Development and Land Use Change in the Central Potomac River Watershed Rebecca Posa GIS for Water Resources, Fall 2014 University of Texas December 5, 2014 Table of Contents I. Introduction and Motivation..4
Chapter 1 Overview of Maps
 Chapter 1 Overview of Maps In this chapter you will learn about: Key points when working with maps General types of maps Incident specific maps Map legend and symbols Map sources A map is a navigational
Geo-spatial Analysis for Prediction of River Floods
 Geo-spatial Analysis for Prediction of River Floods Abstract. Due to the serious climate change, severe weather conditions constantly change the environment s phenomena. Floods turned out to be one of
Soil and Water Conservation Engineering Prof. Rajendra Singh Department of Agricultural and Food Engineering Indian Institute of Technology, Kharagpur
 Soil and Water Conservation Engineering Prof. Rajendra Singh Department of Agricultural and Food Engineering Indian Institute of Technology, Kharagpur Lecture 04 Soil Erosion - Mechanics Hello friends
Workshops funded by the Minnesota Environment and Natural Resources Trust Fund
 Workshops funded by the Minnesota Environment and Natural Resources Trust Fund Conservation Applications of LiDAR Data Workshops funded by: Minnesota Environment and Natural Resources Trust Fund Presented
Assessment of solid load and siltation potential of dams reservoirs in the High Atlas of Marrakech (Moorcco) using SWAT Model
 using SWAT Model") Assessment of solid load and siltation potential of dams reservoirs in the High Atlas of Marrakech (Moorcco) using SWAT Model Amal Markhi: Phd Student Supervisor: Pr :N.Laftrouhi Contextualization Facing
Assessment of solid load and siltation potential of dams reservoirs in the High Atlas of Marrakech (Moorcco) using SWAT Model Amal Markhi: Phd Student Supervisor: Pr :N.Laftrouhi Contextualization Facing
Steve Pye LA /22/16 Final Report: Determining regional locations of reference sites based on slope and soil type. Client: Sonoma Land Trust
 Steve Pye LA 221 04/22/16 Final Report: Determining regional locations of reference sites based on slope and soil type. Client: Sonoma Land Trust Deliverables: Results and working model that determine
Hydric Rating by Map Unit Harrison County, Mississippi 30 27' 27'' 30 26' 57''
 Hydric Rating by Map Unit Harrison County, Mississippi 30 27' 27'' 30 26' 57'' 3370400 3370500 3370600 3370700 3370800 3370900 3371000 3371100 3371200 89 2' 40'' 89 2' 41'' 303700 303700 303800 303800
Watershed Processes and Modeling
 Watershed Processes and Modeling Pierre Y. Julien Hyeonsik Kim Department of Civil Engineering Colorado State University Fort Collins, Colorado Kuala Lumpur - May Objectives Brief overview of Watershed
Geographic Information Systems. Introduction to Data and Data Sources
 Geographic Information Systems Introduction to Data and Data Sources Presented by John Showler, NJDA-SSCC NJ SCD GIS Training Session December 10, 209 The Objectives of this session are 3-fold: 1. Introduce
McHenry County Property Search Sources of Information
 Disclaimer: The information in this system may contain inaccuracies or typographical errors. The information in this system is a digital representation of information derived from original documents; as
Hydric Rating by Map Unit Harrison County, Mississippi
 89 6' 12'' W 89 5' 54'' W 30 28' 47'' N 30 28' 26'' N 3373210 3373290 3373370 3373450 3373530 3373610 3373690 3373770 3373850 298080 298160 298240 298320 298400 298480 298560 30 28' 47'' N Soil Map may
A Help Guide for Using gssurgo to Find Potential Wetland Soil Landscapes
 A Help Guide for Using gssurgo to Find Potential Wetland Soil Landscapes Wetland Mapping Consortium Webinar September 17, 2014 Dr. John M. Galbraith Crop & Soil Environmental Sciences Virginia Tech Wetland
THE three-dimensional computer environment is an innovative
 Evaluating Conservation Practices Using GIS and Virtual Reality Modeling Language Troy J. Lively* and George F. Czapar ABSTRACT In order for conservation practices to be installed most effectively, watershed
GIS-based multiple criteria evaluation for spatial mine management Micaela Grigorescu (Geological Survey of Queensland)
") GIS-based multiple criteria evaluation for spatial mine management Micaela Grigorescu (Geological Survey of Queensland) ACARP Project C21041 (Jane H Hodgkinson, Micaela Preda-Grigorescu, Claire Côte, Habib
GIS-based multiple criteria evaluation for spatial mine management Micaela Grigorescu (Geological Survey of Queensland) ACARP Project C21041 (Jane H Hodgkinson, Micaela Preda-Grigorescu, Claire Côte, Habib
Conservation Planning evaluate land management alternatives to reduce soil erosion to acceptable levels. Resource Inventories estimate current and
 Conservation Planning evaluate land management alternatives to reduce soil erosion to acceptable levels. Resource Inventories estimate current and projected erosion levels and their impact on natural resource
Introduction to GIS I
 Introduction to GIS Introduction How to answer geographical questions such as follows: What is the population of a particular city? What are the characteristics of the soils in a particular land parcel?
METADATA. Publication Date: Fiscal Year Cooperative Purchase Program Geospatial Data Presentation Form: Map Publication Information:
 METADATA CONTOURS Digital Geospatial Metadata: North Central Texas Orthophotography Identification Information Citation Originator: Publication Date: Fiscal Year 2001-2002 Title: Cooperative Purchase Program
Rio Santa Geodatabase Project
 Rio Santa Geodatabase Project Amanda Cuellar December 7, 2012 Introduction The McKinney research group (of which I am a part) collaborates with international and onsite researchers to evaluate the risks
Delineation of Watersheds
 Delineation of Watersheds Adirondack Park, New York by Introduction Problem Watershed boundaries are increasingly being used in land and water management, separating the direction of water flow such that
Custom Soil Resource Report for Forrest County, Mississippi
 United States Department of Agriculture Natural Resources Conservation Service A product of the National Cooperative Soil Survey, a joint effort of the United States Department of Agriculture and other
ENGRG Introduction to GIS
 ENGRG 59910 Introduction to GIS Michael Piasecki March 17, 2014 Lecture 08: Terrain Analysis Outline: Terrain Analysis Earth Surface Representation Contour TIN Mass Points Digital Elevation Models Slope
Welcome to NR502 GIS Applications in Natural Resources. You can take this course for 1 or 2 credits. There is also an option for 3 credits.
 Welcome to NR502 GIS Applications in Natural Resources. You can take this course for 1 or 2 credits. There is also an option for 3 credits. The 1st credit consists of a series of readings, demonstration,
Urban Growth Analysis: Calculating Metrics to Quantify Urban Sprawl
 Urban Growth Analysis: Calculating Metrics to Quantify Urban Sprawl Jason Parent jason.parent@uconn.edu Academic Assistant GIS Analyst Daniel Civco Professor of Geomatics Center for Land Use Education
Great Lakes Online Watershed Interface W. Elliot, Research Engineer USDA Forest Service Rocky Mountain Research Station, Moscow, ID March, 2016
 Great Lakes Online Watershed Interface W. Elliot, Research Engineer USDA Forest Service Rocky Mountain Research Station, Moscow, ID March, 2016 Guidelines for using the Web WEPP Watershed Tool to Support
Management and Use of LiDAR-derived Information. Elizabeth Cook, GIS Specialist
 Management and Use of LiDAR-derived Information Elizabeth Cook, GIS Specialist Advanced LiDAR Workshop March 15, 2012 50-100 gb/county Now What? Project Deliverables LAS mass point files, classification
Technical Drafting, Geographic Information Systems and Computer- Based Cartography
 Technical Drafting, Geographic Information Systems and Computer- Based Cartography Project-Specific and Regional Resource Mapping Services Geographic Information Systems - Spatial Analysis Terrestrial
Designing a Dam for Blockhouse Ranch. Haley Born
 Designing a Dam for Blockhouse Ranch Haley Born CE 394K GIS in Water Resources Term Paper Fall 2011 Table of Contents Introduction... 1 Data Sources... 2 Precipitation Data... 2 Elevation Data... 3 Geographic
Application of USLE Model & GIS in Estimation of Soil Erosion for Tandula Reservoir
 Application of USLE Model & GIS in Estimation of Soil Erosion for Tandula Reservoir Ishtiyaq Ahmad 1, Dr. M. K. Verma 2 1 Ph.D. Research Scholar, Dept. of Civil Engg. NIT Raipur (C.G.) - India 2 Prof.
BUILDING AN ACCURATE GIS
 BUILDING AN ACCURATE GIS 2006 GIS in the Rockies Denver, Colorado September 13, 2006 William E. Linzey United States Department of Commerce National Oceanic and Atmospheric Administration National Geodetic
1. PURPOSE 2. PERIOD OF PERFORMANCE
 Statement of Work Herbarium Voucher Collection Land Management Section, Environmental Security Department Marine Corps Installations West Marine Corps Base Camp Pendleton, California 1. PURPOSE The purpose
Using the Web Soil Survey Resilience and Resistance Score Sheet Soils Report
 Using the Resilience and Resistance Score Sheet Soils Report 1. Go to http://websoilsurvey.nrcs.usda.gov/app/ and click on the Start WSS button. 2. Create an Area of Interest (AOI) using any of the available
Hydric Rating by Map Unit Ocean County, New Jersey (Larsen & N New Prospect Jackson Twp., NJ)
") 74 16' 14'' W Hydric Rating by Map Unit Ocean County, New Jersey ( ) 74 15' 50'' W 40 9' 17'' N 40 8' 53'' N 4444460 4444550 4444640 4444730 4444820 4444910 4445000 4445090 4445180 562120 562210 562300
74 16' 14'' W Hydric Rating by Map Unit Ocean County, New Jersey ( ) 74 15' 50'' W 40 9' 17'' N 40 8' 53'' N 4444460 4444550 4444640 4444730 4444820 4444910 4445000 4445090 4445180 562120 562210 562300
What Is Water Erosion? Aren t they the same thing? What Is Sediment? What Is Sedimentation? How can Sediment Yields be Minimized?
 Jerald S. Fifield, Ph.D. CISEC HydroDynamics Incorporated Parker, CO 303-841-0377 Aren t they the same thing? What Is Sediment? Soil particles deposited or suspended in water or air The process of depositing
Digital Elevation Models. Using elevation data in raster format in a GIS
 Digital Elevation Models Using elevation data in raster format in a GIS What is a Digital Elevation Model (DEM)? Digital representation of topography Model based on scale of original data Commonly a raster
INTERNATIONAL JOURNAL OF PURE AND APPLIED RESEARCH IN ENGINEERING AND TECHNOLOGY
 INTERNATIONAL JOURNAL OF PURE AND APPLIED RESEARCH IN ENGINEERING AND TECHNOLOGY A PATH FOR HORIZING YOUR INNOVATIVE WORK SPECIAL ISSUE FOR NATIONAL LEVEL CONFERENCE "SUSTAINABLE TECHNOLOGIES IN CIVIL
INTRODUCTION TO ARCGIS 10
 Department of Irrigation, Drainage and Landscape Engineering, Faculty of Civil Engineering, CTU Prague Institute of Hydraulics and Rural Water Management BOKU Vienna INTRODUCTION TO ARCGIS 10 MAIN WINDOW
GeoWEPP The Geo-spatial interface for the Water Erosion Prediction Project
 This is not a peer-reviewed article Paper Number: 022171 An ASAE Meeting Presentation GeoWEPP The Geo-spatial interface for the Water Erosion Prediction Project Chris S. Renschler University at Buffalo
ENGRG Introduction to GIS
 ENGRG 59910 Introduction to GIS Michael Piasecki November 17, 2017 Lecture 11: Terrain Analysis Outline: Terrain Analysis Earth Surface Representation Contour TIN Mass Points Digital Elevation Models Slope
June 2018 WORKSHOP SECTION 2 MANUAL: RUNNING PTMAPP-DESKTOP AN INNOVATIVE SOLUTION BY:
 June 2018 WORKSHOP SECTION 2 MANUAL: RUNNING PTMAPP-DESKTOP AN INNOVATIVE SOLUTION BY: TABLE OF CONTENTS 1 PURPOSE... 3 2 SET UP DATA PATHS... 4 2.1 BASE DATA SETUP... 4 3 INGEST DATA... 6 3.1 CLIP WATERSHED...
GIS Boot Camp for Education June th, 2011 Day 1. Instructor: Sabah Jabbouri Phone: (253) x 4854 Office: TC 136
 x 4854 Office: TC 136") GIS Boot Camp for Education June 27-30 th, 2011 Day 1 Instructor: Sabah Jabbouri Phone: (253) 833-9111 x 4854 Office: TC 136 Email: sjabbouri@greenriver.edu http://www.instruction.greenriver.edu/gis/ Summer
GIS Boot Camp for Education June 27-30 th, 2011 Day 1 Instructor: Sabah Jabbouri Phone: (253) 833-9111 x 4854 Office: TC 136 Email: sjabbouri@greenriver.edu http://www.instruction.greenriver.edu/gis/ Summer
Hydrology and Floodplain Analysis, Chapter 10
 Hydrology and Floodplain Analysis, Chapter 10 Hydrology and Floodplain Analysis, Chapter 10.1 Introduction to GIS GIS Geographical Information System Spatial Data Data linked with geographical location
Watershed Application of WEPP and Geospatial Interfaces. Dennis C. Flanagan
 Watershed Application of WEPP and Geospatial Interfaces Dennis C. Flanagan Research Agricultural Engineer USDA-Agricultural Research Service Adjunct Professor Purdue Univ., Dept. of Agric. & Biol. Eng.
Urban Tree Canopy Assessment Purcellville, Virginia
 GLOBAL ECOSYSTEM CENTER www.systemecology.org Urban Tree Canopy Assessment Purcellville, Virginia Table of Contents 1. Project Background 2. Project Goal 3. Assessment Procedure 4. Economic Benefits 5.
identify tile lines. The imagery used in tile lines identification should be processed in digital format.
 Question and Answers: Automated identification of tile drainage from remotely sensed data Bibi Naz, Srinivasulu Ale, Laura Bowling and Chris Johannsen Introduction: Subsurface drainage (popularly known
Lecture 9: Reference Maps & Aerial Photography
 Lecture 9: Reference Maps & Aerial Photography I. Overview of Reference and Topographic Maps There are two basic types of maps? Reference Maps - General purpose maps & Thematic Maps - maps made for a specific
McHenry County Property Search Sources of Information
 Disclaimer: The information in this system may contain inaccuracies or typographical errors. The information in this system is a digital representation of information derived from original documents; as
TSEGI WASH 50% DESIGN REPORT
 TSEGI WASH 50% DESIGN REPORT 2/28/2014 Daniel Larson, Leticia Delgado, Jessica Carnes I Table of Contents Acknowledgements... IV 1.0 Project Description... 1 1.1 Purpose... 1 Figure 1. Erosion of a Headcut...
Woodford County Erosion Prevention Plan and Permit. Application #
 Woodford County Erosion Prevention Plan and Permit Application # Date Instructions: Applicant will complete Parts A and B, and attach a proposed site diagram. This diagram must be completed in accordance
Waterborne Environmental, Inc., Leesburg, VA, USA 2. Syngenta Crop Protection, LLC, North America 3. Syngenta Crop Protection, Int.
 Application of High Resolution Elevation Data (LiDAR) to Assess Natural and Anthropogenic Agricultural Features Affecting the Transport of Pesticides at Multiple Spatial Scales Josh Amos 1, Chris Holmes
GEOSPATIAL ENGINEER ALC
 FORT LEONARD WOOD, MO NONCOMMISIONED OFFICERS ACADEMY SYLLABUS FOR 12Y3O ADVANCED LEADER COURSE GEOSPATIAL ENGINEER ALC Purpose: The 12Y30 Geospatial Engineer Advanced Leader Course is designed to develop
Geographic Systems and Analysis
 Geographic Systems and Analysis New York University Robert F. Wagner Graduate School of Public Service Instructor Stephanie Rosoff Contact: stephanie.rosoff@nyu.edu Office hours: Mondays by appointment
The GeoCLIM software for gridding & analyzing precipitation & temperature. Tamuka Magadzire, FEWS NET Regional Scientist for Southern Africa
 The GeoCLIM software for gridding & analyzing precipitation & temperature Tamuka Magadzire, FEWS NET Regional Scientist for Southern Africa Outline What is GeoCLIM GeoCLIM Development Team GeoCLIM: objectives
Estimation of sediment yield using Remote Sensing (RS) and Geographic Information System (GIS) technique
 and Geographic Information System (GIS) technique") Serials Publications Estimation of sediment yield using Remote Sensing (RS)... National Academy of Agricultural Science (NAAS) Rating : 3. 03 Estimation of sediment yield using Remote Sensing (RS) and
Serials Publications Estimation of sediment yield using Remote Sensing (RS)... National Academy of Agricultural Science (NAAS) Rating : 3. 03 Estimation of sediment yield using Remote Sensing (RS) and
The effect of soil physical parameters on soil erosion. Introduction. The K-factor
 Geographical Bulletin 2004. Tom. LIII. No. 1 2. pp.77 84. The effect of soil physical parameters on soil erosion ÁDÁM KERTÉSZ TAMÁS HUSZÁR GERGELY JAKAB 1 Introduction The factor K of the Universal Soil
 estrandh@uoregon.edu Introduction The general topic of this paper describes a unique cartographic project depicting a mountain landscape for the Friends of Opal Creek (F.O.C.), a non-profit organization.
Integrating Geographical Information Systems (GIS) with Hydrological Modelling Applicability and Limitations
 with Hydrological Modelling Applicability and Limitations") Integrating Geographical Information Systems (GIS) with Hydrological Modelling Applicability and Limitations Rajesh VijayKumar Kherde *1, Dr. Priyadarshi. H. Sawant #2 * Department of Civil Engineering,
Integrating Geographical Information Systems (GIS) with Hydrological Modelling Applicability and Limitations Rajesh VijayKumar Kherde *1, Dr. Priyadarshi. H. Sawant #2 * Department of Civil Engineering,
Tangible GIS for real-time human interaction with landscape models. L. Mitas, H. Mitasova, NCSU; C Ratti, MIT
 Tangible GIS for real-time human interaction with landscape models Statement of the problem L. Mitas, H. Mitasova, NCSU; C Ratti, MIT New mapping technologies, such as Real Time Kinematic GPS, IFSARE or
Introducing GIS analysis
 1 Introducing GIS analysis GIS analysis lets you see patterns and relationships in your geographic data. The results of your analysis will give you insight into a place, help you focus your actions, or
Alaska, USA. Sam Robbins
 Using ArcGIS to determine erosion susceptibility within Denali National Park, Alaska, USA Sam Robbins Introduction Denali National Park is six million acres of wild land with only one road and one road
SWAMP GIS: A spatial decision support system for predicting and treating stormwater runoff. Michael G. Wing 1 * and Derek Godwin
 Journal of Spatial Hydrology Vol. 11, No. 2 Fall 2011 SWAMP GIS: A spatial decision support system for predicting and treating stormwater runoff Michael G. Wing 1 * and Derek Godwin Abstract SWAMP GIS
Semester Project Final Report. Logan River Flood Plain Analysis Using ArcGIS, HEC-GeoRAS, and HEC-RAS
 Semester Project Final Report Logan River Flood Plain Analysis Using ArcGIS, HEC-GeoRAS, and HEC-RAS Kedric Curtis, Josh Hogge, Jordan Jarrett, Jared Justensen May 6, 2016 CEE 6190 GIS for Civil Engineers
Improvement of the National Hydrography Dataset for US Forest Service Region 3 in Cooperation with the National Forest Service
 Improvement of the National Hydrography Dataset for US Forest Service Region 3 in Cooperation with the National Forest Service Christian L. DeCasas California State University, Northridge November 7 th,
GIS Topographic Wetness Index (TWI) Exercise Steps
 Exercise Steps") GIS Topographic Wetness Index (TWI) Exercise Steps October 2016 Jeffrey L. Zimmerman, Jr. GIS Analyst James P. Shallenberger Manager, Monitoring & Protection Susquehanna River Basin Commission Table of
GIS Topographic Wetness Index (TWI) Exercise Steps October 2016 Jeffrey L. Zimmerman, Jr. GIS Analyst James P. Shallenberger Manager, Monitoring & Protection Susquehanna River Basin Commission Table of
GIS in Water Resources Midterm Exam Fall 2008 There are 4 questions on this exam. Please do all 4.
 Page 1 of 8 Name: GIS in Water Resources Midterm Exam Fall 2008 There are 4 questions on this exam. Please do all 4. 1. Basic Concepts [20 points] Find the letter with the best answer for each term: 1.
ArcGIS for the Military: Analyzing the Operational Environment
 Federal GIS Conference 2014 February 10 11, 2014 Washington DC ArcGIS for the Military: Analyzing the Operational Environment Matt Funk Esri (Redlands) ArcGIS for the Military Operations Planning Mounted
Section 4: Model Development and Application
 Section 4: Model Development and Application The hydrologic model for the Wissahickon Act 167 study was built using GIS layers of land use, hydrologic soil groups, terrain and orthophotography. Within
Custom Soil Resource Report Soil Map
 121 3' 56'' W Custom Soil Resource Report Soil Map 121 2' 49'' W 45 16' 39'' N 5013800 5014000 5014200 5014400 5014600 5014800 5015000 5015200 5015400 5015600 651800 652000 652200 652400 652600 652800
Office of Geographic Information Systems
 Winter 2007 Department Spotlight SWCD GIS by Dave Holmen, Dakota County Soil and Water Conservation District The Dakota County Soil and Water Conservation District (SWCD) has collaborated with the Dakota
Soil erosion susceptibility and coastal evolution: examples in southern New Caledonia
 Pacific Island Countries GIS /RS User Conference Soil erosion susceptibility and coastal evolution: examples in southern New Caledonia Pascal DUMAS et Olivier COHEN University of New-Caledonia (EA 4242/
Soil Map Polk County, Florida
 Soil Map Polk County, Florida 28 9' 21'' 28 8' 23'' 3113000 3113200 3113400 3113600 3113800 3114000 3114200 3114400 3114600 81 51' 19'' 81 51' 19'' 416000 416000 ± 416200 416200 68 416400 68 416400 7 13
Remote Sensing and GIS Applications for Hilly Watersheds SUBASHISA DUTTA DEPARTMENT OF CIVIL ENGINEERING IIT GUWAHATI
 Remote Sensing and GIS Applications for Hilly Watersheds SUBASHISA DUTTA DEPARTMENT OF CIVIL ENGINEERING IIT GUWAHATI Deciding Alternative Land Use Options in a Watershed Using GIS Source: Anita Prakash
New Land Cover & Land Use Data for the Chesapeake Bay Watershed
 New Land Cover & Land Use Data for the Chesapeake Bay Watershed Why? The Chesapeake Bay Program (CBP) partnership is in the process of improving and refining the Phase 6 suite of models used to inform
MISSOURI LiDAR Stakeholders Meeting
 MISSOURI LiDAR Stakeholders Meeting East-West Gateway June 18, 2010 Tim Haithcoat Missouri GIO Enhanced Elevation Data What s different about it? Business requirements are changing.fast New data collection
Lab 1: Importing Data, Rectification, Datums, Projections, and Coordinate Systems
 Lab 1: Importing Data, Rectification, Datums, Projections, and Coordinate Systems Topics covered in this lab: i. Importing spatial data to TAS ii. Rectification iii. Conversion from latitude/longitude
Analysis of Road Sediment Accumulation to Monumental Creek using the GRAIP Method
 Analysis of Road Sediment Accumulation to Monumental Creek using the GRAIP Method Introduction (from http://www.neng.usu.edu/cee/faculty/dtarb/graip/#over): The Geomorphologic Road Analysis and Inventory
Lab 7: Cell, Neighborhood, and Zonal Statistics
 Lab 7: Cell, Neighborhood, and Zonal Statistics Exercise 1: Use the Cell Statistics function to detect change In this exercise, you will use the Spatial Analyst Cell Statistics function to compare the
DESCRIPTION OF A HYDROLOGIC DATASET. Department of Environmental Sciences, Wageningen University and. Research Center. Wageningen, The Netherlands
 DESCRIPTION OF A HYDROLOGIC DATASET FOR THE BRISY SUBCATCHMENT R. T. Oosterho? and C. Paniconi y? Department of Environmental Sciences, Wageningen University and Research Center Wageningen, The Netherlands
RANCHO de DOS PALMAS DAVIS, California, AC +/-
 RANCHO de DOS PALMAS DAVIS, California, 507.28 AC +/- Boundary Transmission Line Pond / Tank Well SCOTT STONE P: (530) 662-4094 sastone57@gmail.com 37874 County Road 28, Woodland, Ca. 95695 The information
APPENDIX B HYDROLOGY
 APPENDIX B HYDROLOGY TABLE OF CONTENTS 1.0 INTRODUCTION... 1 2.0 PROBABLE MAXIMUM PRECIPITATION (PMP)... 1 3.0 DESIGN FLOW CALCULATION... 1 4.0 DIVERSION CHANNEL SIZING... 2 5.0 REFERENCES... 4 LIST OF