DETECTING SHIFTS IN WILDLIFE MOVEMENT PATTERNS ASSOCIATED WITH ROAD ENHANCEMENT: THE WILDCAT CANYON ROAD BEFORE-AFTER-CONTROL-IMPACT STUDY
|
|
|
- Silvester McDowell
- 5 years ago
- Views:
Transcription
1 DETECTING SHIFTS IN WILDLIFE MOVEMENT PATTERNS ASSOCIATED WITH ROAD ENHANCEMENT: THE WILDCAT CANYON ROAD BEFORE-AFTER-CONTROL-IMPACT STUDY June 3, 2005 Prepared for: 2005 ESRI International User Conference Prepared by: Wendy Orth, San Diego County Department of Public Works and Erin Riley, EDAW, Inc.
2 TABLE OF CONTENTS Section Page ABSTRACT... 4 PROJECT DESCRIPTION...4 MEETING PROJECT OBJECTIVES WITH GIS... 7 METHODS... 8 Species Studied... 8 Study Design Data Collection... 9 Transects and Tracking Stations... 9 Roadkill GIS Application Data Collection The Use of Mobile GIS Statistics Data Summary Transect and Tracking Station Data Movement Patterns Preferred Direction of Movement Relative Activity Levels Large-scale Movement Patterns Roadkill Data GIS Application Data Summary Preparation of Species Data Maps Movement Patterns Large-scale Movement Patterns Study Considerations RESULTS GIS-based Solutions Movement Patterns Roadkill DISCUSSION Next Steps Wildcat Canyon Road Before-After-Control-Impact Study Page 2
3 ACKNOWLEDGEMENTS REFERENCES AUTHOR INFORMATION LIST OF FIGURES Figure Page 1 Regional Location Map Wildcat Canyon BACI Study Vicinity Setting Study Area and Sample Units Reaches, Topography and Steep Slope Reference Reaches, Vegetation and Developed Areas Reference LIST OF MAPS Map Page 1 All Focal Species Preferred Direction of Movement and Relative Activity Level Roadkill Survey Data Study Area Movement Patterns LIST OF PHOTOS Photo Page 1 Transect Segment Tracking Station LIST OF TABLES Table Page 1 Identification of Sample Locations... 9 Wildcat Canyon Road Before-After-Control-Impact Study Page 3
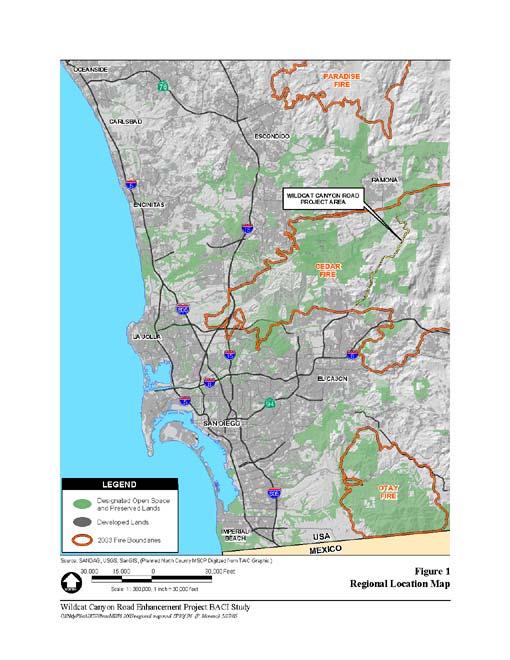
4 Detecting Shifts in Wildlife Movement Patterns Associated with Road Enhancement: The Wildcat Canyon Road Before-After-Control-Impact Study ABSTRACT To complete a Before-After-Control-Impact Study (BACI study), mobile geographic information system (GIS), statistical analyses, and ArcView were used to collect and analyze wildlifetracking data in rural San Diego County. The BACI study is part of a road-widening project, which includes the installation of undercrossings to facilitate wildlife movement across Wildcat Canyon Road, preventing population fragmentation. The BACI study was designed to monitor wildlife activity for 1 year pre- and postconstruction to determine if the road-widening project has changed the wildlife activity patterns in this important wildlife corridor and to test the effectiveness of the road undercrossings and directional fencing. During the preconstruction data collection, the Cedar Fire of October 2003 burned the entire study area, adding to the complexity of the data analysis. Mobile GIS, statistical analyses, and ArcView were used to identify and describe preconstruction movement trends. The postconstruction portion of the study is scheduled to begin in August 2006, using similar analyses. PROJECT DESCRIPTION The Wildcat Canyon Road Enhancement Project proposes improvements to Wildcat Canyon Road to reduce traffic hazards in an area that functions as a major regional wildlife corridor in rural San Diego County (Figure 1). The study area is located along Wildcat Canyon Road from the Barona Indian Resort and Casino (northern boundary) to the intersection of Wildcat Canyon Road with Willow Road (southern boundary) in Lakeside, California (Figure 2). The eastern and western boundaries of the study area are at least 1 kilometer east and west of the portion of Wildcat Canyon Road being improved. Roads and vehicles affect the mobility and survival of wildlife across a landscape and can cause population fragmentation. However, appropriately designed enhancement projects that include undercrossings and directional fencing can facilitate wildlife movement across roadways. A BACI study was designed for the project to determine impacts of the road enhancement on wildlife movement and the success of the installed crossings. Wildcat Canyon Road Before-After-Control-Impact Study Page 4
5

6
7 By definition, BACI studies are designed to determine impacts of disturbances or changes on the environment (Smith 2002). The Wildcat Canyon BACI study design includes pre- and postconstruction studies to examine changes in ecological measures potentially associated with an impact (Kerlinger 2002; Underwood 1991). BACI studies function on the assumption that it is possible to replicate environmental units before and after an impact (Pollock 1994) to identify changes that are associated with the impact rather than natural changes. Because trends in the environment are common and could be caused by human activity or natural events such as drought, fire, and other natural occurrences, it is necessary to pair a treatment site (area where impact occurs) with reference or control sites (Kerlinger 2002; Paul and Bustard 2004; Pollock 1994; Smith 2002). A BACI study design assumes that the control and impact sites are subject to the same ecological trends (Smith et al. 1993) and behave in a linear relationship to each other. This assumption necessitates that sufficient data are collected for robust statistical results before the impact occurs to identify the trends and meet the assumptions of the BACI study design. This is especially important when capturing recovery trends after natural disaster, such as fire, which was a factor in this BACI study. The Wildcat Canyon BACI study design includes data collection for 1 year prior and 1 year after construction (pre- and postconstruction) and employs transect, tracking station, and roadkill surveys to characterize wildlife movement for 14 mammal species. The Cedar Fire of October 2003 burned the entire study area between the first and second surveys. Survey results were analyzed using GIS and a variety of statistical analyses. The goals of the BACI study are to address the following questions: Does the construction of a 1-mile passing lane and other traffic improvements on Wildcat Canyon Road impact wildlife movement? Do the wildlife crossings (to be installed or improved during project construction) facilitate wildlife movement through the project impact area? What further refinements to crossing structures (e.g., changes in fencing design) might improve crossing function and reduce roadkill for this project? MEETING PROJECT OBJECTIVES WITH GIS Most of the project objectives will be met following completion of the postconstruction portion of the BACI study. To meet the objectives of the preconstruction portion of the BACI study, and Wildcat Canyon Road Before-After-Control-Impact Study Page 7
8 to have the postconstruction portion be consistent and comparable with the preconstruction portion, GIS was used to solve the following problems: How to consistently collect data considering variables such as a large field crew and data collection over several years at multiple sample points How to visually represent data collected at each sample point considering that multiple survey methods were used and several species were observed How to visually represent movement patterns How to identify and quantify roadkill concentration points METHODS Various methods were used to select the study species, survey the project area, create maps, and analyze data collected. Species Studied The following 14 mammals known to occur within the project area were selected as focal species for the study: mountain lion (Felis concolor), coyote (Canis latrans), bobcat (Lynx rufus), gray fox (Urocyon cineroargenteus), Virginia opossum (Didelphis virginiana), northern raccoon (Procyon lotor), American badger (Taxidea taxus), long-tailed weasel (Mustela frenata), ringtail (Bassariscus astutus), striped skunk (Mephitis mephitis), spotted skunk (Spilogale gracilis), mule deer (Odocoileus hemionus), black-tailed jackrabbit (Lepus californicus), and dusky-footed woodrat (Neotoma fuscipes). Species were selected based on any or all of the following factors: physical body size and home range size relative sensitivity indicator species for large-scale movement (Beier 1993; Gilpin and Soule 1986; Ogden 1992) None of these species are migratory in southern California, which eliminated the need to consider migratory seasonal movement trends. However, activity levels, behavioral patterns, and movement distances may vary throughout the seasons due to such factors as mating activities, birthing activities, and resource availability. Wildcat Canyon Road Before-After-Control-Impact Study Page 8
9 It was determined that sustaining viable populations of many smaller mammal species occurring within the project area would not necessitate road crossings provided that large habitat patches were available on one side of the road (Gilpin and Soule 1986; Noss 1987); thus, such small mammal species as the California ground squirrel (Spermophilus beecheyi); cottontails and rabbits (Sylvilagus sp.); and species of rodentia, herpetofauna, avifauna, coleoptera, and myriapods were not studied. However, their presence was recorded on field data sheets. Study Design Data Collection The study compares measurements of wildlife use in areas affected by the project (treatment), with areas not affected (controls). Controls include areas more than 1 kilometer from the road (interior control), and areas near the road (near-road controls) (Figure 3). The near-road control is located north and south of the treatment along Wildcat Canyon Road. The interior control is at least 1 kilometer east and west of the treatment. Because 14 focal species were selected, various survey methods were used to increase the likelihood that sign of each species would be observed during the surveys. The following three survey types were used: transect, tracking station, and roadkill surveys were conducted from September 2003 through July 2004 and January 2005 through July Transects and Tracking Stations The layout of the study design includes systematically placed transects and tracking stations throughout the three sample units (treatment, interior control, and near-road control). A systematic design was used over a random layout to increase wildlife detection, and to avoid the undersampling of wildlife movement observations due to routes not being randomly dispersed. Based on access permission and existing topography and habitat, varying numbers of transects and tracking stations were placed within the three sample units (Table 1). Table 1 Identification of Sample Locations Sample unit Transects Tracking Stations Treatment 14 segments 14 stations Interior Control 74 segments 20 stations Near-Road Control 30 segments 16 stations Wildcat Canyon Road Before-After-Control-Impact Study Page 9

10
11 During a reconnaissance survey conducted in July 2003, transects (Photo 1) were identified along wildlife trails, hiking trails, or dirt roads that showed evidence of wildlife use. Tracking stations (approximately 1.5-meter square area that had been swept clear and covered with finegrain sifted soil substrate) (Photo 2) were placed along wildlife trails or road-crossing points evidenced by observation of sign during the reconnaissance survey. Transects were walked once every other month to document the type and location of wildlife sign (tracks, scat, etc.) and the direction of individual travel. Tracking stations were monitored for 4 consecutive days once every other month to record wildlife tracks and direction of movement. Roadkill The roadkill survey involved walking along either side of the road within the study area for 3 consecutive days every 2 weeks to document the location and species of roadkill. All roadkill found during roadkill surveys were recorded via Global Positioning System (GPS) and marked with a small spot of spray paint to avoid duplication of data between survey days. The study area was subdivided into four reaches that were used as sample locations for the roadkill analysis. The reaches reflect natural divisions for east-west movement patterns and are of approximately equal length. They were defined by four factors: topography, steep slopes (>33%), developed areas, and vegetation communities. GIS Application Data Collection The Use of Mobile GIS Mobile GIS allowed for consistent collection of transect and tracking station data by a large field crew over several years at multiple sample points. Mobile GIS technology allowed for field mapping applications to be undertaken with project guidelines intact, more precision, and data integrity. For this project, Trimble GPS GeoXT and ArcPad software (version 6.0.3) were used as the basis for mobile GIS. Trimble s GeoXT handheld GPS units were loaded with ArcPad software (version 6.0.3). The GeoXT handheld GPS units are lightweight, versatile, and durable, thus allowing for ease of data collection along vigorous hikes over rough terrain. The ArcPad software allowed for a common interface/menu to be used so that data collection efforts over numerous surveys by various surveyors were consistent. Having GIS available in the field allowed the survey teams to access the same maps and data as the GIS team in the office; record Wildcat Canyon Road Before-After-Control-Impact Study Page 11


12 Photo 1. Transect Segment Photo 2. Tracking Station Wildcat Canyon Road Before-After-Control-Impact Study Page 12
13 new survey points (tracking stations or transect segments) as necessary; and observe these data points in relation to existing data in real time. After the Cedar Fire, it was often necessary to move the location of a station due to such factors as erosion and construction. Additionally, in a burned landscape, it was beneficial to have a postfire aerial with prefire survey points uploaded into the Trimble GeoXT to find, and if necessary relocate, survey points in a landscape transformed by the fire. Mobile GIS provided the benefits of more accurate data collection, data interaction, and field verification. The ability of having data collection occur in an organized manner over a large, burned project area by multiple users was critical to obtaining accurate data in a timely manner. Using mobile GIS assisted project goals by simplifying data integration with less office time spent entering and organizing the data. Statistics Data Summary Transect and Tracking Station Data Profile analyses and canonical correlation analyses were conducted on the preconstruction data to quantitatively compare study units. These analyses also created a baseline of preconstruction results to which postconstruction data can be compared. For statistical analysis, it is important that the treatment represents the area one would expect to be affected with sufficient replicate samples for quantitative comparison. Therefore, multiple identical samples were taken over time to separate treatment effects from any other variations. Because ecological sites differ in practical settings, replication is used to estimate natural variation and to determine if the observed trends correspond to natural trends. Statistical analyses were conducted on the following datasets: all focal species combined, individual focal species (for which substantial data for individual analysis existed), and all other focal species (for which data were infrequently recorded). The latter consisted of combined data for all focal species without substantial data for individual analysis. Analyses were run independently to show activity level differences between sample units and survey periods. The analyses used the time interval of survey month as the key factor for comparisons across sample units. Separate analyses including and excluding Survey #1 (prefire) were conducted to determine whether the fire caused differences in focal species detections across sample units. Wildcat Canyon Road Before-After-Control-Impact Study Page 13
14 Movement Patterns Three separate approaches were used to determine movement patterns across the study area. Preferred Direction of Movement Small-scale directional movement preferences were determined by calculating a circular mean per dataset for each transect and tracking station. The circular mean determined the preferred direction of movement for the species. By definition, a circular mean consists of two parts, a direction (O) and a magnitude (r). Direction is indicated in units of degrees based on a geographical compass. Magnitude is a measure of the strength of the vector. Additionally, a P value was calculated for each circular mean to determine significance. Relative Activity Levels Relative activity levels were also calculated for each transect and tracking station to compare activity levels (number of individual passes observed) across sample points. Activity levels were calculated by standardizing data separately for either transects or tracking stations to a maximal value for the whole and then dividing every value in the dataset by that maximum. Calculated proportions were scaled to the largest recorded value. Large-scale Movement Patterns Large-scale movement patterns across the landscape were identified based on the profile analyses results and the visual analysis of preferred direction of movement, relative activity level, roadkill concentrations, topography, developed areas, resource availability, and vegetation communities. Roadkill Data Roadkill data were summarized by quantifying the raw data per species and calculating means per survey period for each reach. Preconstruction roadkill data were not statistically analyzed. Dense concentrations of roadkill were visually identified based on mapped roadkill data (Map 2). A roadkill concentration was defined as an obvious cluster of roadkill occurrences. These concentrations considered data on all observed wildlife species, not just focal species. Roadkill concentrations represent locations that appear most problematic for wildlife movement. Wildcat Canyon Road Before-After-Control-Impact Study Page 14
15 GIS Application Data Summary Preparation of Species Data Maps Species data maps prepared for each of the six preconstruction survey periods were created using ESRI s ArcGIS software. Aerial photography, park lands, topography, and roads were used as base map data. Survey data was then overlaid from transects and tracking stations. Transect data maps for each survey reflected data per 100-meter segment along each transect. Each segment has a tally for each of the 14 focal species observed respective to each survey period. Each species was given a two-letter code and corresponding color label placed along the mapped segment showing how many individuals of each species were found at that segment. This allows the reader to easily distinguish between each segment and see the frequency and distribution of identified animals. The tracking station maps were similarly created with the exception that the stations reflect point data while the survey transects reflect linear data. Thus, the species data maps reflect the frequency of individual focal species and the biodiversity of focal species observed at each segment or station. Movement Patterns GIS was used in the preparation of maps reflecting the preferred direction of movement, the relative activity level, and the large-scale movement patterns datasets, as described above. These are reflected in Maps 1 and 3. Maps showing preferred direction of movement were created using ArcGIS software. Map 1 shows the movement data for all focal species. The circular mean is symbolized by a pie chart and arrow concept to show each relative activity level, preferred direction of movement, and magnitude of directional preference. The pie chart shows a blue shaded area reflecting the relative activity level of a particular transect or station as compared to all other transects or stations. This allows an understanding of which transects and stations had the greatest and the least activity per dataset. The arrow symbol s position on the pie chart shows the mean compass-oriented direction of travel preferred by focal species at that location. The size of the arrow shows the magnitude of preference for movement in that direction. Thus, the larger the arrow is, the greater the preference of movement in that direction. Utilizing this two-pronged pie chart-and-arrow approach, it was possible to show relative activity levels and preferred directions of movement along each surveyed transect and station. Map 1 presents a visually appreciable representation of exactly where most focal species occur within the study area and in which direction most focal species tend to move at each sample point. Wildcat Canyon Road Before-After-Control-Impact Study Page 15
16 Large-scale Movement Patterns Large-scale movement patterns across the landscape are shown in Map 3. These movement patterns were developed based on the profile analysis results; the visual analysis of preferred direction of movement and relative activity levels (Map 1); roadkill concentrations (Map 2); and topography, developed areas, and vegetation communities (Figures 4 and 5). Areas with higher activity levels and statistically significant direction of movement (depicted in Map 1) were given greatest consideration in identifying these large-scale movement patterns. The results of the profile analyses, which identify differences in activity levels between sample units, were considered when determining large-scale movement patterns. These movement patterns were identified for all focal species, but not for individual species because profile analyses and circular mean values were often not significant and roadkill data for individual focal species were scarce. Roadkill concentrations (Map 2) represent local scale movement trends. These local trends were factored into the development of the large-scale movement trends. Additionally, large-scale movement patterns were identified based on topography features, absence of developed areas, and vegetation communities that facilitate wildlife movement. Study Considerations Several factors were considered when evaluating the integrity of the study design, such as access, topography, habitat types, and the Cedar Fire of Access Multiple areas of privately owned, undeveloped land (e.g., Silverwood Wildlife Sanctuary, High Meadows Ranch) were excluded from the study design due to access restrictions, which resulted in gaps in spatial sampling coverage of the study area (Figure 3). Topography and Habitat Type o Habitat types were generalized into three broad categories: chaparral, coast live oak/riparian, and coastal sage scrub/disturbed. Postfire conditions contained minimal structural distinction between habitat types. Potential biases existed between sample units based on topography or habitat type surrounding transect segments and tracking stations. o Track detectability along transects varied between survey periods based on variable substrate conditions. The effects of weather patterns on natural substrate, often in relation to postfire habitat recovery, created varying substrate conditions, some of which optimized track detectability, and others that minimized it. Wildcat Canyon Road Before-After-Control-Impact Study Page 16

17

18
19 Cedar Fire o The most striking consideration during the study was the Cedar Fire, which burned the entire site in October The fire removed nearly all natural vegetation that would have been used as cover by focal species living in or moving through the study area. Because the fire had a relatively equal effect on the treatment and controls, it did not directly invalidate the BACI study design. However, the timing of the fire, between the first and second survey periods, meant that survey data collected before the fire might differ greatly from data collected after the fire, potentially compromising the integrity of the study design. o For the purpose of study analysis, it was assumed that the Cedar Fire affected the entire study area equally. However, statistical analyses that included and excluded Survey #1 were run to test this assumption. RESULTS Based on the principles discussed above, the preconstruction survey resulted in the identification of 13 large-scale movement patterns (Map 3) that will serve as the baseline for comparison with the postconstruction conditions. Large-scale movement patterns identified within the study area were determined through interpretation of several analyses, including profile analyses, relative activity level of different species (Map 1), preferred direction of movement (Map 1), roadkill concentrations (Map 2), and general field observations. GIS-based Solutions The ability for the project survey teams to have consistent work flow while covering rugged terrain in varied conditions was essential to the project goals and timelines. Mobile GIS helped facilitate the goal of maintaining consistent data gathering while teams were on the move from station to station and along survey transects. The use of mobile GIS has also helped the project teams use the data more readily and easily in the office after field efforts and to compare the data of previous surveys while in the field. The use of mobile GIS on this project aided both field and office staff by saving time, avoiding duplication of efforts, and removing confusion on proper data collection techniques. This resulted in project data more readily available for mapping and analysis with a minimum of preparation and transformation from one form of data to another. The use of ArcPad software and Trimble GPS as the basis for the mobile GIS used has been a great learning experience for all staff involved from the field to the office. This project has spearheaded a whole new and different approach for our field efforts. The benefits of going to a mobile GIS have far outweighed the costs, due to the time saved and lessons learned. Wildcat Canyon Road Before-After-Control-Impact Study Page 19
20 Movement Patterns Circular means for all focal species (Map 1) identified localized preferred direction of movement. Direction preferences were supported by field observations and were attributed to multiple factors, including localized trails/roads, topographic features, and locations of resources. For example, preferred direction of movement at Station 44C (Map 1) was to the southwest. This direction follows the oak riparian habitat adjacent to the road in a deep canyon. Thus, little movement in other directions would be expected. Statistically significant circular means were verified through general field observations and considered in identifying large-scale movement patterns (Map 3). For example, arrows pointing northeast or southwest at Transects 5C and 6C, and Stations 32C, 35C, and 37C (Map 2) were considered when identifying the large-scale movement arrow in this same area (Map 3). However, field observations were sometimes given stronger consideration than circular means in identification of large-scale movement patterns because the circular mean calculation is uni-directional and localized and does not consider contiguous movement across the landscape. For example, the overall observed pattern of movement around Transect 8C in Reach 4 was in a northwesterly-southeasterly direction along the transect and across the road (Map 3). However, circular mean calculations associated with these sample points do not reflect this pattern when viewed individually. Field observations confirmed a difference in relative activity level between sample points for all focal species (Map 1). Highest localized activity level at transects and tracking stations in the interior control and the majority of the near-road control could be attributed to high-quality habitat and lack of developed areas. For example, Transects 1C and 10C, and Stations 4C, 37C, and 38C, all exhibiting high relative activity levels, are located in areas of pristine chaparral adjacent to oak riparian habitat and are at least ¼ mile from human development. These sample points are also separated from development by geographical features, such as large ridges, that provide further shelter from human-related disturbances. Lower localized activity levels in the treatment and portions of the near-road control could be attributed to factors such as proximity to developed areas (Transect 7T; Stations 39C, 40C) and postfire recovery patterns including hydroseed/nonnative grass establishment (Stations 36C, 42C). Those areas with higher localized activity levels were given stronger consideration when identifying large-scale movement patterns (Map 3). Roadkill Although linear features such as roads constitute a general impediment to wildlife movement (Finnis 1960; Haugen 1944), preconstruction roadkill results indicate certain portions of Wildcat Canyon Road appear more hazardous than others to crossing wildlife. These portions of the road are indicated by roadkill concentrations (Map 2) that were attributed to a variety of factors, Wildcat Canyon Road Before-After-Control-Impact Study Page 20
21 including concentrations caused by the surrounding environment and those caused by the existing road configuration. Factors included topography, resource availability, density of vegetation, culverts, sharp road curves, and areas of high vehicle speed. Roadkill data collected within the preconstruction survey consisted mostly of small, nonfocal species. This may reflect several possible scenarios. With larger body sizes, focal species may be more visible to drivers and may allow for longer reaction time to reduce vehicle speed and avoid the crossing animal. Several larger focal species, such as bobcat and coyote, are capable of moving faster across the road surface than smaller mammal species and are thus more likely to avoid collision with a vehicle. The Cedar Fire may have influenced which species were observed as roadkill. Most of the roadkill data were collected immediately after the Cedar Fire, revealing a cross section of wildlife species (which happened to be mostly nonfocal species) fleeing the approaching fire. Most focal species have low density/large area requirements, meaning that fewer individuals of a focal species inhabit the study area compared to smaller mammals such as cottontail and Norwegian rats. Thus, it would be expected that smaller species such as cottontails would be proportionally affected in higher numbers by fire-flight-induced roadkill than focal species. Several roadkill concentrations are located in the vicinity of existing undercrossings and proposed crossings. For example, Concentration 4 is located at the proposed 14-foot x 12-foot wildlife/equestrian tunnel near the northern boundary of the treatment (Map 2). Concentration 5 is located approximately 600 feet north of the existing 48-inch twin box culverts that are proposed for improvements (Map 2). Comparing preconstruction roadkill concentrations to postconstruction roadkill data may have implications on the location and design of wildlife crossings and associated fencing design. If postconstruction data reveal a decrease of roadkill concentrations in the treatment, coupled with a constant level of wildlife activity, one could assume that either the crossing design and fencing design were successful in facilitating wildlife movement, or that animals avoided this area and crossed elsewhere. The latter could result in shifted roadkill concentrations. This potential shift should be detected by increase in concentrations in the near-road control. A successful crossing design would result in a combination of the following: (1) a decrease in roadkill at this location; (2) results indicating successful use of the crossing structure; and (3) no increase in roadkill concentrations north and south of this location. Roadkill concentrations positively identify areas of wildlife movement across the road. Concentrations were also considered in identifying large-scale movement patterns (Map 3). Concentration 2 in Reach 2 (Map 2) corresponds to the east-west large-scale movement pattern identified at this location (Map 3); Concentration 5 in Reach 3 corresponds to the northwest- Wildcat Canyon Road Before-After-Control-Impact Study Page 21
22 southeast large-scale movement pattern identified at this location (Map 3). Concentrations 9 and 10 in Reach 4 (Map 2) are in proximity to the northwest-southeast large-scale movement pattern identified at this location (Map 3). One potential benefit for the future of the project success and objectives is an MS Access database. This database, compiling data from all surveys throughout the study, will allow for easier statistical analysis. It also allows for queries and overall ease of use for not only the GIS analysis and maps but also for running reports and other querying capabilities as needs arise. Another benefit for the future of the project is all the experience gained working with the project data from all standpoints of GIS and biology. Quantifiable roadkill results conceptualizing the spatial relationships of roadkill concentration points could be achieved by performing a cluster analysis with a spatial statistics GIS extension. Cluster analysis is an exploratory data analysis tool, which aids in discovering the degree of association and patterns within a dataset. Identifying clusters is a way of looking at more than one variable. In this case, not only are we looking at the geographical location of a roadkill, but also what species it is, to see if and how the two points are related. The ArcMap spatial statistics toolbar in ArcToolbox gives several ways of mathematically searching for roadkill points within a given length of road. The cluster tools differ by their method of mathematical calculations; all the inputs by the common GIS user would be the same for each. Without intensive research on each method, the best way to decide which one is right for a particular study is to try out various types as well as research what parameters to input into the tool. The parameters are defining a minimum number of points set as a concentration as well as a maximum search area. The chosen cluster tool would then search the length of road in overlapping segments of the search area for groups containing at least the minimum number of roadkill defined as significant. The minimum parameter criteria would be defined to avoid overlap of multiple concentration points, which could occur if roadkill was sparsely distributed. The defined parameters of the roadkill concentrations should be consistent between pre- and postconstruction analyses. This type of GIS analysis would also provide geographic coordinates associated with each concentration point allowing for a spatial comparison to determine the distances between pre- and postconstruction roadkill concentration points. DISCUSSION The objectives of the study will be fulfilled by determining if there are differences between the treatment and controls in relationship to preconstruction and postconstruction survey periods, and if a difference can be linked to construction-related impacts. The study employs various methods to test whether there is wildlife movement, where movement occurs, and where activity Wildcat Canyon Road Before-After-Control-Impact Study Page 22
23 level is highest. Only after the postconstruction portion of the study can it be determined whether impacts to movement were attributed to the road enhancement project. The secondary objective of the study is to test whether designed wildlife crossings function properly, which again can only be determined after completion of the postconstruction portion of the study. Study results with relevance to the preconstruction study design and data analysis are discussed below, as well as study shortcomings and recommendations for future surveys. Wildcat Canyon Road is characterized by its rural character, surrounding open space, and topography, which all facilitate wildlife movement. The Multiple Species Conservation Program (MSCP) preserve design shows Wildcat Canyon Road as a regionally important north-south wildlife movement corridor. However, no controlled studies had been performed to substantiate this assumption. The large-scale movement patterns established from the preconstruction results of this BACI study demonstrate that the study area is being used as a wildlife movement corridor despite being burned during the 2003 Cedar Fire. It also shows that movement is not limited to a north-south direction but moves east-west across the study area, connecting large expanses of open space. Completion of the BACI study will determine any effects of the project on these movement patterns and the ability of the proposed undercrossings to better maintain the study area as a functioning corridor. Many focal species analyzed in this study require multiple habitat types for large-scale movement. This movement is influenced by a variety of factors such as habitat quality, which is defined by the presence of water, forage, prey items, and cover (Jaegar 2000). Topography, dispersal routes, and species-specific seasonal activity also direct large-scale movement (Carr et al. 2002). For example, mule deer are more prone to move in areas of dense cover such as drainages (Mansfield and Miller 1975), and mule deer bucks in search of mates may move through areas during the breeding season that are not traversed during the rest of the year (Buchanan 1987). In addition, factors such as developed areas and roads with heavy traffic may influence movement direction (Lovallo and Anderson 1996). Next Steps It is recommended that a statistical power analysis be run prior to future data collection to define a sufficient sample size and error rates for this study. Additional preconstruction surveys are recommended to increase the preconstruction study rigor. During future pre- and postconstruction surveys, the roadkill study area should be extended, additional sampling locations and camera stations added, and more rigorous statistical analysis provided, specifically for the roadkill data and directional movement trends. The postconstruction portion of this study will use similar analyses and is scheduled to begin in September Wildcat Canyon Road Before-After-Control-Impact Study Page 23
24

25


26
27 ACKNOWLEDGEMENTS The San Diego County Department of Public Works would like to thank the following for their contributions to this report: the U.S. Fish and Wildlife Service, the California Department of Fish and Game, the U.S. Geological Society, Dr. Michael Patten of the University of Oklahoma, Dr. Scott Mills of the University of Montana, Wayne Spencer of the Conservation Biology Institute, and Christina Schaefer of Technology Associates International Corporation. Wildcat Canyon Road Before-After-Control-Impact Study Page 27
28 REFERENCES Beier, Paul 1993 Determining minimum habitat areas and habitat corridors for cougars. Conservation Biology 7: Buchanan, J.B Seasonality in the occurrence of long-tailed weasel road-kills. Murrelet 68: Carr, L.W., L. Fahrig, and S.E. Pope 2002 Impacts of landscape transformation by roads. In Applying Landscape Ecology in Biological Conservation, edited by K.J. Gutzwiller, Springer. pp Gilpin, M.E., and M.E. Soule 1986 Minimum viable populations: Processes of species extinction. In: M.E. Soule (Ed.) Conservation Biology: the science of scarcity and diversity. pp Jaegar, J.A.G Landscape division, splitting index, and effective mesh size: New measures of landscape fragmentation. Landscape Ecology 15: Kerlinger, P An assessment of the impacts of Green Mountain Power Corporation s Searsburg, Vermont, wind power facility and breeding and migrating birds. Curry & Kerlinger, L.L.C. Mansfield, T.M., and B.D. Miller 1975 Highway Deer-Kill District 02 Regional Study. Internal report. Sacramento: California Department of Transportation. Noss, R.F Protecting natural areas in fragmented landscapes. Natural Areas Journal 7:2-13. Ogden Environmental and Energy Services Co., Inc. (Ogden) 1992 Baldwin Otay Ranch Wildlife Corridor Studies. December. Wildcat Canyon Road Before-After-Control-Impact Study Page 28
29 Paul, A.J., and D. Bustard 2004 Study designs for environmental impact assessment: an example using bull trout (Salvelinus confluentus) and the Kemess South Mine Project. Proc. Forest Land- Fish Conference II Ecosystem Stewardship through Collaboration. Eds. G.J. Scrimgeour, G. Eisler, B. McCulloch, U. Silins and M. Monita, April 26-28, Edmonton, Alberta. pp Pollock, K.H Assessing avian wind power interactions: sampling, study design and statistical issues National Avian-Wind Power Planning Meeting Proceedings. Smith, E.P BACI design. Encyclopedia of Environmetrics. Eds. Abdel H. El-Shaarawi and Walter W. Piegorsch (ISBN ), 1: Smith, E.P., D. Orvos, and J. Cairns Jr Impact assessment using before-after control-impact (BACI) models: concerns and comments. Can. J. Fish. Aquat. Sci. 50: Underwood, A.J Beyond BACI: Experimental designs for detecting human environmental impacts of temporal variations in natural populations. Austral. J. Marine Freshw. Res. 42: Wildcat Canyon Road Before-After-Control-Impact Study Page 29
30 AUTHOR INFORMATION Wendy Orth Biologist/Environmental Planner San Diego County Department of Public Works 5469 Kearny Villa Road San Diego, California fax Erin Riley Wildlife Biologist EDAW, Inc Kettner Boulevard, Suite 620 San Diego, California fax Wildcat Canyon Road Before-After-Control-Impact Study Page 30
Putative Canada Lynx (Lynx canadensis) Movements across I-70 in Colorado
 Movements across I-70 in Colorado") Putative Canada Lynx (Lynx canadensis) Movements across I-70 in Colorado INTRODUCTION March 8, 2012 Jake Ivan, Mammals Researcher Colorado Parks and Wildlife 317 W. Prospect Fort Collins, CO 80526 970-472-4310
Putative Canada Lynx (Lynx canadensis) Movements across I-70 in Colorado INTRODUCTION March 8, 2012 Jake Ivan, Mammals Researcher Colorado Parks and Wildlife 317 W. Prospect Fort Collins, CO 80526 970-472-4310
NOSE HILL PARK LINEAR BIRD TRANSECTS 2006
 NOSE HILL PARK LINEAR BIRD TRANSECTS 2006 Prepared by: Sweetgrass Consultants Ltd. Calgary, AB For: CITY OF CALGARY PARKS January 2007 Sweetgrass Consultants Ltd. 15112 Deer Run Dr. S.E. Calgary, AB T2J
H IGHWAY 3 WILDLIFE MORTALITY
 Miistakis Institute for the Rockies H IGHWAY 3 WILDLIFE MORTALITY CONTENTS Introduction 1 Methods 2 Data Limitations 3 Results 3 Discussion 8 Special points of interest: The analysis includes mortality
Chapter 6. Field Trip to Sandia Mountains.
 University of New Mexico Biology 310L Principles of Ecology Lab Manual Page -40 Chapter 6. Field Trip to Sandia Mountains. Outline of activities: 1. Travel to Sandia Mountains 2. Collect forest community
Desktop GIS for Geotechnical Engineering
 Desktop GIS for Geotechnical Engineering Satya Priya Deputy General Manager (Software) RMSI, A-7, Sector 16 NOIDA 201 301, UP, INDIA Tel: +91-120-2511102 Fax: +91-120-2510963 Email: Satya.Priya@rmsi.com
1.1 What is Site Fingerprinting?
 Site Fingerprinting Utilizing GIS/GPS Technology 1.1 What is Site Fingerprinting? Site fingerprinting is a planning tool used to design communities where protection of natural resources is the primary
Pierce Cedar Creek Institute GIS Development Final Report. Grand Valley State University
 Pierce Cedar Creek Institute GIS Development Final Report Grand Valley State University Major Goals of Project The two primary goals of the project were to provide Matt VanPortfliet, GVSU student, the
WILDLIFE CORRIDOR MONITORING STUDY
 WILDLIFE CORRIDOR MONITORING STUDY Bobcat at culvert under SR-67 Multiple Species Conservation Program March 2003 WILDLIFE CORRIDOR MONITORING STUDY Multiple Species Conservation Program Prepared for California
Grant Opportunity Monitoring Bi-State Sage-grouse Populations in Nevada
 Grant Opportunity Monitoring Bi-State Sage-grouse Populations in Nevada Proposals are due no later than November 13, 2015. Grant proposal and any questions should be directed to: Shawn Espinosa @ sepsinosa@ndow.org.
Map and Compass Skills
 Map and Compass Skills Grade levels: 5-12 In a Nutshell Given a map and compass, students will be able to find a location on the map, chart a course to that location with the compass, and find that location
Summary Description Municipality of Anchorage. Anchorage Coastal Resource Atlas Project
 Summary Description Municipality of Anchorage Anchorage Coastal Resource Atlas Project By: Thede Tobish, MOA Planner; and Charlie Barnwell, MOA GIS Manager Introduction Local governments often struggle
WEBINAR AGENDA. Review of connectivity mapping progress to date. Describe draft methodology for delineating and validating core areas
 WEBINAR AGENDA Review of connectivity mapping progress to date Describe draft methodology for delineating and validating core areas Review examples of the methodology implemented in the Highlands Explain
Spatio-temporal Patterns of Wildlife Distribution and Movement in Canmore s Benchlands Corridor.
 Spatio-temporal Patterns of Wildlife Distribution and Movement in Canmore s Benchlands Corridor. March 2010 Prepared by Tracy Lee, Samantha Managh and Neil Darlow Prepared for: Alberta Tourism, Parks and
Crystal Moncada. California State University San Bernardino. January- July Brett R. Goforth- Department of Geography and Environmental Studies
 A Geographical Information System (GIS) Based Evaluation of Landslide Susceptibility Mapped on the Harrison Mountain Quadrangle of the Santa Ana River Watershed Crystal Moncada California State University
Huron Creek Watershed 2005 Land Use Map
 Huron Creek Watershed 2005 Land Use Map Created By: Linda Kersten, 12/20/06 Created For: MTU Introduction to GIS Class (FW 5550) The Huron Creek Watershed Advisory Committee Michigan Technological University,
Progress on Defense-Related Uranium Mines Program
 Progress on Defense-Related Uranium Mines Program Russel Edge US Department of Energy (DOE) Office of Legacy Management (LM) John Elmer Navarro Research and Engineering, Inc., Contractor to LM Uranium
10/13/2011. Introduction. Introduction to GPS and GIS Workshop. Schedule. What We Will Cover
 Introduction Introduction to GPS and GIS Workshop Institute for Social and Environmental Research Nepal October 13 October 15, 2011 Alex Zvoleff azvoleff@mail.sdsu.edu http://rohan.sdsu.edu/~zvoleff Instructor:
1/28/16. EGM101 Skills Toolbox. Map types. Political Physical Topographic Climate Resource Road. Thematic maps (use one of the above as backdrop)
") EGM101 Skills Toolbox Map types Political Physical Topographic Climate Resource Road Thematic maps (use one of the above as backdrop) Map Types Deriving information from maps Hydrographic Geological Soils
EGM101 Skills Toolbox Map types Political Physical Topographic Climate Resource Road Thematic maps (use one of the above as backdrop) Map Types Deriving information from maps Hydrographic Geological Soils
Vegetation and Wildlife Habitat Mapping Study in the Upper and Middle Susitna Basin Study Plan Section 11.5
 (FERC No. 14241) Vegetation and Wildlife Habitat Mapping Study in the Upper and Middle Susitna Basin Study Plan Section 11.5 Initial Study Report Part C: Executive Summary and Section 7 Prepared for Prepared
Creating a Pavement Management System Using GIS
 Christopher Castruita PPD 631 Prof. Barry Waite & Prof. Bonnie Shrewsbury Creating a Pavement Management System Using GIS Problem Definition As is the case with many cities, the city of La Cañada Flintridge
Eagle Creek Post Fire Erosion Hazard Analysis Using the WEPP Model. John Rogers & Lauren McKinney
 Eagle Creek Post Fire Erosion Hazard Analysis Using the WEPP Model John Rogers & Lauren McKinney Columbia River Gorge at Risk: Using LiDAR and GIS-based predictive modeling for regional-scale erosion susceptibility
Southwest LRT Habitat Analysis. May 2016 Southwest LRT Project Technical Report
 Southwest LRT Habitat Analysis Southwest LRT Project Technical Report This page intentionally blank. Executive Summary This technical report describes the habitat analysis that was performed to support
Lesson Nine Population Problems. Key question How does growth of Florida s human population affect bear populations?
 Lesson Nine Population Problems Key question How does growth of Florida s human population affect bear populations? Conceptual frameworks topics IV.C. Florida black bear seasonal activities and movements
Priority areas for grizzly bear conservation in western North America: an analysis of habitat and population viability INTRODUCTION METHODS
 Priority areas for grizzly bear conservation in western North America: an analysis of habitat and population viability. Carroll, C. 2005. Klamath Center for Conservation Research, Orleans, CA. Revised
ENV208/ENV508 Applied GIS. Week 1: What is GIS?
 ENV208/ENV508 Applied GIS Week 1: What is GIS? 1 WHAT IS GIS? A GIS integrates hardware, software, and data for capturing, managing, analyzing, and displaying all forms of geographically referenced information.
Give 4 advantages of using ICT in the collection of data. Give. Give 4 disadvantages in the use of ICT in the collection of data
 Give 4 advantages of using ICT in the collection of data can use a handheld GPS to get accurate location information which can be used to show data linked to specific locations within a GIS can collect
December 13, Kirk Shields Green Mountain Power 163 Acorn Lane Colchester, VT 05446
 December 13, 2017 Kirk Shields Green Mountain Power 163 Acorn Lane Colchester, VT 05446 RE: End of Field Letter for Archaeological Phase II Site Evaluation at Site VT-CH-1218 within the Proposed Milton
Projecting a Gully on Wilson Ranch Meadow, Eldorado National Forest By David Russell and Angelina Lasko Humboldt State University
 Projecting a Gully on Wilson Ranch Meadow, Eldorado National Forest By David Russell and Angelina Lasko Humboldt State University Introduction The purpose of this project is to create a digital elevation
Gateway Trail Project
 Gateway Trail Project Debris Flow Hazard Assessment By: Juan de la Fuente April 30, 2010 Background- On April 22, 2010, the Shasta-Trinity National Forest (Mt. Shasta-McCloud Unit) requested a geologic
Managing Grizzly Bear Data. ESRI 2009 International User Conference, San Diego, California Presented by: Julie Duval, July 15, 2009
 Managing Grizzly Bear Data ESRI 2009 International User Conference, San Diego, California Presented by: Julie Duval, July 15, 2009 Agenda 1) Overview of the Foothills Research Institute 2) Grizzly Bear
Neighborhood Locations and Amenities
 University of Maryland School of Architecture, Planning and Preservation Fall, 2014 Neighborhood Locations and Amenities Authors: Cole Greene Jacob Johnson Maha Tariq Under the Supervision of: Dr. Chao
THE WILDLIFE SOCIETY CONFERENCE 2015
 THE WILDLIFE SOCIETY CONFERENCE 2015 Evaluation of Desert Tortoise Habitat Suitability Model Predictions in the Soda Mountain Area, San Bernardino County Susanne Heim Introduction Overview of Species Habitat
Continental Divide National Scenic Trail GIS Program
 CDNST Vision Statement: Provide the most accurate geospatial locational information of the Continental Divide Trail and nearby resources to the public as well as help provide internal management information
If you aren t familiar with Geographical Information Systems (GIS), you. GIS, when combined with a database that stores response information,
, you. GIS, when combined with a database that stores response information,") Geographical Information Systems in EMS By William E. Ott If you aren t familiar with Geographical Information Systems (GIS), you should take a look at what GIS can offer you as an EMS manager. GIS, when
Geographical Information Systems in EMS By William E. Ott If you aren t familiar with Geographical Information Systems (GIS), you should take a look at what GIS can offer you as an EMS manager. GIS, when
Description of Simandou Archaeological Potential Model. 12A.1 Overview
 12A Description of Simandou Archaeological Potential Model 12A.1 Overview The most accurate and reliable way of establishing archaeological baseline conditions in an area is by conventional methods of
Aerial Photography and Imagery Resources Guide
 Aerial Photography and Imagery Resources Guide Cheyenne and Laramie County Cooperative GIS Created and Maintained by the GIS Coordinator for the Cooperative GIS Program March 2011 CHEYENNE / LARAMIE COUNTY
INDOT Office of Traffic Safety
 Intro to GIS Spatial Analysis INDOT Office of Traffic Safety Intro to GIS Spatial Analysis INDOT Office of Traffic Safety Kevin Knoke Section 130 Program Manager Highway Engineer II Registered Professional
23. SUBSISTENCE USES AND TRADITIONAL KNOWLEDGE
 23. SUBSISTENCE USES AND TRADITIONAL KNOWLEDGE 23.1 Introduction The purpose of the subsistence uses and traditional knowledge study is to establish a description of subsistence uses and knowledge of local
Moose Day Summary Report 8th Annual February 27th, 2016
 Moose Day Summary Report 8th Annual February 27th, 2016 Photo taken by Kathy McCurdy. Moose Day 2016 Prepared by: Paul Hood and Alyson Courtemanch Jackson Hole Wildlife Foundation Nature Mapping Jackson
2009 WMU 525 Moose. Section Authors: Nathan Carruthers and Dave Moyles
 2009 WMU 525 Moose Section Authors: Nathan Carruthers and Dave Moyles Suggested Citation: Carruthers, N. and D. Moyles. WMU 525 Moose. Pages 78 83. In: N. Webb and R. Anderson. Delegated aerial ungulate
Outline. 15. Descriptive Summary, Design, and Inference. Descriptive summaries. Data mining. The centroid
 Outline 15. Descriptive Summary, Design, and Inference Geographic Information Systems and Science SECOND EDITION Paul A. Longley, Michael F. Goodchild, David J. Maguire, David W. Rhind 2005 John Wiley
Four aspects of a sampling strategy necessary to make accurate and precise inferences about populations are:
 Why Sample? Often researchers are interested in answering questions about a particular population. They might be interested in the density, species richness, or specific life history parameters such as
VCS MODULE VMD0018 METHODS TO DETERMINE STRATIFICATION
 VMD0018: Version 1.0 VCS MODULE VMD0018 METHODS TO DETERMINE STRATIFICATION Version 1.0 16 November 2012 Document Prepared by: The Earth Partners LLC. Table of Contents 1 SOURCES... 2 2 SUMMARY DESCRIPTION
Through their research, geographers gather a great deal of data about Canada.
 Ecozones What is an Ecozone? Through their research, geographers gather a great deal of data about Canada. To make sense of this information, they often organize and group areas with similar features.
Additional Testing for Padre Dam Eastern Service Area Secondary Connection- Alternative Site Location, San Diego County, California
 Mark Niemiec Padre Dam Municipal Water District P.O. Box 719003 9300 Fanita Parkway Santee, California 92072 Re: Additional Testing for Padre Dam Eastern Service Area Secondary Connection- Alternative
Alamito Creek Preserve Ranches for Sale Marfa, Presidio County, Texas
 Alamito Creek Preserve Ranches for Sale Marfa, Presidio County, Texas James King, Agent Office 432 426.2024 Cell 432 386.2821 James@KingLandWater.com Alamito Creek Preserve Various size Ranch Properties,
Welcome to NetMap Portal Tutorial
 Welcome to NetMap Portal Tutorial Potential Applications What Can you do with the Portal? At least 25 things! 1) Locate the best potential fish habitats. 2) Identify biological hotspots. 3) Map floodplain
Data Dictionary for Network of Conservation Areas Transcription Reports from the Colorado Natural Heritage Program
 Data Dictionary for Network of Conservation Areas Transcription Reports from the Colorado Natural Heritage Program This Data Dictionary defines terms used in Network of Conservation Areas (NCA) Reports
August 14, James Bolton 312 Perry Lane Lovingston, VA
 August 14, 2017 James Bolton 312 Perry Lane Lovingston, VA 22949 jrbolton035@gmail.com Department of Environmental Quality Office of Wetlands & Stream Protection P.O. Box 1105 Richmond, VA 23218 comment-acp@deq.virginia.gov
National Wildland Significant Fire Potential Outlook
 National Wildland Significant Fire Potential Outlook National Interagency Fire Center Predictive Services Issued: September, 2007 Wildland Fire Outlook September through December 2007 Significant fire
The Road to Data in Baltimore
 Creating a parcel level database from high resolution imagery By Austin Troy and Weiqi Zhou University of Vermont, Rubenstein School of Natural Resources State and local planning agencies are increasingly
4. GIS Implementation of the TxDOT Hydrology Extensions
 4. GIS Implementation of the TxDOT Hydrology Extensions A Geographic Information System (GIS) is a computer-assisted system for the capture, storage, retrieval, analysis and display of spatial data. It
Saving the Leuser Ecosystem with Arc GIS
 Brian Mattern APEC 480 Saving the Leuser Ecosystem with Arc GIS Background: Right now, a significant and relatively unreported crisis is occurring on the island of Sumatra. The Leuser ecosystem is a topographically
Lynx and Other Carnivore Surveys in Wisconsin in Winter
 Lynx and Other Carnivore Surveys in Wisconsin in Winter 2003-2004 By Adrian P. Wydeven, Jane E. Wiedenhoeft, Ronald N. Schultz and Sarah Boles Wisconsin DNR, Park Falls September 13, 2004 For: U.S. Fish
Nebraska Conservation and Environmental Review Tool (CERT): Terminology used in the Tables of the CERT Report
: Terminology used in the Tables of the CERT Report") Nebraska Conservation and Environmental Review Tool (CERT): Terminology used in the Tables of the CERT Report Nebraska Natural Heritage Program Nebraska Game and Parks Commission February 8, 2018 Contents
Nebraska Conservation and Environmental Review Tool (CERT): Terminology used in the Tables of the CERT Report Nebraska Natural Heritage Program Nebraska Game and Parks Commission February 8, 2018 Contents
Field Survey for Laramie Columbine. (Aquilegia laramiensis) In the Rawlins Field Office
 In the Rawlins Field Office") Field Survey for Laramie Columbine (Aquilegia laramiensis) In the Rawlins Field Office prepared for the Wyoming Natural Diversity Database, University of Wyoming, and the Bureau of Land Management, Rawlins
Field Survey for Laramie Columbine (Aquilegia laramiensis) In the Rawlins Field Office prepared for the Wyoming Natural Diversity Database, University of Wyoming, and the Bureau of Land Management, Rawlins
Appendix J Vegetation Change Analysis Methodology
 Appendix J Vegetation Change Analysis Methodology Regional Groundwater Storage and Recovery Project Draft EIR Appendix-J April 2013 APPENDIX J- LAKE MERCED VEGETATION CHANGE ANALYSIS METHODOLOGY Building
The following maps must be provided as a part of the ADA. The appropriate scale for each map should be determined at the pre application conference.
 Main Street @ Coconut Creek DRI QUESTION 9 MAPS The following maps must be provided as a part of the ADA. The appropriate scale for each map should be determined at the pre application conference. Map
Quail Habitat Assessment
 Quail Habitat Assessment A struggle for survival at the Pea Ridge National Military Park Created by Michael Moser, Environmental Special Problem, Kurtis Cecil, Instructor Special thanks to: Professor Lowrey,
Initial Report. North Central Texas Initial Attack. Hildreth Road Dozer Accident. February 9, 2006
 6.152 February 17, 2006 Initial Report North Central Texas Initial Attack Hildreth Road Dozer Accident February 9, 2006 This report is intended to inform interested parties, for a safety and training tool,
Aerial Photography and Imagery Resources Guide
 Aerial Photography and Imagery Resources Guide Cheyenne and Laramie County Cooperative GIS Created and Maintained by the GIS Coordinator for the Cooperative GIS Program May 2016 CHEYENNE / LARAMIE COUNTY
Renewable Energy Development and Airborne Wildlife Conservation
 Whitepaper ECHOTRACK TM RADAR ACOUSTIC TM SURVEILLANCE SYSTEM Renewable Energy Development and Airborne Wildlife Conservation Renewable energy developers must meet regulatory requirements to mitigate for
BUILDING AN ASSET MANAGEMENT GEODATABASE FOR RANCHING. Matt Crawford, GISP
 BUILDING AN ASSET MANAGEMENT GEODATABASE FOR RANCHING Matt Crawford, GISP Introduction East Foundation Formed in 2007 Mission Research Education Outreach Properties Six ranches ~ 215,000 acres San Antonio
Geographic Information Systems Conceptual Site Model for Ordnance and Explosives Remediation at the Formerly Used Defense Site Camp Beale
 Geographic Information Systems Conceptual Site Model for Ordnance and Explosives Remediation at the Formerly Used Defense Site Camp Beale Jeremy Gessaro The Formerly Used Defense Site Camp Beale Conceptual
GeoComputation 2011 Session 4: Posters Discovering Different Regimes of Biodiversity Support Using Decision Tree Learning T. F. Stepinski 1, D. White
 Discovering Different Regimes of Biodiversity Support Using Decision Tree Learning T. F. Stepinski 1, D. White 2, J. Salazar 3 1 Department of Geography, University of Cincinnati, Cincinnati, OH 45221-0131,
ISU GIS CENTER S ARCSDE USER'S GUIDE AND DATA CATALOG
 ISU GIS CENTER S ARCSDE USER'S GUIDE AND DATA CATALOG 2 TABLE OF CONTENTS 1) INTRODUCTION TO ARCSDE............. 3 2) CONNECTING TO ARCSDE.............. 5 3) ARCSDE LAYERS...................... 9 4) LAYER
Relationship between weather factors and survival of mule deer fawns in the Peace Region of British Columbia
 P E A C E R E G I O N T E C H N I C A L R E P O R T Relationship between weather factors and survival of mule deer fawns in the Peace Region of British Columbia by: Nick Baccante and Robert B. Woods Fish
Dunn County Snow Removal Policy
 Dunn County Snow Removal Policy OVERVIEW With the advent of another winter season in the northern plains comes the possibility of snow, freezing rain and slippery roadways, and area resident s concern
Natalie Cabrera GSP 370 Assignment 5.5 March 1, 2018
 Network Analysis: Modeling Overland Paths Using a Least-cost Path Model to Track Migrations of the Wolpertinger of Bavarian Folklore in Redwood National Park, Northern California Natalie Cabrera GSP 370
GIS and Coastal Nutrients Luke Cole
 GIS and Coastal Nutrients Luke Cole Human population density has been widely utilized as a valid predictor of terrestrial nitrogen loads into marine systems. As 50% of the world s population lives within
TREASURE COAST REGIONAL PLANNING COUNCIL M E M O R A N D U M. To: Council Members AGENDA ITEM 4B10
 TREASURE COAST REGIONAL PLANNING COUNCIL M E M O R A N D U M To: Council Members AGENDA ITEM 4B10 From: Date: Subject: Staff December 14, 2018 Council Meeting Local Government Comprehensive Plan Review
Landslide Computer Modeling Potential
 Landslide Computer Modeling Potential Michael D. Dixon, P.E. Civil Engineer Payette National Forest The Payette National Forest selected the Stability Index Mapping (SINMAP) model for use in identifying
Exercise 2: Working with Vector Data in ArcGIS 9.3
 Exercise 2: Working with Vector Data in ArcGIS 9.3 There are several tools in ArcGIS 9.3 used for GIS operations on vector data. In this exercise we will use: Analysis Tools in ArcToolbox Overlay Analysis
Chapter 1 Overview of Maps
 Chapter 1 Overview of Maps In this chapter you will learn about: Key points when working with maps General types of maps Incident specific maps Map legend and symbols Map sources A map is a navigational
California Urban and Biodiversity Analysis (CURBA) Model
 Model") California Urban and Biodiversity Analysis (CURBA) Model Presentation Overview Model Overview Urban Growth Model Policy Simulation and Evaluation Model Habitat Fragmentation Analysis Case Study: Santa
California Urban and Biodiversity Analysis (CURBA) Model Presentation Overview Model Overview Urban Growth Model Policy Simulation and Evaluation Model Habitat Fragmentation Analysis Case Study: Santa
GIS Workshop Data Collection Techniques
 GIS Workshop Data Collection Techniques NOFNEC Conference 2016 Presented by: Matawa First Nations Management Jennifer Duncan and Charlene Wagenaar, Geomatics Technicians, Four Rivers Department QA #: FRG
RE: End of Field Letter for the Proposed Milton Mears Farm Road Solar Project, Milton, Chittenden County, Vermont
 October 10, 2017 Kirk Shields Green Mountain Power 163 Acorn Lane Colchester, VT 05446 RE: End of Field Letter for the Proposed Milton Mears Farm Road Solar Project, Milton, Chittenden County, Vermont
Waterborne Environmental, Inc., Leesburg, VA, USA 2. Syngenta Crop Protection, LLC, North America 3. Syngenta Crop Protection, Int.
 Application of High Resolution Elevation Data (LiDAR) to Assess Natural and Anthropogenic Agricultural Features Affecting the Transport of Pesticides at Multiple Spatial Scales Josh Amos 1, Chris Holmes
CAUSES FOR CHANGE IN STREAM-CHANNEL MORPHOLOGY
 CAUSES FOR CHANGE IN STREAM-CHANNEL MORPHOLOGY Chad A. Whaley, Department of Earth Sciences, University of South Alabama, MobileAL, 36688. E-MAIL: caw408@jaguar1.usouthal.edu The ultimate goal of this
Describing Greater sage-grouse (Centrocercus urophasianus) Nesting Habitat at Multiple Spatial Scales in Southeastern Oregon
 Nesting Habitat at Multiple Spatial Scales in Southeastern Oregon") Describing Greater sage-grouse (Centrocercus urophasianus) Nesting Habitat at Multiple Spatial Scales in Southeastern Oregon Steven Petersen, Richard Miller, Andrew Yost, and Michael Gregg SUMMARY Plant
Describing Greater sage-grouse (Centrocercus urophasianus) Nesting Habitat at Multiple Spatial Scales in Southeastern Oregon Steven Petersen, Richard Miller, Andrew Yost, and Michael Gregg SUMMARY Plant
Colorado Front Range Wildfires Situation Report #7 Monday, July 02, :15 AM (MDT)
") Colorado Front Range Wildfires Situation Report #7 Monday, July 02, 2012 10:15 AM (MDT) Mandatory evacuations for the Waldo Canyon fire have been reduced from 35,000 to 3,000. Remaining evacuations are
Colorado Front Range Wildfires Situation Report #7 Monday, July 02, 2012 10:15 AM (MDT) Mandatory evacuations for the Waldo Canyon fire have been reduced from 35,000 to 3,000. Remaining evacuations are
Chapter 4 AND 5 Practice
 Name: Chapter 4 AND 5 Practice 1. Events that occur in four different ecosystems are shown in the chart below. Which ecosystem would most likely require the most time for ecological succession to restore
FIGURE 1 Example schematic of flagging model. Study Design and Results
 DEER-FLAGGING MODELS Some experts believe that white-tailed deer raise their tails to expose their white undersurface as a warning communication between their species. One study was found that evaluated
Lower Pinhook Spring Condition Assessment
 Lower Pinhook Spring Condition Assessment Location: Castle Valley Allotment, Manti-La Sal National Forest Date: September 23, 2016 Begin/End Time: 10:30am to 12:30pm Whitman College Semester in the West
NR402 GIS Applications in Natural Resources
 NR402 GIS Applications in Natural Resources Lesson 1 Introduction to GIS Eva Strand, University of Idaho Map of the Pacific Northwest from http://www.or.blm.gov/gis/ Welcome to NR402 GIS Applications in
SELF-GUIDED LEARNING EXPEDITION LIFE SCIENCE. Name GRADE LEVEL: 4 5 STUDENT GUIDE
 SELF-GUIDED LEARNING EXPEDITION Name GRADE LEVEL: 4 5 STUDENT GUIDE LIFE SCIENCE On this expedition, you will visit the following areas in order to complete activities related to the theme Organisms and
Unmanned Aircraft Systems (UAS) Activities in Earth Sciences
 Activities in Earth Sciences") Unmanned Aircraft Systems (UAS) Activities in Earth Sciences Bruce K. Quirk quirk@usgs.gov Department of the Interior U.S. Geological Survey June 22, 2015 Department of the Interior Bureau of Land Management
Unmanned Aircraft Systems (UAS) Activities in Earth Sciences Bruce K. Quirk quirk@usgs.gov Department of the Interior U.S. Geological Survey June 22, 2015 Department of the Interior Bureau of Land Management
WHITE POINT LANDSLIDE GEOTECHNICAL INVESTIGATION November 29, 2012 Status Report
 Gary Lee Moore, P.E., City Engineer Vince Jones, P.E., Deputy City Engineer WHITE POINT LANDSLIDE GEOTECHNICAL INVESTIGATION November 29, 2012 Status Report White Point Landslide Geotechnical Investigation
2010 Wildlife Management Unit 347 moose
 2010 Wildlife Management Unit 347 moose Photo: Curtis Stambaugh Section Authors: Curtis Stambaugh and Corey Rasmussen Stambaugh, C., and C. Rasmussen. 2012. Wildlife Management Unit 347 moose. Pages 54-57.
Appendix I Feasibility Study for Vernal Pool and Swale Complex Mapping
 Feasibility Study for Vernal Pool and Swale Complex Mapping This page intentionally left blank. 0 0 0 FEASIBILITY STUDY BY GIC AND SAIC FOR MAPPING VERNAL SWALE COMPLEX AND VERNAL POOLS AND THE RESOLUTION
LAND CHANGE MODELER SOFTWARE FOR ARCGIS
 LAND CHANGE MODELER SOFTWARE FOR ARCGIS The Land Change Modeler is revolutionary land cover change analysis and prediction software which also incorporates tools that allow you to analyze, measure and
Using Map and Compass Together
 Using Map and Compass Together In situations where you foresee a potential evacuation on foot, where there are no roads, and no indication as to the direction of travel (i.e., road signs), it is recommended
Technical Drafting, Geographic Information Systems and Computer- Based Cartography
 Technical Drafting, Geographic Information Systems and Computer- Based Cartography Project-Specific and Regional Resource Mapping Services Geographic Information Systems - Spatial Analysis Terrestrial
Student Name: Teacher: Date: District: London City. Assessment: 07 Science Science Test 4. Description: Life Science Final 1.
 Student Name: Teacher: Date: District: London City Assessment: 07 Science Science Test 4 Description: Life Science Final 1 Form: 301 1. A food chain is shown. Sunlight Grass Rabbit Snake What is the abiotic
MAPS AND THEIR CLASSIFICATION
 MAPPING MAPS AND THEIR CLASSIFICATION WHAT IS A MAP? A map is representation of the Earth's surface, showing how things are related to each other by distance, direction, and size. Maps are a way of showing
APES Chapter 9 Study Guide. 1. Which of the following statements about sea otters is false?
 APES Chapter 9 Study Guide 1. Which of the following statements about sea otters is false? They use tools, They have the thickest fur of any mammal. They can eat 25% of their weight per day in sea urchins
13.1. Ecologists Study Relationships. Ecologists study environments at different levels of organization.
 13.1 Ecologists Study Relationships VOCABULARY ecology community ecosystem biome KEY CONCEPT Ecology is the study of the relationships among organisms and their environment. Main Ideas Ecologists study
A Small Migrating Herd. Mapping Wildlife Distribution 1. Mapping Wildlife Distribution 2. Conservation & Reserve Management
 A Basic Introduction to Wildlife Mapping & Modeling ~~~~~~~~~~ Rev. Ronald J. Wasowski, C.S.C. Associate Professor of Environmental Science University of Portland Portland, Oregon 8 December 2015 Introduction
2009 WMU 349 Moose. Section Authors: Curtis Stambaugh and Nathan Webb
 2009 WMU 349 Moose Section Authors: Curtis Stambaugh and Nathan Webb Suggested Citation: Stambaugh, C. and N. Webb 2009. WMU 349 Moose. Pages 58 62. In: N. Webb and R. Anderson. Delegated aerial ungulate
SPATIAL ANALYSIS. Transformation. Cartogram Central. 14 & 15. Query, Measurement, Transformation, Descriptive Summary, Design, and Inference
 14 & 15. Query, Measurement, Transformation, Descriptive Summary, Design, and Inference Geographic Information Systems and Science SECOND EDITION Paul A. Longley, Michael F. Goodchild, David J. Maguire,