REPORT ON ENVIRONMENTAL RADIATION SURVEILLANCE. around. Brunswick Nuclear Plant. Shearon Harris Nuclear Plant. McGuire Nuclear Station NORTH CAROLINA
|
|
|
- Josephine Audrey Mathews
- 5 years ago
- Views:
Transcription


1 REPORT ON ENVIRONMENTAL RADIATION SURVEILLANCE around Brunswick Nuclear Plant Shearon Harris Nuclear Plant McGuire Nuclear Station Global Nuclear Fuel Fabrication Plant in NORTH CAROLINA JANUARY 2009 DECEMBER 2009 NC DEPARTMENT OF ENVIRONMENT & NATURAL RESOURCES DIVISION OF ENVIRONMENTAL HEALTH Radiation Protection Section Physical Address: 3825 Barrett Drive, 2 nd Floor Raleigh, North Carolina Mailing Address: 1645 Mail Service Center Raleigh, North Carolina
2 Table of Contents TABLE OF CONTENTS EXECUTIVE SUMMARY Section 1 BRUNSWICK NUCLEAR PLANT Section 2 SHEARON HARRIS NUCLEAR PLANT Section 3 MCGUIRE NUCLEAR STATION Section 4 GLOBAL NUCLEAR FUEL Section 5 STATEWIDE ENVIRONMENTAL NETWORK Section 6 CATAWBA NUCLEAR STATION Section 7 PCS PHOSPHATE Section 8 B-52 CRASH SITE Section 9 APPENDIX A APPENDIX B APPENDIX C Section A Section B Section C
3 Executive Summary EXECUTIVE SUMMARY The North Carolina Radiation Protection Section (NCNCRPS) conducts a radiological environmental surveillance program in the surrounding environment of major nuclear facilities and the statewide environment. From 1986 through 2009, NCNCRPS has monitored the offsite environment around the facilities listed below. Previously this monitoring was performed under a contract with the U.S. Nuclear Regulatory Commission (NRC), until that program was terminated by the NRC for budgetary reasons in During the 2009 calendar year, the NCNCRPS environmental monitoring program continued at Progress Energy s Brunswick Nuclear Plant (BNP), Shearon Harris Nuclear Plant (HNP), Duke Energy s McGuire Nuclear Station (MNS) and Global Nuclear Fuels Uranium Fuel Fabrication Plant (GE) in Castle Hayne. Cooperation between the NCNCRPS and the nuclear facilities continued during An overview for each plant is discussed in the individual plant summaries. Statewide environmental monitoring results, results of monitoring around other facilities, and a series of technical appendices are included in this report. These appendices list applicable minimum detectable activity (MDA) values for the program and sample analysis procedures at the N.C. State Laboratory for Public Health. No significant amounts of man-made radionuclides were discovered in samples collected by NCNCRPS in For a brief summary of sample analysis results and trends for the major components of the NCNCRPS environmental surveillance program please see the section below. Year-to-Year Trends & Brief Summary of Sampling Results Average Gross Beta Activity in Particulate Air Samples, pci/m NCRPS Utility Harris 2.15E E E E-02 Brunswick 1.52E E E E-02 McGuire 2.32E E E E-02 Statewide 2.50E E-03 NA NA Average Gross Alpha Activity in Particulate Air Samples, pci/m 3 GE-GNF 1.83E E E E-03 Harris: No man-made radionuclides found in air, surface water, ground water, milk, food crop, or fish samples collected in Small amounts of activation products found in sediment at location SH-SD-54. No appreciable trend increase in man-made radionuclides in Harris samples from 2008 to GE-GNF: No elevated levels of enriched uranium (U-235) found in samples collected at GE-GNF in No appreciable trend increase in uranium levels in GE-GNF samples from
4 Executive Summary Brunswick: No man-made radionuclides found in air, surface water, ground water, terrestrial vegetation, food crop, sediment, or fish samples collected in No appreciable trend increase in man-made radionuclides in Brunswick samples from 2008 to McGuire: No man-made radionuclides found in air, surface water, milk, sediment, or food crop samples collected in Small amounts of fission products (Cs-137) found in fish at location MG-FL-129. Slight trend decrease in man-made radionuclides in McGuire samples from 2008 to Statewide: No man-made radionuclides in air, surface water, finished water, shellfish, precipitation, milk samples collected at statewide sites in No appreciable trend increase in man-made radionuclides in statewide samples from 2008 to Trace amounts of Iodine-131 found in twenty out of thirty six sewage effluent samples collected in This can be compared to 2008, when seventeen out of thirty four sewage effluent samples tested positive for trace amounts of I-131. These detections of I-131 are attributable to medical patient waste entering the sewage effluent stream, and do not represent a significant risk to public health. The overall NCRPS monitoring program continues to be adjusted in light of state funding restrictions. In 2009, the environmental monitoring programs at the PCS Phosphate and the B-52 Crash Site in Faro, NC were placed on hiatus due to NCRPS staff reductions and budgetary concerns. In the face of these staffing and funding issues, NCRPS management made the decision to concentrate future monitoring efforts on fixed nuclear facilities. It is hoped that if funding and staffing return to pre-2009 levels, monitoring at these facilities can resume in the future. Finally, NCRPS revised its ambient gamma monitoring program in The thermoluminescent dosimeters (TLDs) used to monitor for ambient gamma radioactivity were replaced with optically stimulated luminescent dosimeters provided under contract by Landauer, Inc. The ambient gamma sampling frequency was also reduced from a quarterly to an annual basis. Appendices Appendix A lists the regulatory limits, investigation levels, average NC background levels, and estimated lower limits of detection for the State Radiochemistry Laboratory. Appendix B lists the basic procedures for radiological analysis used by the State Radiochemistry Laboratory in analyzing environmental samples for nuclear facilities, statewide monitoring, and special projects. Appendix C lists the requirements for monitoring around the nuclear power plants and the Global Nuclear Fuels Facility. ACKNOWLEDGEMENTS and ATTRIBUTION: The NCRPS recognized contributions made by the various county city and other public agencies who assist in sample collection. Others giving their assistance in the collection of samples 1-2
5 Executive Summary include Progress Energy, Duke Energy, and PCS Phosphate. With the exception of thermoluminescent dosimetry, all other samples were prepared and analyzed by the following staff members of the State Public Health Radiochemistry Laboratory: Roger Brown (Supervisor), Brenda Nichols, Brenda Beasley, Zhong Zhang, and Teresa Bryant. Sample collection and report compilation were performed by the following Radiation Protection staff: Patrick Cox (Brunswick & GNF), William Jeffries (Statewide), and Chris Fidalgo (Harris, McGuire, Catawba, and PCS). NOTES ON RADIATION TERMINOLOGY: Throughout the Environmental Radiation Surveillance Report, several basic distinctions regarding radioactive isotopes (alternatively termed radionuclides) have been made. Natural vs. Man-Made: Simply put, the terms natural and man-made radioactivity mean just that: Natural radioactivity arises from processes of natural origin, such as the decay of Naturally Occurring Radioactive Materials. Man-made radioactivity originates from processes associated with human activity, such as nuclear power generation, nuclear fuel enrichment, research, medical procedures, etc. Man-Made Radioactivity: For the purposes of this report, several broad categories of manmade radioactivity can be defined as the following: Fission Products: Radionuclides generated from the process of nuclear fission; i.e., splitting the atom. The detection of nuclear fission products indicates the occurrence of fission-related activities, primarily as a result of nuclear power generation or nuclear weapons testing. Activation Products: Radionuclides generated from neutron activation, i.e., the bombardment of atomic nuclei with neutrons. Activation products are typically generated as a secondary process in nuclear power generation, research activities, or nuclear weapons testing. Enriched Uranium: Uranium is a naturally occurring radioactive material. However, if the ratios of uranium isotopes detected in a given sample are different than that occurring in natural uranium, the uranium is considered to be enriched. Enriched uranium is commonly encountered at nuclear fuel production/fabrication facilities, such as Global Nuclear Fuels. 1-3
6 BRUNSWICK STEAM ELECTRIC PLANT
7 BSEP - Summary BRUNSWICK STEAM ELECTRIC PLANT SOUTHPORT, BRUNSWICK COUNTY Progress Energy operates the Brunswick Steam Electric Plant (BSEP) located approximately 2.5 miles north of Southport, North Carolina. The plant consists of two boiling water reactors each with a net design rating of 821 Megawatts-electric and uses the Cape Fear River as its source for condenser cooling water. Commercial production was initiated by Unit 2 on November 3, 1975, and by Unit 1 on March 18, Air Particulate - Gross Beta The average gross beta concentration measured in 520 air particulate samples collected during the 2009 environmental surveillance year was 1.87 E-2 picocuries per cubic meter (pci/m 3. The analyses of the NCRPS air particulate samples collected show gross beta activity levels, which are within the levels of indicative of normal background and do not indicate any unusual activity. Air Particulate Gamma Analyses Gamma isotopic composite results identified only naturally occurring radioactive material, commonly referred to as NORM, at or below normal background levels. Air Particulate Air Radioiodine All air canisters analyzed for Iodine 131 (I-131) were found to have results below the lowest level detectable (LLD). Surface Water Gross Alpha/Beta, Tritium, Low Level Iodine & Gamma Analyses Results for the monthly surface water composites collected during 2009 show that Tritium (H-3) levels are below the investigation level of 1000 pci/l (See Appendix A). Naturally occurring Potassium 40 (K-40) was evident in samples collected. The highest levels detected were less than 700 pci/l for both the indicator and control sites. Low level iodine (LLI) was only identified in the indicator sites samples at trace levels less than 1.0 pci/l. Three independent surface water surveillance samples were collected in All radionuclides detected are background. Fish and Invertebrates Gamma Analyses Fish and invertebrate samples are collected on a semi-annual basis, and were collected in May and September of Gamma Isotopic results for the Indicator location show no results for Cs-137, and K-40 with maximum levels less than 3.00 pci/g-wet for all samples collected. 2-2
8 BSEP - Summary Vegetation Gross Alpha, Gross Beta, & Gamma Analyses Vegetation samples were collected on a bi-annual basis and indicated the presence of typical annual occurrences of K-40 and the cosmogenic product Be-7. No man-made radionuclides were found in vegetation samples collected at Brunswick in Sediment Gamma Analyses Soil sediment is also collected twice per year, and a gamma analysis performed on each sample. For sediment samples collected in 2009, no presence of abnormal activity was detected. Thermoluminescent Dosimetry (TLD) Thermoluminescent dosimetry results for 2009 produced a yearly average exposure of 42.8 mr for all sites. This is less than the statewide average of 75 mr/year. Due to travel restrictions in 2009, TLD s were placed at Brunswick for only the first quarter of the year. This travel restriction prevented NCRPS staff from placing or retrieving TLDs for the second through fourth quarters of To reduce the possibility of a recurrence of this environmental monitoring gap, NCRPShas implemented a new ambient gamma monitoring regime. The new ambient monitoring regime will replace TLDs with optically stimulated luminescent dosimeters, which will be placed/retrieved on an annual basis starting in

9 BSEP - Maps 2-4

10 2-5 BSEP - Maps
11 BSEP - Air Particulate Section 2: Brunswick Steam Electric Plant, Southport, North Carolina Air Particulate - Gross Beta, (pci/m 3 ) Indicator (BR-APLV-23) a Control (BR-APLV-12) a All measurements x 10-2 pci/m 3 All measurements x 10-2 pci/m 3 NCRPS BSEP NCRPS BSEP Date Meas. Error Meas. Error Meas. Error Meas. Error 1/5/ /12/ /19/ /26/ /2/ /9/ /16/ /23/ /2/ /9/ /16/ /23/ /30/ /6/ /13/ /20/ /27/ /4/ /11/ /18/ /25/ /1/ /8/ /15/ /22/ /29/ /6/ /13/ /20/ /27/ /3/ /10/ /17/ /24/09 8/31/ /7/ /14/ /21/ /28/ /5/ /12/ /19/ /26/ /2/ /9/ /16/ /23/09 11/30/ /7/ /14/ /21/ /28/
12 BSEP Air Particulate Air Particulate - Gross Beta, (pci/m 3 ) Indicator (BR-APLV-23) a Control (BR-APLV-12) a All measurements x 10-2 pci/m 3 All measurements x 10-2 pci/m 3 NCRPS BSEP NCRPS BSEP Date Meas. Error Meas. Error Meas. Error Meas. Error Average % Diff a Duplicate sampling at NCRPS Site BR-APLV-23 (BSEP Site AP-201), 0.6 mi. northeast of plant at the plant intake canal, the Point of Maximum Airborne Concentration. NCRPS Control Site BR-APLV-12 is on the roof of the New Hanover Co. Health Department. in Wilmington, N.C. BSEP Control Site AP-204 is at the Sutton Plant on the outskirts of Wilmington,. nc Sample was either not collected (due to in climate weather, holiday or other unforeseen reason), lost, or not analyzed by the laboratory 2-7
13 BRUNSWICK NUCLEAR PLANT INDICATOR SITES Gross Beta Activity (pci/m^3) Weeks DRP(BR-APLV-23) BNP(AP-201)
14 BRUNSWICK NUCLEAR PLANT CONTROL SITES Gross Beta Activity (pci/m^3) Weeks DRP(BR-APLV-12) BNP(AP-204)
15 BRUNSWICK NUCLEAR PLANT DRP - INDICATOR vs CONTROL Gross Beta Activity (pci/m^3) Weeks INDICATOR(BR-APLV-23) CONTROL(BR-APLV-12)
16 Brunswick - Air Particulate Air Particulate - Gross Beta, (pci/m 3 ) BR-APLV-02 a BR-APLV-18 a BR-APLV-24 a All measurements x 10-2 pci/m 3 All measurements x 10-2 pci/m 3 All measurements x 10-2 pci/m 3 NCRPS BSEP NCRPS BSEP NCRPS BSEP Date Meas. Error Meas. Error Meas. Error Meas. Error Meas. Error Meas. Error 1/5/ /12/ /19/ /26/ /2/ /9/ /16/ /23/ /2/ /9/ /16/ /23/ /30/ /6/ /13/ /20/ /27/ /4/ /11/ /18/ /25/ /1/ /8/ /15/ /22/ /29/ /6/ /13/ /20/ /27/ /3/ /10/ /17/ /24/ /31/ /7/ /14/ /21/ /28/ /5/ /12/ /19/ /26/ /2/ /9/ /16/ /23/ /30/ /7/ /14/
17 BSEP - Air Particulate Air Particulate - Gross Beta, (pci/m 3 ) BR-APLV-02 a BR-APLV-18 a BR-APLV-24 a All measurements x 10-2 pci/m 3 All measurements x 10-2 pci/m 3 All measurements x 10-2 pci/m 3 NCRPS BSEP NCRPS BSEP NCRPS BSEP Date Meas. Error Meas. Error Meas. Error Meas. Error Meas. Error Meas. Error 12/21/ /28/ Average % Diff a Split sampling at NCNCRPS Sites BR-APLV- 02 (BSEP Site 200) located at the CP&L Visitor s Center on Hwy 87 (1.0 mi southwest of plant), BR-APLV-18 (BSEP Site 203) located at the Southport Public Works substation (2.3 mi south-southwest of plant), BR APLV-24 (BSEP Site 202) located at the substation at the plant construction entrance(1.0 mi south of plant), NCNCRPS Site BR-APLV-71 is 0.9 mi. northwest of plant on Bethel Church Road on power line right-of-way; there is no BSEP sampler at this location. nc Sample was either not collected (due to in climate weather, holiday or other unforeseen reason), lost, or not analyzed by the laboratory. 2-12
18 BRUNSWICK NUCLEAR PLANT VISITOR'S CENTER Gross Beta Activity (pci/m^3) Weeks DRP(BR-APLV-02) BNP(AP-200)
19 BRUNSWICK NUCLEAR PLANT SOUTHPORT PUBLIC WORKS Gross Beta Activity (pci/m^3) Weeks DRP(BR-APLV-18) BNP(AP-203)
20 BRUNSWICK NUCLEAR PLANT CONSTRUCTION ROAD SUBSTATION Gross Beta Activity (pci/m^3) Weeks DRP(BR-APLV-24) BNP(AP-202)
21 BSEP - Air Particulate Air Particulate Radioiodine, (pci/m 3 ) Indicator (BR-APCC-23) a Control (BR-APCC-12) a All measurements x 10-2 pci/m 3 All measurements x 10-2 pci/m 3 NCRPS BSEP NCRPS BSEP Date Meas. Error Meas. Error Meas. Error Meas. Error 1/5/09 <3.26 <2.63 <1.26 <2.49 1/12/09 <2.60 <2.42 <2.00 <2.06 1/19/09 <3.80 <2.30 <0.70 <1.79 1/26/09 <1.54 <1.94 <0.84 <2.25 2/2/09 <4.52 <2.02 <1.61 <2.38 2/9/09 <3.43 <1.56 <2.43 <2.06 2/16/09 <6.16 <2.08 <2.40 <1.96 2/23/09 <4.23 <1.89 <2.97 <2.20 3/2/09 <4.01 <2.10 <1.79 <1.90 3/9/09 <3.70 <1.94 <3.50 <2.04 3/16/09 <5.61 <2.37 <3.72 <2.29 3/23/09 <6.24 <2.07 <5.31 <1.42 3/30/09 <8.12 <1.87 <5.16 <2.26 4/6/09 <6.77 <2.07 <4.14 <2.12 4/13/09 <4.53 <2.22 <2.39 <2.41 4/20/09 <8.92 <2.26 <6.60 <2.58 4/27/09 <5.90 <2.06 <4.76 <2.95 5/4/009 <3.83 <3.49 <6.30 <4.18 5/11/09 <0.48 <1.83 <3.12 <1.53 5/18/09 <2.43 <2.78 <2.65 <1.87 5/25/09 <1.87 <1.52 <2.10 <1.52 6/1/09 <1.90 <3.51 <9.04 <4.08 6/8/09 <2.85 <2.21 <5.70 <2.01 6/15/09 <1.75 <2.14 <2.43 <9.86 6/22/09 <2.09 <2.25 <3.55 <1.79 6/29/09 <7.30 <3.32 <7.95 <3.00 7/6/09 <5.10 <2.92 <5.50 <2.32 7/13/09 <4.80 <2.60 <3.10 <4.26 7/20/09 <3.80 <2.68 <2.50 <3.44 7/27/09 <3.00 <1.80 <2.00 <2.09 8/3/09 <2.10 <2.26 <1.70 <2.48 8/10/09 <1.50 <2.61 <1.20 <3.01 8/17/09 <1.00 <1.70 <1.00 <1.93 8/24/09 <8.93 <1.65 <2.26 <1.99 8/31/09 <5.93 <2.96 <2.06 <3.73 9/7/09 <4.95 <2.21 <2.10 <2.30 9/14/09 <5.40 <2.43 <0.30 <1.64 9/21/09 <10.3 <1.87 <1.00 <2.42 9/28/09 <7.48 <1.90 <0.50 < /5/09 <4.85 <2.85 <0.40 < /12/09 <11.5 <1.75 <3.55 < /19/09 <8.46 <2.09 <5.81 < /26/09 <14.6 <1.76 <5.97 < /2/09 <9.81 <1.55 <6.84 < /9/09 <23.3 <2.21 <9.36 < /16/09 <23.2 <2.00 <10.3 < /23/09 <8.48 <2.37 <7.48 < /30/09 <9.00 <1.48 <3.77 < /7/09 <21.4 <1.94 <9.85 < /14/09 <10.0 <1.78 <4.55 < /21/09 <1.09 <3.74 nc < /28/09 <1.26 <3.35 nc <
22 Brunswick - Air Particulate a Duplicate sampling at NCRPS Site BR-APCC-23 (BSEP Site AP-201), 0.6 mi. northeast of the plant at the plant intake canal, the Point of Maximum Airborne Concentration (PMAC). NCRPS Control Site BR-APCC-12 is on the roof of the New Hanover Co. Health Department in Wilmington, N.C. BSEP Control Site AC-204 is at the Sutton Plant on the outskirts of Wilmington,. nc Sample was either not collected (due to in climate weather, holiday or other unforeseen reason), lost, or not analyzed by the laboratory. 2-17
23 BSEP - Air Particulate Air Particulate - Gamma, (pci/m 3 ) Indicator (BR-APLV-23) a Control (BR-APLV-12) a All measurements x 10-2 pci/m 3 All measurements x 10-2 pci/m 3 NCRPS BSEP NCRPS BSEP Date Isotope Meas. Error Meas. Error Meas. Error Meas. Error K-40 na na na na February Pb-214 na na - - na na Bi-214 na na - - na na Pb-212 na na na na Be-7 na na - - na na K-40 na na na na May Bi-214 na na na na Pb-214 na na na na - - Be-7 na na na na Be-7 na na na na K-40 na na na na Ra-226 na na na na August Pb-214 na na na na Pb-212 na na na na Th-234 na na - - na na Bi-214 na na na na K-40 na na na na Th-234 na na - - na na November Tl-208 na na - - na na - - Pb-212 na na - - na na Bi-214 na na na na Pb-214 na na na na Be-7 na na na na a Duplicate sampling at NCRPS Site BR-APLV-23 (BSEP Site AP-201), 0.6 mi. northeast of plant at the plant intake canal, the Point of Maximum Airborne Concentration (PMAC). NCRPS Control Site BR-APLV-12 is on the roof of the New Hanover Co. Health Department. in Wilmington, N.C. BSEP Control Site AP-204 is at the Sutton Plant on the outskirts of Wilmington. na Gamma analysis was not performed by the NC State Laboratory for Public Health. 2-18
24 Brunswick - Surface Water Surface Water - Tritium, Low-Level Iodine, and Gamma Indicator (BR-SW-39) a All measurements in pci/l Control (BR-SW-48) b All measurements in pci/l NCRPS BSEP NCRPS BSEP Date Isotope Meas. Error Meas. Error Meas. Error Meas. Error January LLI nc nc K-40 nc nc 3.63E E+02 nc nc 3.63E E+02 H-3 nc nc <2.96E+02 nc nc <2.96E+02 February LLI nc nc nc nc K-40 nc nc nc nc NO-ACT H-3 nc nc <3.12E+02 nc nc <3.12E+02 March LLI nc nc nc nc K-40 nc nc 3.32E E+02 nc nc 3.32E E+02 H-3 nc nc <3.13E+02 nc nc <3.12E+02 April LLI nc nc nc nc K-40 nc nc 2.53E E+02 nc nc 2.53E E+02 H-3 nc nc <2.91E+02 nc nc <2.91E+02 May LLI nc nc nc nc K-40 nc nc 2.76E E+02 nc nc 2.76E E+02 H-3 nc nc <3.09E+02 nc nc <3.12E+02 June LLI nc nc K E E E E+01 H <3.00E <3.00E+02 July LLI nc nc nc nc K-40 nc nc 3.36E E+02 nc nc 3.36E E+02 H-3 nc nc <2.96E+02 nc nc <2.96E+02 August LLI nc nc K E E E E+02 H-3 nc nc <3.06E <3.07E+02 September LLI nc nc K E E E E+01 H <2.99E <3.00E+02 October LLI nc nc nc nc K-40 nc nc 2.72E E E E+02 H-3 nc nc <3.01E+02 nc nc <3.01E+02 November LLI nc nc K E E E E+02 H E E December LLI nc nc 4.07E E+01 nc nc 4.07E E+01 K-40 nc nc <2.94E+02 nc nc <2.94E+02 H-3 nc nc nc nc a Split sampling of monthly composite at NCRPS Site BR-SW-39 (BSEP Site SW-401) located at the discharge canal approximately 4.9 mi. south-southwest of the plant. b Split sampling of monthly composite at NCRPS Site BR-SW-48 (BSEP Site SW-400) located at the intake canal approximately 0.7 mi. northeast of the plant. nc Sample was either not collected (due to in climate weather, holiday or other unforeseen reason), lost, or not analyzed by the laboratory. 2-19
25 BSEP - Surface Water Surface Water - Tritium, Low-Level Iodine, and Gamma BR-SW-87 a All measurements in pci/l NCRPS Date Isotope Meas. Error. January And February H-3 <LLD <2.30E+02 March H E E+02 K-40 Beta April through December H-3 <LLD <2.30E+02 a NCRPS Site BR-SW-87 located at the discharge canal, accessed from visitor center approximately 1.0 mi. south-southwest of the plant. 2-20
26 Brunswick Fish & Invertebrates Fish Gamma Indicator (BR-FL-46) a All measurements in pci/g-wet Control (BR-FL-81) b All measurements in pci/g-wet NCRPS BSEP NCRPS BSEP Date Isotope Meas. Error Meas. Error Meas. Error Meas. Error May K E E E E E E E E+00 Cs <1.83E-02 BI E E E E E E E E+00 Pb <1.76E-02 TL E E E E E E E E+00 Pb < 8.32E-03 September K E E E E E E E E-01 Cs <1.13E-02 BI E E E E E E E E+00 Pb <2.42E-02 TL E E E E E E E E+00 Pb <2.12E-02 a Split samples are collected in the Atlantic Ocean near the discharge location approximately 5.5 mi south-southwest of the plant. Free swimmers (NCRPS site BR-FL-46A/BSEP site FI-700), bottom feeders (NCRPS site BR-FL-46B/BSEP site FI-701), and invertebrates (NCRPS site BR- FL-46C/BSEP site FI-702), are collected at this site. b Split samples are collected in the Atlantic Ocean at no fixed location. Free swimmers (NCRPS site BR-FL-81A/BSEP site FI-703), bottom feeders (NCRPS site BR-FL-81B/BSEP site FI-704), and invertebrates NCRPS site BR-FL-81C/BSEP site FI-705), are collected at this site
27 BSEP - Shoreline Sediment Sediment Gamma Indicator (BR-SD-30) a NCRPS (pci/g-dry) BSEP (pci/g-dry) Date Isotope Meas. Error Meas. Error May K E E E E-01 Tl E E-02 Pb E E-02 Co-60 <1.58E-02 a Split sampling at NCRPS Site BR-SD-30 (BSEP Site SS-500), located approximately 4.9 mi south-southwest of the plant. 2-22
28 Brunswick - Terrestrial Vegetation Terrestrial Vegetation - Alpha, Beta, and Gamma NCRPS BR-TV-23 a All measurements in pci/g BSEP Date Isotope Meas. Error Meas. Error April Be E E E E-01 K E E E E-01 Cs October Be E E E E+01 K E E E E-01 Cs Terrestrial Vegetation - Alpha, Beta, and Gamma BR-TV-02 b All measurements in pci/g NCRPS Date Isotope Meas. Error April Alpha 3.80E E-01 Beta 1.46E E-01 Be E E-01 K E E-01 Cs-137 <1.10E-02 K E E-01 Cs-137 <3.17E-02 a Sampling at NCRPS Site BR-TV-23 (BSEP Site BL-800) located at the intake canal onsite 0.6 mi. northeast of the plant.. b Sampling at NCRPS Site BR-TV-02 located 1.0 mi. southwest of the plant at the Brunswick Visitor's Center. 2-23
29 BSEP - TLD TLD, mr/year All readings in mr/year. Loc # Location 1 st Qtr m 2 nd Qtr 3 rd Qtr 4 th Qtr Meas Error Meas Error Meas Error Meas Error 1 BEMC substation NC NC 133 and SR # Standard Products Caswell Beach Fort Caswell dock South Brunswick County landfill Brunswick County landfill on NC SR #1528 (intake canal) SR #1528 (south of intake canal) SR # SR #1528 and SR # SR #1528 (substation) SR # East Leonard and North Atlantic Strs East 11 th Street NC 87 (north of NC 211) NC 87 and BSEP access road NC 87 (0.5 mile north of access road) SR #1525 (2.0 miles east of NC 87) SR #1525 (1.6 miles east of NC 87) NC 87 (0.3 mile north of SR #1525) NC 87 (0.7 mile north of SR #1525) Sunny Point access road Boiling Springs Lakes NC 133 and Orton Creek NC 133 (2.0 miles north of Orton Cr.) Sunny Point (north gate) US 421 (Snow Cut) US 421 and Lumberton Street US 421 and Ocean View Drive Kure Beach water tower Fort Fisher Air Force Base Federal Point ferry landing Shipyard Boulevard and Worth Drive Shipyard Boulevard and Newkirk Ave Supply (NC 211 and SR #1115) Supply (NC 211 and US 17) Supply (US 17 and SR #1115) Antioch Baptist Church miles east of NC Quarterly Average, All Sites Yearly Average, All Sites 42.8 m Due to travel restrictions in 2009, TLD s were placed at Brunswick for only the first quarter. 2-24
30 SHEARON HARRIS NUCLEAR PLANT
31 Harris - Summary SHEARON HARRIS NUCLEAR PLANT NEW HILL, WAKE/CHATHAM COUNTY Progress Energy operates the Shearon Harris Nuclear Plant, located about 16 miles southeast of Raleigh, N.C. The plant consists of one pressurized water reactor with a design rating of approximately 900 megawatts - electrical. Carolina Power and Light, which became Progress Energy, created an approximately 4,000-acre reservoir (Harris Lake), which is used for cooling tower makeup. Commercial production began in early The monitoring program continued around the Harris Plant through all of calendar year A summary of the results for the air monitoring performed around the Harris Plant during this year is presented below. The mean gross beta activities in air for the co-located sites for 2009 are presented in the table below. Location NCRPS HNP % Difference (pci/m 3 ) (pci/m 3 ) SH-APLV-04 (Indicator) 1.32 E E SH-APLV-9261 (Control) 1.45 E E SH-APLV E E SH-APLV E-02 NA NA SH-APLV E E Air Particulate and Radioiodine The trends for the results of RPS and Progress Energy at the control and indicator sites are generally in agreement for The monthly air filter composites collected at sites 04 (indicator site) and 9261 (control site) did not provide any evidence of fission products during This finding was reinforced by the results of weekly gross beta analyses of low volume air particulate samples, with no gross beta analyses exceeding the investigation level of 0.5 pci/m 3. There were no iodine detections at either the control (SH-APLV-9261) or indicator (SH-APLV- 04) locations during Surface Water Surface water samples collected from the indicator site (SH-SW-45) did not contain detectable levels of fission or activation products during Tritium levels at sites SH-SW-44 and SH- SW-45 are at or near natural levels (250 pci/l). Tritium levels in Harris Lake averaged 4,170 pci/l and 5,500 pci/l for NCRPS and Progress Energy, respectively. Surface water low level iodine values were significantly less than 1 pci/l and there was general agreement between RPS and Progress Energy. 3-2
32 Harris - Summary Milk During 2009, there was no indication of fission or activation products in milk samples based on gamma isotopic results. The low-level radioiodine results were generally in agreement and were below 1 pci/l. Groundwater Groundwater wells around the plant did not indicate the presence of plant-related radionuclides during The tritium results at all ground water sites were near or below detection limits ( pci/l) and do not indicate any activity resulting from plant operations. Fish Fish collected during 2009 do not indicate the presence of fission or activation products. The Progress Energy and NCRPS results generally show good agreement. Food crop samples collected in 2009 also showed no presence of plant-related radionuclides. Sediment Sediment samples collected at Harris Nuclear Plant in 2009 showed no evidence of plant-related radionuclides with two exceptions: trace amounts of Cobalt-58, Cobalt-60, Cesium-137, and Antimony-125 were detected in two samples collected at location SH-SD-54 on Feburary 12, 2009, and July 21, 2009, respectively. These small amounts of man-made radionuclides are possibly due to releases of material from the plant waste treatment system into Harris Lake, which are then concentrated in the sediment. Thermoluminescent Dosimetry Thermoluminescent dosimetry results from around the Harris Plant during 2009 do not indicate the presence of elevated ambient gamma radiation. The yearly average for all TLD sites at Harris in 2009 is 57.8 milliroentgen, which is below the statewide average of 75 mr/year. Due travel restrictions in 2009, TLD s were placed at Harris for only the first quarter of the year. This travel restriction prevented NCRPS staff from placing or retrieving TLD s for the second through fourth quarters of To reduce the possibility of a recurrence of this environmental monitoring gap, NCRPS has implemented a new ambient gamma monitoring regime. The new ambient monitoring regime will replace TLDs with optically stimulated luminescent dosimeters, which will be placed/retrieved on an annual basis starting in

33 Harris - Maps 3-4

34 3-5 Harris Maps
35 Harris Air Particulate Section 3: Shearon Harris Nuclear Power Plant, New Hill, North Carolina Air Particulate - Gross Beta, (pci/m 3 ) Indicator (SH-APLV-04) a Control (SH-APLV-9261) b All measurements x 10-2 pci/m 3 All measurements x 10-2 pci/m 3 RPS HNP RPS HNP Date Meas. Error Meas. Error Meas. Error Meas. Error 1/5/ /12/ /19/ /26/ /2/ /9/ /16/ /23/ /1/ /9/ /16/ /23/ /30/ /6/ /13/ /20/ /27/ /4/ /11/ /18/ /26/ /1/ /8/ /15/ /22/ /29/ /6/ /13/ /20/ /27/ /3/ /10/ /17/ /24/ /31/ /8/ /14/ /21/ /28/ /5/ /12/ /19/ /26/ /2/ /9/ /16/ /23/ /30/ /7/ /14/ /21/ /28/
36 Harris Air Particulate Air Particulate - Gross Beta, (pci/m 3 ) Indicator (SH-APLV-04) a Control (SH-APLV-9261) b All measurements x 10-2 pci/m 3 All measurements x 10-2 pci/m 3 RPS HNP RPS HNP Date Meas. Error Meas. Error Meas. Error Meas. Error Average % Diff. 40.6% 27.5% a Air sampling is generally conducted over a period of one week using low volume continuous samplers. Duplicate sampling at NCRPS Site SH-APLV-04 (HNP Site AP-2), SR#1134, 1.4 miles south of SR#1011 at barricade. b NCRPS Site SH-APLV-9261 is located at 301 S. Wilmington Street, Raleigh, NC on top of the Bath Building. It is located about 25 miles northeast of the plant. HNP Site AP-5 is located at the Pittsboro Line and Service Office on US 64 in the west-northwest Sector, 13.4 miles from the plant. 3-7
37 SHEARON HARRIS NUCLEAR POWER PLANT INDICATOR SITES Gross Beta Activity (pci/m^3) Weeks RPS(SH-APLV-04) HNP(AP-02)
38 0.05 SHEARON HARRIS NUCLEAR POWER PLANT CONTROL SITES Gross Beta Activity (pci/m^3) Weeks RPS(SH-APLV-9261) HNP(AP-05)
39 0.05 SHEARON HARRIS NUCLEAR POWER PLANT DRP - INDICATOR vs CONTROL Gross Beta Activity (pci/m^3) Weeks INDICATOR(SH-APLV-04) CONTROL(SH-APLV-9261)
40 Harris Air Particulate Air Particulate - Gross Beta, (pci/m 3 ) SH-APLV-22 a SH-APLV-28 b SH-APLV-130 c All measurements x 10-2 pci/m 3 All measurements x 10-2 pci/m 3 All measurements x 10-2 pci/m 3 RPS HNP RPS RPS HNP Date Meas. Error Meas. Error Meas. Error Meas. Error Meas. Error /5/ /12/ /19/ /26/ /2/ /9/ /16/ /23/ /1/ /9/ /16/ /23/09 d /30/ /6/ /13/ /20/ /27/ /4/ /11/ /18/ /26/ /1/ /8/ /15/ /22/ /29/ /6/ /13/ /20/ /27/ /3/ /10/ /17/ /24/ /31/ /8/ /14/ /21/ /28/ /5/09 e /12/ /19/ /26/ /2/ /9/ /16/09 e /23/ /30/09 e /7/09 e /14/ /21/09 e /28/
41 Harris - Air Particulate Air Particulate - Gross Beta, (pci/m 3 ) SH-APLV-22 a SH-APLV-28 b SH-APLV-130 c All measurements x 10-2 pci/m 3 All measurements x 10-2 pci/m 3 All measurements x 10-2 pci/m 3 RPS HNP RPS RPS HNP Date Meas. Error Meas. Error Meas. Error Meas. Error Meas. Error Average % Diff. 14.7% 11.4% a Duplicate sampling at NCRPS site SH-APLV-22 (HNP Site AP-26) at auxiliary dam near Hwy. 42. b Duplicate sampling at NCRPS Site SH-APLV-28, at power line right-of-way on SR#1130. NCRPS samples are collected from continuous air samplers at sites 22, 28, and 130 on a one-week frequency. c Duplicate sampling at NCRPS Site SH-APLV-130 (HNP Site AP-47), on SR-1912 approximately 0.25 mi north of Prince s Chapel C.M.E. Church. d Sample not collected at location MG-APLV-28 due to locked gate at sample site. e RPS samples not collected at locations SH-APLV-130, SH-APLV-22, SH-APLV-28 for these dates. 3-12
42 SHEARON HARRIS NUCLEAR POWER PLANT SPILLWAY Gross Beta Activity (pci/m^3) Weeks RPS(SH-APLV-22) HNP(AP-26)
43 SHEARON HARRIS NUCLEAR POWER PLANT HARRIS LAKE PARK Gross Beta Activity (pci/m^3) Weeks RPS(SH-APLV-28)
44 SHEARON HARRIS NUCLEAR POWER PLANT SR Gross Beta Activity (pci/m^3) Weeks RPS(SH-APLV-130) HNP(AP-47)
45 Harris - Air Radioiodine Air Particulate Radioiodine, (pci/m 3 ) Indicator (SH-APCC-04) a Control (SH-APCC-9261) b All measurements x 10-2 pci/m 3 All measurements x 10-2 pci/m 3 RPS HNP RPS HNP Week Meas. Error Meas. Error Meas. Error Meas. Error 1/5/09 c < 1.78 < /12/09 < 1.90 < /19/09 < 1.94 < /26/09 < 1.82 < /2/09 < 2.05 < /9/09 < 2.14 < /16/09 < 1.97 < /23/09 < 2.08 < /1/09 < 2.48 < /9/09 < 1.80 < /16/09 < 2.22 < /23/09 < 2.17 < /30/09 < 2.47 < /6/09 < 2.41 < /13/09 < 2.11 < /20/09 < 2.00 < /27/09 < 1.96 < /4/09 < 1.59 < /11/09 < 1.88 < /18/09 < 2.68 < /26/09 < 2.17 < /1/09 < 3.06 < /8/09 < 2.06 < /15/09 < 2.10 < /22/09 < 1.26 < /29/09 < 2.17 < /6/09 < 1.85 < /13/09 < 1.69 < /20/09 < 2.07 < /27/09 < 2.00 < /3/09 < 2.14 < /10/09 < 1.80 < /17/09 < 1.77 < /24/09 < 1.85 < /31/09 < 2.09 < /8/09 < 1.88 < /14/09 < 2.27 < /21/09 < 2.50 < /28/09 < 2.04 < /5/09 < 1.71 < /12/09 < 2.29 < /19/09 < 1.82 < /26/09 < 2.09 < /2/09 < 1.88 < /9/09 < 2.19 < /16/09 < 1.70 < /23/09 < 1.96 < /30/09 < 1.59 < /7/09 < 2.00 < /14/09 < 1.44 < /21/09 < 2.57 < /28/09 < 1.73 <
46 Harris - Air Radioiodine Air Particulate Radioiodine, (pci/m 3 ) Indicator (SH-APCC-04) a Control (SH-APCC-9261) b All measurements x 10-2 pci/m 3 All measurements x 10-2 pci/m 3 RPS HNP RPS HNP Week Meas. Error Meas. Error Meas. Error Meas. Error Average NA NA NA NA % Diff. NA NA a Duplicate sampling at NCRPS Site SH-APLV-04 (HNP Site AP-2), SR#1134, 1.4 miles south of SR#1011 at barricade. b NCRPS Site SH-APLV-9261 is located at 301 S. Wilmington Street, Raleigh, NC on top of the Bath Building. It is located about 25 miles northeastof the plant. HNP Site AP-5 is located at the Pittsboro Line and Service Office on US 64 in the west-northwest sector, 13.4 miles from the plant. c Unless otherwise noted, blank space for NCRPS results indicates that a Radioiodine analysis was performed but that an MDA was not recorded in the State Radiochemistry Laboratory database. 3-17
47 Harris - Air Particulate Air Particulate - Gamma, (pci/m 3 ) Indicator (SH-APLV-04) a Control (SH-APLV-9261 a All measurements in pci/m 3 All measurements in pci/m 3 RPS HNP RPS HNP Date Isotope Meas. Error Meas. Error Meas. Error Meas. Error January K E E-03 February b March 1 st Quarter Be E E E E-02 K E E E E-02 TL E E E E-04 Pb E E E E-03 Bi E E E E-03 Pb E E E E-03 Ra E E E E-03 Th E E E E-03 April K E E-03 May Be E E-02 June K E E-03 2 nd Quarter Be E E E E-02 K E E E E-02 Tl E E-04 Pb E E-03 Bi E E-03 Pb E E-03 Ra E E-03 Th E E-02 July Be E E-02 August Be E E E E-02 September Be E E E E-02 3 rd Quarter Be E E-02 K E E-03 Pb E E-04 Bi E E-03 Pb E E-03 Ra E E-02 Th E E-02 October Be E E E E-02 November Be E E E E-03 December Be E E E E-03 4 th Quarter Be E E E E-02 K E E E E-02 Tl E E E E-04 Pb E E-04 Bi E E E E-03 Pb E E-03 Ra E E E E-03 Th E E E E-02 a NCRPS samples composited and analyzed monthly. HNP samples composited and analyzed quarterly. Duplicate sampling at NCRPS Site SH-APLV-04(HNP Site AP-2) on SR#1134, 1.4 mi. south of 1011 at barricade. NCRPS Site SH-APLV-9261 is located in Raleigh, NC at 301 N. Wilmington Street on top of the Bath Building. HNP Site AP-5 is at the Pittsboro Line and Service Office of Progress Energy located off US 64. The site is in the west-northwest sector at 13.4 miles from HNP. b Unless otherwise noted, a blank space indicates that a sample was collected an analysis was performed on that sample, but that no gamma isotopic activity was detected. 3-18
48 Harris - Air Particulate Air Particulate - Gamma, (pci/m 3 ) SH-APLV-22 a SH-APLV-130 b All measurements in pci/m 3 All measurements in pci/m 3 RPS HNP RPS HNP Date Isotope Meas. Error Meas. Error Meas. Error Meas. Error January K E E-03 February c March 1 st Quarter Be E E E E-02 K E E E E-03 Pb E E E E-04 Bi E E E E-03 Pb E E E E-03 Ra E E E E-03 Th E E-03 April May June Be E E E E-02 K E E-03 2 nd Quarter Be E E E E-02 K E E E E-02 Pb E E E E-04 Bi E E E E-03 Pb-214 Ra-226 Th E E-02 July Be E E-02 August Be E E E E-02 September Be E E E E-02 K E E-03 3 rd Quarter Be E E E E-02 K E E E E-03 Pb E E-04 Bi E E-03 Pb E E-03 Ra E E-03 October Be E E E E-02 November Be E E E E-01 December Be E E E E-03 4 th Quarter Be E E E E-02 K E E E E-03 Tl-208 Pb E E E E-04 Bi E E-03 Pb E E E E-03 Ra E E-03 Th E E
49 Harris - Air Particulate Air Particulate - Gamma, (pci/m 3 ) SH-APLV-28 d All measurements in pci/m 3 RPS Date Isotope Meas. Error January February March April K E E-03 May K E E-03 June July Be E E-02 August Be E E-02 September Be E E-02 October Be E E-02 November Be E E-02 December Be E E-03 a Duplicate sampling at NCRPS site SH-APLV-22 (HNP Site AP-26) at auxiliary dam near Hwy. 42. b Duplicate sampling at NCRPS Site SH-APLV-130 (HNP Site AP-47), on SR-1912 approximately 0.25 mi north of Prince s Chapel C.M.E. Church. c Unless otherwise noted, a blank space indicates that a sample was collected an analysis was performed on that sample, but that no gamma isotopic activity was detected. d Sampling at NCRPS Site SH-APLV-28, at power line right-of-way on SR#
50 Harris Surface Water Surface Water - Low-Level Iodine and Gamma Indicator (SH-SW-45) a All measurements in pci/l Control (SH-SW-44) b All measurements in pci/l RPS HNP RPS HNP Date Isotope Meas. Error Meas. Error Meas. Error Meas. Error 1/12/09 K E E+01 LLI 2.60E E+00 < 5.03E-01 < 4.64E-01 January K E E E E+01 Tl E E E E+00 Pb E E E E+00 Bi E E E E+00 Ra E E E E+01 Th E E+01 1/26/09 K E E+01 LLI 6.20E E-01 < 5.75E-01 < 5.04E-01 2/9/09 K E E+01 LLI 1.25E E-01 < 5.57E-01 < 4.82E-01 February K E E E E+01 Tl E E E E+00 Pb E E E E+00 Bi E E E E+00 Pb E E E E+00 Ra E E E E+01 Th E E E E+01 2/23/09 K E E+01 Ra E E+01 LLI 2.17E E+00 < 6.17E-01 < 5.33E-01 3/9/09 K E E+01 LLI 4.50E E-01 < 6.15E-01 < 4.40E-01 3/23/09 K E E+01 LLI 0.00E E E E-01 < 6.36E-01 March K E E E E+01 Tl E E E E+00 Pb E E+00 Bi E E E E+00 Pb E E E E+00 Ra E E E E+01 Th E E+01 4/6/09 K E E+01 LLI 2.80E E E E-01 < 4.43E-01 4/20/09 K E E+01 LLI 1.30E E-01 < 6.03E-01 < 5.18E-01 5/4/09 K-40 LLI 2.60E E-01 < 4.84E-01 < 5.66E-01 April K E E E E+01 Tl E E E E+00 Pb E E E E+01 Bi E E E E+00 Pb E E E E+00 Ra E E E E+01 Ac E E+00 Th E E E E+01 5/18/09 K E E+01 Ra E E+01 LLI 0.00E E-01 < 5.07E-01 < 5.42E-01 6/1/09 K E E+01 LLI 0.00E E-01 < 6.63E-01 < 5.67E-01 May K E E E E+01 Tl E E E E+00 Pb E E E E
51 Harris Surface Water Surface Water - Low-Level Iodine and Gamma Indicator (SH-SW-45) a All measurements in pci/l Control (SH-SW-44) b All measurements in pci/l RPS HNP RPS HNP Date Isotope Meas. Error Meas. Error Meas. Error Meas. Error May Bi E E E E+00 Pb E E E E+00 Ra E E E E+01 Ac E E E E+01 Th E E E E+01 6/15/09 K E E+01 LLI 0.00E E-01 < 5.34E-01 < 5.22E-01 6/29/09 K E E+01 LLI 2.70E E-01 < 5.03E-01 < 5.40E-01 June K E E E E+01 Tl E E E E+00 Pb E E E E+00 Bi E E E E+00 Pb E E E E+00 Ra E E E E+01 Th E E E E+02 7/13/09 K E E-01 LLI 0.00E E-01 < 5.34E-01 < 5.74E-01 7/27/09 Ra E E+01 LLI 0.00E E-01 < 4.86E-01 < 4.47E-01 July K E E E E+01 Tl E E E E+00 Pb E E E E+00 Bi E E E E+00 Pb E E E E+00 Ra E E E E+01 Ac E E+01 Th E E E E+01 8/10/09 K-40 LLI 0.00E E-01 < 4.84E-01 < 5.42E-01 8/24/09 K-40 LLI 0.00E E-01 < 4.60E-01 < 5.60E-01 August K E E E E+01 Tl E E E E+00 Pb E E E E+00 Bi E E E E+00 Pb E E E E+00 Ra E E E E+00 Ac E E+00 Th E E E E+01 9/8/09 Ra E E E E+00 LLI 0.00E E-01 < 6.22E-01 < 5.42E-01 9/21/09 K-40 LLI 0.00E E-01 < 5.37E-01 < 5.02E-01 10/5/09 LLI 4.50E E-01 < 3.79E-01 < 4.68E-01 September K E E E E+01 Tl E E E E+00 Pb E E E E+00 Bi E E E E+00 Pb E E E E+00 Ra E E E E+01 Ac E E E E+01 Th E E+01 10/19/09 Ra-226 LLI 0.00E E-01 < 5.88E-01 < 4.57E-01 11/2/09 LLI 0.00E E+00 < 5.91E-01 < 4.93E
52 Harris Surface Water Surface Water - Low-Level Iodine and Gamma Indicator (SH-SW-45) a All measurements in pci/l Control (SH-SW-44) b All measurements in pci/l RPS HNP RPS HNP Date Isotope Meas. Error Meas. Error Meas. Error Meas. Error October K E E E E+01 Tl E E E E+00 Pb E E E E+00 Bi E E E E+00 Pb E E E E+00 Ra E E E E+01 Ac E E+00 Th E E E E+01 11/16/09 K-40 LLI 0.00E E+00 < 5.32E-01 < 5.90E-01 11/23/09 LLI 0.00E E+00 < 5.83E-01 < 4.63E-01 November K E E E E+01 Tl E E E E+00 Pb E E E E+00 Bi E E E E+00 Ra E E E E+01 Ac E E+00 Th E E E E+01 12/14/09 LLI 0.00E E-01 < 5.84E-01 < 4.94E-01 12/28/09 LLI 0.00E E-01 < 6.83E-01 < 4.48E-01 December K E E E E+01 Tl E E E E+00 Pb E E E E+00 Bi E E E E+00 Pb E E E E+00 Ra E E E E+01 Ac E E+00 Th E E E E+01 a Sampling at NCRPS Site SH-SW-45 (HNP Site DW-40) at the intake structure of the Northeast Metropolitan Water District of Harnett County on the southern bank of the Cape Fear River in Lillington. It is located in the south-southeast sector approximately 15 mi. from the plant. For gamma isotopic analyses, blank spaces indicate a result below LLD unless otherwise noted. For low level iodine analyses, blank spaces indicate that the result was not available from the State Public Health Radiochemistry Laboratory database. b Split sampling at NCRPS Site SH-SW-44 (HNP Site DW-38) in the Cape Fear River at the Progress Energy Cape Fear Plant water intake. This site isin the west-southwest sector 6.1 mi. from the plant. It is 0.25 mi. downstream from the junction of the Deep River and the Haw River. 3-23
53 Harris Surface Water Surface Water - Tritium, pci/l RPS SH-SW-22 a All measurements in pci/l HNP Date Meas. Error Meas. Error January 5.59E E E E+02 February b 6.52E E E E+02 March 5.57E E E E+02 April 5.47E E E E+02 May 4.84E E E E+02 June 4.54E E E E+02 July 4.35E E E E+02 August 3.84E E E E+02 September 4.52E E E E+02 October 3.84E E E E+02 November 3.61E E E E+02 December 3.79E E E E+02 Average 4.17E E+03 % Diff. 15.5% Surface Water - Tritium Indicator (SH-SW-45) c All measurements in pci/l Control (SH-SW-44) d All measurements in pci/l RPS HNP RPS HNP Date Meas. Error Meas. Error Meas. Error Meas. Error January -3.00E E+02 < 2.45E E E+02 < 2.44E+02 February -3.02E E+02 < 2.36E E E+02 < 2.37E+02 March -3.01E E+02 < 2.34E E E+02 < 2.33E+02 April 0.00E E+02 < 2.31E E E+02 < 2.31E+02 May -3.07E E+02 < 2.32E E E+02 < 2.31E+02 June 3.13E E+02 < 2.36E E E+02 < 2.37E+02 July -3.00E E+02 < 2.30E E E+02 < 2.32E+02 August -2.97E E+02 < 2.29E E E+02 < 2.32E+02 September 0.00E E+02 < 2.31E E E+02 < 2.31E+02 October 2.99E E+02 < 2.39E E E+02 < 2.40E+02 November 0.00E E+02 < 2.32E E E+02 < 2.32E+02 December 2.88E E+02 < 2.36E E E+02 < 2.35E+02 Average 7.50E+01 NA 0.00E+00 NA % Diff. NA NA a Split sampling at NCRPS Site SH-SW-22 (HNP Site DW-26) at Harris Lake near the Auxiliary Dam. This sample is a composite collected monthly. b Extra sample collected during month of February at location SH-SW-22 on 2/9/09 with a H-3 result of 7.13E+03 ± 2.25E+02 pci/l. c Sampling at NCRPS Site SH-SW-45 (HNP Site DW-40) at the intake structure of the Northeast Metropolitan Water District of Harnett County on the southern bank of the Cape Fear River in Lillington. It is located in the south-southeast sector approximately 15 mi. from the plant. d Split sampling at NCRPS Site SH-SW-44 (HNP Site DW-38) in the Cape Fear River at the Progress Energy Cape Fear Plant water intake. This site is in the west-southwest sector 6.1 mi. from the plant. It is 0.25 mi. downstream from the junction of the Deep River and the Haw Rivers. 3-24
54 Harris - Milk Milk - Gamma and Low Level Iodine RPS Indicator (SH-MS-13) a All measurements in pci/l HNP Date Isotope Meas. Error Meas. Error 1/5/09 K E E E E+02 Tl E E+00 LLI 2.10E E-01 < 4.09E-01 2/2/09 K E E E E+02 Tl E E+01 Ra E E+02 LLI 2.00E E-01 < 4.15E-01 3/2/09 K E E E E+02 Pb E E+00 Bi E E+01 Pb E E+01 Ra E E+01 Th E E+02 LLI 0.00E E-01 < 3.01E-01 4/6/09 K E E E E+02 Pb E E+00 Bi E E+01 Pb E E+01 LLI 0.00E E-01 < 4.41E-01 5/4/09 K E E E E+02 Tl E E+00 Pb E E+00 Bi E E+00 Pb E E+00 Ra E E+02 LLI 1.50E E-02 < 3.18E-01 6/1/09 K E E E E+02 Tl E E+00 Pb E E+00 Bi E E+01 Pb E E+00 Ra E E+02 Th E E+02 LLI 6.00E E-01 < 4.91E-01 7/6/09 K E E E E+02 Pb E E+00 Bi E E+01 Ra E E+01 Th E E+02 LLI 0.00E E-01 < 2.75E-01 8/3/09 K E E E E+02 Tl E E+00 Pb E E+00 Bi E E+01 Pb E E+01 Ra E E+01 Th E E+02 LLI 1.60E E-01 < 3.10E-01 9/8/09 K E E E E+02 Tl E E+00 Pb E E+00 Bi E E+01 Ra E E+02 LLI 2.00E E-01 < 2.60E
55 Harris - Milk Milk - Gamma and Low Level Iodine RPS Indicator (SH-MS-13) a All measurements in pci/l HNP Date Isotope Meas. Error Meas. Error 10/6/09 K E E E E+02 Pb E E+00 Bi E E+00 Pb E E+00 Ra E E+01 Th E E+02 LLI 5.30E E-01 < 2.87E-01 11/2/09 K E E E E+02 Pb E E+00 Bi E E+00 LLI 0.00E E-01 < 3.47E-01 12/1/09 K E E E E+02 Tl E E+00 Pb E E+00 Bi E E+00 Pb E E+01 LLI 0.00E E-01 < 3.09E-01 a Split sample collected at NCRPS Site SH-MS-13 (HNP Site MK-05) from the Manco Dairy. Sample was analyzed using germanium detector in 3.5-liter geometry. For gamma isotopic analyses, blank spaces indicate a result below LLD unless otherwise noted. For gamma isotopic analyses, blank spaces indicate a result below LLD unless otherwise noted. For low level iodine analyses, blank spaces indicate that the result was not available from the State Public Health Radiochemistry Laboratory database. 3-26
56 Harris - Groundwater Ground Water- Alpha, Beta, Tritium and Gamma,(pCi/L) SH-GW-39 a All measurements in pci/l SH-GW-59 b All measurements in pci/l RPS HNP RPS HNP Date Isotope c Meas. Error Meas. Error Meas. Error Meas. Error 2/24/09 Alpha 4.95E E E E+00 Beta 5.02E E E E-01 H E E+02 < 2.35E E E+02 < 2.34E+02 K E E E E+02 Pb E E E E+00 Bi E E+01 Pb E E+01 Ra E E E E+02 Th E E E E+02 5/20/09 Alpha 2.70E E-01 Beta 1.14E E-01 H-3 d < 2.32E+02 K E E+01 Pb E E+00 Bi E E+01 Pb E E+00 Ra E E+02 Th E E+02 8/25/09 H-3 e -3.07E E+02 < 2.31E+02 K E E+01 Pb E E+00 Bi E E+00 Pb E E+00 Ra E E+02 Th E E+02 11/20/09 Alpha 6.70E E-01 Beta 7.80E E-01 H E E+02 < 2.34E+02 K E E+01 Tl E E+00 Pb E E+00 Bi E E+01 Pb E E+01 Ra E E+01 Th E E+02 a Split sampling at NCRPS Site SH-GW-39 (HNP Site 39) near the diabase dikes on site, 0.7 mi southeast of the plant. b Split sampling at NCRPS Site SH-GW-59 (HNP Site GW-59) near the construction road on site, 0.50 miles from the plant in the north-northeast sector. c Gross alpha/beta analyses are routinely performed on NCRPS groundwater samples. Gamma analyses are routinely performed on Harris Nuclear Plant groundwater samples. Tritium analyses are routinely performed by both facilities. d Tritium result not available from State Radiochemistry Laboratory for NCRPS sample collected at location SH-GW-59 on 5/20/09. e Gross alpha/gross beta analysis not performed by State Radiochemistry Laboratory on groundwater sample collected on 8/25/09 at location SH- GW
57 Harris - Groundwater Groundwater- Alpha, Beta, Tritium and Gamma,(pCi/L) SH-GW-60 a All measurements in pci/l SH-GW-68 b All measurements in pci/l RPS HNP RPS HNP Date Isotope c Meas. Error Meas. Error Meas. Error Meas. Error 2/24/09 Alpha 4.35E E E E-01 Beta 2.45E E E E-01 H E E+02 < 2.35E E E+02 < 2.35E+02 K E E E E+01 Tl E E+00 Pb E E E E+00 Bi E E E E+01 Pb E E+01 Ra E E E E+01 5/20/09 d Alpha 6.43E E E E-01 Beta 3.33E E E E-01 H-3 < 2.33E+02 < 2.33E+02 K E E E E+01 Tl E E+00 Pb E E+00 Bi E E E E+01 Pb E E+01 Ra E E+02 Th E E E E+02 8/25/09 e H E E+02 < 2.32E E E+02 < 2.31E+02 K E E E E+01 Pb E E E E+01 Bi E E E E+00 Pb E E E E+00 Ra E E+01 Th E E+02 11/10/09 e H E E+02 < 2.34E E E+02 < 2.34E+02 K E E E E+01 Pb E E E E+01 Bi E E E E+01 Pb E E E E+01 Ra E E+01 a Split sampling at NCRPS Site SH-GW-60(HNP Site GW-60) near the west bank of Thomas Creek on site, 0.5 mi. from the plant in the east-southeast sector. b Split sampling at NCRPS Site SH-GW-68(HNP Site GW-68) 0.2 miles from the plant in the west sector. c Gross alpha/beta analyses are routinely performed on NCRPS groundwater samples. Gamma analyses are routinely performed on Harris Nuclear Plant groundwater samples. Tritium analyses are routinely performed by both facilities. d Tritium sample analyses not available from State Radiochemistry Laboratory database for NCRPS samples collected on 5/20/09 from locations SH-GW-60 & SH-GW-68. e Gross alpha/gross beta analysis not performed by State Radiochemistry Laboratory on groundwater samples collected on 8/25/09 and 11/10/09 at locations SH-GW-60 and SH-GW
58 Harris - Groundwater Groundwater- Alpha, Beta, Tritium and Gamma,(pCi/L) SH-GW-69 a All measurements in pci/l SH-GW-70 b All measurements in pci/l RPS HNP RPS HNP Date Isotope c Meas. Error Meas. Error Meas. Error Meas. Error 2/24/09 Alpha 9.60E E E E+00 Beta 1.52E E E E-01 H E E+02 < 2.35E E E+02 < 2.35E+02 K E E E E+01 Tl E E E E+00 Pb E E E E+00 Bi E E E E+01 Ra E E E E+02 Th E E+02 5/20/09 d Alpha 1.94E E E E+02 Beta 5.05E E-01 H-3 < 2.33E+02 < 2.33E+02 K E E E E+01 Tl E E+00 Pb E E E E+00 Bi E E E E+00 Pb E E+00 Ra E E E E+01 Th E E+02 8/25/09 e H E E+02 < 2.31E E E+02 < 2.32E+02 K E E E E+01 Bi E E E E+01 Pb E E E E+01 Ra E E+02 Th E E+02 11/10/09 e H E E+02 < 2.34E E E+02 < 2.32E+02 K E E E E+01 Tl E E E E+00 Pb E E E E+00 Bi E E E E+01 Pb E E+01 Ra E E+01 Th E E+02 a Split sampling at NCRPS Site SH-GW-69(HNP Site GW-69), 0.2 mi. from the plant in the north-northeast sector. b Split sampling at NCRPS Site SH-GW-70(HNP Site GW-70), 0.4 mi. from the plant in the east sector. c Gross alpha/beta analyses are routinely performed on NCRPS groundwater samples. Gamma analyses are routinely performed on Harris Nuclear Plant groundwater samples. Tritium analyses are routinely performed by both facilities. d Tritium sample analyses not available from State Radiochemistry Laboratory database for NCRPS samples collected on 5/20/09 from locations SH-GW-69. Gross alpha/gross beta analysis not performed by State Radiochemistry Laboratory on groundwater sample collected on 5/20/09 at location SH-GW-70. e Gross alpha/gross beta analysis not performed by State Radiochemistry Laboratory on groundwater samples collected on 8/25/09 and 11/10/09 at locations SH-GW-69 and SH-GW
59 Harris - Groundwater Groundwater- Alpha, Beta, Tritium and Gamma,(pCi/L) SH-GW-71 a All measurements in pci/l SH-GW-72 b All measurements in pci/l RPS HNP RPS HNP Date Isotope c Meas. Error Meas. Error Meas. Error Meas. Error 2/24/09 Alpha 8.09E E E E+00 Beta 8.99E E E E+00 H E E+02 < 2.35E E E+02 < 2.35E+02 K E E E E+01 Tl E E+00 Pb E E+01 Bi E E E E+01 Pb E E E E+01 Ra E E+02 Th E E+02 5/20/09 d Alpha 1.66E E+00 Beta 3.84E E+00 H-3 < 2.32E E E+02 < 2.33E+02 K E E E E+01 Pb E E E E+01 Bi E E E E+01 Pb E E E E+01 8/25/09 e H E E+02 < 2.32E E E+02 < 2.32E+02 K E E E E+02 Tl E E E E+00 Bi E E E E+01 Pb E E+01 Ra E E+02 Th E E+02 11/10/09e H E E+02 < 2.34E E E+02 < 2.34E+02 K E E E E+02 Pb E E E E+00 Bi E E E E+01 Pb E E E E+01 Ra E E+02 Th E E+00 a Split sampling at NCRPS Site SH-GW-71(HNP Site GW-71), 0.3 mi. from the plant in the southeast sector. b Split sampling at NCRPS Site SH-GW-72 (HNP Site GW-72), 0.2 mi. from the plant in the southeast sector. c Gross alpha/beta analyses are routinely performed on NCRPS groundwater samples. Gamma analyses are routinely performed on Harris Nuclear Plant groundwater samples. Tritium analyses are routinely performed by both facilities. d Tritium sample analyses not available from State Radiochemistry Laboratory database for NCRPS samples collected on 5/20/09 from location SH-GW-71. Gross alpha/gross beta analysis not performed by State Radiochemistry Laboratory on groundwater sample collected on 5/20/09 at location SH-GW-72. e Gross alpha/gross beta analysis not performed by State Radiochemistry Laboratory on groundwater samples collected on 8/25/09 and 11/10/09 at locations SH-GW-71 and SH-GW
60 Harris - Fish Life Fish - Gamma RPS Indicator (SH-FL-52) a All measurements in pci/g HNP Date Isotope Meas. Error Meas. Error 5/18/09 K E E E E-01 Bass Bi E E-02 5/18/09 K E E E E-01 Sunfish 5/18/09 K E E E E-01 Catfish Bi E E-02 11/16/09 K E E E E-01 Bass 11/16/09 K E E E E-01 Catfish Bi E E-02 Pb E E-02 11/16/09 K E E E E-01 Sunfish Pb E E-02 a Duplicate sampling at NCRPS Site SH-FL-52-1 or SH-FL-52-2(HNP Site F1-44 or F2-44). Blank spaces indicate a result below LLD unless otherwise noted. 3-31
61 Harris - Food Crop Food Crop - Gamma, pci/g RPS Indicator (SH-FC-51-2) a All measurements in pci/g HNP Date Isotope Meas. Error Meas. Error 11/18/09 Be E E E E-01 K E E E E-01 Bi-212 Pb E E-02 Bi E E-02 Pb E E-02 Ra E E-01 Th E E-01 12/16/09 Be E E E E-02 K E E E E-01 Tl E E-02 Bi-212 Pb E E-02 Bi E E-02 Pb E E-02 Ra E E-01 Th E E-01 Food Crop - Gamma, pci/g RPS Indicator (SH-FC-13) b All measurements in pci/g HNP Date Isotope Meas. Error Meas. Error 11/18/09 Be E E E E-01 K E E E E-01 Tl E E-02 Bi E E-01 Pb E E-02 Bi E E-02 Ra E E-01 Th E E-01 12/16/09 Be E E E E-01 K E E E E-01 Tl E E-02 Pb E E-02 Bi E E-02 Pb E E-02 Ra E E-01 Th E E-01 a Duplicate sampling at NCRPS site SH-FC-51-2 (HNP Site#55) at the intersection of SR#1136 and SR#1137 in the north-northwest sector approximately 1.7 mi. from the plant. b Duplicate sampling at NCRPS site SH-FC-13 (HNP Site#5) 18.0 mi north-northwest from the plant. 3-32
62 Harris - Sediment Sediment - Gamma, pci/g SH-SD-54 a All measurements in pci/g SH-SD-52 b All measurements in pci/g RPS HNP RPS HNP Date Isotope Meas. Error Meas. Error Meas. Error Meas. Error 2/12/09 Alpha 0.00E E E E+00 Beta 9.14E E E E+00 Be E E-01 K E E E E E E E E-01 Co E E-02 Co E E E E-02 Cs E E E E-02 Tl E E E E-02 Bi E E E E-02 Pb E E E E-02 Bi E E E E-02 Pb E E E E-02 Ra E E E E E E E E-01 Ac E E E E-02 Th E E-01 7/21/09 Alpha 1.18E E E E+00 Beta 1.30E E E E+00 Be E E E E-01 K E E E E E E E E-01 Co E E E E-02 Sb E E-02 Cs E E E E-02 Tl E E E E E E E E-02 Bi E E E E E E-02 Pb E E E E E E-02 Bi E E E E E E E E-02 Pb E E E E E E E E-02 Ra E E E E E E E E-01 Ac E E E E E E E E-02 Th E E+00 Sediment - Gamma RPS Indicator (SH-SD-22) c All measurements in pci/g HNP Date Isotope Meas. Error Meas. Error 2/12/09 Alpha 2.36E E+00 Beta 2.54E E+00 Be E E-01 K E E-01 Tl E E-02 Bi E E-01 Pb E E-02 Bi E E-02 Pb E E-02 Ra E E E E-01 Ac E E
63 Harris - Sediment a Duplicate sampling at NCRPS Site SH-SD-54 (HNP Site 52) is 3.8 miles south of the plant. Sample is collected from the bottom of Harris Lake. b Duplicate sampling at NCRPS Site SH-SD-52(HNP Site 41). This is a shoreline sediment area near cooling tower blowdown zone. c Duplicate shoreline sediment sampling at NCRPS Site SH-SD-22 (HNP Site SH-SS-26) is 4.6 miles south of the plant. 3-34
64 Harris - TLD TLD All readings in mr/year. Loc # Location 1 st Qtr a 2 nd Qtr 3 rd Qtr 4 th Qtr Meas Error Meas Error Meas Error Meas Error 1 SR #1127 at Wake Trash Collection Area New Hill near First Baptist Church SR #1011 Dixie Pipeline SR #1134, 4 mi. S of SR#1011 Barricade Intersection of SR #1134 and SR # House Ruins on SR # Dead End on SR # Dirt Road Int. Between Plant & Aux. Reservoir mi. south on Dirt Road from TLD Earthen Dam at Harris Plant Intersection of SR #1149 and US Apex at Jones Park mi. on SR #1008 from Int. w/ SR # Intersection of SRs #1910, 1909 and Intersection of SR #1972 and US Neste Resin Corporation on SR # mi. from Int. of SR #1916 and SR # Buckhorn United Methodist Church on NC North of Spillway Maintenance Junction of SRs #1401 and #1402 on SR # Sweet Springs Church on SR # Int. of SR #1116 and SR # mi. E of Hollemans Crossroads, SR # Hollemans Crossroads mi. SW of Hollemans Crossroads on SR # mi. SW of Hollemans Crossroads on SR # Rear of Harris E&E Center Cemetary on SR # US 1 at Wake/Chatham County Line US 1 at Harris Lake mi. N on US1 from TLD SR #1142 and Underground Cable Sign SR #1142 at Barricade SR #1142-Olive s Dairy mi. on SR #1152 from Int. with SR # Holly Springs on Earp Street Intersection on SR #1393 and SR # Century 21 Office Parking Lot Access Road (East) to Auxiliary Reservoir SR #1136 at Parra Residence(mobile home) St. Mary s Street, Raleigh Average 57.8 Yearly Average, All Sites 57.8 a Due to travel restrictions 2009, TLD s were placed at Harris for only the first quarter. 3-35
65 MCGUIRE NUCLEAR STATION
66 McGuire - Summary MCGUIRE NUCLEAR STATION HUNTERSVILLE, MECKLENBURG COUNTY Duke Power Company (Duke), a subsidiary of Duke Energy Corporation (DEC), operates the McGuire Nuclear Station (MNS) located about 17 miles northwest of Charlotte, NC, on Lake Norman. The plant consists of two pressurized water reactors with a net design rating of 1180 MW(e) each. Commercial power production was initiated by Unit 1 on December 1, 1981, and Unit 2 on March 1, The North Carolina Radiation Protection Section (NCRPS) has conducted an environmental radiation monitoring program around MNS since This environmental monitoring consists of sampling the following media: air particulate, surface water, milk, fish, crops/vegetation, soil/sediment, and thermoluminescent dosimetry (TLD). For a map of sampling locations around MNS, please see pages 4-4 and 4-5. Air Particulate and Air Radioiodine For 2009, all gross beta results for NCRPS air samples were below NCRPS's investigation level of 0.5 pci/m 3 and no appreciable upward trend was noted when compared with results from years past. MNS and NCRPS results are in general agreement as can be seen in the gross beta activity averages for air particulate samples collected in 2009: BETA AVERAGES FOR MCGUIRE AIR SAMPLING LOCATIONS, 2009 Location NCRPS Average (pci/m 3 ) MNS Average (pci/m 3 ) % Difference * MG-APLV-120 (Indicator) 2.09 E E MG-APLV-102 (Control) 2.39 E E MG-APLV E E MG-APLV E E MG-APLV-119 (not co-located with MNS) 1.98 E-2 *Please note that in this case "percent difference" refers to the difference from the average of the two measurements. Radioiodine was not detected in air samples collected at the control and indicator locations in No occurrences of radioiodine in air were detected in samples collected from co-located MNS air samplers. Additionally, no man-made activity was detected in gamma isotopic analyses of air samples collected around McGuire in
67 McGuire - Summary Surface Water Significant amounts of radioiodine were not detected in surface water samples collected at the indicator location (MG-SW-128) in Average tritium levels were low in 2009, with an indicator site (MG-SW-128) average of 1060 pci/l and a control site (MG-SW-135) average of 118 pci/l for No man-made radionuclides were detected in surface water samples collected in Milk For milk samples collected in 2009, no significant amount (above the investigation level of 10 pci/l) of radioiodine was detected. No man-made radionuclides were detected in surface water samples collected in Fish For fish samples collected in 2009, several samples were found to have small amounts of cesium-137. Cs-137 is commonly seen in small amounts in fish and its presence is probably due to past atmospheric nuclear weapons testing. The detected levels of these radionuclides were very low in all instances. Sediment For sediment samples and food crop collected in 2009, no man-made radionuclides were found. Thermoluminescent Dosimetry TLD results for 2009 produced a yearly average exposure of 65.0 mr for all sites. This is less than the statewide average of 75 mr/year. Due to travel restrictions in 2009, TLD s were placed at McGuire for only the first quarter of the year. This travel restriction prevented NCRPS employees from placing or retrieving TLD s for the second through fourth quarters of To reduce the possibility of a recurrence of this environmental monitoring gap, NCRPS has implemented a new ambient gamma monitoring regime. The new ambient monitoring regime will replace TLDs with optically stimulated luminescent dosimeters, which will be placed/retrieved on an annual basis starting in

68 McGuire - Maps 4-4

69 4-5 McGuire - Maps
70 McGuire - Air Particulate Section 3: McGuire Nuclear Station, Huntersville, North Carolina Air Particulate - Gross Beta, (pci/m 3 ) Indicator (MG-APLV-120) a Control (MG-APLV-102) a All measurements x 10-2 pci/m 3 All measurements x 10-2 pci/m 3 RPS MNS RPS MNS Date Meas. Error Meas. Error Meas. Error Meas. Error 1/5/09 b /12/ /19/ /26/ /2/ /9/ /16/ /23/ /3/ /9/ /16/ /23/ /30/ /6/ /13/ /20/ /27/ /4/ /11/ /18/ /26/ /1/ /8/ /15/ /22/ /29/ /6/ /13/ /20/ /27/ /3/ /10/ /17/ /24/ /31/ /8/ /14/ /21/ /28/ /5/ /12/ /19/ /26/ /2/ /9/ /16/ /23/ /30/ /7/ /14/ /21/ /28/
71 Air Particulate - Gross Beta, (pci/m 3 ) Indicator (MG-APLV-120) a Control (MG-APLV-102) a All measurements x 10-2 pci/m 3 All measurements x 10-2 pci/m 3 RPS MNS RPS MNS Date Meas. Error Meas. Error Meas. Error Meas. Error Average % Diff a Split sampling at NCRPS Sites MG-APLV-120 (MNS Site 120) located at the McGuire Site boundary approximately 0.7 mi. NNE of the plant, and MG-APLV-102 (MNS Site 102), located 9.89 mi west-northwest of the plant. b Unless otherwise noted, blank space for NCRPS results indicates that a gross beta result was not available from the State Radiochemistry Laboratory database. 4-7
72 MCGUIRE AIR PARTICULATE INDICATOR SITE 5.00E E E-02 Gross Beta Activity (pci/m^3) 3.50E E E E E E E E WEEKS RPS(MG-APLV-120) MNS(120)
73 MCGUIRE AIR PARTICULATE CONTROL SITE Gross Beta Activity (pci/m^3) WEEKS RPS(MG-AP-102) MNS(102)
74 MCGUIRE AIR PARTICULATE INDICATOR VS. CONTROL, NCRPS 5.00E E E-02 Gross Beta Activity (pci/m^3) 3.50E E E E E E E E WEEKS INDICATOR(MG-APLV-120) CONTROL(MG-APLV-102)
75 McGuire - Air Particulate Air Particulate - Gross Beta, (pci/m 3 ) MG-APLV-119 a MG-APLV-125 MG-APLV-133 All measurements x 10-2 pci/m 3 All measurements x 10-2 pci/m 3 All measurements x 10-2 pci/m 3 RPS RPS MNS RPS MNS Date b Meas. Error Meas. Error Meas. Error Meas. Error Meas. Error 1/5/09 c /12/ /19/ /26/ /2/ /9/09 d /16/ /23/ /3/ /9/ /16/ /23/09 e /30/09 f /6/ /13/ /20/ /27/ /4/ /11/ /18/ /26/09 g /1/ /8/ /15/ /22/09 h /29/09 h /6/ /13/ /20/ /27/ /3/ /10/09 i /17/ /24/ /31/ /8/ /14/09 j /21/ /28/09 k /5/ /12/ /19/09 l /26/ /2/ /9/09 m /16/ /23/ /30/09 n /7/09 o /14/09 o /21/09 p /28/09 q
76 McGuire - Air Particulate Air Particulate - Gross Beta, (pci/m 3 ) MG-APLV-119 a MG-APLV-125 MG-APLV-133 All measurements x 10-2 pci/m 3 All measurements x 10-2 pci/m 3 All measurements x 10-2 pci/m 3 RPS RPS MNS RPS MNS Date b Meas. Error Meas. Error Meas. Error Meas. Error Meas. Error Average % Diff a Split sampling at NCRPS Sites MG-APLV-119 (MNS Site 119) located at Duke Power's Huntersville Substation approximately 6.2 mi. eastsoutheast of the plant, MG-APLV-125 (MNS Site 125) located near the site boundary 0.4 mi. southwest of the plant, MG-APLV-133 (MNS Site 133) located at Duke Power's Cornelius Substation approximately 6.2 mi. northeast of the plant. b For locations MG-APLV-119 and MG-APLV-133, actual date of collection for NCRPS samples occurs during the week of the date cited. For NCRPS samples collected at location MG-APLV-125 and MNS samples collected at locations 125 and 133, date cited with a given result is the actual collection date. Samples at locations MG-APLV-119 and MG-APLV-133 are collected for NCRPS by Mecklenburg County Air Quality Division. Duke power employees collect samples for NCRPS at location MG-APLV-125 due to security considerations. Because of NCRPS air sample collection by two different entities, sample collection dates cannot be synchronized for all air sampling locations in the McGuire air sampling network. c Unless otherwise noted, blank space for Radiation Protection results indicates that a gross beta result was not available from the State Radiochemistry Laboratory database. d Sample not collected for NCRPS at locations MG-APLV-119 & MG-APLV-133 for week of 2/9/09. e Sample not collected at MG-APLV-133 for week of 3/23/09. Mecklenburg County Air Quality personnel were unable to collect sample due to locked gate. f Sample not collected for NCRPS at locations MG-APLV-119 & MG-APLV-133 for week of 3/30/09. g Sample not collected for NCRPS at locations MG-APLV-119 & MG-APLV-133 for week of 5/26/09. h Sample not collected for NCRPS at locations MG-APLV-119 & MG-APLV-133 for week of 6/22/09 & 6/29/09. i Sample not collected for NCRPS at locations MG-APLV-119 & MG-APLV-133 for week of 8/10/09. Sample not collected at location MG- APLV-125 from 8/6/10 9/28/10 due to mechanical failure of the NCRPS air sampler at that location. Sampler was replaced during week of 9/21/10 and a sample was collected subsequently on 9/28/10. j Sample not collected for NCRPS at locations MG-APLV-119 & MG-APLV-133 for week of 9/14/09. k Sample not collected for NCRPS at locations MG-APLV-119 & MG-APLV-133 for week of 9/28/09. l Sample not collected for NCRPS at locations MG-APLV-119 & MG-APLV-133 for week of 10/19/09. m Sample not collected for NCRPS at locations MG-APLV-119 & MG-APLV-133 for week of 11/9/09. n Sample not collected for NCRPS at locations MG-APLV-119 & MG-APLV-133 for week of 11/30/09. o Sample result for location MG-APLV-125 collected on 12/21/09 corrected from result supplied by State Radiochemistry Laboratory database. Result in database was incorrect due to typographical error. Sample results for location MG-APLV-125 and MNS 125 were affected by power outage at site for weeks of 12/7/10 & 12/14/10. Both NCRPS and MNS samplers were restarted on 12/14/10 and normal sample collection resumed. p Sample not collected for NCRPS at locations MG-APLV-119 & MG-APLV-133 for week of 12/21/09. q Sample not collected at MG-APLV-133 for week of 3/23/09. Mecklenburg County Air Quality personnel were unable to collect sample due to locked gate. 4-12
77 MCGUIRE AIR PARTICULATE HUNTERSVILLE SITE Gross Beta Activity (pci/m^3) WEEKS RPS(MG-APLV-119)
78 MCGUIRE AIR PARTICULATE SETTLING POND SITE 5.00E E E-02 Gross Beta Activity (pci/m^3) 3.50E E E E E E E E WEEKS RPS(MG-APLVP-125) MNS(125)
79 MCGUIRE AIR PARTICULATE CORNELIUS SITE 5.00E E E-02 Gross Beta Activity (pci/m^3) 3.50E E E E E E E E WEEKS RPS(MG-APLV-133) MNS(133)
80 McGuire - Air Radioiodine Air Particulate - Radioiodine, (pci/m 3 ) Indicator (MG-APCC-120) a Control (MG-APCC-102) a All measurements x 10-2 pci/m 3 All measurements x 10-2 pci/m 3 RPS MNS RPS MNS Date Meas. Error Meas. Error Meas. Error Meas. Error 1/5/09 b < 0.87 < /12/09 < 2.02 < /19/09 < 0.89 < /26/09 < 0.83 < /2/09 < 1.00 < /9/09 < 0.98 < /16/09 < 0.94 < /23/09 < 1.20 < /3/09 < 0.97 < /9/09 < 1.75 < /16/09 < 0.76 < /23/09 < 1.12 < /30/09 < 0.87 < /6/09 < 1.08 < /13/09 < 0.66 < /20/09 < 0.59 < /27/09 < 0.52 < /4/09 < 0.80 < /11/09 < 0.99 < /18/09 < 0.85 < /26/09 < 0.95 < /1/09 < 0.14 < /8/09 < 0.94 < /15/09 < 1.00 < /22/09 < 0.63 < /29/09 < 0.83 < /6/09 < 1.01 < /13/09 < 0.69 < /20/09 < 1.24 < /27/09 < 1.60 < /3/09 < 0.97 < /10/09 < 0.91 < /17/09 < 1.34 < /24/09 < 1.31 < /31/09 < 1.50 < /8/09 < 0.83 < /14/09 < 1.11 < /21/09 < 0.86 < /28/09 < 1.15 < /5/09 < 1.00 < /12/09 < 0.69 < /19/09 < 0.72 < /26/09 < 0.77 < /2/09 < 1.01 < /9/09 < 0.82 < /16/09 < 1.34 < /23/09 < 1.09 < /30/09 < 1.24 < /7/09 < 1.03 < /14/09 < 0.85 < /21/09 < 0.74 < /28/09 < 0.79 <
81 McGuire - Air Radioiodine Air Particulate - Radioiodine, (pci/m 3 ) Indicator (MG-APCC-120) a Control (MG-APCC-102) a All measurements x 10-2 pci/m 3 All measurements x 10-2 pci/m 3 RPS MNS RPS MNS Date Meas. Error Meas. Error Meas. Error Meas. Error Average NA NA NA NA % Diff. NA NA a Split sampling at NCRPS Sites MG-APCC-120 (MNS Site 120) located at the McGuire Site boundary approximately 0.7 mi. north-northeast of the plant, and MG-APCC-102 (MNS Site 102), located 9.89 mi west-northwest of the plant. b Unless otherwise noted, blank space for NCRPS results indicates that a gamma isotopic analysis was performed, but no radioiodine was detected, and an Minimum Detectable Activity was not reported in the State Radiochemistry Laboratory database. 4-17
82 McGuire - Air Particulate Air Particulate - Gamma, (pci/m 3 ) Indicator (MG-APLV-120) a Control (MG-APLV-102) All measurements in pci/m 3 All measurements in pci/m 3 RPS MNS RPS MNS Date Isotope Meas. Error Meas. Error Meas. Error Meas. Error 1/5/09 b Be E E E E-02 K E E-02 1/12/09 Be E E E E-02 K E E-02 1/19/09 Be E E E E-02 K E E-02 1/26/09 Be E E-02 K E E-02 2/2/09 Be E E E E-02 K E E E E-02 2/9/09 Be E E E E-02 2/16/09 Be E E-02 K E E-02 2/23/09 Be E E E E-02 3/3/09 Be E E E E-02 K E E E E-02 3/9/09 Be E E E E-02 3/16/09 Be E E E E-02 K E E-02 3/23/09 Be E E E E-02 K E E-02 3/30/09 Be E E E E-02 4/6/09 Be E E E E-02 K E E-02 4/13/09 Be E E E E-02 4/20/09 Be E E E E-02 4/27/09 Be E E E E-02 5/4/09 Be E E E E-02 5/11/09 Be E E E E-02 K E E-02 5/18/09 Be E E E E-02 5/26/09 Be E E E E-02 6/1/09 Be E E E E-02 K E E-03 6/8/09 Be E E-02 6/15/09 Be E E-02 6/22/09 Be E E E E-02 6/29/09 Be E E E E E E-02 7/6/09 Be E E E E-02 7/13/09 Be E E E E-02 7/20/09 Be E E E E-02 7/27/09 Be E E E E-02 8/3/09 Be E E E E-02 K E E E E-03 8/10/09 Be E E E E-02 K E E-02 8/17/09 8/24/09 Be E E E E-02 8/31/09 Be E E E E E E-02 9/8/09 Be E E E E-02 9/14/09 Be E E-02 K E E-02 9/21/09 Be E E E E-02 9/28/09 Be E E E E E E E E
83 McGuire - Air Particulate Air Particulate - Gamma, (pci/m 3 ) Indicator (MG-APLV-120) a Control (MG-APLV-102) All measurements in pci/m 3 All measurements in pci/m 3 RPS MNS RPS MNS Date Isotope Meas. Error Meas. Error Meas. Error Meas. Error 10/5/09 Be E E E E-02 10/12/09 K E E E E-02 10/19/09 Be E E-02 K E E-02 10/26/09 Be E E E E-02 11/2/09 Be E E E E E E-02 K E E-03 11/9/09 Be E E E E-02 11/16/09 Be E E E E-02 11/23/09 K E E-01 11/30/09 Be E E E E E E E E-02 12/7/09 Be E E E E-02 12/14/09 Be E E E E-02 12/21/09 Be E E E E-02 12/28/09 Be E E E E-02 a Split sampling at NCRPS Sites MG-APLV-120 (MNS Site 120) located at the McGuire Site boundary approximately 0.7 mi. north-northeast of the plant, and MG-APLV-102 (MNS Site 102) located at East Lincoln Junior High School approximately 8.7 mi. west-northwest of the plant. b Composite gamma analyses of air particulate samples are performed on a monthly basis by NCRPS. Gamma analyses of air particulate samples are analyzed on a weekly basis by MNS. For all results, a blank space for individual isotopes means that the value is less than the lowest level detectable. 4-19
84 McGuire - Air Particulate Air Particulate - Gamma, (pci/m 3 ) MG-APLV-119 a All measurements in pci/m 3 RPS Date Isotope Meas. Error January b K E E-03 February March April May Be E E-02 June July Be E E-02 August Be E E-02 September Be E E-02 October Be E E-02 November Be E E-03 December Be E E-03 Air Particulate - Gamma, (pci/m 3 ) Indicator (MG-APLV-125) a Control (MG-APLV-133) a All measurements in pci/m 3 All measurements in pci/m 3 RPS MNS RPS MNS Date Isotope Meas. Error Meas. Error Meas. Error Meas. Error 1/5/09 b Be E E E E-02 K E E-02 1/12/09 Be E E E E-02 K E E E E-02 1/19/09 Be E E E E-02 1/26/09 Be E E E E-02 2/2/09 Be E E E E-02 K E E-03 2/9/09 Be E E E E-02 2/16/09 Be E E E E-02 K E E-02 2/23/09 Be E E E E-02 3/3/09 Be E E E E-02 3/9/09 Be E E E E-02 3/16/09 Be E E E E-02 3/23/09 Be E E E E-02 K E E-02 3/30/09 Be E E E E-02 4/6/09 Be E E E E-02 K E E-02 4/13/09 Be E E E E-02 4/20/09 Be E E E E-02 4/27/09 Be E E E E-02 K E E E E-03 5/4/09 Be E E E E-02 K E E-02 5/11/09 Be E E E E-02 5/18/09 Be E E E E-02 5/26/09 Be E E E E-02 6/1/09 Be E E E E-02 K E E-02 6/8/09 Be E E E E
85 McGuire - Air Particulate Air Particulate - Gamma, (pci/m 3 ) Indicator (MG-APLV-125) a Control (MG-APLV-133) a All measurements in pci/m 3 All measurements in pci/m 3 RPS MNS RPS MNS Date Isotope Meas. Error Meas. Error Meas. Error Meas. Error K E E-02 6/15/09 Be E E E E-02 K E E-02 6/22/09 Be E E E E-02 6/29/09 Be E E E E-02 7/8/09 Be E E E E-02 7/13/09 Be E E E E-02 7/20/09 Be E E E E-02 7/27/09 Be E E E E-02 8/3/09 Be E E E E-02 8/10/09 c Be E E E E-02 8/17/09 Be E E-02 8/24/09 Be E E-02 8/31/09 Be E E E E E E-02 9/8/09 Be E E E E-02 9/14/09 Be E E E E-02 9/21/09 Be E E E E-02 K E E-02 9/28/09 Be E E-02 K-40 ` 1.84E E-02 10/5/09 Be E E E E-02 10/12/09 Be E E E E-02 10/19/09 10/26/09 Be E E E E-02 11/2/09 Be E E E E E E E E-02 11/9/09 Be E E E E-02 11/16/09 Be E E E E-02 11/23/09 Be E E-02 11/30/09 Be E E E E E E E E-2 K E E-03 12/7/09 d Be E E-02 12/14/09 d Be E E E E-02 12/21/ E E E E-02 12/28/ E E E E-02 a Split sampling at NCRPS Sites MG-APLV-119 (no co-located Duke Power air sampler) located at Duke Power's Huntersville Substation approximately 6.2 mi. ESE of the plant, MG-APLV-125 (MNS Site 125) located near the site boundary 0.4 mi. southwest of the plant, MG- APLV-133 (MNS Site 133) located at Duke Power's Cornelius Substation approximately 6.2 mi. northeast of the plant. b Composite gamma analyses of air particulate samples are performed on a monthly basis by NCRPS. Gamma analyses of air particulate samples are analyzed on a weekly basis by MNS. For all results, a blank space for individual isotopes means that the value is less than the LLD. c Sample not collected at location MG-APLV-125 from 8/6/10 9/28/10 due to mechanical failure of the NCRPS air sampler at that location. Sampler was replaced during week of 9/21/10 and a sample was collected subsequently on 9/28/10. d Sample results for location MG-APLV-125 and MNS 125 were affected by power outage at site for weeks of 12/7/10 & 12/14/10. Both NCRPS and MNS samplers were restarted on 12/14/10 and normal sample collection resumed. 4-21
86 McGuire - Surface Water Surface Water - Low-Level Iodine and Gamma Indicator (MG-SW-128) a All measurements in pci/l Control (MG-SW-135) b All measurements in pci/l RPS MNS RPS MNS Date Isotope Meas. Error Meas. Error Meas. Error Meas. Error 1/12/09 c K E E E E+01 Ra E E+01 LLI 1.84E E+00 2/09/09 LLI 6.00E E-01 3/9/09 K E E E E E E+01 LLI 2.80E E-01 4/6/ E E+01 LLI 0.00E E-01 5/4/09 K E E+01 LLI 2.50E E-01 6/1/09 K E E E E+01 LLI 0.00E E-01 6/29/09 K E E E E+01 LLI 0.00E E-01 7/27/09 K E E E E E E+01 LLI 4.60E E-01 8/24/ E E E E+01 LLI 0.00E E-01 9/21/09 LLI 0.00E E-01 10/19/09 LLI 0.00E E-01 11/16/09 K E E+01 LLI 0.00E E-01 12/14/09 LLI 4.60E E-01 a Split sampling at NCRPS Site MG-SW-128 (MNS Site 128) located at the discharge canal bridge approximately 0.4 mi. east-northeast of the plant. b Split sampling at NCRPS Site MG-SW-135 (MNS Site 135) located at the Marshall Plant intake canal approximately 12 mi.north of the plant. Radiation Protection Section samples collected at location MG-SW-135 are not analyzed for low level iodine. c Unless otherwise noted, blank space for NCRPS results indicates that analysis was performed but that an MDA was not recorded in the State Radiochemistry Laboratory database. 4-22
87 McGuire - Surface Water Surface Water - Tritium Indicator (MG-SW-128) a All measurements in pci/l Control (MG-SW-135) b All measurements in pci/l RPS MNS RPS MNS Date Meas. Error Meas. Error Meas. Error Meas. Error 1/22/ E E E E+02 2/9/ E E E E+02 3/9/ E E E E+02 1 st Quarter 1.13E E+01 < 9.88E-01 4/6/ E E E E+02 5/4/ E E E E+02 6/1/ E E E E+02 6/29/ E E E E+02 2 nd Quarter 9.04E E E+01 7/27/ E E E E+02 8/24/ E E E E+02 9/21/ E E E E+02 3 rd Quarter 1.08E E+01 < 1.17E+02 10/19/ E E E E+02 11/16/ E E E E+02 12/14/ E E E E+02 4 th Quarter 1.61E E+01 < 1.59E+02 Average c 1.06E E E E+02 % Diff. 10.9% 18.1% a Split sampling at NCRPS Site MG-SW-128 (MNS Site 128) located at the discharge canal bridge approximately 0.4 mi. east-northeast of the plant. b Split sampling at NCRPS Site MG-SW-135 (MNS Site 135) located at the Marshall Plant intake canal approximately 12 mi. north of the plant. c Negative results treated as zero for averaging purposes. 4-23
88 McGuire - Milk Milk - Gamma and Low Level Iodine RPS Indicator (MG-MS-141) a All measurements in pci/l MNS Date Isotope Meas. Error Meas. Error 1/5/09 K E E E E+02 LLI 3.20E E-01 < 7.02E-01 2/2/09 K E E E E+02 LLI 0.00E E-01 < 7.86E-01 3/3/09 K E E E E+02 LLI 3.20E E-01 < 6.93E-01 3/30/09 b K E E+01 LLI 2.00E E-01 4/27/09 b K E E E E+01 LLI 4.00E E-01 < 0.69E-01 5/26/09 b K E E E E+01 LLI 2.30E E-01 < 6.91E-01 6/22/09 b K E E E E+01 Bi E E+00 Pb E E+00 LLI 2.00E E+00 < 7.58E-01 7/6/09 K E E E E+01 Bi E E+00 Pb E E+00 LLI 1.70E E-01 < 6.94E-01 7/20/09 b K E E+01 Bi E E+00 Pb E E+00 LLI 7.00E E-02 8/17/09 b K E E E E+01 Bi E E+00 Pb E E+00 LLI 0.00E E-01 < 7.59E-01 9/28/09 b K E E E E+02 LLI 0.00E E-01 < 7.56E-01 10/12/09 Be E E+01 K E E E E+02 LLI 0.00E E-01 < 7.31E-01 11/09/09 K E E E E+01 LLI 4.80E E-01 < 7.83E-01 12/7/09 K E E E E+02 LLI 0.00E E-01 < 7.86E-01 a Duplicate sampling at NCRPS Site MG-MS-141 (MNS Site 141) located 14.8 miles north-northwest of McGuire Nuclear Station. For all results, a blank space for individual isotopes means that the value is less than the LLD. b Dates cited are for NCRPS samples only. Results given for MNS samples were collected on the following dates: 4/13/09, 5/11/09. 6/8/09, 8/3/09, 9/14/09. MNS collects milk grab samples every two weeks from location 141, but duplicate samples every four weeks. The NCRPS sample schedule fell out of synchronization for the month of April and was resynchronized on 10/12/
89 McGuire - Fish Life Fish - Gamma Indicator (MG-FL-129) a RPS (pci/g-wet) MNS (pci/kg-wet) Date Isotope Meas. Error Meas. Error 4/7/09 K E E E E-01 Bottom Feeder 4/7/09 K E E E E-01 Predator Cs E E-03 < 1.67E-02 4/7/09 K E E E E-01 Forager 10/5/09 K E E E E-01 Bottom Feeder Cs E E-03 10/5/09 K E E E E-01 Predator 10/5/09 K E E E E-01 Forager a Split sampling at NCRPS Site MG-FL-129 (MNS Site 129) located near the MNS discharge canal entrance to Lake Norman approximately 0.6 mi east-northeast of the plant. For all results, a blank space for individual isotopes means that the value is less than the LLD. MNS reports samples in pci/kg; results here have been converted into pci/kg. 4-25
90 McGuire - Food Crop Food Crop - Gamma RPS Indicator (MG-FC-188) a All measurements in pci/g MNS Date Isotope Meas. Error Meas. Error 6/1/09 Be E E E E-02 K E E E E-01 9/8/09 Be E E E E-02 K E E E E-01 a Split sampling at NCRPS Site MG-FC-188 (MNS Site 188) at Austin s residence 2.8 mi north of the plant. At a minimum, semi-annual samples are to be collected in the spring and fall. For all results, a blank space for individual isotopes means that the value is less than the LLD. MNS reports samples in pci/kg; results here have been converted into pci/kg. 4-26
91 McGuire - Sediment Sediment - Gamma RPS Indicator (MG-SD-129) a All measurements in pci/g MNS Date Isotope Meas. Error Meas. Error 4/13/09 Be E E-02 K E E E E-01 Ra E E-01 10/12/09 Be E E-02 K E E E E-01 Tl E E-03 Bi E E-02 Bi E E-03 Pb E E-03 Ra E E-02 Ac E E-02 Gr. Alpha 1.08E E-01 Gr. Beta 1.04E E-01 a Split sampling at NCRPS Site MG-SD-129 (MNS Site 129) located near the MNS discharge canal entrance to Lake Norman approxmately 0.6 mi east-northeast of the plant. For all results, a blank space for individual isotopes means that the value is less than the LLD. MNS reports samples in pci/kg; results here have been converted into pci/kg. 4-27
92 McGuire - TLD TLD All readings in mr/year. Loc # Location 1 st Qtr a 2 nd Qtr 3 rd Qtr 4 th Qtr Meas Error Meas Error Meas Error Meas Error 1 MNS main entrance SR 1395, Next to Cowan's Ford Country Club Sign Entrance to Luckey Point, SR Del Mar Studio, NC 16 & Pilot Knob Rd NC 16 in Triangle Community Unity Church Rd., SR Cowan's Ford Boat Access, SR NC 73 & Killian Farm Rd, SR Martha's Chapel, SR Opposite Ivey Meadow Lane, SR SR 1396 & SR Killian Farm Rd. (SR 1909), near Johnson Creek Castanea Church, NC Lowesville Nationsbank, NC End of Glover Rd., (private road) South Little Egypt Rd., SR Rankin Elementary School, Mt. Holly Chestnut St. & NC McKoy Rd. (SR 2120) at Natural Gas pipeline McKoy & Hambright (SR 2117) Rds Neck (SR 2074) & Beatties Ford (SR 2128) Rds SR 2074 opposite McDowell Creek Treatment Plant Private residence near end of SR Freedom Dr. (NC 27) & Brown's Ave., Charlotte Public Library, Beatties Ford Rd. in Charlotte Graham & Craighead Streets, Charlotte Union Grove Church, Cashion Rd. (SR 2133) SR 2133 at telephone junction box End of SR Gilead Vol. Fire Dept., SR NC 73 & Terry Lane (SR 2255) Norman Island Drive, SR Sam Furr (SR 2145) & Northcross (SR 2316) Rds US 21 & Westmoreland Rd., SR Boat Marina Parking Lot on Henderson Rd., SR End of Bethel Church Rd., SR End of John Connor Rd., SR Mollypop Rd., SR Jetton (SR 2151) & Casual Cay (private) Roads Shoppes at Davidson Shopping Center, Concord Average Yearly Average, All Sites 65.0 a Due to travel restrictions in 2009, TLD s were placed at McGuire for only the first quarter. T 4-28
93 GE / HITACHI URANIUM FUEL FABRICATION PLANT
94 GE - Summary GE / HITACHI FUEL FABRICATION PLANT CASTLE HAYNE, NC General Electric (GE) operates a nuclear fuel fabrication facility approximately six miles north of Wilmington in Castle Hayne, North Carolina. This facility was licensed in January 1969 by the U.S. Nuclear Regulatory Commission (NRC) to fabricate uranium fuel for commercial reactors. The results of monitoring activities surrounding the GE facility for 2009 are presented in the following section. Samples of air particulates, surface water, groundwater, sediment, TLDs and treated waste water were collected around GE during this period. Analysis for all samples began with a gross alpha and gross beta determination. Further analyses using inductively coupled plasma mass spectrometry (ICP-MS) to detect uranium were then performed if the gross alpha results exceeded the screening levels listed in Appendix C of this report. Air Filters There are two NCRPS air samplers located on the GE site. The indicator location is at Site 20, at the fence near the southern boundary of the site. The control air sampling location, Site 03, is located at the Site Dock on the Cape Fear River. The mean results for the gross alpha analysis in pci/m 3 are shown below along with the percent difference between NCRPS and GE results. Alpha Activity in Air for GE and NCRPS Control and Indicator Locations Location NCRPS GE Percent Difference GE-APLV E E % GE-APLV E E % GE-APLV E The mean air activities at NCRPS Sites 03 and 20 are both slightly higher than those at GE samplers. When the actual NCRPS results in the data set are examined they were alternately greater and then less than the GE results. The mean value for NCRPS sample results was calculated by averaging all filters collected during Monitoring continued at Site GE- APLV-11 at the Horticultural Crops Research Station. The maximum gross alpha value at this site was 9.20 ± 0.51 E-03 pci/m 3. This maximum value was slightly above the NCRPS screening level for gross alpha in air (0.01 pci/m 3 ) as listed in Appendix A. Surface Water Surface water samples collected at Sites 03 and 04 were all indicative of no evidence of elevated uranium levels at these sites. The gross alpha and beta results from NCRPS and GE were generally within two standard deviations at both of these sites during
95 GE - Summary Groundwater Groundwater samples collected near the process lagoons at Site PL3A and WT-6 during 2009, in most instances, were well below the 5 pci/l gross alpha screening level. NCRPS results were generally in agreement with those from General Electric. However in a few instances there were elevated numbers which are hard to substantiate due to the age, low flow rate and other properties of the well site that make it difficult to discern the difference in analysis results by each lab. Therefore general deductions were taken into account while looking at results that were deemed to be an anomaly at the time and in comparison to GE s results. Furthermore, NCRPS results for samples from well F-3 near the former fluoride area were well below the 5 pci/l screening level at 2.17 ± 0.91 E+00 pci/l and 2.92 ± 1.43 E+00. These were consistent with GE results for the samples as well. Waste Water Samples of wastewater collected at Site GE-WW-02 were all above the 5 pci/l screening level. NCRPS results were higher than the GE results only on most occasions. However, several sample collections were not analyzed for various reasons, which further makes it difficult to ascertain why these elevated levels occurred. The higher results for the NCRPS samples are suspected to be the result of different sampling and analytical techniques. The NCRPS results include the dissolved and suspended activity. Furthermore, the N.C. State Laboratory for Public Health (SLPH) uses natural uranium as its calibration source for gross alpha in water analyses. The GE contract laboratory, in contrast, uses Am-241 as its calibration isotope. The difference in calibration isotopes can potentially cause a difference in the activity results. Alpha spectroscopy results are unavailable for these samples due to equipment integration problems and personnel turnover in the laboratory analyst position at the State Lab. Soil and Vegetation All of the soil samples collected at Site 05 (Tinga Farm) and Site 06 (Marathon Road) were below the 15 pci/g-dry screening level according to NCRPS or GE results. The SLPH completely ashes the samples and uses the ash weight to calculate the activity. NCRPS gross alpha values for vegetation are higher in some cases than the GE results. This is due to differences in the analysis procedures employed by the SLPH and the contract analysis laboratory used by GE. General Electric uses the dry weight value, which is calculated by multiplying the ash weight by the dry to ash weight ratio. The higher mass calculated for the dry weight would produce the differences in the GE and NCRPS values. Sediment All sediment samples collected at Sites 03 (Site Boat Dock) and 04 (Public Boat Dock) were below the 15 pci/g screening level for gross alpha. For this reason, no uranium analyses were done. Sediment samples collected at site 02D, the process lagoon outfall, were above the screening level on two occasions. 5-3
96 GE - Summary TLD s The maximum exposure rate during the first quarter was 39.3 mr/year. There is no evidence of elevated ambient gamma readings in the GE environment, since this result was well below the statewide average of 75 mr/year. Due to travel restrictions in 2009, TLDs were placed at GNF for only the first quarter of the year. This travel restriction prevented NCRPS staff from placing or retrieving TLD s for the second through fourth quarters of To reduce the possibility of a recurrence of this environmental monitoring gap, NCRPS has implemented a new ambient gamma monitoring regime. The new ambient monitoring regime will replace TLDs with optically stimulated luminescent dosimeters, which will be placed/retrieved on an annual basis starting in
97 5-5 GE - Maps

98 GE - Maps 5-6
99 GE Air Particulate Section 5: Global Nuclear Fuel Uranium Fuel Fabrication Plant, Castle Hayne, North Carolina Air Particulate - Gross Alpha, (pci/m 3 ) Indicator (GE-APLV-20) a Control (GE-APLV-03) b All measurements x 10-3 pci/m 3 All measurements x 10-3 pci/m 3 NCRPS GE NCRPS GE Date Meas. Error Meas. Error Meas. Error Meas. Error 1/13/ /20/ /27/ /03/ /10/ /17/ /24/ /03/ /10/ /17/ /24/ /31/ /07/ /14/ /21/ /28/ /05/ /12/ /19/ /26/ /02/ /09/ /16/ /23/ /30/ /07/ /14/ /21/ /28/ /04/ /11/ /18/ /25/ /01/ /08/ /15/ /22/ /29/ /06/ /13/ /20/ /27/ /03/ /10/ /17/ /24/ /01/ /08/ /15/ /22/ /28/
100 GE Air Particulate Air Particulate - Gross Alpha, (pci/m 3 ) Indicator (GE-APLV-20) a Control (GE-APLV-03) b All measurements x 10-3 pci/m 3 All measurements x 10-3 pci/m 3 NCRPS GE NCRPS GE Date Meas. Error Meas. Error Meas. Error Meas. Error Average % Diff. 8.6 % 4.5 % a GE-APLV-20 is located at the South Fence of the FMO Building Air Samples are collected weekly at this site by NCRPS and GE. Filters are composited monthly by GE and quarterly by NCRPS. b GE-APLV-03 is located at the GE dock downstream of the discharge canal. NCRPS and GE collect air samples weekly at this site. Filters are composited monthly by GE and quarterly by NCRPS. nc Samples were not analyzed by the North Carolina State Public Health Laboratory for one of the following reasons: scheduled samples were not collected, or samples were collected and submitted to the SLPH for analysis but the analysis result was missing from the State Lab database. 5-8
101 GENERAL ELECTRIC URANIUM FUEL FABRICATION PLANT INDICATOR SITES Gross Alpha Activity (pci/m^3) RPS(GE-APLV-20) GE(GE-APLV-20)
102 Gross Alpha Activity (pci/m^3) GENERAL ELECTRIC URANIUM FUEL FABRICATION PLANT CONTROL SITES RPS(GE-APLV-03) GE(GE-APLV-03)
103 0.01 GENERAL ELECTRIC URANIUM FUEL FABRICATION PLANT RPS - INDICATOR vs CONTROL Gross Alpha Activity (pci/m^3) INDICATOR(GE-APLV-03) Weeks CONTROL(GE-APLV-20)
104 GE Air Particulate Air Particulate - Gross Alpha, (pci/m 3 ) GE-APLV-11 a GE-APLV-11 iii All measurements x 10-3 pci/m 3 All measurements x 10-3 pci/m 3 NCRPS NCRPS Date Meas. Error Date Error Meas. 1/5/ /07/ /13/ /14/ /20/ /21/ /27/ /28/ /03/ /04/ /10/ /11/ /17/ /18/ /24/ /25/ /03/ /01/ /10/ /08/ /17/ /15/ /24/ /22/ /31/ /29/ /07/ /06/ /14/ /13/ /21/ /20/ /28/ /27/ /05/ /03/ /12/ /10/ /19/ /17/ /26/ /24/ /02/ /01/ /09/ /08/ /16/ /15/ /23/ /22/ /30/ /28/ Average 4.08 % Diff. - a GE-APLV-11 is located at the Horticultural Crops Research Station on Hwy. 117 across from the GE plant. nc Samples were not analyzed by the North Carolina State Public Health Laboratory for various and unforeseen reasons. 5-12
105 0.01 GENERAL ELECTRIC URANIUM FUEL FABRICATION PLANT NCSU HORTICULTURAL RESEARCH STATION Gross Alpha Activity (pci/m^3) Weeks RPS(GE-APLV-11)
106 GE Air Particulate Air Particulate - Isotopic Uranium, (pci/l)< Indicator (GE-APLV-20) a Control (GE-APLV-03) iv NCRPS GE (pci/l) NCRPS GE (pci/l) Date Isotope Meas. Error Meas. Error Meas. Error Meas. Error January U-234 nc E E-09 nc E E-09 U-235 nc E E-08 nc E E-08 U-238 nc - <1.85E E-08 nc - <4.94E E-09 February U-234 nc E E-08 nc E E-08 U-235 nc E E-08 nc E E-08 U-238 nc - <1.30E E-08 nc - <1.19E E-08 March U-234 nc - <5.70E E-08 nc - <1.66E E-08 U-235 nc E E-08 nc - <1.67E E-08 U-238 nc E E-08 nc - <1.43E E-08 April U-234 nc - <3.63E E-08 nc - <2.79E E-08 U-235 nc - <1.88E E-08 nc - <2.03E E-08 U-238 nc - <1.50E E-08 nc - <2.53E E-08 May U-234 nc - <2.09E E-10 nc - <8.40E E-10 U-235 nc - <6.44E E-09 nc - <3.36E E-09 U-238 nc - <9.34E E-09 nc - <1.76E E-09 June U-234 nc - <2.74E E-09 nc - <6.83E E-09 U-235 nc - <3.19E E-09 nc - <5.44E E-09 U-238 nc - <3.26E E-09 nc - <7.38E E-09 July U-234 nc - <7.89E E-09 nc - <4.49E E-09 U-235 nc - <3.02E E-09 nc - <1.56E E-08 U-238 nc - <4.29E E-09 nc - <6.7E E-09 August U-234 nc - <2.59E E-08 nc - <2.44E E-08 U-235 nc - <6.23E E-09 nc - <1.07E E-08 U-238 nc - <1.31E E-08 nc - <6.86E E-09 September U-234 nc E E-09 nc E E-09 U-235 nc E E-08 nc E E-08 U-238 nc - <1.51E E-08 nc - <5.14E E-09 October U-234 nc - <1.09E E-08 nc - <9.57E E-09 U-235 nc E E-08 nc E E-08 U-238 nc - <1.20E E-08 nc - <1.03E E-08 November U-234 nc - <6.62E E-08 nc - <2.53E E-08 U-235 nc - <1.51E E-08 nc - <1.90E E-08 U-238 nc E E-08 nc - <1.01E E-08 December U-234 nc - <3.42E E-08 nc - <1.71E E-08 U-235 nc - <2.82E E-08 nc - <1.22E E-08 U-238 nc - <5.71E E-09 nc - <2.73E E-08 a GE-APLV-20 is located at the South Fence of the FMO Building. GE-APLV-03 is located at the GE dock downstream of the discharge canal. NCRPS and GE collect air samples weekly at this site. Filters are composited monthly by GE and quarterly by NCRPS. nc Samples were not analyzed by the North Carolina State Public Health Laboratory for various and unforeseen reasons. 5-14
107 GE Surface Water Surface Water Gross Alpha, Gross Beta, and Isotopic Uranium, (pci/l) Indicator (GE-SW-03) a All measurements in pci/l Control (GE-SW-04) b All measurements in pci/l NCRPS GE NCRPS GE Date Isotope Meas. Error Meas. Error Meas. Error Meas. Error 3/03/09 Alpha nc - < nc - < Beta nc nc /05/09 Alpha nc - < nc - < Beta nc nc /01/09 Alpha < < Beta a GE-SW-03 is located at the site dam and is sampled on a quarterly basis. b GE-SW-04 is located at the Cape Fear River Public Boat Doc and is sampled on a quarterly basis. nc Samples were not analyzed by the North Carolina State Public Health Laboratory for various and unforeseen reasons. 5-15
108 GE Groundwater Groundwater - Alpha, Beta, and Uranium, pci/l NCRPS GE-GW-PL3A a All measurements in pci/l Date Isotope Meas. Error Meas. Error 1/27/09 Alpha nc Beta nc /13/09 Alpha nc Beta nc /15/09 Alpha nc Beta nc /30/09 Alpha nc - < Beta nc GE Groundwater - Alpha, Beta, and Uranium, pci/l NCRPS GE-GW-WT6 b All measurements in pci/l Date Isotope Meas. Error Meas. Error 5/21/09 Alpha nc - < Beta nc /30/09 Alpha nc - < Beta nc - < GE Groundwater - Alpha, Beta, and Uranium, pci/l NCRPS GE-GW-F3 c All measurements in pci/l Date Isotope Meas. Error Meas. Error 1/22/09 Alpha nc - < Beta nc - < /16/09 Alpha < Beta < GE a Sample was collected at Well 3A near the process lagoons (GE-GW-PL3A). b GE-WT-06 is collected from the waste treatment area. Sampling is done on a semi-annual basis. c GE-GW-F3. It is a shallow well placed in the upper aquifer. Sampling is on a semi-annual basis. nc Samples were not analyzed by the North Carolina State Public Health Laboratory for various and unforeseen reasons. 5-16
109 GE Waste Water Waste Water - Alpha, Beta, Radium, and Isotopic Uranium (pci/l) NCRPS Indicator (GE-WW-02) a All measurements in pci/l Date Isotope Meas. Error Meas. Error 1/30/09 Alpha Beta Ra-226 U-234 U U-238 2/17/09 Alpha Beta Ra-226 U-234 U U-238 3/10/09 Alpha Beta Ra-226 U-234 U U-238 4/14/09 Alpha Beta U-234 U U-238 5/12/09 Alpha Beta U /9/09 Alpha Beta U /01/09 Alpha Beta U GE a Sample of effluent is collected monthly at site dam. nc Samples were not analyzed by the North Carolina State Public Health Laboratory for various and unforeseen reasons. 5-17
110 GE Terrestrial Vegetation Terrestrial Vegetation - Gross Alpha, Gross Beta, and Isotopic Uranium, pci/g Indicator (GE-TV-05) a Indicator (GE-TV-06) b NCRPS (pci/g-ash) GE (pci/g-wet) NCRPS (pci/g-ash) GE (pci/g-wet) Date Isotope Meas. Error Meas. Error Meas. Error Meas. Error Alpha nc - nc - Beta nc - nc - a GE-TV-05 is located at Tinga Farm and is collected semi-annually. b GE-TV-06 is located near St. Stanislaus Church on Marathon Avenue. Samples are collected semi-annually. 5-18
111 GE - Soil Soil - Alpha, Beta, and Isotopic Uranium, (pci/gm-dry) Indicator (GE-SS-05) a All measurements in pci/g (GE-SS-06) b All measurements in pci/g NCRPS GE NCRPS GE Date Isotope Meas. Error Meas. Error Meas. Error Meas. Error a GE-SS-05 is located at Tinga Farm. Samples are collected semi-annually. b GE-SS-06 is located at Saint Stanislaus Catholic Church on Marathon Avenue. 5-19
112 GE - Sediment Sediment - Gross Alpha, Gross Beta, and Isotopic Uranium (pci/g-dry) Indicator (GE-SD-02D) a All measurements in pci/g Indicator (GE-SD-03) b All measurements in pci/g NCRPS GE NCRPS GE Date Isotope Meas. Error Meas. Error Meas. Error Meas. Error 6/09/09 Alpha nc - < Beta nc Alpha Beta 9/01/09 Alpha nc Beta nc Sediment - Gross Alpha, Gross Beta, and Isotopic Uranium (pci/g-dry) Control - Upstream (GE-SD-04) c All measurements in pci/g NCRPS GE Date Isotope Meas. Error Meas. Error Alpha Beta Alpha Beta nc nc nc nc a GE-SD-02D is collected below the process lagoon discharge pipe outfall near the dam site. Sampling done on an annual basis. b GE-SD-03 is located at the site dock. c GE-SD-04 is located at the Castle Hayne Boat Landing. nc Samples were not analyzed by the North Carolina State Public Health Laboratory for various and unforeseen reasons. 5-20
113 GE - TLD TLD, mr/year Loc # Location All readings in mr/year. 1 st Qtr a 2 nd Qtr 3 rd Qtr 4 th Qtr Meas Error Meas Error Meas Error Meas Error 1 Lagoon Site Dam Site Dock Public Dock Tinga Farm Quarterly Average, All Sites Yearly Average, All Sites 39.3 a Due to travel restrictions 2009, TLD s were placed at GE-GNF for only the first quarter. 5-21
114 NORTH CAROLINA ENVIRONMENTAL SURVEILLANCE NETWORK
115 Statewide - Summary NORTH CAROLINA ENVIRONMENTAL RADIATION SURVEILLANCE NETWORK In the interest of public health, the North Carolina Radiation Protection Section (NCRPS) monitors ambient radiological levels in the environment statewide. This monitoring is accomplished via a statewide network of sampling sites. The 2009 results associated with each sample medium are discussed below. Air Particulate Statewide air particulate is collected monthly from four separate locations using a 24-hour grab sample procedure. This involves using a high volume air sampler with an 8 inch X 10 inch glass fiber filter. The average gross beta concentration measured in 27 air particulate samples collected from four different locations during the year was 2.30 x 10⁻³ picocuries per cubic meter (pci/m 3 ). The airborne concentrations of gross beta activity for the year are indicative of natural background and do not indicate any abnormal activities. Milk Milk is sampled monthly from seven different locations statewide. These samples are analyzed for gamma emitting radionuclides. Average concentrations of Potassium-40 (K-40) measured in 81 samples for 2009 was 1, picocuries per liter (pci/l), which is indicative of background levels. No analyzed samples contained measurements above investigation levels. Precipitation Statewide precipitation is collected monthly, depending on the amount of rainfall, from three different sites using a composite sampling procedure. The average gross beta concentrations measured in 21 samples collected in 2009 was 0.95 nanocuries per square meter (nci/m 2). Background levels for gross beta in precipitation have not been established. Sewage Treated sewage effluent water is sampled monthly from three different locations. In 2009, 34 samples were analyzed. Gross alpha, beta and gamma analyses are performed on the samples. The average concentrations were 0.95 pci/l for gross alpha and pci/l for gross beta. The alpha and beta concentrations were indicative of background radiation levels. The average gamma concentrations were 68.1 pci/l for Iodine-131 (I-131) and pci/l for Potassium 40 (K-40). The I-131 concentration was above the background level due to two elevated measurements of 437 and 238 pci/l at the Mecklenburg County site in May and September respectively. These two measurements were above the investigation level but below the 6-2
116 Statewide - Summary regulatory limit for I-131 in sewage effluent, and subsequent analyses did not show any ongoing elevated measurements. Surface Finished Water Statewide finished water is collected monthly from nine locations. Gross alpha and gross beta analyses are routinely performed on samples. The average gross alpha and beta concentrations measured in 16 samples analyzed in 2009 were 0.11 pci/l and 2.79 pci/l respectively. These concentrations were indicative of background radiation levels. Surface Raw Water Raw surface water is sampled monthly from seven locations. Routinely, gross alpha and beta analyses are performed on surface water samples. The average gross alpha and beta concentrations measured in 13 samples analyzed in 2009 were 0.29 pci/l and 3.08 pci/l respectively. Average gross alpha and beta activity levels are below the average background levels for the state. Shellfish Oysters are collected four times per year routinely. The average concentration for Potassium-40 was 1.7 pci per gram (pci/g), which is slightly above the average background concentration and well below the investigation limit for fish life in the state. Note: Blanks in the tabulated data below indicate the data was not available. 6-3
117 Statewide - Air Particulate Air Particulate Gross Beta, (pci/m 3 ) Burke Co (12-AP-50) Currituck Co. (27-AP-20) Stanly Co. (84-AP-10) Wake Co. (92-AP-60) All measurements x 10-2 All measurements x 10-2 All measurements x 10-2 All measurements x 10-2 pci/m 3 pci/m 3 pci/m 3 pci/m 3 Date Meas. Error Meas. Error Meas. Error Meas. Error January C February C C March April C May C June A C July A C August A A C September A C October C November A C December A B C A Sampler Malfunction B Analysis by Lab Incomplete C No Sample Received 6-4
118 Statewide - Milk Statewide Milk - Gamma Isotopic, pci/l Buncombe Co. (11-MS-10)) All measurements in pci/l Craven Co. (25-MS-50) All measurements in pci/l Davidson Co. (29-MS-40) All measurements in pci/l Macon Co. (57-MS-60) All measurements in pci/l Date Isotope Meas. Error Meas. Error Meas. Error Meas. January K February K March K April K May K June K C July K C August K September K October K November K December K B Statewide Milk - Gamma Isotopic, pci/l Orange Co. (68-MS-40) All measurements in pci/l Sampson Co. (82-MS- 70) All measurements in pci/l Wake Co. (92-MS-60) All measurements in pci/l Date Isotope Meas. Error Meas. Error Meas. Error January K-40 C February K March K April K May K June K July K August K September K Ra October K November K December K A Sampler Malfunction B Analysis by Lab Incomplete C No Sample Received 6-5
119 Statewide - Precipitation Precipitation Gross Beta, pci/m 2 New Hanover Co. (65-PP-80) Wake Co. (92-PP-60) Mecklenburg Co. (60-PP-20) All measurements in nci/m 2 All measurements in nci/m 2 All measurements in nci/m 2 Date Meas. Error Meas. Error Meas. Error January C February C C March C April C May June C July August C B C September October C C November C B December C B A Sampler Malfunction B Analysis by Lab Incomplete C No Sample Received 6-6
120 Statewide Sewage Effluent Sewage Effluent, pci/l Durham Co. (32-SE-20) All measurements in pci/l Mecklenburg Co. (60-SE-20) All measurements in pc/l Wake Co. (92-SE-60) All measurements in pci/l Date Isotope Meas. Error Meas. Error Meas. Error January Alpha Beta I February Alpha Beta I K March Alpha Beta I K April Alpha Alpha Beta Beta I-131 I K-40 K May Alpha Alpha Beta Beta I-131 I K-40 K June July Alpha Beta B I K August Alpha Beta I September Alpha Beta I October Alpha Beta I November Alpha Beta B I December Alpha Beta I ` A Sampler Malfunction B Analysis by Lab Incomplete C No Sample Received 6-7
121 Statewide - Finished Water Finished Water Gross Alpha and Beta, pci/l Buncombe Co. (11-FW-10) Forsyth Co. (34-FW-80) Halifax Co. (42-FW-60) Harnett Co. (43-FW-50) All measurements in pci/l All measurements in pci/l All measurements in pci/l All measurements in pci/l Date Isotope Meas. Error Meas. Error Meas. Error Meas. Error January Alpha C Beta February Alpha C Beta March Alpha Beta B C B B April Alpha Beta B C C B May Alpha Beta B C B B June Alpha Beta B C B B July Alpha Beta B C B B August Alpha Beta B C B B September Alpha Beta B C B B October Alpha Beta B C B B November Alpha B C B B Beta December Alpha Beta B C B B A Sampler Malfunction B Analysis by Lab Incomplete C No Sample Received 6-8
122 Statewide Finished Water Finished Water Gross Alpha And Beta, pci/l Johnston Co. (51-FW-70) All measurements in pci/l Mecklenburg Co. (60-FW-20) All measurements in pci/l New Hanover Co. (65-FW-80) All measurements in pci/l Pitt Co. (74-FW-30) All measurements in pci/l Date Isotope Meas. Error Meas. Error Meas. Error Meas. Error January Alpha C Beta February Alpha C Beta March Alpha Beta C B B April Alpha Beta B C B B May Alpha Beta B C B B June Alpha Beta B C B B July Alpha Beta B C B B August Alpha Beta B C B B September Alpha Beta B C B B October Alpha Beta B C B B November Alpha Beta B C B B December Alpha Beta B C B B A Sampler Malfunction B Analysis by Lab Incomplete C No Sample Received 6-9
123 Statewide Finished Water Finished Water Gross Alpha And Beta, pci/l Wake Co. (92-FW-60) All measurements in pci/l Date Isotope Meas. Error January Alpha Beta February Alpha Beta March Alpha Beta April Alpha Beta B May Alpha Beta B June Alpha Beta B July Alpha Beta B August Alpha Beta B September Alpha Beta B October Alpha Beta B November Alpha Beta B December Alpha Beta B A Sampler Malfunction B Analysis by Lab Incomplete C No Sample Received 6-10
124 Statewide Surface Water Surface Water Gross Alpha And Beta, pci/l Forsyth Co. (34-SW-80) All measurements in pci/l Harnett Co. (43-SW-50) All measurements in pci/l Johnston Co. (51-SW-70) All measurements in pci/l Montgomery Co. (62-SW-50) All measurements in pci/l Date Isotope Meas. Error Meas. Error Meas. Error Meas. Error January February March April May June July August September October November December Alpha C B Beta Alpha C B Beta Alpha C B Beta B Alpha C Beta B B Alpha Beta C B B B Alpha Beta C B B B Alpha Beta C B B B Alpha Beta C B B B Alpha Beta C B B C Alpha Beta C B B B Alpha Beta C B B B Alpha Beta C B B B A Sampler Malfunction B Analysis by Lab Incomplete C No Sample Received 6-11
125 Statewide Surface Water Surface Water Gross Alpha And Beta, pci/l New Hanover Co. (65-SW-80) All measurements in pci/l Pitt Co. (74-SW-30) All measurements in pci/l Wake Co. (92-SW-60) All measurements in pci/l Date Isotope Meas. Error Meas. Error Meas. Error January Alpha Beta February Alpha Beta March Alpha B B Beta April Alpha Beta B B B May Alpha Beta B B B June Alpha Beta B B B July Alpha Beta B B B August Alpha Beta B B B September Alpha Beta B B B October Alpha Beta B B B November Alpha Beta B B B December Alpha Beta B B B A Sampler Malfunction B Analysis by Lab Incomplete C No Sample Received 6-12
126 Statewide Shellfish Statewide Shellfish - Gross Alpha, Gross Beta and Gamma, pci/g-wet Carteret Co. Morehead City (16-SL-50) All measurements in pci/g Date Isotope Meas. Error Feb K June K August C September C A Sampler Malfunction B Analysis by Lab Incomplete C No Sample Received 6-13
127 CATAWBA NUCLEAR STATION
128 Catawba - Summary CATAWBA NUCLEAR STATION LAKE WYLIE, SOUTH CAROLINA Duke Power Company (Duke), a subsidiary of Duke Energy Corporation (DEC), operates the Catawba Nuclear Station (CNS) located one mile from the North Carolina border and about 19 miles southwest of Charlotte on Lake Wylie. The plant consists of two pressurized water reactors with a net design rating of 1129, megawatts-electrical each. Commercial power production was initiated by Unit 1 on June 29, 1985, and Unit 2 on Aug. 19, NCRPS conducts a limited air particulate and thermoluminescent dosimeter (TLD) monitoring program of CNS for the region of North Carolina in close proximity (less than 10 miles from CNS) to the plant. NCRPS collects and analyzes low volume air particulate samples from two locations on a weekly basis and TLD s from five locations on a quarterly basis for Catawba. None of these locations are co-located with Duke sampling sites. For 2009, all gross beta results for NCRPS air samples were below the NCRPS investigation level of 0.5 pci/m 3, and no appreciable upward trend was noted when compared with results from years past. For 2009, the average gross beta activity was 1.83 E-2 pci/m 3 at location CT- APLV-01 and 1.88 E-2 pci/m 3 at location CT-APLV-09. Composite gamma analyses of Catawba air particulate samples were not performed in 2009 by the State Radiochemistry Laboratory. Thermoluminescent dosimetry results for 2009 produced a yearly average exposure of 67.0 milliroentgens (mr) for all sites. This is less than the statewide average of 75 mr/year. Due to travel restrictions in 2009, TLD s were placed at Catawba for only the first quarter of the year. This travel restriction prevented NCRPS staff from placing or retrieving TLD s for the second through fourth quarters of To reduce the possibility of a recurrence of this environmental monitoring gap, NCRPS has implemented a new ambient gamma monitoring regime. The new ambient monitoring regime will replace TLDs dosimeters with optically stimulated luminescent dosimeters, which will be placed/retrieved on an annual basis starting in
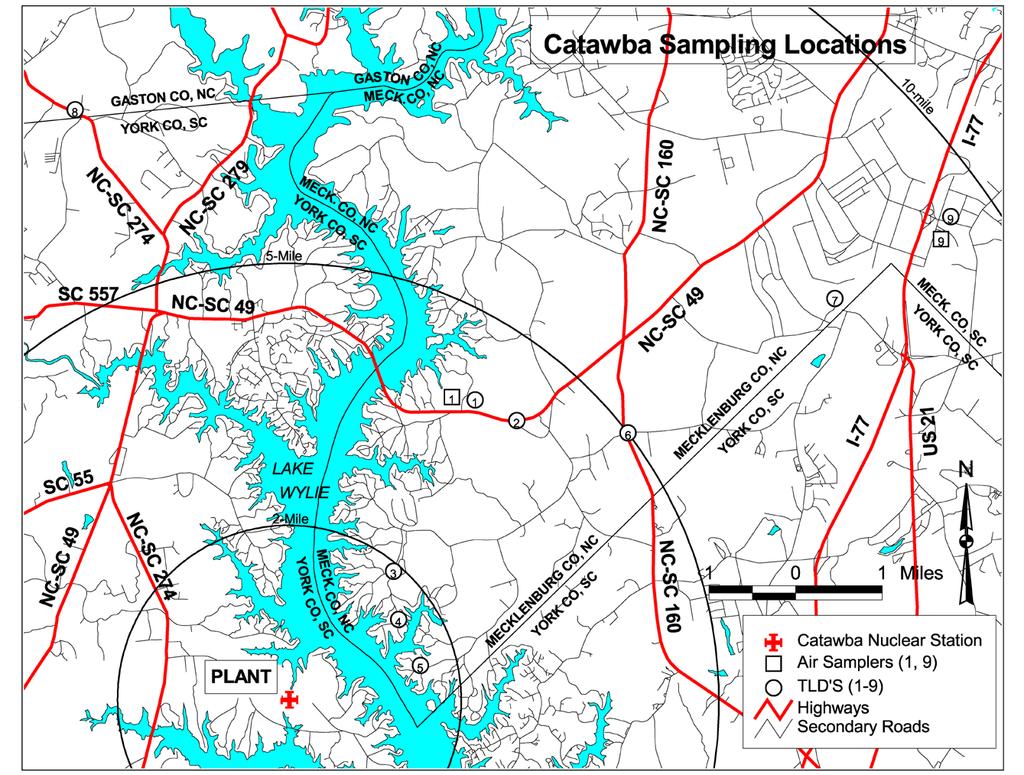
129
130 Catawba - Air Particulate Section 8: Catawba Nuclear Station, Lake Wylie, South Carolina Air Particulate - Gross Beta, (pci/m 3 ) CT-APLV-01 a CT-APLV-09 b All measurements x 10-2 pci/m 3 All measurements x 10-2 pci/m 3 RPS RPS Date Meas. Error Meas. Error 1/8/ /14/ /21/ /26/ /5/ /13/ /23/ /3/ /9/ /18/ /27/ /8/ /14/ /20/ /27/ /7/ /14/ /21/ /1/ /9/ /17/ /25/ /7/ /14/ /22/ /31/ /6/ /18/ /24/ /1/ /11/ /23/ /5/ /15/ /28/ /6/ /17/ /24/ /8/ /17/ /30/ Average % Diff. 3.12% a Sampling at NCRPS Site CT-APLV-01 located at McDowell Park approximately 4.2 mi. north-northeast of the plant. b Sampling at NCRPS Site CT-APLV-09 located at Westinghouse Blvd and I-77 approximately 9.5 mi. northeast of the plant. 7-4
131 CATAWBA AIR PARTICULATE NCRPS Gross Beta Activity (pci/m^3) WEEKS CT-APLV-01 CT-APLV-09
132 Catawba - TLD TLD All readings in mr/year. Loc # Location 1 st Qtr a 2 nd Qtr 3 rd Qtr 4 th Qtr Meas Error Meas Error Meas Error Meas Error 1 McDowell Park NC 49 and Pleasant Hill Road Hamilton Road and Steele Creek Road Carowinds Boulevard Westinghouse Boulevard and Interstate Average, All Sites Yearly Average, All Sites 67.7 a Due to travel restrictions in 2009, TLDs were placed at Catawba for only the first quarter. 7-6
133 PCS PHOSPHATE
134 PCS Phosphate - Summar y PCS PHOSPHATE AURORA, BEAUFORT COUNTY It has long been recognized that mining operations can redistribute natural radionuclides found in ore bodies. In the case of phosphate ore, this process can bring uranium and radium into contact with man and his environment. For this reason, the North Carolina Radiation Protection Section conducts a monitoring program around the Potash Corporation of Saskatchewan Phosphate (PCS Phosphate) mining facility near Aurora, in Beaufort County. In 1995, PCS purchased the Aurora phosphate operations. This was part of the purchase of Texasgulf; a Texas-based sulfur-mining company which had operated the site up to that point. This purchase included land previously owned by the North Carolina Phosphate Corporation. The PCS Phosphate site is located in Beaufort County near Aurora, North Carolina. Operations include the phosphate mine, up-grading facilities, and several fertilizing materials plants. Mining of phosphate ore is accomplished by removing approximately 40 feet of overburden using bucket wheel excavators. The ore is then removed from the mine area by dredge or dragline. To keep the mine area dewatered, ground water is continuously withdrawn from the Castle Hayne aquifer. This water is then used in the phosphoric acid plant and plant cooling systems. The milling process begins by transporting a slurry of sandy ore and water to the mill by use of a conveyor belt. The material is then washed and screened. Quartz sand is separated from the phosphate rich material by means of floatation, and the phosphate materials are then dried or calcined. Calcined phosphate rock can be shipped to customers as is, or it can be processed further onsite. Fertilizer is made by reacting phosphate rock with sulfuric acid, forming a weak phosphoric acid with gypsum as a by-product. The weak phosphoric acid is further processed to make different grades of phosphoric acid for sale to industry and agriculture sectors. Other products such as ammonium polyphosphate solution, and dry phosphate rock and diammonium phosphate are made from the ore material after processing. Some of the gypsum can be used for agricultural purposes by peanut farmers. Products are shipped from the site by truck, rail, and barge for distribution. A comprehensive special study of radioactivity in the environment was done around the site and on land owned by the NCPC in Periodic monitoring has still been maintained since then. In 2009, four air samples were collected at the site. None of these samples showed activity above the investigation levels. In 2009, the environmental monitoring program at PCS Phosphate was placed on hiatus due to staff reductions and budgetary concerns. In the face of these staffing and funding issues, RPS management made the decision to concentrate future monitoring efforts on fixed nuclear 8-2
135 PCS Phosphate - Summar y facilities. It is hoped that if funding and staffing return to pre-2009 levels, monitoring at PCS Phosphate can resume in the future. 8-3
136 PCS Phosphate - Data Air Particulate - Gross Alpha, Gross Beta, and Cesium-137, pci/m 3 TG-APLV-01 a Alpha (pci/m 3 ) Beta (pci/m 3 ) Date Meas. Error Meas. Error 1/23/ E E E E-04 2/6/ E E E E / E E E E-04 4/3/ E E E E-04 a No samples were collected after April 3, The PCS Phosphate monitoring program was frozen in 2009 due budgetary restraints. Please see summary for further details. 8-4
137 B-52 CRASH SITE FARO, NC
138 B-52 - Summary B-52 CRASH SITE FARO, WAYNE COUNTY On January 24, 1961, a U.S. Air Force B-52 aircraft carrying two nuclear weapons crashed near Faro, North Carolina. The weapons were never detonated, according to information supplied by the U.S. Department of Defense. One piece of radioactive uranium from one of the weapons penetrated to a depth greater than 50 feet in the swamp area and was never recovered. For the purpose of finding possible radioactive contamination in groundwater supplies near the site, an extensive study of groundwater around the crash site was implemented on November 8, 1983, by NCRPS with the assistance of the Wayne County Health Department. Follow up sampling has been performed at an annual frequency overall since then. To this point, there has been no detection of any nuclides other than those expected from natural sources in the environment. On March 11, 2009, four groundwater and one surface water samples were collected from locations near the crash site. Residential wells sampled were chosen based on whether the owners were at home when sampling personnel arrived and whether the owner was using groundwater. All owners were very cooperative in providing samples from their wells. In some cases, groundwater wells used for watering livestock were used even if the homeowner used county water for drinking. All samples were analyzed for radioactivity at the N.C. State Laboratory of Public Health using established radioanalytical procedures. The samples were analyzed for alpha and beta activity. There is no indication of the presence of elevated levels of radioactivity, such as from the disintegration of nuclear weapons components in these samples. On the contrary, these levels are fully consistent with naturally occurring radioactivity in groundwater samples. The results of the groundwater sampling done to this point indicate that there is no evidence of contamination at this time. In 2009, the environmental monitoring program at the Faro Site was placed on hiatus due to NCRPS staff reductions and budgetary concerns. It is hoped that if funding and staffing return to pre-2009 levels, monitoring at the Faro Site can resume in the future. 9-2
139 B-52 - Data Section 7: B-52 Crash Site, Faro, North Carolina Groundwater - Gross Alpha, Gross Beta, and Total Uranium, pci/l Alpha (pci/l) Beta (pci/l) Date Site Meas. Error Meas. Error 3/11/09 B52-SW-Nahunta 2.82E E E E+00 3/11/09 B52-GW-Hog Farm 7.60E E E E-01 3/11/09 B52-GW-2B 1.02E E E E-01 3/11/09 B52-GW E E E E-01 3/11/09 B52-GW E E E E
140 APPENDICES
141 Appendix A APPENDIX A NCRPS Regulatory Limit, Alert Level, Background Levels and Estimated Lower Limits of Detection (LLD) Environmental Medium (Units) (Sample Size) Type of Analysis Regulatory Limit a Investigation Level Average NC Background Level Lower Level of Detection LLD (counting time in minutes) b Air (pci/m 3 ) (700m 3 ) Gross Alpha Gross Beta Mn-54 Co-58 Co-60 Fe-59 Zn-65 Nb-95 Zr-95 I-131 Cs-134 Cs-137 Ba-140 La-140 Total U c d (100) (100) (420) 0.002(420) (420) (420) (420) (420) (420) (420) (420) (420) (420) (420) 1 µg/l(icp-ms) Air Cartridge I (420) Finished or Groundwater (pci/l) (3.5 liters) Gross Alpha Gross Beta Tritium Total U Ra-226 Ra e,f 50 e,f 2x10 4 e 2x e,f,g 5 e,f,g x ? < h 1.5 h 0.058(100) 0.112(100) 250(300) 1uG/L(ICP-MS) i i Raw Surface Water (pci/l) (3.5 liters) Gross Alpha Gross Beta Tritium Mn-54 Co-58 Co-60 Fe-59 Zn-65 Nb-95 Zr-95 I-131 j Cs-134 Cs-137 Ba-140 La-140 Total U 30, 15 f 100 k, 50 f 2x10 4e 3x10 4 2x10 4 3x10 3 1x10 4 5x10 3 3x10 4 2x10 4 1x10 3 9x10 2 1x10 3 8x10 3 9x10 3 3x x < (100) 0.112(100) 250 (300) 2.12(420) 2.14(420) 2.47 (420) 4.12 (420) 5.10 (420) 1.94 (420) 3.94 (420) 2.18 (420) 2.01 (420) 2.24 (420) 7.40 (420) 3.81 (420) 1 µg/l(icp-ms) Sewage Treatment Effluent (pci/l) (3.5 liters) Gross Alpha Gross Beta I f 100 j 50 f 1x10 4 l (100) 0.112(100) 2.18 (420) Precipitation (nci/m 2 ) (0.5m 2 ) Gross Beta (100) A-2
142 Appendix A Environmental Medium (Units) (Sample Size) Type of Analysis Regulatory Limit a Investigation Level Average NC Background Level Lower Level of Detection LLD (counting time in minutes) b Milk (pci/l) (3.5 liters) I-131 Cs-137 Ba-140 K m 2x10 4 k 1x10 4 n x x (420) 2.24(420) 7.40 (420) 35.8(420) Soil (pci/g-dry) (600 g) Gross Alpha Gross Beta Cs-137 Co-60 Ra-226 Total U o < 24 < 20 < 1.5 < (100) (100) 0.012(420) 0.013(420) i 1 µg/l(icp-ms) Bottom Sediment (pci/g-dry) (600 g) Gross Alpha Gross Beta Co-60 Total U (100) (100) 0.013(420) 1µg/L(ICP-MS) Fish Life (pci/g-wet) (1 kg) (5% ash conversion) Gross Alpha Gross Beta Cs-137 Ra-226 K < < (100) wet (100) wet 0.008(420)wet i 0.208(420) Vegetation (pci/g-wet) (170 g) (2% ash conversion) Gross Alpha Gross Beta Cs-137 Ra-226 Total U < (100) wet (100) wet 0.044(420)wet i 1 µg/l(icp-ms) TLD (mr/yr) (3 month sample) Ambient Gamma NOTE: All MDA derived from listed count interval. Samples counted for 420 minutes are standard for environmental program. a All regulatory limits are based on North Carolina Regulations for Protection Against Radiation except for those with other notes. b LLD's listed are based on the normal measurement conditions used by the State Laboratory of Public Health and defined as 4.66 KSb, with K as the proportional constant and S b as the standard deviation of the background. Actual LLD's may vary for special analyses. Gamma-emitter LLD's are based upon High Purity Germanium spectroscopy. Decay has not been accounted for in the estimation of these values. All errors are given at the 1 sigma interval. c Assuming that it is known that alpha-emitters and Ac-227 are not present. d D Class - this value is for uranium assumed to clear the lungs within one day and is the most restrictive value for this material based on Appendices A, B and C of 10 CFR 20 as incorporated into the North Carolina Regulations for Protection Against Radiation (15 NCAC 11).e) based on Environmental Protection agency Interim Drinking Water Standards. e Based on Environmental Protection agency Interim Drinking Water Standards. f Based on North Carolina Administrative Code TITLE 15, 2B.0211, Department of Environment, Health and Natural Resources. g Combined Ra-226 and Ra-228. h Average of gross alpha samples exceeding 5 pci/l. i Ra-226 and 228 analyses were discontinued in 2008 as part of budgetary and administrative changes at State Laboratory of Public Health. Both analyses are expected to be resumed in calendar year j Sample was prepared using radiochemical method. k Assuming that it is known that Ra-226 and Ra-228 are not present. A-3
143 Appendix A l Based on monthly average applies only to sewage effluent. m Based on Federal Radiation Council Radiation Protection Guide, top of Range I and an assumed intake of 1 liter/day. n FRC recommended dose from daily intake (below 0.17 rem/yr). o Based on EPA advanced notice of proposed rule making (43 F.R.59022) under the Resource Conservation and recovery Act (RCRA), December A-4
144 Appendix A A PRIORI LOWER LIMITS OF DETECTABILITY (LLD) FOR Ge GAMMA SPECTROMETRY SYSTEMS BRUNSWICK STEAM ELECTRIC PLANT *I-131 determined by radiochemical analysis. Lowest Level of Detection is less than 0.5 pci/unit. Typical Values of LLD for Brunswick Nuclear Plant Taken from 2008 Radiological Environmental Operating Report. A-5

145 Appendix A A PRIORI LOWER LIMITS OF DETECTABILITY (LLD) FOR Ge GAMMA SPECTROMETRY SYSTEMS SHEARON HARRIS NUCLEAR POWER PLANT Taken from 2008 Radiological Environmental Operating Report *I-131 determined by radiochemical analysis. LLD is less than 0.5 pci/unit. A-6
SHEARON HARRIS NUCLEAR PLANT
 SHEARON HARRIS NUCLEAR PLANT Harris - Summary SHEARON HARRIS NUCLEAR PLANT NEW HILL, WAKE/CHATHAM COUNTY Progress Energy operates the Shearon Harris Nuclear Plant, located about 16 miles southeast of Raleigh,
ZION NUCLEAR POWER STATION UNITS 1 and 2
 NRC Docket No: 50-295 50-304 ZION NUCLEAR POWER STATION UNITS 1 and 2 Annual Radiological Environmental Operating Report 1 January Through 31 December 2010 Prepared By Teledyne Brown Engineering Environmental
Impact of Weather House Design on REMP Air Sampler Results. Heather Baxter, Senior Scientist, Duke Energy
 Impact of Weather House Design on REMP Air Sampler Results Heather Baxter, Senior Scientist, Duke Energy Air Sampling Stations Originally, Harris Nuclear Plant had 6 air particulate/air iodine monitoring
Background Tritium in Environmental Water Samples. Paul Snead NCHPS Fall Meeting November 2, 2006
 Background Tritium in Environmental Water Samples Paul Snead NCHPS Fall Meeting November 2, 2006 Tritium Basics Tritium ( 3 H) is a radioactive isotope of hydrogen Nucleus has one proton and two neutrons
Regulatory Guide Exposure Pathways, Equations, and Input Requirements
 Regulatory Guide 1.109 Exposure Pathways, Equations, and Input Requirements Ken Sejkora Entergy Nuclear Northeast Pilgrim Station Presented at the 23rd Annual RETS-REMP Workshop Training Session Westminster,
SOUTHERN NUCLEAR COMPANY VOGTLE ELECTRIC GENERATING PLANT UNITS 1 AND 2 NRC DOCKET NOS AND
 SOUTHERN NUCLEAR COMPANY VOGTLE ELECTRIC GENERATING PLANT UNITS 1 AND 2 NRC DOCKET NOS. 50-424 AND 50-425 FACILITY OPERATING LICENSE NOS. NPF-68 AND NPF-81 ANNUAL RADIOACTIVE EFFLUENT RELEASE REPORT FOR
CN9. ^ NewYorkPower 4 Authority CONSOLIDATED EDISON COMPANY OF NEW YORK, INC. INDIAN POINT STATION BROADWAY & BLEAKLEY AVENUES BUCHANAN, NY 10511
 Indian Point 3 Nuclear Power Plant P.O. Box 215 Buchanan, New York 10511 914 736.8000 CONSOLIDATED EDISON COMPANY OF NEW YORK, INC. INDIAN POINT STATION BROADWAY & BLEAKLEY AVENUES BUCHANAN, NY 10511 ^
BRUNSWICK COUNTY. North Carolina State Highway Patrol Coastal Evacuation Plan 1
 North Carolina State Highway Patrol Coastal Evacuation Plan 1 Contact Information for Emergency Management Director and EOC Contact Address Telephone Number Brian Watts Building C 3325 Old Ocean Hwy. Bolivia,
Illinois Drought Update, December 1, 2005 DROUGHT RESPONSE TASK FORCE Illinois State Water Survey, Department of Natural Resources
 Illinois Drought Update, December 1, 2005 DROUGHT RESPONSE TASK FORCE Illinois State Water Survey, Department of Natural Resources For more drought information please go to http://www.sws.uiuc.edu/. SUMMARY.
Understanding Radiation
 APPENDIX B Understanding Radiation This section introduces the general reader to some basic concepts of radioactivity and an understanding of the radiation emitted as radioactive materials decay to a stable
Risø-R-Report. DTU Nutech Report. Radioactivity in the Risø District January-June 2014
 Risø-R-Report DTU Nutech Report Radioactivity in the Risø District January-June 2014 Sven P. Nielsen, Kasper G. Andersson and Arne Miller DTU-Nutech-9(EN) December 2014 Author: Sven P. Nielsen, Kasper
Former Guterl Specialty Steel Site
 Former Guterl Specialty Steel Site Environmental Monitoring Report 2013-2014 U. S. ARMY CORPS OF ENGINEERS BUILDING STRONG Buffalo District Formerly Utilized Sites Remedial Action Program May 2015 Site
IAEA-TECDOC Clearance
 IAEA-TECDOC-1000 Clearance The IAEA does The originating Section of this publication in the IAEA was: Waste Safety Section International Atomic Energy Agency Wagramerstrasse FOREWORD It has long been recognized
Radioactivity in the Risø District January-June Risø-R-Report. DTU Nutech Report
 Radioactivity in the Risø District January-June 2012 Risø-R-Report DTU Nutech Report Sven P. Nielsen, Kasper G. Andersson and Arne Miller DTU-Nutech-R-0003(EN) December 2012 Author: Sven P. Nielsen, Kasper
Analysis of gross alpha, gross beta activities and beryllium-7 concentrations in surface air: their variation and statistical prediction model
 Iran. J. Radiat. Res., 2006; 4 (3): 155-159 Analysis of gross alpha, gross beta activities and beryllium-7 concentrations in surface air: their variation and statistical prediction model F.Arkian 1*, M.
Jason T. Harris, Ph.D. Department of Nuclear Engineering and Health Physics
 Jason T. Harris, Ph.D. Department of Nuclear Engineering and Health Physics Idaho State University North American Technical Center July 24, 2012 1 2 Commercial Nuclear Power Plants (NPPs) produce gaseous,
STUDIES ON THE AEROSOL RADIOACTIVITY LEVEL AND AIR QUALITY AROUND NUCLEAR RESEARCH INSTITUTE AREA
 STUDIES ON THE AEROSOL RADIOACTIVITY LEVEL AND AIR QUALITY AROUND NUCLEAR RESEARCH INSTITUTE AREA A. STOCHIOIU 1, F. MIHAI 1, C. STOCHIOIU 2 1 Horia Hulubei National Institute for Physics and Nuclear Engineering,
THE NEED FOR AN ADDITIONAL SPILLWAY AT THE SANFORD DAM BOILING SPRING LAKES, NC. Presentation for The Brunswick County Commissioners April 20, 2015
 THE NEED FOR AN ADDITIONAL SPILLWAY AT THE SANFORD DAM BOILING SPRING LAKES, NC Presentation for The Brunswick County Commissioners April 20, 2015 The Sanford Dam Earth Dam constructed in 1961 Drainage
The Climate of Payne County
 The Climate of Payne County Payne County is part of the Central Great Plains in the west, encompassing some of the best agricultural land in Oklahoma. Payne County is also part of the Crosstimbers in the
Radioactivity in the Risø District January-June 2014
 Downloaded from orbit.dtu.dk on: Dec 20, 2017 Radioactivity in the Risø District January-June 2014 Nielsen, Sven Poul; Andersson, Kasper Grann; Miller, Arne Publication date: 2014 Document Version Publisher's
The Climate of Marshall County
 The Climate of Marshall County Marshall County is part of the Crosstimbers. This region is a transition region from the Central Great Plains to the more irregular terrain of southeastern Oklahoma. Average
RADIATION PROTECTION
 DEPARTMENT OF NUCLEAR TECHNOLOGY, FACULTY OF ENGINEERING CHULALONGKORN UNIVERSITY PHAYATHAI ROAD, BANGKOK 10330, THAILAND TEL: (662) 218-6772, (662) 218-6784. FAX: (662) 218-6770 E-mail: fnegbr@eng.chula.ac.th
The Climate of Kiowa County
 The Climate of Kiowa County Kiowa County is part of the Central Great Plains, encompassing some of the best agricultural land in Oklahoma. Average annual precipitation ranges from about 24 inches in northwestern
The Climate of Murray County
 The Climate of Murray County Murray County is part of the Crosstimbers. This region is a transition between prairies and the mountains of southeastern Oklahoma. Average annual precipitation ranges from
The Climate of Texas County
 The Climate of Texas County Texas County is part of the Western High Plains in the north and west and the Southwestern Tablelands in the east. The Western High Plains are characterized by abundant cropland
Radioactivity in the Risø District July-December 2013
 Downloaded from orbit.dtu.dk on: Jan 02, 2019 Radioactivity in the Risø District July-December 2013 Nielsen, Sven Poul; Andersson, Kasper Grann; Miller, Arne Publication date: 2014 Document Version Publisher's
A Brief Overview of Radiation and Analytical Water Testing for Radiological Contaminants.
 A Brief Overview of Radiation and Analytical Water Testing for Radiological Contaminants. James Henitz Radioanalytical Services NJ Water Monitoring Council: January 24, 2018 Overview of Presentation What
Residual activity (contamination) Radiation exposure levels
 Radiation exposure levels") Field Survey Techniques to be Used for the PRR-1 Kristine Marie Romallosa Radiation Protection Services PHILIPPINE NUCLEAR RESEARCH INSTITUTE Why field survey? To identify location measure and give extent
Field Survey Techniques to be Used for the PRR-1 Kristine Marie Romallosa Radiation Protection Services PHILIPPINE NUCLEAR RESEARCH INSTITUTE Why field survey? To identify location measure and give extent
11. Radioactive Waste Management AP1000 Design Control Document
 CHAPTER 11 RADIOACTIVE WASTE MANAGEMENT 11.1 Source Terms This section addresses the sources of radioactivity that are treated by the liquid and gaseous radwaste systems. Radioactive materials are generated
The Climate of Seminole County
 The Climate of Seminole County Seminole County is part of the Crosstimbers. This region is a transition region from the Central Great Plains to the more irregular terrain of southeastern Oklahoma. Average
Determination of natural radionuclides 40K, eu and eth in environmental samples from the vicinity of Aramar Experimental Center, Brazil
 Determination of natural radionuclides 40K, eu and eth in environmental samples from the vicinity of Aramar Experimental Center, Brazil André Luis Lima de Araújo Marco Antônio Proença de Moraes Bruno Robles
The Climate of Haskell County
 The Climate of Haskell County Haskell County is part of the Hardwood Forest. The Hardwood Forest is characterized by its irregular landscape and the largest lake in Oklahoma, Lake Eufaula. Average annual
Six decades of environmental radioactivity measurements. Sven P. Nielsen
 Six decades of environmental radioactivity measurements Sven P. Nielsen Research Establishment Risø Established by Government in 1950 s to keep Denmark in line with development of nuclear technology including
Determining the Need For External Radiation Monitoring at FUSRAP Projects Using Soil Characterization Data. Todd Davidson
 Determining the Need For External Radiation Monitoring at FUSRAP Projects Using Soil Characterization Data Todd Davidson Introduction According to Regulatory Guide 8.34 Monitoring Criteria and Methods
Radioactive Waste Transportation Notifications
 Texas Emergency Management Conference 2017 Radioactive Waste Transportation Notifications Jason Johnson, WIPP Planner Joshua Bryant, Unit Supervisor Technological Hazards Unit Informational Briefing Radioactive
The Climate of Grady County
 The Climate of Grady County Grady County is part of the Central Great Plains, encompassing some of the best agricultural land in Oklahoma. Average annual precipitation ranges from about 33 inches in northern
UNIT 10 RADIOACTIVITY AND NUCLEAR CHEMISTRY
 UNIT 10 RADIOACTIVITY AND NUCLEAR CHEMISTRY teacher version www.toppr.com Contents (a) Types of Radiation (b) Properties of Radiation (c) Dangers of Radiation (d) Rates of radioactive decay (e) Nuclear
AP1000 European 11. Radioactive Waste Management Design Control Document
 CHAPTER 11 RADIOACTIVE WASTE MANAGEMENT 11.1 Source Terms This section addresses the sources of radioactivity that are treated by the liquid and gaseous radwaste systems. Radioactive materials are generated
RADIATION MONITORING NETWORKS and some results from the reactor accident in Fukushima
 RADIATION MONITORING NETWORKS and some results from the reactor accident in Fukushima Sixth Annual Workshop on Radiation Measurement Cross Calibration Project June 13-15, 2011 Middle East Scientific Institute
The Climate of Bryan County
 The Climate of Bryan County Bryan County is part of the Crosstimbers throughout most of the county. The extreme eastern portions of Bryan County are part of the Cypress Swamp and Forest. Average annual
Aim: What are the two types of Nuclear. Reactions? Do Now: 1. Get into your groups and compare your answers to your homework.
 Aim: What are the two types of Nuclear Reactions? Do Now: 1. Get into your groups and compare your answers to your homework. Nuclear Energy In nuclear reaction, mass is converted into energy; there is
APPENDIX B HYDROLOGY
 APPENDIX B HYDROLOGY TABLE OF CONTENTS 1.0 INTRODUCTION... 1 2.0 PROBABLE MAXIMUM PRECIPITATION (PMP)... 1 3.0 DESIGN FLOW CALCULATION... 1 4.0 DIVERSION CHANNEL SIZING... 2 5.0 REFERENCES... 4 LIST OF
NORM and TENORM: Occurrence, Characterizing, Handling and Disposal
 NORM and TENORM: Occurrence, Characterizing, Handling and Disposal Ionizing Radiation and Hazard Potential John R. Frazier, Ph.D. Certified Health Physicist May 12, 2014 Radiation Radiation is a word that
The Climate of Pontotoc County
 The Climate of Pontotoc County Pontotoc County is part of the Crosstimbers. This region is a transition region from the Central Great Plains to the more irregular terrain of southeast Oklahoma. Average
Science 10 Radioactivity Review v3
 Class: Date: Science 10 Radioactivity Review v3 Modified True/False Indicate whether the statement is true or false. If false, change the identified word or phrase to make the statement true. 1. An atom
c) O-16 d) Pu An unstable nucleus emits. a) Atoms b) Electricity c) Plasma d) Radiation 3. Many of uranium are radioactive. a) Ions b) Isomers
 O-16 d) Pu An unstable nucleus emits. a) Atoms b) Electricity c) Plasma d) Radiation 3. Many of uranium are radioactive. a) Ions b) Isomers") Physical Science Domain 1 Nuclear Decay Review 1. Which nucleus would be MOST likely to be radioactive? a) C-12 b) Ca-40 c) O-16 d) Pu-241 2. An unstable nucleus emits. a) Atoms b) Electricity 3. Many
Physical Science Domain 1 Nuclear Decay Review 1. Which nucleus would be MOST likely to be radioactive? a) C-12 b) Ca-40 c) O-16 d) Pu-241 2. An unstable nucleus emits. a) Atoms b) Electricity 3. Many
It s better to have a half-life than no life! Radioactive Decay Alpha, Beta, and Gamma Decay
 It s better to have a half-life than no life! Radioactive Decay Alpha, Beta, and Gamma Decay What does it mean to be radioactive? Some atoms have nuclei that are unstable. These atoms spontaneously decompose
Local Ctimatotogical Data Summary White Hall, Illinois
 SWS Miscellaneous Publication 98-5 STATE OF ILLINOIS DEPARTMENT OF ENERGY AND NATURAL RESOURCES Local Ctimatotogical Data Summary White Hall, Illinois 1901-1990 by Audrey A. Bryan and Wayne Armstrong Illinois
SOURCES of RADIOACTIVITY
 Section 9: SOURCES of RADIOACTIVITY This section briefly describes various sources of radioactive nuclei, both naturally occurring and those produced artificially (man-made) in, for example, reactors or
Memorandum. Air Sampling
 Memorandum TO: David Yelton, City of Beverly Hills DATE: December 8, 2015 CC: Heidi Rous, PCR Services FROM: Everest Yan and Audrey Vinant Tang, PCR Services RE: BEVERLY HILLS ARSENIC MONITORING MEMO This
Nuclear fission is used in nuclear power stations to generate electricity. Nuclear fusion happens naturally in stars.
 1 (a) Nuclear fission is used in nuclear power stations to generate electricity. Nuclear fusion happens naturally in stars. (i) Explain briefly the difference between nuclear fission and nuclear fusion.
SECTION 8 Part I Typical Questions
 SECTION 8 Part I Typical Questions 1. For a narrow beam of photons, the relaxation length is that thickness of absorber that will result in a reduction of in the initial beam intensity. 1. 1/10. 2. 1/2.
Investigation IV: Seasonal Precipitation and Seasonal Surface Runoff in the US
 Investigation IV: Seasonal Precipitation and Seasonal Surface Runoff in the US Purpose Students will consider the seasonality of precipitation and surface runoff and think about how the time of year can
REDWOOD VALLEY SUBAREA
 Independent Science Review Panel Conceptual Model of Watershed Hydrology, Surface Water and Groundwater Interactions and Stream Ecology for the Russian River Watershed Appendices A-1 APPENDIX A A-2 REDWOOD
Preliminary Radiological Results of Samples from Potential Pathways from the Los Alamos National Laboratory (LANL) into the Public Domain.
 into the Public Domain.") 1 Preliminary Radiological Results of Samples from Potential Pathways from the Los Alamos National Laboratory (LANL) into the Public Domain. Norm Buske, Director, The Radioactivist Campaign May 15, 2003
1 Preliminary Radiological Results of Samples from Potential Pathways from the Los Alamos National Laboratory (LANL) into the Public Domain. Norm Buske, Director, The Radioactivist Campaign May 15, 2003
Understanding the contribution of naturally occurring radionuclides to the measured radioactivity in AWE Environmental Samples
 Understanding the contribution of naturally occurring radionuclides to the measured radioactivity in AWE Environmental Samples Dr Jonathan Burnett ASc Analytical Sciences PhD Supervisors Dr Richard Greenwood
Information (17:30), January 11, 2019
, January 11, 2019") Information (17:30), January 11, 2019 To All Missions (Embassies, Consular posts and International Organizations in Japan) Report on the discharge record and the seawater monitoring results at Fukushima
Information (17:30), January 11, 2019 To All Missions (Embassies, Consular posts and International Organizations in Japan) Report on the discharge record and the seawater monitoring results at Fukushima
SLOVENIAN ALARM AND MONITORING NETWORKS
 SLOVENIAN ALARM AND MONITORING NETWORKS Jasmina Kožar Logar, Denis Glavič-Cindro "Jožef Stefan" Institute,, Slovenia CHERNOBYL 25 YEARS LATER: STUDIES, REMARKS AND RECENT FINDINGS June 21-22-23, 2011 UDINE
Isotopes 1. Carbon-12 and Carbon-14 have a different number of. A. Protons B. Neutrons C. Both D. Neither
 Isotopes 1. Carbon-12 and Carbon-14 have a different number of A. Protons B. Neutrons C. Both D. Neither 2. Which statement is true about an isotope s half life? Radioactive Isotopes A. Isotopes of the
Tritium Dose Pathway Comparison Regulatory Guide and Beyond
 Tritium Dose Pathway Comparison Regulatory Guide 1.109 and Beyond Ken Sejkora Entergy Nuclear Northeast Pilgrim Station Presented at the 15 th Annual RETS-REMP Workshop Wilmington, NC / 27-29 June 2005
Hurricane Matthew. Life Threatening Flash Flooding Likely. National Weather Service Wilmington NC. Josh Weiss, Meteorologist
 Hurricane Matthew Life Threatening Flash Flooding Likely Threat Assessment for northeast South Carolina & southeast North Carolina National Weather Service Wilmington NC 630 PM EDT Friday October 7, 2016
Who is polluting the Columbia River Gorge?
 Who is polluting the Columbia River Gorge? Final report to the Yakima Nation Prepared by: Dan Jaffe, Ph.D Northwest Air Quality, Inc. 7746 Ravenna Avenue NE Seattle WA 98115 NW_airquality@hotmail.com December
There are no stable isotopes of elements above atomic number 83.
 Nuclear Chemistry Stability of isotopes is based on the ratio of neutrons and protons in its nucleus. Although most nuclei are stable, some are unstable and spontaneously decay, emitting radiation. All
Range Cattle Research and Education Center January CLIMATOLOGICAL REPORT 2016 Range Cattle Research and Education Center.
 1 Range Cattle Research and Education Center January 2017 Research Report RC-2017-1 CLIMATOLOGICAL REPORT 2016 Range Cattle Research and Education Center Brent Sellers Weather conditions strongly influence
HyMet Company. Streamflow and Energy Generation Forecasting Model Columbia River Basin
 HyMet Company Streamflow and Energy Generation Forecasting Model Columbia River Basin HyMet Inc. Courthouse Square 19001 Vashon Hwy SW Suite 201 Vashon Island, WA 98070 Phone: 206-463-1610 Columbia River
Environmental Radioactivity in New Zealand and Rarotonga - Annual Report. R A Tinker K M Matthews
 Environmental Radioactivity in New Zealand and Rarotonga - Annual Report R A Tinker K M Matthews NRL-F/78 1998 Environmental Radioactivity in New Zealand and Rarotonga R A Tinker K M Matthews Published
ENGINEER S CERTIFICATION OF FAULT AREA DEMONSTRATION (40 CFR )
") PLATTE RIVER POWER AUTHORITY RAWHIDE ENERGY STATION BOTTOM ASH TRANSFER (BAT) IMPOUNDMENTS LARIMER COUNTY, CO ENGINEER S CERTIFICATION OF FAULT AREA DEMONSTRATION (40 CFR 257.62) FOR COAL COMBUSTION RESIDUALS
PLATTE RIVER POWER AUTHORITY RAWHIDE ENERGY STATION BOTTOM ASH TRANSFER (BAT) IMPOUNDMENTS LARIMER COUNTY, CO ENGINEER S CERTIFICATION OF FAULT AREA DEMONSTRATION (40 CFR 257.62) FOR COAL COMBUSTION RESIDUALS
Comments Dated: March 12, 2009
 Response to Comments from NJDEP s Radiation Protection and Release Prevention Programs Bureau of Environmental Radiation Sampling Summary Report, Former Dog Pound Area, Picatinny Arsenal Draft Final Document
Environmental Radioactivity in New Zealand and Rarotonga. Annual Report
 Environmental Radioactivity in New Zealand and Rarotonga Annual Report NRL-F/77 1997 Environmental Radioactivity in New Zealand and Rarotonga Annual Report Published in April 1998 by National Radiation
Accelerator Facility Accident Report
 Accelerator Facility Accident Report 31 May 2013 Incorporated Administrative Agency - Japan Atomic Energy Agency Inter-University Research Institute - High Energy Accelerator Research Organization Subject:
Science 10. Unit 4:Physics. Block: Name: Book 3: radioactivty
 Science 10 Unit 4:Physics Book 3: radioactivty Name: Block: 1 5.1 : Radioactivity & Nuclear Equations Isotopes are versions of an element with the same but Because the number of protons is the same for,
Modeling the Physical Processes that Impact the Fate and Fallout of Radioactive Materials
 Modeling the Physical Processes that Impact the Fate and Fallout of Radioactive Materials J.V. Ramsdell, Jr. Radiological Science and Engineering Group Pacific Northwest National Laboratory Richland, Washington
RADIATION MONITORING REPORT INCLUDING APPENDICES SUMMARY OF RESULTS FOR SUMMER, FALL, AND WINTER 2017 SAMPLING EVENTS
 FINAL RADIATION MONITORING REPORT INCLUDING APPENDICES SUMMARY OF RESULTS FOR SUMMER, FALL, AND WINTER 2017 SAMPLING EVENTS FOR MATERIALS LICENSE SUC-1593, DOCKET NO. 040-09083 May 2018 Submitted By: U.S.
The sources include Am-241 which emits alpha radiation, Sr-90 which emits beta radiation and Co-60 which emits gamma radiation.
 1 The physics department in a college has a number of radioactive sources which are used to demonstrate the properties of ionising radiations. The sources include Am-241 which emits alpha radiation, Sr-90
2016 No. 410 (W. 128) WATER, ENGLAND AND WALES. The Water Supply (Water Quality) (Amendment) Regulations 2016
 WATER, ENGLAND AND WALES. The Water Supply (Water Quality) (Amendment) Regulations 2016") W E L S H S T A T U T O R Y I N S T R U M E N T S 2016 No. 410 (W. 128) WATER, ENGLAND AND WALES The Water Supply (Water Quality) (Amendment) Regulations 2016 Made - - - - 21 March 2016 Laid before Parliament
W E L S H S T A T U T O R Y I N S T R U M E N T S 2016 No. 410 (W. 128) WATER, ENGLAND AND WALES The Water Supply (Water Quality) (Amendment) Regulations 2016 Made - - - - 21 March 2016 Laid before Parliament
12/18/2016. Radioanalysis Laboratory Capabilities and Issues. Eleventh Annual Radiation Measurement Cross Calibration Workshop RMCC XI
 1. Introduction 2. Laboratories Gamma spectrometry laboratory. Radiochemistry laboratory. Analytical chemistry laboratory. Alpha spectrometry laboratory Gross alpha / beta laboratory. Neutron activation
North Carolina Climate January 2012
 North Carolina Climate January 2012 Online: http://www.nc-climate.ncsu.edu/office/newsletters North Carolina Climate, the monthly newsletter of the State Climate Office of NC, covers information on experimental
Climate. Annual Temperature (Last 30 Years) January Temperature. July Temperature. Average Precipitation (Last 30 Years)
 January Temperature. July Temperature. Average Precipitation (Last 30 Years)") Climate Annual Temperature (Last 30 Years) Average Annual High Temp. (F)70, (C)21 Average Annual Low Temp. (F)43, (C)6 January Temperature Average January High Temp. (F)48, (C)9 Average January Low Temp.
Climate Annual Temperature (Last 30 Years) Average Annual High Temp. (F)70, (C)21 Average Annual Low Temp. (F)43, (C)6 January Temperature Average January High Temp. (F)48, (C)9 Average January Low Temp.
Study of Gross Alpha and Gross Beta Radioactivity in Soils Compared to Airborne RADNET Levels
 Study of Gross Alpha and Gross Beta Radioactivity in Soils Compared to Airborne RADNET Levels L. Tyler, A. Wallace Department of Physics and Geosciences, Angelo State University, Texas Abstract Since radionuclides
Notes: Unit 13 Nuclear Chemistry
 Name: Regents Chemistry: Notes: Unit 13 Nuclear Chemistry Name: KEY IDEAS: Stability of isotopes is based in the ratio of neutrons and protons in its nucleus. Although most nuclei are stable, some are
Key Question: What role did the study of radioactivity play in learning more about atoms?
 Name Chemistry Essential question: How were the parts of the atom determined? Key Question: What role did the study of radioactivity play in learning more about atoms? Vocabulary: alpha particle fusion
The Pennsylvania Observer
 The Pennsylvania Observer January 5, 2009 December 2008 Pennsylvania Weather Recap The final month of 2008 was much wetter than average and a bit colder than normal. In spite of this combination, most
Climate Change and Climate Trends in Our Own Backyard
 Climate Change and Climate Trends in Our Own Backyard Dr. Mark Seeley Department of Soil, Water, and Climate University of Minnesota St Paul, MN 55108 For IATP: Rural Climate Dialogue Grand Rapids, MN
External Dosimetry at NPPs; NVLAP, Noble Gas, and TEDE
 External Dosimetry at NPPs; NVLAP, Noble Gas, and TEDE Joseph L Danek - CHP 2018 Fall Meeting FLORIDA CHAPTER HEALTH PHYSICS SOCIETY 1 Part 1 National Voluntary Laboratory Accreditation Program (NVLAP)
Information (11:00), February 12, 2019
, February 12, 2019") Information (11:00), February 12, 2019 To All Missions (Embassies, Consular posts and International Organizations in Japan) Report on the discharge record and the seawater monitoring results at Fukushima
Information (11:00), February 12, 2019 To All Missions (Embassies, Consular posts and International Organizations in Japan) Report on the discharge record and the seawater monitoring results at Fukushima
The outermost container into which vitrified high level waste or spent fuel rods are to be placed. Made of stainless steel or inert alloy.
 Glossary of Nuclear Waste Terms Atom The basic component of all matter; it is the smallest part of an element having all the chemical properties of that element. Atoms are made up of protons and neutrons
Range Cattle Research and Education Center January CLIMATOLOGICAL REPORT 2012 Range Cattle Research and Education Center.
 1 Range Cattle Research and Education Center January 2013 Research Report RC-2013-1 CLIMATOLOGICAL REPORT 2012 Range Cattle Research and Education Center Brent Sellers Weather conditions strongly influence
GROUNDWATER MONITORING DATA 2016 SAMPLING EVENT HARSHAW CHEMICAL COMPANY FUSRAP SITE
 GROUNDWATER MONITORING DATA 2016 SAMPLING EVENT HARSHAW CHEMICAL COMPANY FUSRAP SITE U.S. Army Corps of Engineers Buffalo District Building Strong April 2017 ly Utilized Sites Remedial Action Program The
Current Climate Trends and Implications
 Current Climate Trends and Implications Dr. Mark Seeley Professor emeritus Department of Soil, Water, and Climate University of Minnesota St Paul, MN 55108 Crop Insurance Conference September 12, 2018
Gross Alpha-Gross Beta Analysis in Water by Liquid Scintillation Counting (LSC)
") Gross Alpha-Gross Beta Analysis in Water by Liquid Scintillation Counting (LSC) Bob Read, Ph.D. Director, Environmental Chemistry Laboratory Tennessee Department of Health Division of Laboratory Services
Gross Alpha-Gross Beta Analysis in Water by Liquid Scintillation Counting (LSC) Bob Read, Ph.D. Director, Environmental Chemistry Laboratory Tennessee Department of Health Division of Laboratory Services
RAINFALL AVERAGES AND SELECTED EXTREMES FOR CENTRAL AND SOUTH FLORIDA. Thomas K. MacVicar
 TECHNICAL PUBLICATION #83-2 March 1983 RAINFALL AVERAGES AND SELECTED EXTREMES FOR CENTRAL AND SOUTH FLORIDA by Thomas K. MacVicar "This public document was promulgated at an annual cost of $136.74, or
THE ENVIRONMENTAL RADIATION ANALYSIS ON THE RESIDENTIAL AREA AROUND NUCLEAR POWER PLANTS
 Proceedings of the 2013 21st International Conference on Nuclear Engineering ICONE21 July 29 - August 2, 2013, Chengdu, China ICONE21-16111 THE ENVIRONMENTAL RADIATION ANALYSIS ON THE RESIDENTIAL AREA
Radionuclides in food and water. Dr. Ljudmila Benedik
 Radionuclides in food and water Dr. Ljudmila Benedik ISO-FOOD WP 3 and WP4 WP 3 Research and education P1 Food authenticity P2 Translation of regional isotopic and elemental signatures from natural environment
ANALYSIS OF THE 2010 AMERICAN SHAD RADIO TELEMETRY ANIMATIONS RSP 3.5 CONOWINGO HYDROELECTRIC PROJECT FERC PROJECT NUMBER 405
 ANALYSIS OF THE 2010 AMERICAN SHAD RADIO TELEMETRY ANIMATIONS RSP 3.5 CONOWINGO HYDROELECTRIC PROJECT FERC PROJECT NUMBER 405 Prepared for: Prepared by: Normandeau Associates, Inc. Gomez and Sullivan Engineers,
Douglas Millican Chief Executive Scottish Water Castle House 6 Castle Drive DUNFERMLINE KY11 8GG Our Reference: 9 January 2014
 Drinking Water Quality Regulator for Scotland T: 0131 244 0224 F: 0131 244 0743 E: regulator@dwqr.org.uk www.dwqr.org.uk Douglas Millican Chief Executive Scottish Water Castle House 6 Castle Drive DUNFERMLINE
KANSAS CLIMATE SUMMARY June 2017
 KANSAS CLIMATE SUMMARY June 2017 Uneven rainfall The wet May gave way to uneven rainfall in June. The statewide average precipitation was 3.23 inches or 74 percent of normal. The East Central and West
One of the coldest places in the country - Peter Sinks yet again sets this year s coldest temperature record for the contiguous United States.
 One of the coldest places in the country - Peter Sinks yet again sets this year s coldest temperature record for the contiguous United States. In the early morning of February 22, 2010 the temperature
North Carolina Climate July 2011
 North Carolina Climate July 2011 Online: http://www.nc-climate.ncsu.edu/office/newsletters North Carolina Climate, the monthly newsletter of the State Climate Office of NC, covers a monthly climate summary
Technical Memorandum. City of Salem, Stormwater Management Design Standards. Project No:
 Technical Memorandum 6500 SW Macadam Avenue, Suite 200 Portland, Oregon, 97239 Tel: 503-244-7005 Fax: 503-244-9095 Prepared for: Project Title: City of Salem, Oregon City of Salem, Stormwater Management
Oregon Water Conditions Report April 17, 2017
 Oregon Water Conditions Report April 17, 2017 Mountain snowpack continues to maintain significant levels for mid-april. By late March, statewide snowpack had declined to 118 percent of normal after starting