Summary Visualizations for Coastal Spatial Temporal Dynamics
|
|
|
- Roland Barber
- 5 years ago
- Views:
Transcription

1 Summary Visualizations for Coastal Spatial Temporal Dynamics October Providence, RI Sidharth Thakur 1, Laura Tateosian 2, Helena Mitasova, Eric Hardin, and Margery Overton


2 Overview Motivation Case Study Visualization approaches Discussion


 Span an unprecedented number of years.")
3 Motivation Coastal landscapes are dynamic wind, water, gravitation, plants, animals, and humans continuously changing landscapes Open questions Land surface processes poorly understood. Predictive capabilities limited. Management decisions based on insufficient information. Data Digital scans of coastal regions High resolution (as low as 0.5 m 2 ) Span an unprecedented number of years. Visualization needs Standard raster based analysis too much info? Need tools to highlight important attributes Need to summarize and provide information about error and uncertainty.

4 Case Study: barrier islands Atlantic Ocean Oregon Inlet Outer Banks Study area: North Carolina Outer Banks long narrow strip of sandy barrier islands Focus region: near Oregon Inlet exhibits significant terrain changes over 10 years. Dynamic topography: sand is redistributed by wind, waves, storm surge 0 10km Cape Hatteras N Vulnerable: coastal erosion, sea level rise, inundation, breach First line of defense against storms
5 Pop quiz Which of these natural disasters occurred on the U.S. east coast in 2011? A. Plague of locusts. B. Earthquake. C. Forest fires. D. Hurricane. E. All of the above.


6 Expensive Damage August, 2011 Hurricane Irene caused breaches in the Outer Banks Atlantic Ocean N Breach the only road destroyed. Road Hurricane haven 2003 Isabel 1999 Dennis 1996 Edouard
![DEMs 11 digital elevation models Years 1996 2008, uneven intervals Derived from LiDAR surveys [1] 0.](/docs-images/89/97489818/images/7-0.jpg "5 m 2 resolution Data t 11 = 2008 time t 1 = 1996 Transects Line segments perpendicular to the shoreline U.S.")
![Geological survey transects [2] 50 m intervals Imagery 2009 aerial photo National Agriculture Imagery Program [3] [1] Mitasova H., Hardin E., Kurum, M., and Overton M.](/docs-images/89/97489818/images/7-1.jpg ", 2010, Geospatial analysis of vulnerable beach foredune systems from decadal time series of lidar data, Journal of Costal Conservation, Management and Planning, 14 (3), p.161 172. [2] Morton, R.")
7 DEMs 11 digital elevation models Years , uneven intervals Derived from LiDAR surveys [1] 0.5 m 2 resolution Data t 11 = 2008 time t 1 = 1996 Transects Line segments perpendicular to the shoreline U.S. Geological survey transects [2] 50 m intervals Imagery 2009 aerial photo National Agriculture Imagery Program [3] [1] Mitasova H., Hardin E., Kurum, M., and Overton M., 2010, Geospatial analysis of vulnerable beach foredune systems from decadal time series of lidar data, Journal of Costal Conservation, Management and Planning, 14 (3), p [2] Morton, R. and Miller, T. (2005). NC TRANSECTS ST Short term shoreline change rates for NC Atlantic coast generated at a 50m transect spacing, Technical report, USGS Open File Report [3] Imagery source:
8 Methods Space time cube t 11 = 2008 time Summary plots t 1 = 1996 DATA Clustering & error VISUALIZATIONS
9 USA Canada 40N Study region: Oregon Inlet North Carolina 35N Atlantic Ocean N 30N Oregon Inlet 85W 80W 75W North Carolina barrier islands 25N Outer Banks Oregon Inlet


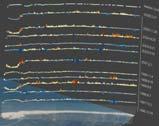
10 Dune ridge elevation Importance vulnerability indicator Construction derived from DEM sampled at transects Display space time cube technique (STC) glyph position + visual features Elevation color map Oregon Inlet Ridge line: optimally high elevation path STC dune ridge elevation near Oregon Inlet

11 STC Ridge Elevation Oregon Inlet N

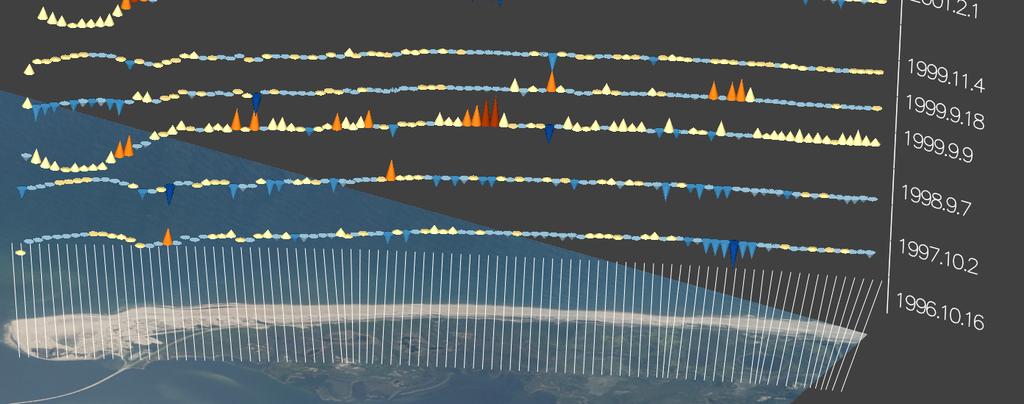
12 STC Differences in Elevation Oregon Inlet N

13 Canada Study region: Outer Banks USA 40N North Carolina 35N Atlantic Ocean N 30N Oregon Inlet 85W 80W 75W 25N North Carolina barrier islands Oregon Inlet Outer Banks Shoreline band width


14 STC Mean Elevation Mean elevation Standard deviation Mean elevation < 3m No data


15 Overwash locations z = 4.5m z = 4.5 m m beach stable dune peaks z = 7.5 m GRASS GIS

16 Methods Space time cube t 11 = 2008 time Summary plots t 1 = 1996 Clustering & Error Visualization
17 V rel = V i V core V env V core Relative volume

18 Summary Plots: Relative volume Relative Volumes: Rodanthe 10 km Data: fore dune sampled at 50 m resolution. About 1800 data points.
19 Summary Plots: Differences in Rel. Vol. Relative Volumes: Rodanthe 10 km Data: fore dune sampled at 50 m resolution. About 1800 data points.


20 Summary Plots: Dune ridge elevation Rodanthe 10 km Data: raster map sampled at.5 m resolution.
21 Space Time Clustering Identify clusters of points on a terrain that have similar elevations over all time steps Visualization: Apply the clustering technique to visualize clusters of points with similar elevation time series in Oregon Inlet region. Develop methods to visualize other attributes such as error within each cluster Oregon Inlet


22 Clustering Method Elevation time series time Distance metric Pair wise Similarity score 2D layout (MDS) : : : : Partition (K means)
23 Partitioning result with k = 3. Note that colors are assigned arbitrarily to the clusters. Data: raster map sampled at 5m resolution. About 10,000 points on the surface. N

24 Partitioning result with k set to 6. Points on foredune ridge Data: raster map sampled at 5m resolution. About 10,000 points on the surface. N

25 Visualization of Error Error is introduced due to the summarization process One type of error is difference from cluster mean elevation Black lines originating from the spheres denote their distance from the mean of corresponding cluster. A white cutting plane is drawn to show the mean of the cluster of yellow spheres. Sphere height = Mean elevation Sphere color = Cluster Id Semi transparent plane = Cluster mean of one cluster


26 Mean elevation of cluster: 1.42 m Standard deviation0: 0.44 m Cluster 1 Mean elevation of cluster: 3.48 m Standard deviation: 0.67 m Cluster 2 Visualizations of points in individual clusters Mean elevation of cluster: 6.03 m Standard deviation: 0.94 m Cluster 3

27 Visualization of points in three clusters obtained by clustering elevations of points on the map over all time steps. Vertical location of sphere represents mean elevations and black lines represent difference of mean from mean of the cluster. N
28 Discussion Summarization is necessary because we are dealing with data that have High resolution + multiple time steps + multiple features Summaries are used to verify trends, for example, Hurricane Isabel (2003) Reduce complexity of raster based displays Error is introduced due to summarization process and we visualize this error Implications for vulnerability Vulnerability calculated based on factors such as fore dune ridge height, shoreline movement, beach width, fore dune volume
29 Future work Inspect known vulnerable region for patterns Incorporate new datasets Other metrics beach width, shoreline, slope, gradients over time, horizontal ridge migration Other terrain types, for example, land slides in mountainous regions

30 Thank you Shackleford Island, Outer Banks, North Carolina
Mapping Coastal Change Using LiDAR and Multispectral Imagery
 Mapping Coastal Change Using LiDAR and Multispectral Imagery Contributor: Patrick Collins, Technical Solutions Engineer Presented by TABLE OF CONTENTS Introduction... 1 Coastal Change... 1 Mapping Coastal
MONITORING AND MODELING NATURAL AND ANTHROPOGENIC TERRAIN CHANGE
 MONITORING AND MODELING NATURAL AND ANTHROPOGENIC TERRAIN CHANGE Spatial analysis and simulations of impact on landscape processess Helena MITASOVA, Russell S. HARMON, David BERNSTEIN, Jaroslav HOFIERKA,
Mapping, monitoring, and modeling: USGS Coastal and Marine Geology activities along the Northeast coast
 Mapping, monitoring, and modeling: USGS Coastal and Marine Geology activities along the Northeast coast Coastal and Marine Geology Program Woods Hole Coastal and Marine Science Center St. Petersburg Coastal
Sea-level Rise on Cape Cod: How Vulnerable Are We? Rob Thieler U.S. Geological Survey Woods Hole, MA
 Sea-level Rise on Cape Cod: How Vulnerable Are We? Rob Thieler U.S. Geological Survey Woods Hole, MA Outline Sea-level and coastal processes Past sea-level change Predictions for the future Coastal responses
A Multi-Hazard Evaluation of Vulnerability using GIS along Cape Hatteras National Seashore, NC
 A Multi-Hazard Evaluation of Vulnerability using GIS along Cape Hatteras National Seashore, NC Tom Allen¹, Burrell Montz¹, JP Walsh¹, Tom Crawford² ¹East Carolina University, ²Saint Louis University Presented
Major Hurricane Earl
 Major Hurricane Earl Advisory 33 North Carolina Threat Assessment Prepared at: 11 AM Thursday September 2, 2010 Hurricane and Tropical Storm Warnings in effect for the North Carolina Coast and Sounds NWS
An overview of USGS Hurricane Sandy Supplemental Studies along the Delmarva Peninsula
 An overview of USGS Hurricane Sandy Supplemental Studies along the Delmarva Peninsula Neil K. Ganju, Laura L. Brothers, Nathaniel G. Plant, Christopher G. Smith, E. Robert Thieler Coastal and Marine Geology
ACCELERATED BEACH EROSION ALONG THE UPPER TEXAS COAST
 ACCELERATED BEACH EROSION ALONG THE UPPER TEXAS COAST Young Hyun Park 1, Billy L. Edge 2 and Sehyun Cheon 3 The upper Texas coast has been severely eroded and beach erosion is going on. It is not extreme
DIVISION OF COASTAL MANAGEMENT TO STUDY CURRENT LONG-TERM EROSION RATES ADJACENT TO TERMINAL GROINS
 DIVISION OF COASTAL MANAGEMENT TO STUDY CURRENT LONG-TERM EROSION RATES ADJACENT TO TERMINAL GROINS North Carolina Department of Environmental Quality Division of Coastal Management February 22, 2018 N.
Remote sensing and GIS for multi-hazard risk assessments in the coastal zone: recent applications and challenges in the Pacific Jens Kruger
 Remote sensing and GIS for multi-hazard risk assessments in the coastal zone: recent applications and challenges in the Pacific Jens Kruger Geoscience Division Pacific Community (SPC) The First Pacific
A Perfect Storm: The Collision of Tropical Cyclones, Climate Change and Coastal Population Growth. Jeff Donnelly Woods Hole Oceanographic Institution
 A Perfect Storm: The Collision of Tropical Cyclones, Climate Change and Coastal Population Growth Jeff Donnelly Woods Hole Oceanographic Institution Recent Hurricane Trends What Might the Future Hold?
Phillip Island Nature Parks Coastal Process Study 8 October 2014
 Phillip Island Nature Parks Coastal Process Study 8 October 2014 Project Overview Coastal Geology Basaltic and fragmented lavas, granite at Pyramid Rock and Cape Woolamai Weathered basalt (>10m thick)
Protecting the Storm Damage Prevention and Flood Control Interests of Coastal Resource Areas
 Protecting the Storm Damage Prevention and Flood Control Interests of Coastal Resource Areas Presented by: Massachusetts Department of Environmental Protection & Massachusetts Office of Coastal Zone Management
Geospatial application in Kiribati
 Geospatial application in Kiribati ICC-21 ST RESAP (9 TH TO 13 TH OCTOBER, 2017) BANGKOK, THAILAND Outline Kiribati Profile Natural disasters in Kiribati Achievements Challenges/Issues Ways forward 1 Kiribati
Quantifying effects of oil on coastal dune vegetation. Thomas Miller and Elise Gornish Biological Science, Florida State University
 Quantifying effects of oil on coastal dune vegetation Thomas Miller and Elise Gornish Biological Science, Florida State University Natural History of Barrier Islands in the Northern Gulf Make up ~70% of
Regional-scale understanding of the geologic character and sand resources of the Atlantic inner continental shelf, Maine to Virginia
 Regional-scale understanding of the geologic character and sand resources of the Atlantic inner continental shelf, Maine to Virginia Workshop on Dredging, Beach Nourishment and Bird Conservation Atlantic
Prepared by: Ryan Ratcliffe GPH-903 December 10, 2011
 Prepared by: Ryan Ratcliffe GPH-903 December 10, 2011 Scientific studies have proven that global sea level has risen 7.1 inches in the past century and computer models have suggested that climate change
GUIDED READING CHAPTER 1: THE LAY OF THE LAND (Page 1)
") CHAPTER 1: THE LAY OF THE LAND (Page 1) Section 1 The Tidewater Region Directions: Use the information from pages 6-11 to complete the following statements. 1. In the southern part of the coast, the Tidewater
CHAPTER 1: THE LAY OF THE LAND (Page 1) Section 1 The Tidewater Region Directions: Use the information from pages 6-11 to complete the following statements. 1. In the southern part of the coast, the Tidewater
Quick Response Report #126 Hurricane Floyd Flood Mapping Integrating Landsat 7 TM Satellite Imagery and DEM Data
 Quick Response Report #126 Hurricane Floyd Flood Mapping Integrating Landsat 7 TM Satellite Imagery and DEM Data Jeffrey D. Colby Yong Wang Karen Mulcahy Department of Geography East Carolina University
Coastal Emergency Risks Assessment - CERA Real-Time Storm Surge and Wave Visualization Tool
 Coastal Emergency Risks Assessment - CERA Real-Time Storm Surge and Wave Visualization Tool Introduction This document provides guidance for using the Coastal Emergency Risks Assessment (CERA) visualization
Building open source geospatial education at research universities
 Building open source geospatial education at research universities Helena Mitasova North Carolina State University, Raleigh, NC, USA with contributions by NCSU GIST students GRASS GIS Motivation GIS teaching
Modeling Coastal Change Using GIS Technology
 Emily Scott NRS 509 Final Report December 5, 2013 Modeling Coastal Change Using GIS Technology In the past few decades, coastal communities around the world are being threatened by accelerating rates of
Flood protection structure detection with Lidar: examples on French Mediterranean rivers and coastal areas
 Flood protection structure detection with Lidar: examples on French Mediterranean rivers and coastal areas Céline Trmal 1,a, Frédéric Pons 1 and Patrick Ledoux 1 1 Cerema, Direction Territoriale Méditerranée,
OVERWASHED SEDIMENT INTO THE GAMO LAGOON IN NANAKITA RIVER MOUTH AND EFFECTIVENESS OF THE OVERWASH PREVENTION CONSTRUCTION
 東北地域災害科学研究第 6 巻 (010) 191 OVERWASHED SEDIMENT INTO THE GAMO LAGOON IN NANAKITA RIVER MOUTH AND EFFECTIVENESS OF THE OVERWASH PREVENTION CONSTRUCTION ABSTRACT Xuan Tinh Nguyen 1, Ryutaro Hirao, Hitoshi
Modeling Storm Surge for Emergency Management
 Modeling Storm Surge for Emergency Management Study Area: Guam is the southern-most island of the Mariana Archipelago and is located at 13 28 N, 144 47 E. It has a total area of 541.3 sq. km. and the highest
Impacts of Hurricane Rita on the Beaches of Western Louisiana
 Impacts of Hurricane Rita on the Beaches of Western Louisiana By Hilary F. Stockdon, Laura A. Fauver, Asbury H. Sallenger, Jr., and C. Wayne Wright Hurricane Rita made landfall as a category 3 storm in
The Use of Geographic Information Systems to Assess Change in Salt Marsh Ecosystems Under Rising Sea Level Scenarios.
 The Use of Geographic Information Systems to Assess Change in Salt Marsh Ecosystems Under Rising Sea Level Scenarios Robert Hancock The ecological challenges presented by global climate change are vast,
Building open source geospatial education at research universities
 Building open source geospatial education at research universities Helena Mitasova, Makiko Shukunobe North Carolina State University, Raleigh, NC, USA Martin Landa, Anna Kratochvilova Czech technical University,
Primer on Coastal Erosion And Habitat Creation
 2 nd Regional Conference Dredging, Beach Nourishment & Bird Conservation Primer on Coastal Erosion And Habitat Creation Timothy Kana Ph.D Source: Newsday 1962 Photo by Kelsey Aerials 1978 Source: U Mass
COASTAL DYNAMICS VIRTUAL FIELD TRIP, NORTHEAST FLORIDA. Joann Mossa Department of Geography University of Florida
 COASTAL DYNAMICS VIRTUAL FIELD TRIP, NORTHEAST FLORIDA Joann Mossa Department of Geography University of Florida WHERE ARE WE GOING? In NE Florida (Flagler and St. Johns County, south of St. Augustine),
GIS 2010: Coastal Erosion in Mississippi Delta
 1) Introduction Problem overview To what extent do large storm events play in coastal erosion rates, and what is the rate at which coastal erosion is occurring in sediment starved portions of the Mississippi
Major Hurricane Earl
 Major Hurricane Earl Advisory 32 North Carolina Threat Assessment Prepared at: 8 AM Thursday September 2, 2010 Hurricane and Tropical Storm Warnings in effect for the North Carolina Coast and Sounds. NWS
FEMA REGION III COASTAL HAZARD STUDY
 FEMA REGION III COASTAL HAZARD STUDY Impacts and Rollout June 11, 2013 Robin Danforth, FEMA Region III David Bollinger, FEMA Region III Jeff Gangai, RAMPP Christine Worley, RAMPP 1 Today s Discussion Overview
N The swash regime occurs when R High, D Low and is. N The collision regime occurs when D Low, R High, D High,
 Journal of Coastal Research 28 4 970 978 West Palm Beach, Florida July 2012 TECHNICAL COMMUNICATIONS www.cerf-jcr.org Least Cost Path Extraction of Topographic Features for Storm Impact Scale Mapping Eric
Holderness Erosion and Evolution of the Spurn Peninsula
 Holderness Erosion and Evolution of the Spurn Peninsula Prof. Ken Pye and Dr. Simon Blott Kenneth Pye Associates Ltd. Outline of the Presentation Overview of historical erosion trends Effects of coast
Use of Elevation Data in NOAA Coastal Mapping Shoreline Products. Coastal GeoTools April 1, 2015
 Use of Elevation Data in NOAA Coastal Mapping Shoreline Products Coastal GeoTools April 1, 2015 - NOAA s Coastal Mapping Program & CUSP - Shoreline Uses, Delineation Issues, Definitions - Current Extraction
Developed in Consultation with Florida Educators
 Developed in Consultation with Florida Educators Table of Contents Next Generation Sunshine State Standards Correlation Chart... 7 Benchmarks Chapter 1 The Practice of Science...................... 11
Shoreline Evolution: Richmond County, Virginia Rappahannock River Shorelines
 Shoreline Evolution: Richmond County, Virginia Rappahannock River Shorelines Virginia Institute of Marine Science College of William & Mary Gloucester Point, Virginia September 2011 Shoreline Evolution:
Draft for Discussion 11/11/2016
 Coastal Risk Consulting (CRC) Climate Vulnerability Assessment for Village of Key Biscayne Deliverable 1.1 in Statement of Work. Preliminary Vulnerability Assessment Identifying Flood Hotspots Introduction...
Innovated Technological Trends in Highways. Flood Modelling & Evaluation of Impacts on Infrastructure
 Innovated Technological Trends in Highways Flood Modelling & Evaluation of Impacts on Infrastructure Dr. Waheed Uddin Professor and Director CAIT University of Mississippi Contributions from: CAIT and
COASTAL EVOLUTION AND CLIMATE CHANGE: CHALLENGES OF MULTI-SCALE SPATIAL AND TEMPORAL VARIABILITY
 COASTAL EVOLUTION AND CLIMATE CHANGE: CHALLENGES OF MULTI-SCALE SPATIAL AND TEMPORAL VARIABILITY Dr. Jennifer L. Miselis Naval Research Laboratory Stennis Space Center, MS jmiselis@nrlssc.navy.mil 1 PRIMARY
USING MIKE TO MODEL COASTAL CATASTROPHE RISK
 USING MIKE TO MODEL COASTAL CATASTROPHE RISK Nicola Howe, Christopher Thomas, Joss Matthewman, John Maskell* 1 SUMMARY About RMS Who are we and what do we do? How do we use MIKE in our workflow? Case study:
Landslide & Coastal Erosion Risk Reduction at Oregon s Water/Wastewater Networks
 Landslide & Coastal Erosion Risk Reduction at Oregon s Water/Wastewater Networks Laura Gabel, RG (with Bill Burns, RG & Jonathan Allan, Ph. D) Oregon Department of Geology and Mineral Industries (541)
ELEVATION. The Base Map
 ELEVATION The Base Map Basic Elevation Types: Points X, Y, Z Irregular distribution Cumbersome Typical sources Lidar Stereo photography Ground survey ASCII, LAS formats Basic Elevation Types: Contour Lines
2.2.7 Backbarrier flats
 FIGURE 24. VERTICAL PHOTOGRAPH SHOWING THE DEVELOPMENT OF SMALL PARABOLIC DUNES FROM BLOWOUTS IN A LARGE RELICT FOREDUNE NORTHWEST OF HUNTER'S CREEK. PHOTOGRAPH COURTESY OF CAR'T'ER HOLT HARVEY FORESTS
Application of high-resolution (10 m) DEM on Flood Disaster in 3D-GIS
 DEM on Flood Disaster in 3D-GIS") Risk Analysis V: Simulation and Hazard Mitigation 263 Application of high-resolution (10 m) DEM on Flood Disaster in 3D-GIS M. Mori Department of Information and Computer Science, Kinki University, Japan
Risk Analysis V: Simulation and Hazard Mitigation 263 Application of high-resolution (10 m) DEM on Flood Disaster in 3D-GIS M. Mori Department of Information and Computer Science, Kinki University, Japan
Controlling Processes That Change Land
 1 Name Date Controlling Processes That Change Land People try to control some of the processes that change land. To do this, people apply technology- the use of science to solve problems in everyday life.
Figure S1. Refuge North N W. Stackyard Road N W. Refuge South N W. 1 km. NORTH (m) EAST (m)
 EAST (m)") ORT (m) 8 7 8 9 Refuge orth 5 7 8 W -after Sandy Stackyard Road 7 9 W 5 Refuge South 7 8 W A km B 5 EAST (m) Figure S Barnegat Bay LLR8 Delaware Bay LLR 8 Virginia Coast Reserve CLV Pamlico Sound CLK7
ORT (m) 8 7 8 9 Refuge orth 5 7 8 W -after Sandy Stackyard Road 7 9 W 5 Refuge South 7 8 W A km B 5 EAST (m) Figure S Barnegat Bay LLR8 Delaware Bay LLR 8 Virginia Coast Reserve CLV Pamlico Sound CLK7
Coastal Inlets Research Program US Army Corps of Engineers Engineering Research and Development Center
 Coastal Inlets Research Program US Army Corps of Engineers Engineering Research and Development Center Site of Moriches Inlet Nov. 1951 Julie Dean Rosati and Nicholas C. Kraus, CIRP Program Manager Shinnecock
COASTAL GEOLOGIC HAZARDS AND SEA-LEVEL RISE: CLIMATE CHANGE IN RHODE ISLAND
 COASTAL GEOLOGIC HAZARDS AND SEA-LEVEL RISE: CLIMATE CHANGE IN RHODE ISLAND Sakonnet Preservation Association Annual Meeting 9 July 2013 Jon C. Boothroyd 1,2 and Bryan A. Oakley 3 (1) Rhode Island Geological
Quantifying Coastal Evolution using Remote Sensing Approaches
 Quantifying Coastal Evolution using Remote Sensing Approaches Sojan Mathew, Linh Truong Hong, Xavier Pellicer*, Colman Gallagher University College Dublin Geological Survey of Ireland* INFOMAR SEMINAR,
ELEVATION IS FOUNDATIONAL. A DEM that is inaccurate or of poor resolution will pass those characteristics onto other data layers
 ELEVATION IS FOUNDATIONAL A DEM that is inaccurate or of poor resolution will pass those characteristics onto other data layers THE DEM IS FOUNDATIONAL TO ALL GIS (Geospatial Information System) LAYERS
Applications of GIS in assessing Coastal Change Rachel Hehre November 30, 2004 NRS 509 OVERVIEW
 Applications of GIS in assessing Coastal Change Rachel Hehre November 30, 2004 NRS 509 OVERVIEW ITRODUCTION Due to the dynamic nature of coastal systems, representing coastal change with precision and
Effects of Sea Level Rise in Florida
 Abstract International Research Journal of Earth Sciences ISSN 2321 2527 Int. Res.J. Earth Sci. Effects of Sea Level Rise in Florida Praveen Khanna, Udaya Kumar and Riyaz Ahamed Osankhan Department of
Shoreline Evolution: City of Hampton, Virginia Chesapeake Bay, Back River, and Hampton River Shorelines
 Shoreline Evolution: City of Hampton, Virginia Chesapeake Bay, Back River, and Hampton River Shorelines Virginia Insitute of Marine Science College of William & Mary Gloucester Point, Virginia September
Shoreline Evolution: Prince William County, Virginia Potomac River, Occoquan Bay, and Occoquan River Shorelines
 Shoreline Evolution: Prince William County, Virginia Potomac River, Occoquan Bay, and Occoquan River Shorelines Virginia Institute of Marine Science College of William & Mary Gloucester Point, Virginia
European Geosciences Union General Assembly Vienna, Austria 27 April - 02 May 2014
 European Geosciences Union General Assembly Vienna, Austria 27 April - 02 May 2014 Projecting the Current & Future Impact of Storm Surges on Coastal Flood Extent at Pigeon Point, South-West Tobago, through
Shoreline Evolution: Lancaster County, Virginia Rappahannock River and Chesapeake Bay Shorelines
 Shoreline Evolution: Lancaster County, Virginia Rappahannock River and Chesapeake Bay Shorelines Virginia Institute of Marine Science College of William & Mary Gloucester Point, Virginia March 2012 Shoreline
Importance of Understanding Coastal Landforms
 Importance of Understanding Coastal Landforms Costa Concordia Shipwreck, Isola del Giglio, Italy Depositional Coastal Landforms Can interpret landforms in light of geomorphic processes, both terrestrial
Geological record of severe storm impacts along the Texas Coast. Davin Wallace 1, John Anderson 1, Winnie Yu 1 and Antonio Rodriguez 2
 Geological record of severe storm impacts along the Texas Coast Davin Wallace 1, John Anderson 1, Winnie Yu 1 and Antonio Rodriguez 2 1 2 Motivation Understand natural evolution of stressed barrier island
Name Roy G Biv Page 1
 Name Roy G Biv Base your answers to questions 1 through 3 on the diagram below. The arrows show the direction in which sediment is being transported along the shoreline. A barrier beach has formed, creating
Topographical Change Monitoring for Susceptible Landslide Area Determination by Using Multi-Date Digital Terrain Models and LiDAR
 Topographical Change Monitoring for Susceptible Landslide Area Determination by Using Multi-Date Digital Terrain Models and Chanist PRASERTBURANAKUL 1, Parkorn SUWANICH 2, Kanchana NAKHAPAKORN 3, and Sukit
Name NRS 409 Exam I. 1. (24 Points) Consider the following questions concerning standard data for GIS systems.
 Consider the following questions concerning standard data for GIS systems.") Read every question carefully. You may use a calculator if you wish. Conversion tables are provided at the end of the exam. If you have any questions, raise your hand. Be sure to show your work on computational
Read every question carefully. You may use a calculator if you wish. Conversion tables are provided at the end of the exam. If you have any questions, raise your hand. Be sure to show your work on computational
Fugro Geospatial: Turning Spatial Data into Knowledge
 Fugro Geospatial: Turning Spatial Data into Knowledge 2016 Fugro Geospatial, GIS and Consultants Locations Variety of Collection Platforms Traditional Mapping Traditional Mapping Imagery Photogrammetric
STATUS OF HAZARD MAPS VULNERABILITY ASSESSMENTS AND DIGITAL MAPS
 JapanInternational Cooperation Agency STATUS OF HAZARD MAPS VULNERABILITY ASSESSMENTS AND DIGITAL MAPS ANGUILLA REPORT THE CARIBBEAN DISASTER EMERGENCY RESPONSE AGENCY () Table of Contents Page Preface
National Assessment of Hurricane-Induced Coastal Erosion Hazards: Southeast Atlantic Coast
 National Assessment of Hurricane-Induced Coastal Erosion Hazards: Southeast Atlantic Coast By Hilary F. Stockdon, Kara J. Doran, David M. Thompson, Kristin L. Sopkin, and Nathaniel G. Plant Open-File Report
Digital Elevation Models. Using elevation data in raster format in a GIS
 Digital Elevation Models Using elevation data in raster format in a GIS What is a Digital Elevation Model (DEM)? Digital representation of topography Model based on scale of original data Commonly a raster
Mapping of Future Coastal Hazards. for Southern California. January 7th, David Revell, Ph.D. E.
 Mapping of Future Coastal Hazards for Southern California January 7th, 2014 David Revell, Ph.D. drevell@esassoc.com E. Vandebroek, 2012 Outline Coastal erosion hazard zones Flood hazard zones: Coastal
Sediment Management in the Coastal Bays
 Sediment Management in the Coastal Bays Introduction Need for ecosystem view of sediment management in Coastal Bays Island loss and restoration Navigation needs Habitat Trade offs Living Shoreline Requirements
Eagle Creek Post Fire Erosion Hazard Analysis Using the WEPP Model. John Rogers & Lauren McKinney
 Eagle Creek Post Fire Erosion Hazard Analysis Using the WEPP Model John Rogers & Lauren McKinney Columbia River Gorge at Risk: Using LiDAR and GIS-based predictive modeling for regional-scale erosion susceptibility
Coastal Processes and Shoreline Erosion on the Oregon Coast, Cascade Head to Cape Kiwanda
 State of Oregon Department of Geology and Mineral Industries Vicki S. McConnell, State Geologist Open File Report OFR O-04-11 Coastal Processes and Shoreline Erosion on the Oregon Coast, Cascade Head to
South Carolina Coastal Habitats
 South Carolina Coastal Habitats By C. Livingston, 2009 Earth Where is South Carolina? North America United States of America SC Here we are! South Carolina borders the Atlantic Ocean. Did you know? South
Australian Coastal Councils Conference
 Australian Coastal Councils Conference 11 March 2015 Estimating Future Coastal Inundation and Erosion Hazards Dr Andrew McCowan Dr Christine Lauchlan-Arrowsmith Warwick Bishop Background Victorian Future
Beach Recovery Processes in Urban Beach Systems : A Study in Hong Kong after an Extreme Storm Event
 Beach Recovery Processes in Urban Beach Systems : A Study in Hong Kong after an Extreme Storm Event LIFE+ FLANDRE international workshop "Management of coastal dunes and sandy beaches" Session 1. Climate
Weather Middle School Teacher Instructions and Activity
 Weather Middle School Teacher Instructions and Activity Based on the guidelines of the Saffir-Simpson Scale for hurricane severity and the Fujita Scale for tornado damage, students will write a brief synopsis
Development of Operational Storm Surge Guidance to Support Total Water Predictions
 Development of Operational Storm Surge Guidance to Support Total Water Predictions J. Feyen 1, S. Vinogradov 1,2, T. Asher 3, J. Halgren 4, Y. Funakoshi 1,5 1. NOAA/NOS//Development Laboratory 2. ERT,
LIDAR AND BATHYMETRIC REMOTE SENSING APPLICATIONS IN MAPPING COASTAL EROSION YAQUINA HEAD, OREGON
 LIDAR AND BATHYMETRIC REMOTE SENSING APPLICATIONS IN MAPPING COASTAL EROSION YAQUINA HEAD, OREGON By Brooks Adam Hadsall Geography 493/593 Digital Terrain Analysis Photo: Friends of Yaquina Head Lighthouse,
FLOODING. Flood any relatively high stream flow overtopping the natural or artificial banks in a water system.
 CATASTROPHIC EVENTS FLOODING Flood any relatively high stream flow overtopping the natural or artificial banks in a water system. Common Causes: Long-lasting rainfall over a broad area Locally intense
Most natural ecosystems are in a state of equilibrium. This means that their biotic and abiotic features remain relatively constant over time.
 Most natural ecosystems are in a state of equilibrium. This means that their biotic and abiotic features remain relatively constant over time. The major biomes, for example, usually maintain a characteristic
Ecological Succession
 Ecological Succession Most natural ecosystems are in a state of equilibrium. This means that their biotic and abiotic features remain relatively constant over time. The major biomes, for example, usually
Storm Surge/Coastal Inundation State of the Union. Jamie Rhome Storm Surge Team Lead NOAA/National Hurricane Center
 Storm Surge/Coastal Inundation State of the Union Jamie Rhome Storm Surge Team Lead NOAA/National Hurricane Center 2 Tampa: Cat 5 Scenario 3 4 The Stakes are High Combination of SLR and increasing coastal
Hurricane Matthew. National Weather Service Wilmington NC. Steven Pfaff, WCM.
 Hurricane Matthew Threat Assessment for northeast South Carolina & southeast North Carolina National Weather Service Wilmington NC 730 AM EDT Tuesday October 4, 2016 Steven Pfaff, WCM Steven.Pfaff@noaa.gov
Changes in Ecosystems - Natural Events
 Changes in Ecosystems - Natural Events 8A predict and describe how different types of catastrophic events impact ecosystems such as floods, hurricanes, or tornadoes Textbook pages: 396-406 How can ecosystems
MODELLING CATASTROPHIC COASTAL FLOOD RISKS AROUND THE WORLD
 MODELLING CATASTROPHIC COASTAL FLOOD RISKS AROUND THE WORLD Nicola Howe Christopher Thomas Copyright 2016 Risk Management Solutions, Inc. All Rights Reserved. June 27, 2016 1 OUTLINE MOTIVATION What we
Tony Pratt, DNREC to The Center for the Inland Bays Scientific and Technical Advisory Committee. August 21, 2009
 Sea Level Rise in Delaware Presented by Tony Pratt, DNREC to The Center for the Inland Bays Scientific and Technical Advisory Committee August 21, 2009 Sea level has been fluctuating ever since there have
Copyright 2016 Edmentum - All rights reserved.
 Copyright 2016 Edmentum - All rights reserved. SI: Quiz 13 Question #1 The Earth's crust is made up of plates that can move. Which of the following topographic features could be directly formed by the
Storm Induced Coastal Erosion for Flood Insurance Studies and Forecasting Coastal Flood Damage Impacts: Erosion, Runup & Overtopping
 Storm Induced Coastal Erosion for Flood Insurance Studies and Forecasting Coastal Flood Damage Impacts: Erosion, Runup & Overtopping Jeff Gangai- Dewberry Tucker Mahoney FEMA HQ Introduction Background
LANDSCAPES LANDSCAPES HUMAN IMPACT. PART II: People and their 4/10/2018. GEOG 101 Part II People and their Physical Environment R E M I N D E R S
 R E M I N D E R S Get study guide from course home page. TEXTBOOK READING FOR EXAM II WEATHER and CLIMATE: Ch. 2 LITHOSPHERE: chapter 3 BIOSPHERE: chapter 4 EARTH RESOURCES: chapter 5 Two required essays
Coastal Storms of the New Jersey Shore
 Coastal Storms of the New Jersey Shore Dr. Steven G. Decker Dept. of Environmental Sciences School of Environmental and Biological Sciences Rutgers University May 25, 2011 Overview Threats Historical Examples
Chapter 1 Study Guide
 Chapter 1 Study Guide Reminders: Vocabulary quiz and test will be on Tuesday, September 6th. Complete study guide and bring completed to school Friday, September 2nd. You are NOT required to print the
User s Guide to Storm Hazard Maps and Data
 Storm Hazard Assessment for St. Lucia and San Pedro/Ambergris Caye, Belize User s Guide to Storm Hazard Maps and Data Prepared For: Caribbean Development Bank Advanced technology and analysis solving problems
Presentation Outline. Project Overview. Sea Level Rise Assessment & Decision Tools. Community Engagement. Tina Whitman, Friends of the San Juans
 Healthy Beaches for People & Fish Sea Level Rise Adaptation Tools for San Juan County, WA Tina Whitman & Andrea MacLennan December 10, 2015 Presentation Outline Project Overview Tina Whitman, Friends of
By Chris Mikes and David Fleck Digital Terrain Analysis GEOG 593. Overview
 Earthquake and Infrastructure Damage Analysis in Multnomah and Clackamas Counties: The Application of LiDAR In The Development of an Emergency Response Plan By Chris Mikes and David Fleck Digital Terrain
Coastal Barrier Island Network (CBIN): Management strategies for the future
: Management strategies for the future") Coastal Barrier Island Network (CBIN): Management strategies for the future Heather Joesting*, Amy Williams**, Rusty Feagin**, and William K. Smith* *Department of Biology, Wake Forest University, Winston
Coastal Barrier Island Network (CBIN): Management strategies for the future Heather Joesting*, Amy Williams**, Rusty Feagin**, and William K. Smith* *Department of Biology, Wake Forest University, Winston
Notes and Summary pages:
 Topographic Mapping 8.9C Interpret topographical maps and satellite views to identify land and erosional features and predict how these shapes may be reshaped by weathering ATL Skills: Communication taking
Papua New Guinea LiDAR Factsheet. Pacific-Australia Climate Change Science and Adaptation Planning. Vanimo. Bismark Sea. Wewak
 Pacific-Australia Climate Change Science and Adaptation Planning INDONESIA Vanimo Ninigo Group Wewak Madang Mount Hagen Kundiawa Goroka Mendi Daru AUSTRALIA Kerema Gulf of Papua Admiralty Islands Mussau
Some Thoughts on the Role of Elevation
 Some Thoughts on the Role of Elevation Data in Sea-level Rise Impact Assessments Rob Thieler* U.S. Geological Survey Coastal and Marine Geology Program Woods Hole, MA *i l d t i l d f D C h D G h *includes
Welcome Jeff Orrock Warning Coordination Meteorologist National Weather Service Raleigh
 Welcome Jeff Orrock Warning Coordination Meteorologist National Weather Service Raleigh Jeff.orrock@noaa.gov Sources: Operational Significant Event Imagery and the Environmental Applications Team (EAT)
Donald K. Stauble and Bill Birkemeier Coastal and Hydraulics Laboratory US Army Corps of Engineers
 Donald K. Stauble and Bill Birkemeier Coastal and Hydraulics Laboratory US Army Corps of Engineers Define the Problem Navigation Shore Protection Environmental Political So what is the problem? Management
COASTAL DATA APPLICATION
 2015 Coastal GeoTools Proactive By Design. Our Company Commitment COASTAL DATA APPLICATION Projecting Future Coastal Flood Risk for Massachusetts Bay Bin Wang, Tianyi Liu, Daniel Stapleton & Michael Mobile