This Powerpoint presentation summarizes the use of NetMap for a Fire Decision Support System. Created on Sept 25, 2015 by Dr. Lee Benda and Kevin
|
|
|
- Oswald Lambert
- 5 years ago
- Views:
Transcription

1 This Powerpoint presentation summarizes the use of NetMap for a Fire Decision Support System. Created on Sept 25, 2015 by Dr. Lee Benda and Kevin Andras (TerrainWorks). 1
 and (2) riparian processes, specifically impacts on shade, thermal loading and")
2 The general approach strategy: wildfire is evaluated in terms of potential impacts to at-risk infrastructure (roads, structures, water supply, energy) and aquatic/riparian habitats via (1) erosion processes and sediment delivery to streams (surface erosion, gullying, shallow landsliding and post fire road erosion) and (2) riparian processes, specifically impacts on shade, thermal loading and thermal refugia. The approach is designed to provide decision support for (i) pre fire management (vegetation and roads) and (ii) firefighting (including retardant drops). See companion PPT-PDF describing the use of burn severity maps in a similar analysis. 2

3 3

4 This presentation contains some preliminary analyses, final analyses will be available by mid October. 4
 and the purpose of the data layers.")
5 A listing of decision support activities (left panel), the NetMap data layers to support it (middle panel) and the purpose of the data layers. 5

6 Here is a list of the various models and data sources there were used in the Fire and Fish analysis. 6

7 These are the general data deliverables and their formats within ArcMap shapefiles. 7

8 The analytical foundation for the Fire and Fish Analysis is NetMap s synthetic stream network and virtual watersheds. For brevity, this important topic is left for the viewers to explore as they need to; see for additional background information or NetMap s online Technical Help materials. 8
 models (Burnett et al.")
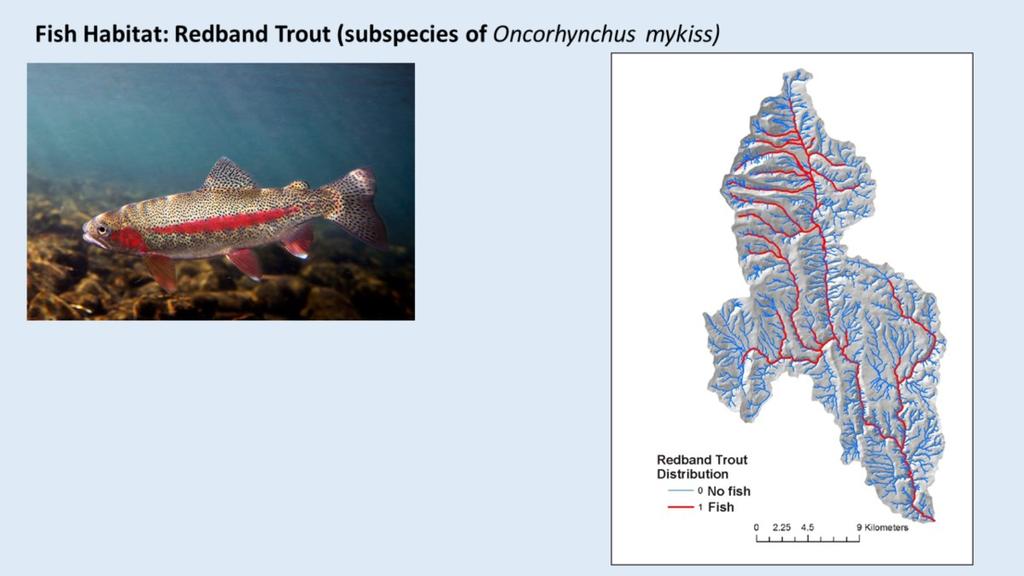
9 US Forest Service data on distribution of Bull Trout and Redband Trout were used in the analysis. Habitat intrinsic potential (HIP) models (Burnett et al. 2007) were applied for steelhead and Chinook. 9
10 10

11 Fire severity in terms of flame length was obtained from agency Flammap predictions (WWETAC). 11
, via drainage wings, and aggregated downstream.")
12 Fire severity is reported to individual channel segments (left), via drainage wings, and aggregated downstream. 12
.")
13 Fire probability was obtained from agency Flammap predictions (WWETAC). 1/probability = fire recurrence interval. 13

14 Post fire erosion and channel sedimentation are predicted for surface erosion, gullying and shallow landsliding. 14
 indicating variable surface erosion illustrates the variable sizes and shapes of local contributing areas or drainage wings.")
15 Post fire surface erosion was predicted using the WEPP-disturbed model. The color patterns (right panel) indicating variable surface erosion illustrates the variable sizes and shapes of local contributing areas or drainage wings. See NetMap s online technical help materials for additional information: 15
, the latter revealing erosion patterns at the tributary and subbasin scale.")
16 Predicted surface erosion is transferred to individual stream segments (left) and aggregated downstream (right), the latter revealing erosion patterns at the tributary and subbasin scale. 16

17 An gully erosion model was used in the analysis (Parker et al. 2010). See NetMap s online technical help materials for additional information. 17

18 A shallow landslide model (Miller and Burnett 2007) based on hillslope gradient and curvature was used in the analysis. See NetMap s online technical help materials for additional information: 18

19 19
20 20

21 Roads can be significant sources of flooding, erosion and sediment delivery to streams, post fire. 21

22 The model GRAIP-Lite for sediment production was coupled to NetMap s conservation of mass sediment delivery model (see end of pptx for additional details). 22

23 Fire reduces infiltration capacity and thus allows greater sediment travel distances from roads to streams and hence greater road-stream connectivity. 23

24 Predicted sediment delivery is mapped to the road network for pre and post fire conditions; little change can be see because of the board legend classes, but see next slide. 24

25 A difference map of road sediment delivery reveals that some road segments are more sensitive to fire reductions in infiltration capacity compared to others. 25

26 Stream reaches where post fire road sediment delivery is predicted to increase; some of these reaches overlap sensitive fish habitats. 26

27 Differences in pre and post fire road erosion sediment delivery is routed or aggregated downstream, revealing tributary and subbasin patterns. This information was also aggregated to the HUC 6 th subbasin. 27
28 28

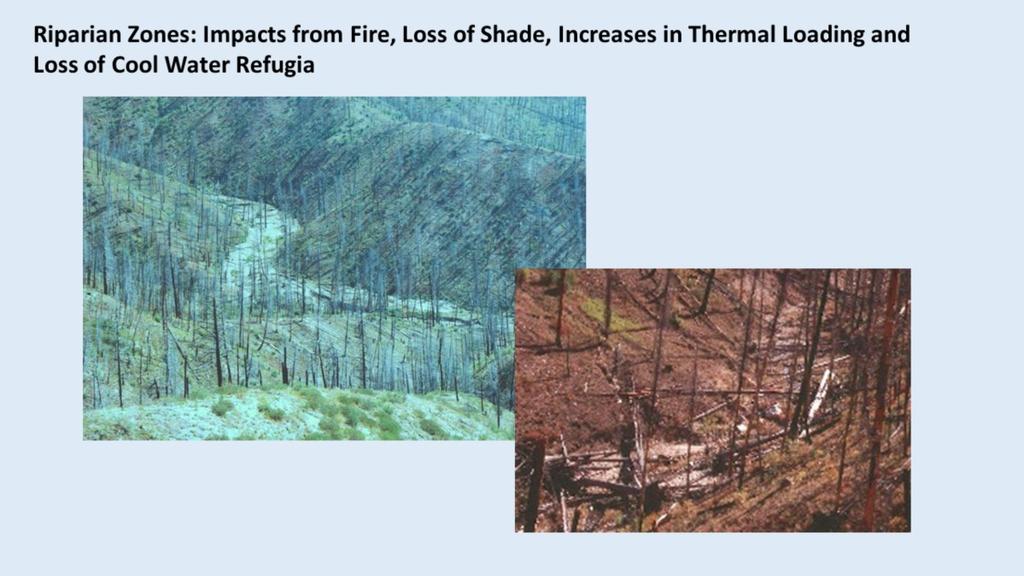
29 A shade model was used to estimate the effects of vegetation on reducing thermal energy to streams. Shorter, denser vegetation provides more shade, but the shadow length is smaller. Taller older trees have less dense vegetation mid crown that can reduce the shade, but they have a longer shadow length. We used a simple linear relationship between percent shade and predicted flame length. To learn more about this modeling approach, go to NetMap s online technical help materials: m 29

30 Predicted thermal energy to streams under current (no fire) shade conditions (using LEMMA vegetation data ( and fire-reduced shade. Many channel segments receive higher thermal loading, post fire. Some areas like the lower right hand corner are south facing with little topographic shading, and thus do not exhibit much change. 30

31 A difference map is produced from the previous slide s data, revealing which channel segments would be most sensitive to fire-induced reductions in shade, according to the predicted fire severity (flame length). 31

32 The information from the previous slide is aggregated downstream, revealing tributary and subbasin scale patterns of increasing thermal conditions due to fire and its variable intensity. 32
 and sensitive aquatic habitats, as illustrated above.")
33 Information provided in the Fire and Fish analysis (previous slides, among other data) can be used visually and qualitatively to search for intersections or overlaps between various fire related stressors (erosion, roads, thermal) and sensitive aquatic habitats, as illustrated above. Or one of NetMap s tools (Habitat-Stressor Overlap Tool) can be used quantitatively to locate overlaps and intersections (see next slide). 33
, and the analyst, using the tool, selects from the")
34 NetMap s Quick Tool that contains the Habitat-Stressor overlap capability can be used to locate intersections between fire related impacts and sensitive fish habitats. The tool calculates, on the fly, the full frequency distribution of values (shown as the cumulative distribution of values in this slide), and the analyst, using the tool, selects from the distributions to search for overlaps. For example, an analyst can quickly search for intersections among the highest 10% of fire severity, highest 5% of post fire surface erosion (or landsliding or gullying), highest 10% of fire related increases in thermal loading, and fish habitats (either presence of habitat or some numeric value of habitat quality [used in IP]). For additional information, see NetMap s online technical help that describes the overlap tool: reaches.htm And the Quick Tool, which is provided as part of this analysis: 34

35 All analysis results are summarized to the HUC 6 th subbasin scale. This can be used to examine subbasin scale patterns of fire related attributes and stressors and the locations of aquatic habitats. Subbasin scale data summaries may be most useful at the scale of larger watersheds or entire national forests. 35
 could be used to direct on the ground firefighting to protect important")
36 NetMap s Fire and Fish analysis could be used to inform firefighting, including retardant drops. For example, critical riparian-fish habitat zones, using the shadethermal results and fish distributions (or IP mapping) could be used to direct on the ground firefighting to protect important riparian forests. The analysis can also be used to inform locations where retardant drops should be avoided or allowed. For example, a relevant question is whether long term loss of critical riparian habitats (and resultant long term increases in thermal loading and a loss of thermal refugia) outweights short term retardant in water impacts. 36

37 This is the approach for identifying retardant avoidance and retardant Yes areas, used by the Willamette National Forest. We modified this approach in the following slides. 37

38 38
 (all fish bearing channels are included in the avoidance areas in both maps).")
39 300 foot buffers on both sides of NetMap s synthetic stream layer (left) compared to first-order channels (likely ephemeral channels, dry in fire season) removed from the retardant avoidance areas (right) (all fish bearing channels are included in the avoidance areas in both maps). This is only an illustration, and it used the NorWest data (NHD-based) on Bull Trout, not the US Forest Service more extensive Bull Trout habitat distribution. Agency analysts will need to conduct their own GIS buffering, although TerrainWorks uses a customized program that employs drainage wings for accurate buffering (contact TerrainWorks for additional details). 39
 Areas of critical riparian-aquatic habitats (defined as the highest 30% of thermally impacted reaches due to shade loss from fire, overlapped with Bull Trout habitat) have been removed from")
40 (Left) Avoidance areas that do not include first-order channels. (Right) Areas of critical riparian-aquatic habitats (defined as the highest 30% of thermally impacted reaches due to shade loss from fire, overlapped with Bull Trout habitat) have been removed from the left panel avoidance areas. Agency analysts can use the Habitat-Stressor Overlap function in NetMap s Quick Tool (provided as an add-in ArcMap) to identify other combinations of critical habitats to protect. This is only an illustration, and it used the NorWest data (NHD-based) on Bull Trout, not the US Forest Service more extensive Bull Trout habitat distribution. Agency analysts will need to conduct their own GIS buffering and the selection of what constitutes critical riparian and aquatic habitats. However,TerrainWorks uses a customized program that employs drainage wings for accurate buffering (contact TerrainWorks for additional details). 40
 where selecting an attribute from a drop down list and displaying it is made easy.")
41 The analysis results are provided as a set of shapefiles that can be loaded into ArcMap (a table in a provided document lists the attribute field names and shapefile locations). In addition, the results can be accessed from NetMap s Quick Tool (provided) where selecting an attribute from a drop down list and displaying it is made easy. In addition, the Quick Tool contains the stressor-habitat overlap tool for making quick searches for up to 5 attribute combinations of data, such as the highest 10% of thermal impacts by fire overlapped with Bull Trout habitat. To learn more about the Quick Tool, go to: To learn more about its overlap tool, go here: reaches.htm 41
 is organized by main")
42 The drop down list of analysis results in the Quick Tool (previous slide) is organized by main 42

43 43

44 44
45 45

46 The data structure of the virtual watershed includes a synthetic river network (derived from DEMs and the NHD) and drainage wings, local contributing areas located on both sides of 100 m channel segments. Each channel segment has a corresponding set of local contributing areas or drainage wings. 46
 and all information on hillsides is then summarized to channels.")
47 The drainage wings discretize the watershed terrestrial environment into small areas (approx. 0.1 km 2 in area) and all information on hillsides is then summarized to channels. This supports analysis of aquatic habitat-terrestrial stressor intersections. 47

48 Here is an example of how a terrestrial (hillside) attribute is transferred to the channel network and aggregated downstream. These types of channel attributes can then be compared to other channel attributes such as fish habitat or other watershed characteristics, like thermal refugia. 48

49 The data deliverables come at a range of scales including (1) hillside raters or grids (at the scale of the DEM), (2) individual stream segments (~100 m), (3) hillside drainage wings (local contributing areas, ~ 0.1 km2), (4) stream segment data aggregated downstream, (5) road segments broken a pixel boundaries and re-aggregated for various purposes, including hydrologic connectivity and (6) data summarized at the scale of HUC 6 subbasins. 49
50 50

51 The GRAIP-Lite model (RMRS, Luce, Black and Nelson) was used in the analysis. See NetMap s online technical help materials for additional information: 51

52 The GRAIP-Lite sediment delivery component was modified in NetMap, using a steady state, conservation of mass approach. For additional information, see NetMap s online technical help: 52

53 53

54 54
55 Fire can impact road erosion sediment delivery by reducing the infiltration capacity of the forest floor (if burned). Lower infiltration capacity can lead to longer sediment plume lengths and greater connectivity between forest roads and stream channels. 55

56 We selected a non fire forest floor infiltration rate of 60 mm/hr; this was reduced based on predicted fire severity as indicated above. 56

57 A design storm is needed in NetMap s sediment delivery model. We choose a short duration 10-year storm to mimic thunderstorm activity, post fire. 57
Welcome to NetMap Portal Tutorial
 Welcome to NetMap Portal Tutorial Potential Applications What Can you do with the Portal? At least 25 things! 1) Locate the best potential fish habitats. 2) Identify biological hotspots. 3) Map floodplain
NetMap''' Watershed'Database'and'Analysis'System'
 NetMap' Watershed'Database'and'Analysis'System' Earth'Systems'Ins8tute' Sea:le/Mt.'Shasta/Fort'Collins' NetMap: A collaborative enterprise since 2007 -US National Forests (WA, OR, NCA, AK, ID, MT) -US
What is a watershed or landscape perspective?
 What is a watershed or landscape perspective? -remove sediment -add sediment -add wood, riparian manipulation -alter (engineer) channel/floodplain morphology -restore/abandon roads You are here What is
1) NetMap Overview. 2) Habitat modeling HIP & Beyond. 3) What do you do with habitat models? 4) NetMap a platform for regional analysis & interactions
 NetMap Overview. 2) Habitat modeling HIP & Beyond. 3) What do you do with habitat models? 4) NetMap a platform for regional analysis & interactions") 1) NetMap Overview 2) Habitat modeling HIP & Beyond 3) What do you do with habitat models? 4) NetMap a platform for regional analysis & interactions Overview Multiple analysis tools Creates universal stream/hillslope
1) NetMap Overview 2) Habitat modeling HIP & Beyond 3) What do you do with habitat models? 4) NetMap a platform for regional analysis & interactions Overview Multiple analysis tools Creates universal stream/hillslope
Dan Miller + Kelly Burnett, Kelly Christiansen, Sharon Clarke, Lee Benda. GOAL Predict Channel Characteristics in Space and Time
 Broad-Scale Models Dan Miller + Kelly Burnett, Kelly Christiansen, Sharon Clarke, Lee Benda GOAL Predict Channel Characteristics in Space and Time Assess Potential for Fish Use and Productivity Assess
Erosion, Sediment Sources, and Channel Analysis in the Crystal River, Colorado
 Earth Systems Institute Erosion, Sediment Sources, and Channel Analysis in the Crystal River, Colorado Lee Benda and Sandra (Sam) Litschert Mt Shasta, CA/ Fort Collins, CO 10-23-2013 Contents Introduction...
Erosion, Sediment Sources, and Channel Analysis in the Crystal River Watershed, Colorado
 Earth Systems Institute Erosion, Sediment Sources, and Channel Analysis in the Crystal River Watershed, Colorado Lee Benda and Sandra (Sam) Litschert Mt Shasta, CA/ Fort Collins, CO 10-23-2013 Contents
Start of Presentation: No notes (Introductory Slide 1) 1) Salmonid Habitat Intrinsic Potential (IP) models are a type of habitat potential
 1) Salmonid Habitat Intrinsic Potential (IP) models are a type of habitat potential") The What and How of Salmonid Habitat Intrinsic Potential Modeling Start of Presentation: No notes (Introductory Slide 1) 1) Salmonid Habitat Intrinsic Potential (IP) models are a type of habitat potential
The What and How of Salmonid Habitat Intrinsic Potential Modeling Start of Presentation: No notes (Introductory Slide 1) 1) Salmonid Habitat Intrinsic Potential (IP) models are a type of habitat potential
Analysis of Road Sediment Accumulation to Monumental Creek using the GRAIP Method
 Analysis of Road Sediment Accumulation to Monumental Creek using the GRAIP Method Introduction (from http://www.neng.usu.edu/cee/faculty/dtarb/graip/#over): The Geomorphologic Road Analysis and Inventory
Exercise 6: Using Burn Severity Data to Model Erosion Risk
 Exercise 6: Using Burn Severity Data to Model Erosion Risk Document Updated: November 2009 Software Versions: ERDAS Imagine 9.3 and ArcGIS 9.3, Microsoft Office 2007 Introduction A common use of burn severity
Great Lakes Online Watershed Interface W. Elliot, Research Engineer USDA Forest Service Rocky Mountain Research Station, Moscow, ID March, 2016
 Great Lakes Online Watershed Interface W. Elliot, Research Engineer USDA Forest Service Rocky Mountain Research Station, Moscow, ID March, 2016 Guidelines for using the Web WEPP Watershed Tool to Support
Mobrand to Jones and Stokes. Sustainable Fisheries Management Use of EDT
 Sustainable Fisheries Management Use of EDT Ecosystem Diagnosis and Treatment EDT EDT designed to provide a practical, science-based approach for developing and implementing watershed plans. Provides decision
Hydrography - the building block of IP - Session Guide
 Hydrography - the building block of IP - Session Guide Lead(s): Mindi Sheer (NOAA), Dan Miller (ESI), Bill Kaiser (USFS), Group Goal: discuss technical hydro considerations independent of source, review
Eagle Creek Post Fire Erosion Hazard Analysis Using the WEPP Model. John Rogers & Lauren McKinney
 Eagle Creek Post Fire Erosion Hazard Analysis Using the WEPP Model John Rogers & Lauren McKinney Columbia River Gorge at Risk: Using LiDAR and GIS-based predictive modeling for regional-scale erosion susceptibility
Columbia Estuary Province
 Rolling Provincial Review: Implementation 2001-2004 Province 73 Columbia Basin Fish & Wildlife Authority Province FY 2001-2004 Spending Summaries NPCC Recommendations and BPA Spending by Project Category,
Kootenai River Habitat Restoration Program Update
 Kootenai River Habitat Restoration Program Update Kootenai Tribe of Idaho Kootenai Valley Resource Initiative November 19, 2012 Bonners Ferry, Idaho Changes to Kootenai Basin Beaver trapping Floodplain
A GIS Tool to Analyze Forest Road Sediment Production and Stream Impacts
 A GIS Tool to Analyze Forest Road Sediment Production and Stream Impacts Ajay Prasad, David G Tarboton, Charles H Luce, Thomas A. Black Abstract A set of GIS tools to analyze the impacts of forest roads
EFFECTS OF RIPARIAN RETENTION (IN WATERSHEDS) ON ALLUVIAL FANS
 ON ALLUVIAL FANS") EFFECTS OF RIPARIAN RETENTION (IN WATERSHEDS) ON ALLUVIAL FANS TIM GILES GEOMORPHOLOGIST FLNRO EFFECTS OF RIPARIAN RETENTION (IN WATERSHEDS) ON ALLUVIAL FANS Description of alluvial fans Three case studies
EFFECTS OF RIPARIAN RETENTION (IN WATERSHEDS) ON ALLUVIAL FANS TIM GILES GEOMORPHOLOGIST FLNRO EFFECTS OF RIPARIAN RETENTION (IN WATERSHEDS) ON ALLUVIAL FANS Description of alluvial fans Three case studies
ROAD SEDIMENT ASSESSMENT & MODELING: KOOTENAI-FISHER TMDL PLANNING AREA ROAD GIS LAYERS & SUMMARY STATISTICS
 ROAD SEDIMENT ASSESSMENT & MODELING: KOOTENAI-FISHER TMDL PLANNING AREA ROAD GIS LAYERS & SUMMARY STATISTICS Prepared by: ATKINS Water Resources Group 820 North Montana Avenue Helena, MT 59601 November
Case Study 2: Twenty-mile Creek Rock Fords
 Case Study : Twenty-mile Creek Rock Fords Location Crossing Description Washington. Okanagan National Forest. Methow Valley Ranger District. Chewuch river basin, East Chewuch Road. The Twenty-mile Creek
Watershed concepts for community environmental planning
 Purpose and Objectives Watershed concepts for community environmental planning Dale Bruns, Wilkes University USDA Rural GIS Consortium May 2007 Provide background on basic concepts in watershed, stream,
Lower South Fork McKenzie River Floodplain Enhancement Project
 Lower South Fork McKenzie River Floodplain Enhancement Project McKenzie River Ranger District Willamette National Forest Project Location The project is located in the South Fork McKenzie River Watershed,
Conceptual Model of Stream Flow Processes for the Russian River Watershed. Chris Farrar
 Conceptual Model of Stream Flow Processes for the Russian River Watershed Chris Farrar Several features of creeks affect the interactions between surface and groundwater. This conceptual model uses the
GRAPEVINE LAKE MODELING & WATERSHED CHARACTERISTICS
 GRAPEVINE LAKE MODELING & WATERSHED CHARACTERISTICS Photo Credit: Lake Grapevine Boat Ramps Nash Mock GIS in Water Resources Fall 2016 Table of Contents Figures and Tables... 2 Introduction... 3 Objectives...
Remote Sensing and GIS Applications for Hilly Watersheds SUBASHISA DUTTA DEPARTMENT OF CIVIL ENGINEERING IIT GUWAHATI
 Remote Sensing and GIS Applications for Hilly Watersheds SUBASHISA DUTTA DEPARTMENT OF CIVIL ENGINEERING IIT GUWAHATI Deciding Alternative Land Use Options in a Watershed Using GIS Source: Anita Prakash
Little Blackfoot TPA 2009 Sediment and Habitat Assessment QAQC Review March 9, 2010
 Little Blackfoot TPA 2009 Sediment and Habitat Assessment QAQC Review March 9, 2010 1.0 PROJECT OVERVIEW Sediment and habitat monitoring in the Little Blackfoot TPA was conducted in July of 2009 as outlined
Conservation Planning evaluate land management alternatives to reduce soil erosion to acceptable levels. Resource Inventories estimate current and
 Conservation Planning evaluate land management alternatives to reduce soil erosion to acceptable levels. Resource Inventories estimate current and projected erosion levels and their impact on natural resource
SECTION G SEDIMENT BUDGET
 SECTION G SEDIMENT BUDGET INTRODUCTION A sediment budget has been constructed for the for the time period 1952-2000. The purpose of the sediment budget is to determine the relative importance of different
What s New in Topographic Information - USGS National Map
 + What s New in Topographic Information - USGS National Map SARGIS Workshop November 14, 2016 Rob Dollison, 703-648-5724 rdollison@usgs.gov + USGS 2 National Geospatial Program The National Geospatial
Using Big Interagency Databases to Identify Climate Refugia for Idaho s Species of Concern
 Using Big Interagency Databases to Identify Climate Refugia for Idaho s Species of Concern What is a Climate Refugia? habitat that supports a locally reproducing population [or key life history stage]
Birch Creek Geomorphic Assessment and Action Plan
 Birch Creek Geomorphic Assessment and Action Plan Jim Webster Tim Hanrahan, PhD, CFM Jesse Schwartz, PhD Zach Hill January 22, 2015 White Eagle Grange This Project is a First Step in Strategy Planning
PREDICTING BACKGROUND AND RISK-BASED SEDIMENTATION FOR FOREST WATERSHED TMDLS
 This is not a peer-reviewed article. Watershed Management to Meet Water Quality Standards and TMDLS (Total Maximum Daily Load) Proceedings of the Fourth Conference 10-14 March 2007 (San Antonio, Texas
3/3/2013. The hydro cycle water returns from the sea. All "toilet to tap." Introduction to Environmental Geology, 5e
 Introduction to Environmental Geology, 5e Running Water: summary in haiku form Edward A. Keller Chapter 9 Rivers and Flooding Lecture Presentation prepared by X. Mara Chen, Salisbury University The hydro
Savannah District s Revised SOP: Moving Towards A Functional Approach. US Army Corps of Engineers BUILDING STRONG
 Savannah District s Revised SOP: Moving Towards A Functional Approach US Army Corps of Engineers Agenda SOP Revision Concept New Aquatic Resource Credit Types New Urban Mitigation Service Area Filter Background
Introducing Iowa StreamStats Version 4, a Redesign of the USGS Application for Estimating Streamflow Stats
 Introducing Iowa StreamStats Version 4, a Redesign of the USGS Application for Estimating Streamflow Stats Presented at the 2016 Iowa Water Conference Ames, IA March 24, 2016 by David Eash U.S. Geological
Chapter 6. Fundamentals of GIS-Based Data Analysis for Decision Support. Table 6.1. Spatial Data Transformations by Geospatial Data Types
 Chapter 6 Fundamentals of GIS-Based Data Analysis for Decision Support FROM: Points Lines Polygons Fields Table 6.1. Spatial Data Transformations by Geospatial Data Types TO: Points Lines Polygons Fields
Hannah Moore CEE Juvenile Bull Trout Distribution in the South Fork Walla Walla River, Oregon
 Hannah Moore CEE 6440 Juvenile Bull Trout Distribution in the South Fork Walla Walla River, Oregon Introduction Bull trout (Salvelinus confluentus) are an endangered species historically found throughout
Opportunities to Improve Ecological Functions of Floodplains and Reduce Flood Risk along Major Rivers in the Puget Sound Basin
 Opportunities to Improve Ecological Functions of Floodplains and Reduce Flood Risk along Major Rivers in the Puget Sound Basin Christopher Konrad, US Geological Survey Tim Beechie, NOAA Fisheries Managing
Wetland & Floodplain Functional Assessments and Mapping To Protect and Restore Riverine Systems in Vermont. Mike Kline and Laura Lapierre Vermont DEC
 Wetland & Floodplain Functional Assessments and Mapping To Protect and Restore Riverine Systems in Vermont Mike Kline and Laura Lapierre Vermont DEC NWI+ Hydro-Geomorphic Characterization of Wetlands and
Assessment and valuation of Ecosystem Services for decision-makers
 Assessment and valuation of Ecosystem Services for decision-makers An introduction to the ARIES approach Ferdinando Villa *, Ken Bagstad Gary Johnson, Marta Ceroni *Basque Center for Climate Change, Bilbao,
SCOPE OF PRESENTATION STREAM DYNAMICS, CHANNEL RESTORATION PLANS, & SEDIMENT TRANSPORT ANALYSES IN RELATION TO RESTORATION PLANS
 DESIGN METHODS B: SEDIMENT TRANSPORT PROCESSES FOR STREAM RESTORATION DESIGN PETER KLINGEMAN OREGON STATE UNIVERSITY CIVIL ENGINEERING DEPT., CORVALLIS 2 ND ANNUAL NORTHWEST STREAM RESTORATION DESIGN SYMPOSIUM
Roger Andy Gaines, Research Civil Engineer, PhD, P.E.
 Roger Andy Gaines, Research Civil Engineer, PhD, P.E. Research Civil Engineer/Regional Technical Specialist Memphis District August 24, 2010 Objectives Where we have been (recap of situation and what s
Section 4: Model Development and Application
 Section 4: Model Development and Application The hydrologic model for the Wissahickon Act 167 study was built using GIS layers of land use, hydrologic soil groups, terrain and orthophotography. Within
Landslide Computer Modeling Potential
 Landslide Computer Modeling Potential Michael D. Dixon, P.E. Civil Engineer Payette National Forest The Payette National Forest selected the Stability Index Mapping (SINMAP) model for use in identifying
Geospatial Fire Behavior Modeling App to Manage Wildfire Risk Online. Kenyatta BaRaKa Jackson US Forest Service - Consultant
 Geospatial Fire Behavior Modeling App to Manage Wildfire Risk Online Kenyatta BaRaKa Jackson US Forest Service - Consultant Fire Behavior Modeling and Forest Fuel Management Modeling Fire Behavior is an
How Do Human Impacts and Geomorphological Responses Vary with Spatial Scale in the Streams and Rivers of the Illinois Basin?
 How Do Human Impacts and Geomorphological Responses Vary with Spatial Scale in the Streams and Rivers of the Illinois Basin? Bruce Rhoads Department of Geography University of Illinois at Urbana-Champaign
Workshops funded by the Minnesota Environment and Natural Resources Trust Fund
 Workshops funded by the Minnesota Environment and Natural Resources Trust Fund Conservation Applications of LiDAR Data Workshops funded by: Minnesota Environment and Natural Resources Trust Fund Presented
Flood Inundation Mapping
 KU GIS Day 2009 November 18, 2009 Flood Inundation Mapping Wendy L. Pearson NOAA s National Weather Service Central Region Headquarters Kansas City, Missouri Flood Inundation Mapping Objectives: Overview
NATIONAL HYDROGRAPHY DATASET (NHD) UPDATE PROJECT FOR US FOREST SERVICE REGION 3
 UPDATE PROJECT FOR US FOREST SERVICE REGION 3") NATIONAL HYDROGRAPHY DATASET (NHD) UPDATE PROJECT FOR US FOREST SERVICE REGION 3 Allison Moncada California State University, Northridge February 2018 July 2018 Advisor: Joel Osuna Center for Geospatial
NATIONAL HYDROGRAPHY DATASET (NHD) UPDATE PROJECT FOR US FOREST SERVICE REGION 3 Allison Moncada California State University, Northridge February 2018 July 2018 Advisor: Joel Osuna Center for Geospatial
The Interaction Between Trees and the Landscape Through Debris Flows
 The Interaction Between Trees and the Landscape Through Debris Flows Stephen T. Lancaster 1, Shannon K. Hayes 1, and Gordon E. Grant 2 1. Dept. of Geosciences, Oregon State University (slancast@fsl.orst.edu)
Using ArcGIS for Hydrology and Watershed Analysis:
 Using ArcGIS 10.2.2 for Hydrology and Watershed Analysis: A guide for running hydrologic analysis using elevation and a suite of ArcGIS tools Anna Nakae Feb. 10, 2015 Introduction Hydrology and watershed
Chapter 1 Overview of Maps
 Chapter 1 Overview of Maps In this chapter you will learn about: Key points when working with maps General types of maps Incident specific maps Map legend and symbols Map sources A map is a navigational
Use of Thematic Mapper Satellite Imagery, Hemispherical Canopy Photography, and Digital Stream Lines to Predict Stream Shading
 Use of Thematic Mapper Satellite Imagery, Hemispherical Canopy Photography, and Digital Stream Lines to Predict Stream Shading David Nagel GIS Analyst Charlie Luce Research Hydrologist Bárbara Gutiérrez
Distinct landscape features with important biologic, hydrologic, geomorphic, and biogeochemical functions.
 1 Distinct landscape features with important biologic, hydrologic, geomorphic, and biogeochemical functions. Have distinguishing characteristics that include low slopes, well drained soils, intermittent
GIS Application in Landslide Hazard Analysis An Example from the Shihmen Reservoir Catchment Area in Northern Taiwan
 GIS Application in Landslide Hazard Analysis An Example from the Shihmen Reservoir Catchment Area in Northern Taiwan Chyi-Tyi Lee Institute of Applied Geology, National Central University, No.300, Jungda
Figure 0-18: Dendrogeomorphic analysis of streambank erosion and floodplain deposition (from Noe and others, 2015a)
") Appendix 9A: Stream to River During the development of the Phase 6 Watershed Model, multiple methods for determining coefficients were often attempted. In some cases, the methods are averaged or otherwise
Appendix 9A: Stream to River During the development of the Phase 6 Watershed Model, multiple methods for determining coefficients were often attempted. In some cases, the methods are averaged or otherwise
Four Beetles Project Mendocino National Forest
 Four Beetles Project Mendocino National Forest Jose Chavez Bakersfield College 06/07/2016-08/02/2016 District Archeologist Curtis Fair & District Hydrologist John Kelley 2016 Acknowledgements: This project
How to Model Stream Temperature Using ArcMap
 How to Model Stream Temperature Using ArcMap Take note: Assumption before proceeding: A temperature point file has been attributed with TauDEM variables. There are three processes described in this document.
Estimating Stream Gradient Using NHD Stream Lines and DEM Data
 Estimating Stream Gradient Using NHD Stream Lines and DEM Data David Nagel, John M. Buffington, and Daniel Isaak U.S. Forest Service, Rocky Mountain Research Station Boise Aquatic Sciences Lab Boise, ID
TABLE OF CONTENTS LIST OF TABLES. Page
 TABLE OF CONTENTS Page 11.0 EFFECTS OF THE ENVIRONMENT ON THE PROJECT... 11-1 11.1 Weather Conditions... 11-1 11.2 Flooding... 11-2 11.3 Forest Fires... 11-2 11.4 Permafrost and Subsidence Risk... 11-3
Floodplain modeling. Ovidius University of Constanta (P4) Romania & Technological Educational Institute of Serres, Greece
 Romania & Technological Educational Institute of Serres, Greece") Floodplain modeling Ovidius University of Constanta (P4) Romania & Technological Educational Institute of Serres, Greece Scientific Staff: Dr Carmen Maftei, Professor, Civil Engineering Dept. Dr Konstantinos
Floodplain modeling Ovidius University of Constanta (P4) Romania & Technological Educational Institute of Serres, Greece Scientific Staff: Dr Carmen Maftei, Professor, Civil Engineering Dept. Dr Konstantinos
STREAM SYSTEMS and FLOODS
 STREAM SYSTEMS and FLOODS The Hydrologic Cycle Precipitation Evaporation Infiltration Runoff Transpiration Earth s Water and the Hydrologic Cycle The Hydrologic Cycle The Hydrologic Cycle Oceans not filling
Precipitation Evaporation Infiltration Earth s Water and the Hydrologic Cycle. Runoff Transpiration
 STREAM SYSTEMS and FLOODS The Hydrologic Cycle Precipitation Evaporation Infiltration Earth s Water and the Hydrologic Cycle Runoff Transpiration The Hydrologic Cycle The Hydrologic Cycle Oceans not filling
ADDRESSING GEOMORPHIC AND HYDRAULIC CONTROLS IN OFF-CHANNEL HABITAT DESIGN
 ADDRESSING GEOMORPHIC AND HYDRAULIC CONTROLS IN OFF-CHANNEL HABITAT DESIGN Conor Shea - Hydrologist U.S. Fish and Wildlife Service Conservation Partnerships Program Arcata, CA Learning Objectives Examine
Improvement of the National Hydrography Dataset for Parts of the Lower Colorado Region and Additional Areas of Importance to the DLCC
 Improvement of the National Hydrography Dataset for Parts of the Lower Colorado Region and Additional Areas of Importance to the DLCC Carlos Reyes-Andrade California State University, Northridge September
Using the Stock Hydrology Tools in ArcGIS
 Using the Stock Hydrology Tools in ArcGIS This lab exercise contains a homework assignment, detailed at the bottom, which is due Wednesday, October 6th. Several hydrology tools are part of the basic ArcGIS
Recent findings related to measuring and modeling forest road erosion
 18 th World IMACS / MODSIM Congress, Cairns, Australia 13-17 July 2009 http://mssanz.org.au/modsim09 Recent findings related to measuring and modeling forest road erosion W. J. Elliot 1, R. B. Foltz 1
Appendix I: The Summit-at-Snoqualmie Master Development Plan Proposal FEIS Physical and Biological Resource Data Tables
 Appendix I: The Summit-at-Snoqualmie Master Development Plan Proposal FEIS Physical and Biological Resource Data Tables DPC Tables Rationale for DPC Analysis Parameters for 7 th Field Watersheds for The
Gully Erosion Part 1 GULLY EROSION AND ITS CAUSES. Introduction. The mechanics of gully erosion
 Gully Erosion Part 1 GULLY EROSION AND ITS CAUSES Gully erosion A complex of processes whereby the removal of soil is characterised by incised channels in the landscape. NSW Soil Conservation Service,
National Hydrography Dataset (NHD) Update Project for US Forest Service Region 3
 Update Project for US Forest Service Region 3") National Hydrography Dataset (NHD) Update Project for US Forest Service Region 3 Allison Moncada California State University, Northridge February 2017 July 2017 Advisor: Joel Osuna Center for Geographical
National Hydrography Dataset (NHD) Update Project for US Forest Service Region 3 Allison Moncada California State University, Northridge February 2017 July 2017 Advisor: Joel Osuna Center for Geographical
Why Geomorphology for Fish Passage
 Channel Morphology - Stream Crossing Interactions An Overview Michael Love Michael Love & Associates mlove@h2odesigns.com (707) 476-8938 Why Geomorphology for Fish Passage 1. Understand the Scale of the
The River Restoration Centre therrc.co.uk. Understanding Fluvial Processes: supporting River Restoration. Dr Jenny Mant
 The River Restoration Centre therrc.co.uk Understanding Fluvial Processes: supporting River Restoration Dr Jenny Mant Jenny@therrc.co.uk Understanding your catchment Hydrology Energy associated with the
Monitoring Headwater Streams for Landscape Response to
 Monitoring Headwater Streams for Landscape Response to Climate Change Matthew Connor, PhD Connor nvironmental, nc. www.oe-i.com icom Healdsburg, California verview Headwater stream geomorphology Response
Do you think sediment transport is a concern?
 STREAM RESTORATION FRAMEWORK AND SEDIMENT TRANSPORT BASICS Pete Klingeman 1 What is Your Restoration Project Like? k? Do you think sediment transport is a concern? East Fork Lewis River, WA Tidal creek,
IJESRT INTERNATIONAL JOURNAL OF ENGINEERING SCIENCES & RESEARCH TECHNOLOGY
 IJESRT INTERNATIONAL JOURNAL OF ENGINEERING SCIENCES & RESEARCH TECHNOLOGY Use of Digital Elevation Model to compute Storm Water Drainage Network Manisha Desai *1, Dr. J. N. Patel 2 *1 Ph. D. Student of
Restoration Goals TFG Meeting. Agenda
 San Joaquin River Restoration Program Restoration Goals TFG Meeting Reach 2B Update April 28, 2010 Agenda 1. Introductions 2. Program Restoration Goal Context 3. Program Update a) Interim Flows b) EIS/EIR
Introduction-Overview. Why use a GIS? What can a GIS do? Spatial (coordinate) data model Relational (tabular) data model
 data model Relational (tabular) data model") Introduction-Overview Why use a GIS? What can a GIS do? How does a GIS work? GIS definitions Spatial (coordinate) data model Relational (tabular) data model intro_gis.ppt 1 Why use a GIS? An extension
Introduction-Overview Why use a GIS? What can a GIS do? How does a GIS work? GIS definitions Spatial (coordinate) data model Relational (tabular) data model intro_gis.ppt 1 Why use a GIS? An extension
Catastrophic Events Impact on Ecosystems
 Catastrophic Events Impact on Ecosystems Hurricanes Hurricanes An intense, rotating oceanic weather system with sustained winds of at least 74 mph and a welldefined eye Conditions for formation: Warm water
 W. Elliot, PE, PhD USDA Forest Service, Rocky Mountain Research Station Moscow, Idaho Version: April, 2017 WEPP PEP The Water Erosion Prediction Project (WEPP) Post Fire Erosion Predictor (PEP) is an online
FOREST RESEARCH INSTITUTE, DEHRADUN
 PROJECT REPORT DRAINAGE AND REPLENISHMENT STUDY OF MINED AREA OF GANGA SHYAMPUR RIVER HARIDWAR Submitted to UTTARAKHAND FOREST DEVELOPMENT CORPORATION (UFDC) 73, Nehru Road, Deharadun Prepared&Submitted
Best Management Practices for Coldwater Fisheries Enhancement and Restoration
 Best Management Practices for Coldwater Fisheries Enhancement and Restoration MACC Annual Environmental Conference 2017 March 3, 2017 Tim Dexter, MassDOT Highway Division 1 Leading the Nation in Transportation
Using Weather and Climate Information for Landslide Prevention and Mitigation
 Using Weather and Climate Information for Landslide Prevention and Mitigation Professor Roy C. Sidle Disaster Prevention Research Institute Kyoto University, Japan International Workshop on Climate and
THE CASPAR CREEK EXPERIMENTAL WATERSHED. Thomas Lisle, Hydrologist Pacific Southwest Forest and Range Experiment Station Arcata, Califorina
 THE CASPAR CREEK EXPERIMENTAL WATERSHED Thomas Lisle, Hydrologist Pacific Southwest Forest and Range Experiment Station Arcata, Califorina The Caspar Creek Experimental Watershed was set up as a traditional
USGS National Geospatial Program Understanding User Needs. Dick Vraga National Map Liaison for Federal Agencies July 2015
 + USGS National Geospatial Program Understanding User Needs Dick Vraga National Map Liaison for Federal Agencies July 2015 + Topics 2 Background Communities of Use User Surveys National Map Liaisons Partnerships
Mississippi River and Tributaries Project Mississippi River Geomorphology and Potamology Program
 Mississippi River and Tributaries Project Mississippi River Geomorphology and Potamology Program Barb Kleiss, Mississippi Valley Division Freddie Pinkard, Vicksburg District June, 2016 Program Objectives
Squaw Creek. General Information
 General Information is a tributary to the Salmon River. It enters the north side of the river about 0 miles downstream of North Fork, Idaho. The study reach is about a 30 ft length of stream about 2 miles
GPS-ASSISTED ROAD SURVEYS AND GIS-BASED ROAD EROSION MODELING USING THE WEPP MODEL
 Paper No. PNW-03-109 An ASAE Meeting Presentation This is not a peer-reviewed paper. GPS-ASSISTED ROAD SURVEYS AND GIS-BASED ROAD EROSION MODELING USING THE WEPP MODEL Erin S. Brooks 1, Jan Boll 2, and
ABSTRACT. A Tool to Analyze Environmental Impacts of Roads on Forest Watersheds. Ajay Prasad, Master of Science. Utah State University, 2007
 ABSTRACT ii A Tool to Analyze Environmental Impacts of Roads on Forest Watersheds by Ajay Prasad, Master of Science Utah State University, 2007 Major Professor: Dr. David G. Tarboton Department: Civil
Stream Geomorphology. Leslie A. Morrissey UVM July 25, 2012
 Stream Geomorphology Leslie A. Morrissey UVM July 25, 2012 What Functions do Healthy Streams Provide? Flood mitigation Water supply Water quality Sediment storage and transport Habitat Recreation Transportation
GIS IN ECOLOGY: ANALYZING RASTER DATA
 GIS IN ECOLOGY: ANALYZING RASTER DATA Contents Introduction... 2 Raster Tools and Functionality... 2 Data Sources... 3 Tasks... 4 Getting Started... 4 Creating Raster Data... 5 Statistics... 8 Surface
Summary Description Municipality of Anchorage. Anchorage Coastal Resource Atlas Project
 Summary Description Municipality of Anchorage Anchorage Coastal Resource Atlas Project By: Thede Tobish, MOA Planner; and Charlie Barnwell, MOA GIS Manager Introduction Local governments often struggle
Bear Valley Road Inventory (GRAIP) Report
 Report") In Support of the Bear Valley Category 4b Demonstration USDA Forest Service, Boise National Forest February 24, 2010 Chase Fly 1, Kari Grover-Wier 2, John Thornton 3, Tom Black 4, and Charlie Luce 5 1
In Support of the Bear Valley Category 4b Demonstration USDA Forest Service, Boise National Forest February 24, 2010 Chase Fly 1, Kari Grover-Wier 2, John Thornton 3, Tom Black 4, and Charlie Luce 5 1
Lidar data in water resources applications. Paola Passalacqua CE 374K Lecture, April 5 th, 2012
 Lidar data in water resources applications Paola Passalacqua CE 374K Lecture, April 5 th, 2012 Airborne Lidar Airborne laser altimetry technology (LiDAR, Light Detection And Ranging) provides high-resolution
Horse Creek Watershed Assessment & Conceptual Restoration Plan
 Horse Creek Watershed Assessment & Conceptual Restoration Plan The Prediction Level Assessment Results of the Hayman Fire Dana Butler, Leah Lessard U.S. Forest Service March 4 th, 2015 Acknowledgments
Working with Natural Stream Systems
 Working with Natural Stream Systems Graydon Dutcher Delaware County Soil & Water Conservation District Stream Corridor Management Program Tropical Storm Sandy October 29,2012 What is a Watershed?
Use of benthic invertebrate biological indicators in evaluating sediment deposition impairment on the Middle Truckee River, California
 Use of benthic invertebrate biological indicators in evaluating sediment deposition impairment on the Middle Truckee River, California David B. Herbst Sierra Nevada Aquatic Research Laboratory University
Natalie Cabrera GSP 370 Assignment 5.5 March 1, 2018
 Network Analysis: Modeling Overland Paths Using a Least-cost Path Model to Track Migrations of the Wolpertinger of Bavarian Folklore in Redwood National Park, Northern California Natalie Cabrera GSP 370
Geomorphology Studies
 Geomorphology Studies Technical Workgroup Meeting February 14, 2012 Prepared by: Tetra Tech Prepared for: Alaska Energy Authority Overall Goal Geomorphology Studies Two studies Geomorphology Study (RSP
Sediment and nutrient transport and storage along the urban stream corridor
 Sediment and nutrient transport and storage along the urban stream corridor Greg Noe, Cliff Hupp, Ed Schenk, Jackie Batson, Nancy Rybicki, Allen Gellis What is the role of floodplains everywhere? Noe 2013,
User Guide to TopoToolbox - Plotting ksn-values
 User Guide to TopoToolbox - Plotting ksn-values Background... 1 Load and generate required data... 2 Calculating the concavity index... 4 Calculate and plot ksn values... 4 Aggregate ksn values in stream