Supplement of Non-methane hydrocarbon variability in Athens during wintertime: the role of traffic and heating
|
|
|
- Nancy Todd
- 5 years ago
- Views:
Transcription
1 Supplement of Atmos. Chem. Phys., 18, , Author(s) This work is distributed under the Creative Commons Attribution 4.0 License. Supplement of Non-methane hydrocarbon variability in Athens during wintertime: the role of traffic and heating Anastasia Panopoulou et al. Correspondence to: Eleni Liakakou The copyright of individual parts of the supplement might differ from the CC BY 4.0 License.
 propane and i-butane; and (b) i- and n - pentane based on hourly averaged levels for the period 16 October")
2 Section S.1. Complementary figures. Figure S1. Temporal variability of (a) propane and i-butane; and (b) i- and n - pentane based on hourly averaged levels for the period 16 October February 2016, at NOA s urban background site in Thissio, downtown Athens
3 Figure S2. Monthly diurnal variability of (a) ethylene, (b) propane, (c) i-butane, (d) i-pentane and (e) n-pentane based on hourly averaged levels. 3
4 Figure S3. Correlation of (a) ethane, (b) ethylene, (c) propane, (d) propene, (e) i-butane, (f) i-pentane, (g) n-pentane, (h) isoprene, (i) CO, (j) BC, (k) BC wb and (i) BC ff relatively to wind speed for the period 16 October February 2016 at the Thissio urban background site. 4
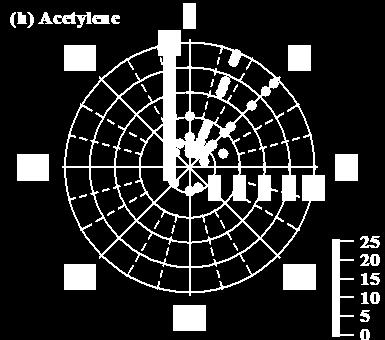
 and concentration roses of (b) ethane, (c) ethylene, (d) propane, (e) propene, (f) i-butane, (g) i-pentane, (h) n-pentane, (i)")
5 Figure S4. Wind rose (a) and concentration roses of (b) ethane, (c) ethylene, (d) propane, (e) propene, (f) i-butane, (g) i-pentane, (h) n-pentane, (i) isoprene, (j) toluene, (k) BC, (l) BC ff, (m) BC wb, (n) CO for the period 16 October February 2016 at the Thissio urban background site.
6 Figure S. Monthly variability of n-butane, acetylene and benzene relatively to wind speed. 1 6
7 Figure S6. Wind roses for Thissio station for the morning hours (07:00 09:00) and night hours (21:00 23:00) of October (a-b) and December (c-d); concentration roses of n-butane and acetylene for October morning (07:00 09:00) (e-f ), October night (21:00 23:00) (i-j), December morning (07:00 09:00) (g-h) and December night (21:00 23:00) (k-l) respectively. 7


8 8
9 Figure S7. Monthly variability of (a) n-butane, (b) acetylene,(c) BC wb and (d) BC ff against temperature for the period 16 October February 2016 at Thissio urban background site. 9
10 Figure S8. Diurnal patterns of (a) ethane, (b) propane, (c) propene, (d) i-butane, (e) acetylene, (f) n-pentane, (g) BC and (h) BC ff during the SP (left column) and the nsp (right column) periods identified during October 201 (red) and December 201 (black) respectively. Note: SP periods are defined by wind-speed lower than 3 ms -1 and absence of rainfall, while nsp periods are defined by winds-speeds higher than 3 m s -1.
11 Section S.2.% Mass contribution of the measured NMHCs in the morning peak (Sect , Fig. 9). The morning profile of NMHCs at Thissio station was obtained from the measurements of specific SP days of January and February 2016, due to ΤΕΧ availability. The first step of the procedure is the conversion of the NMHC concentrations from ppb to μg m -3, based on Eq. (S1): C i (μg m 3 ) = C i (ppb) x M i 24, (S1) where C i (μg m 3 ) is the calculated concentration of the compound i in μg m -3, C i (ppb)is the concentration of the compound i in ppb, M i is the molar mass of the compound in g mol -1 and the number 24 is the molecular volume of the ideal gas in 1atm and ambient temperature 2 o C. The next step is the calculation of the baseline level that will be subtracted by the morning maximum value in order to minimize the contribution of other sources besides traffic. This is important because the shape of the morning peak is not very clear, as it is depicted in Fig. S9 for i-pentane (motor vehicle exhaust marker, Baudic et al., 2016) for a representative day from the studied period. 1 Figure S9. Daily variability of i-pentane for the 28/01/2016. As a result, the baseline level is given from Eq. (S2), as the average of the measured concentrations at the beginning and the end of the morning peak: C baseline,i = C 6,i+C 11,i, (S2) 2 where C baseline,i is the calculated baseline level for the compound i in μg m -3,C 6,i is the concentration of the compound i at 20 06:00LT and C 11,i is the concentration of the compound i at 11:00LT. Subsequently, the mass contribution of each NMHC for the morning peak is calculated from Eq. (S3): 11
12 MassContribution i = C morning,i C baseline,i, (S3) n C i=1 i where MassContribution i is the calculated contribution of the compound i to the total mass of compounds,c morning,i is the maximum morning concentration of the compound i between 07:00 - :00LT, C baseline,i is the baseline level of the compound i calculated by the Eq. (S2) and C i is the result of the subtraction of the C baseline,i from the C morning,i for a compound i. For the morning profile of NMHCs at Patission station the same approach was adapted for the subtraction of the baseline, however, due to the small number of samples, the concentrations of the 06: sample were taken as the baseline level. Consequently, the mass contribution of each NMHC for the morning peak of Patission is calculated from Eq. (S4): MassContribution i = C morning,i C baseline,i, (S4) n C i=1 i where MassContribution i is the calculated contribution of the compound i to the total mass of compounds, C morning,i is 1 the maximum morning concentration of the compound i (in μg m -3 ) between 08:00 - :00LT, C baseline,i is concentration of the compound i of the 06: sample (in μg m -3 ) and C i is the result of the subtraction of the C baseline,i from the C morning,i for a compound i. Section S.2a. Tunnel measurements (Sect , Fig. 9) Apart from the street canyon measurements described in Sect. 2.4 and Sect , NMHCs measurements were also conducted in a tunnel at the peripheral highway of Athens, (Attiki Odos), on 12 May 2016 from 12:00 LT to 12:4 LT (LT = UTC+2), to identify the NMHCs fingerprint of traffic emissions. The tunnel s length is 200 m with 3 lanes at each direction and no specific restrictions for heavy duty vehicles. Each driving direction consists of a separated compartment and a ventilation system was installed but not operated. The measurements are performed at the middle of the tunnel length to avoid as much as possible the influence of ambient air from outside. For the sampling 6L stainless steel silonite canisters were used and the sampling time ranged between 2 and minutes. The sampling method for ambient air is described in details elsewhere (Sauvage et al., 2009). Before the analysis, the cylinders were pressurized by adding a known amount of zero-air resulting in a sample dilution by a factor of two. Afterwards each canister was connected to the GC-FID system using a Teflon (PTFE) sampling line and analyzed by the method described in Sect Before sampling, the canisters were cleaned by filling them up with zero air and re-evacuated, at least three times. The content of the cylinders was then analyzed by the GC-FID system to verify the efficiency of the cleaning procedure. The canisters were evacuated a few days prior to the use and they were analyzed maximum 1 day after the sampling. 12
13 To complement the analysis and explanation of the morning peak observed in Thissio and Patission measurements, in Sect we compare the mass contribution (%) of NMHCs in the mentioned morning profiles (Sect , Fig. 9), with the profile derived from the tunnel measurements in Athens (Highway Tunnel - Athens), as well as the profile derived from tunnel measurements conducted 20 Km southern of the center of Paris (France) in autumn 2012 (Highway Tunnel Paris) (Fig. S). The profile of the tunnel measurements of Athens derives as follows: First of all, the NMHC concentrations are converted from ppb to μg m -3, based on Eq. (S1). Secondly, the mass contribution of each NMHC for the Athens Tunnel Profile of is calculated from Eq. (S): Mass Contribution i = C i n i=1 C i, (S) where Mass Contribution i is the calculated contribution of the compound i to the total mass of compounds, and C i is the mean concentration of the compound i (in μg m -3 ) in the samples of 12:0 & 12:40 LT. Due to the small number of samples a baseline subtraction from the tunnel data was not possible. 1 Figure S. % Mass contribution of the measured NMHCs during the morning peak (07:00 :00 LT), median values in Thissio, mean values in Patission Monitoring Station, in a highway tunnel in GAA and a highway tunnel close to Paris. 20 The tunnel profiles present a lot of common features as well as a few large discrepancies (R² = 0.3), despite the different conditions associated with their profiles (Paris versus Athens, tunnel length, season etc). Again i-pentane and toluene are the two main compounds of the profiles at least in Athens accounting for about 4% of the total measured NMHCs, followed by 13
14 n -butane, ethylene and benzene accounting for almost 20% at both sites. The most striking difference between the two tunnels concerns ethylene (factor of 2 higher in Athens compared to Paris), acetylene (factor of 3 lower in Athens compared to Paris), i-butane (factor of 3 lower in Paris than Athens), n-pentane (almost a factor of two higher in Paris compared to Athens) and m-/p- xylenes (almost a factor of 3 lower in Paris compared to Athens). The biggest difference between the two Athens morning peaks and Athens tunnels concerns acetylene and toluene (factor of 4 and 1. respectively). The above similarities and differences can be attributed to the car-fleet and the type of fuel used, as it is described in Sect of the manuscript. Section S.3. Investigation of the evaporation losses (Sect , Fig. 9) In Sect , the increased mass contribution of butanes and propane to the morning profiles of Thissio and Patission was attributed to LPG fuels, thus to fuel evaporation. To better investigate this possibility, we followed a similar approach as Na and Kim (2001) for Seoul (South Korea), in order to examine the relationship of the ratio Butanes-to-(C2 C)Alkanes (%) and temperature for every month (Fig. S11). More specifically, the ratio of the sum of i-butane and n-butane versus the sum of ethane, propane, i-butane, n-butane, i-pentane and n-pentane for every sample was calculated. Ethylene, propene and acetylene are excluded from this ratio due to their reactivity. The mean and standard deviation values of the ratio were derived for the temperatures between 1 o C to 2 o C (minimum and maximum of the period respectively). These values were plotted against the temperature for each month. The highest values of the ratio are observed for high temperatures and the lowest for low ambient temperature, although the standard deviation is considerable. It is interesting to note that the same pattern occurs when the ratio Pentanes-to-(C2 C)Alkanes (%) versus the temperature is examined (Fig. S12). Taking into account the positive dependence of the two ratios to temperature, we can assume that fuel evaporation losses are also an important source of NMHCs. In addition, the above results could indicate why the Athens tunnel results performed in May differ from Patission and Thissio winter morning profiles. 14
15 Figure S11. Scatter plots of the ratio Butanes-to-(C2 C)Alkanes (%) to temperature for October 201, November 201, December 201, January 2016 and February Figure S12. Scatter plots of the ratio Pentanes-to-(C2 C)Alkanes (%) to temperature for October 201, November 201, December 201, January 2016 and February
16 Furthermore, it is important to mention that Kourtidis et al., (1999) also performed an investigation of the evaporative emissions for Athens with data obtained at a street canyon location (Patission station) in September To compare our observations from Thissio station with those reported by Kourtidis et al., (1999), the ratio of NMHC/benzene at 1:00 and 07:00 (normalized to the OH reactions) versus the boiling point of selected NMHC was examined, using our data from Thissio station (Fig. S.13). To include more common NMHC with Kourtidis et al., (1999), we used data from 21 January to 1 February 2016, when toluene, ethylbenzene and o-xylene are additionally available. The selected data had wind speed less than 2.8 m s -1 to maximize impact from local sources, while at 07:00 and 1:00 LT the mean temperature was approximately 8 C and 12. C respectively. Although the examined periods have discrepancies in ambient temperature (winter is colder than autumn), the exponential curve fitting of our data (y = 0.333e x, where x is the boiling point in C) is very close to the one reported in Kourtidis et al., (1999) (y = 0.44e T, where T is the boiling point in C). 1 Figure S13. Ratios of the NMHC/benzene ratio for 1:00 and 07:00 to the boiling points of the selected NMHC, divided by the reaction rate constant of each species with OH. The plotted NMHC are propane, i-/n- butane,i-/npentane, toluene, ethylbenzene and o-xylene. The red cycles indicate compounds (not values) in common with the work of Kourtidis et al., (1999). 20 Finally, we examine the monthly variation of i-butane relatively to n-butane (Fig. S14). The two compounds have linear relationship with no significant temporal differences on the slopes (only October and December equations are presented). In addition, the regression is similar to the one derived from the Patission measurements (depicted on Fig. S14), thus supporting our assumption that the observations are traffic related. 16
17 Figure S14. Scatter plots between i-butane relatively to n-butane for October 201, November 201, December 201, January 2016 and February 2016 for the Thissio site. The black line corresponds to the Patission data regression. Section S.4. %Mass contribution of the measured NMHCs in the night-time enhancement period (Sect , Fig. 11). The night profile of NMHCs at Thissio station was obtained from the measurements of specific SP nights of October and December 201, due to their different temperature condition (October is warmer than December) that influence the need for residential heating. The first step of the procedure is the conversion of the NMHC concentrations from ppb to μg m -3, based on Eq. (S1). The next step is the determination of the baseline level that will be subtracted by the night maximum value (between 22:00 and 23:00 LT) as it is also seen in Fig. 4 and Fig. 8. For that purpose, the minimum concentration of each compound between 12:00 LT 17:00 LT is used. Subsequently, the mass contribution of each NMHC for the night peak is calculated from Eq. (S6): MassContribution i = C night,i C baseline,i, (S6) n C i=1 i 1 where MassContribution i is the calculated contribution of the compound i to the total mass of compounds,c night,i is the maximum night concentration of the compound i (in μg m -3 ) between 22:00-23:00LT, C baseline,i is the minimum concentration of the compound i (in μg m -3 ) for the same date between 12:00 17:00 LT and C i is the result of the subtraction of the C baseline,i from the C night,i for a compound i. 17
18 References Baudic, A., Gros, V., Sauvage, S., Locoge, N., Sanchez, O., Sarda-Estève, R., Kalogridis, C., Petit, J.-E., Bonnaire, N., Baisnée, D., Favez, O., Albinet, A., Sciare, J. and Bonsang, B.: Seasonal variability and source apportionment of volatile organic compounds (VOCs) in the Paris megacity (France), AtmosChem Phys, 16(18), , doi:.194/acp , Kourtidis, K. A., Ziomas, I. C., Rappenglueck, B., Proyou, A. and Balis, D.: Evaporative traffic hydrocarbon emissions, traffic CO and speciated HC traffic emissions from the city of Athens, Atmos. Environ., 33(23), , doi:.16/s132-23(98)0039-1, Na, K. and Kim, Y. P.: Seasonal characteristics of ambient volatile organic compounds in Seoul, Korea, Atmos. Environ., 3(1), ,
Jonathan M. Liebmann et al. Correspondence to: John N. Crowley
 Supplement of Atmos. Chem. Phys., 18, 12045 12059, 2018 https://doi.org/10.5194/acp-18-12045-2018-supplement Author(s) 2018. This work is distributed under the Creative Commons Attribution 4.0 License.
GAW Expert Workshop VOC, C. Plass-Dülmer et al., FEHp-B 1
 ACTRIS-GAW: Uncertainty Evaluation in VOC Analysis Draft VOC Measurement Guidelines C. Plass-Duelmer, A. Werner, S. Reimann, S. Sauvage, R. Steinbrecher and the ACTRIS VOC workshop participants comparable
J. Li et al. Correspondence to: S. D. Xie
 Supplement of Atmos. Chem. Phys., 15, 7945 7959, 2015 http://www.atmos-chem-phys.net/15/7945/2015/ doi:10.5194/acp-15-7945-2015-supplement Author(s) 2015. CC Attribution 3.0 License. Supplement of Characterization
Supplement of Secondary formation of nitrated phenols: insights from observations during the Uintah Basin Winter Ozone Study (UBWOS) 2014
 2014") Supplement of Atmos. Chem. Phys., 16, 2139 2153, 2016 http://www.atmos-chem-phys.net/16/2139/2016/ doi:10.5194/acp-16-2139-2016-supplement Author(s) 2016. CC Attribution 3.0 License. Supplement of Secondary
Supplement of Atmos. Chem. Phys., 16, 2139 2153, 2016 http://www.atmos-chem-phys.net/16/2139/2016/ doi:10.5194/acp-16-2139-2016-supplement Author(s) 2016. CC Attribution 3.0 License. Supplement of Secondary
Supplement for Understanding primary and secondary sources of. ambient carbonyl compounds in Beijing using the PMF model
 1 2 3 4 5 6 7 8 9 Supplement for Understanding primary and secondary sources of ambient carbonyl compounds in Beijing using the PMF model W. T. Chen 1, M. Shao 1, S. H. Lu 1, M. Wang 1, L. M. Zeng 1, B.
Organic Compounds - Formation Fate and Impact on Troposphere
 Organic Compounds - Formation Fate and Impact on Troposphere i.gensch@fz-juelich.de 2 / 20 Organic Compounds - Formation Fate and Impact on Troposphere i.gensch@fz-juelich.de 2 / 20 Definitions VOC: organic
DETERMINATION OF UPTAKE RATES FOR VOCs IN AMBIENT AIR BY USING AXIAL TYPE THERMAL DESORPTION PASSIVE TUBES
 DETERMINATION OF UPTAKE RATES FOR VOCs IN AMBIENT AIR BY USING AXIAL TYPE THERMAL DESORPTION PASSIVE TUBES Mihriban Yılmaz Civan, Öznur Kuntasal and Gürdal Tuncel 1 1 OUTLINE Introduction Importance and
Ozone Formation in Coastal Urban Atmospheres: The Role of Anthropogenic Sources of Chlorine
 Ozone Formation in Coastal Urban Atmospheres: The Role of Anthropogenic Sources of Chlorine, Sarah Oldfield, Charles B. Mullins, David T. Allen In this communication, we present experimental results from
A.K. Baker 1, C.A.M. Brenninkmeijer 1, D. Oram 2, D. O Sullivan 2,3, F. Slemr 1, T.J. Schuck 1, P. van Velthoven 4
 A.K. Baker 1, C.A.M. Brenninkmeijer 1, D. Oram, D. O Sullivan,3, F. Slemr 1, T.J. Schuck 1, P. van Velthoven 1 Max Planck Institute for Chemistry, Mainz, Germany University of East Anglia, Norwich, UK
Site Specific Conditional Sampler Garfield County, Colorado. VOC Data Summaries. Prepared for
 Site Specific Conditional Sampler Garfield County, Colorado VOC Data Summaries Prepared for Garfield County Public Health 195 West 14 th Street Rifle, Colorado 81650 Prepared by 1901 Sharp Point Dr., Suite
Air quality impacts of oil and gas development in the Bakken formation region
 Air quality impacts of oil and gas development in the Bakken formation region J. L. Collett, Jr. 1, A. Evanoski Cole 1, A. Prenni 2, D. Day 2, A. Sullivan 1, Y. Li 1, B. Sive 2, Y. Zhou 1, A. Hecobian
A STUDY OF VOLATILE ORGANIC CARBON POLLUTION ON A UNIVERSITY CAMPUS DUE TO TRAFFIC
 A STUDY OF VOLATILE ORGANIC CARBON POLLUTION ON A UNIVERSITY CAMPUS DUE TO TRAFFIC Aysel T. ATIMTAY Middle East Technical University, Environmental Engineering Department, 06531 Ankara Turkey (aatimtay@metu.edu.tr)
TDTS 16 Round-the-clock, on-line and cryogen-free monitoring of hydrocarbons from acetylene to trimethylbenzene in ambient air
 Application TDTS 16 Round-the-clock, on-line and cryogen-free monitoring of hydrocarbons from acetylene to trimethylbenzene in ambient air Summary This Application Note describes validation of a thermal
FRAPPÉ/DISCOVER-AQ (July/August 2014) in perspective of multi-year ozone analysis
 in perspective of multi-year ozone analysis") FRAPPÉ/DISCOVER-AQ (July/August 2014) in perspective of multi-year ozone analysis Project Report #2: Monitoring network assessment for the City of Fort Collins Prepared by: Lisa Kaser kaser@ucar.edu ph:
FRAPPÉ/DISCOVER-AQ (July/August 2014) in perspective of multi-year ozone analysis Project Report #2: Monitoring network assessment for the City of Fort Collins Prepared by: Lisa Kaser kaser@ucar.edu ph:
Supplement of Chemical and physical characterization of traffic particles in four different highway environments in the Helsinki metropolitan area
 Supplement of Atmos. Chem. Phys., 16, 5497 5512, 2016 http://www.atmos-chem-phys.net/16/5497/2016/ doi:10.5194/acp-16-5497-2016-supplement Author(s) 2016. CC Attribution 3.0 License. Supplement of Chemical
Supplement of Temporal variability and sources of VOCs in urban areas of the eastern Mediterranean
 Supplement of Atmos. Chem. Phys., 1, 1 1, 1 http://www.atmos-chem-phys.net/1/1/1/ doi:1.19/acp-1-1-1-supplement Author(s) 1. CC Attribution. License. Supplement of Temporal variability and sources of VOCs
Tropospheric OH chemistry
 Tropospheric OH chemistry CO Oxidation mechanism: CO + OH CO 2 + H, H + O 2 + M HO 2 + M, HO 2 + NO OH + NO 2 NO 2 + hν (+O 2 ) NO + O 3 Initiation step Propagation Net: CO + 2 O 2 CO 2 + O 3 HO 2 + HO
PERCH Air Quality Study. Quarterly Report. February 7, 2004
 PERCH Air Quality Study Quarterly Report February 7, 2004 Submitted to: Professor Ranga Rao Center for Environmental Diagnostics and Bioremediation University of West Florida 11000 University Parkway Pensacola,
R. Fröhlich et al. Correspondence to: A. Prévôt
 Supplement of Atmos. Chem. Phys. Discuss.,, 1, http://www.atmos-chem-phys-discuss.net//// doi:19/acpd----supplement Author(s). CC Attribution. License. Supplement of Fourteen months of on-line measurements
Supplement of Vegetation greenness and land carbon-flux anomalies associated with climate variations: a focus on the year 2015
 Supplement of Atmos. Chem. Phys., 17, 13903 13919, 2017 https://doi.org/10.5194/acp-17-13903-2017-supplement Author(s) 2017. This work is distributed under the Creative Commons Attribution 3.0 License.
Levels of nitrogen oxides and ozone in Madrid. Study of the nitrogen monoxide/
 Levels of nitrogen oxides and ozone in Madrid. Study of the nitrogen monoxide/ nitrogen dioxide and nitrogen dioxide/ ozone ratios R. Fernandez Patier, P. Dfez Hernandez, E. Diaz Ramiro, J.M. Fernandez
Monitoring Survey in the Vicinity of St. Marys Cement: Interim Report
 Technical Memorandum 2017-2018 Monitoring Survey in the Vicinity of St. Marys Cement: Interim Report Ontario Ministry of the Environment & Climate Change Report Prepared by: Terrestrial Assessment and
NIST gas standards containing volatile organic compounds in support of ambient air pollution measurements
 Air Pollution XVI 357 NIST gas standards containing volatile organic compounds in support of ambient air pollution measurements G. C. Rhoderick Analytical Chemistry Division, Chemical Science and Technology
WP3: In-situ chemical, physical and optical properties of aerosols. WP4: Trace gases networking: Volatile organic carbon and nitrogen oxides
 WP3: In-situ chemical, physical and optical properties of aerosols WP4: Trace gases networking: Volatile organic carbon and nitrogen oxides WP3: In-situ chemical, physical and optical properties of aerosols
AUTOMATED ONLINE IDENTIFICATION AND MONITORING OF IMPURITIES IN GASES
 JPACSM 127 AUTOMATED ONLINE IDENTIFICATION AND MONITORING OF IMPURITIES IN GASES Trace Analytical Inc. Menlo Park, CA ABSTRACT GC based gas analyzers with Reduction Gas Detector (RGD) and Flame Ionization
STUDIES ON BLACK CARBON (BC) VARIABILITY OVER NORTHERN INDIA
 VARIABILITY OVER NORTHERN INDIA") Int. J. Chem. Sci.: 11(2), 213, 873-879 ISSN 972-768X www.sadgurupublications.com STUDIES ON BLACK CARBON (BC) VARIABILITY OVER NORTHERN INDIA JAY PANDEY *, CHANDRAVATI PRAJAPATI and R. S. SINGH Department
Int. J. Chem. Sci.: 11(2), 213, 873-879 ISSN 972-768X www.sadgurupublications.com STUDIES ON BLACK CARBON (BC) VARIABILITY OVER NORTHERN INDIA JAY PANDEY *, CHANDRAVATI PRAJAPATI and R. S. SINGH Department
J17.3 Impact Assessment on Local Meteorology due to the Land Use Changes During Urban Development in Seoul
 J17.3 Impact Assessment on Local Meteorology due to the Land Use Changes During Urban Development in Seoul Hae-Jung Koo *, Kyu Rang Kim, Young-Jean Choi, Tae Heon Kwon, Yeon-Hee Kim, and Chee-Young Choi
Diesel soot aging in urban plumes within hours under cold dark and humid conditions
 Supporting information for Diesel soot aging in urban plumes within hours under cold dark and humid conditions A. C. Eriksson 1,2*, C. Wittbom 1, P. Roldin 1,3, M. Sporre 4, E. Öström 1,5, P. Nilsson 2,
Meteorology. Circle the letter that corresponds to the correct answer
 Chapter 3 Worksheet 1 Meteorology Name: Circle the letter that corresponds to the correct answer 1) If the maximum temperature for a particular day is 26 C and the minimum temperature is 14 C, the daily
Supplement of Modeling organic aerosol composition at the puy de Dôme mountain (France) for two contrasted air masses with the WRF-Chem model
 for two contrasted air masses with the WRF-Chem model") Supplement of Atmos. Chem. Phys. Discuss., 1, 19 1, 01 http://www.atmos-chem-phys-discuss.net/1/19/01/ doi:10.19/acpd-1-19-01-supplement Author(s) 01. CC Attribution.0 License. Supplement of Modeling organic
Supplement of Atmos. Chem. Phys. Discuss., 1, 19 1, 01 http://www.atmos-chem-phys-discuss.net/1/19/01/ doi:10.19/acpd-1-19-01-supplement Author(s) 01. CC Attribution.0 License. Supplement of Modeling organic
QUANTIFICATION OF THE NATURAL VARIATION IN TRAFFIC FLOW ON SELECTED NATIONAL ROADS IN SOUTH AFRICA
 QUANTIFICATION OF THE NATURAL VARIATION IN TRAFFIC FLOW ON SELECTED NATIONAL ROADS IN SOUTH AFRICA F DE JONGH and M BRUWER* AECOM, Waterside Place, Tygerwaterfront, Carl Cronje Drive, Cape Town, South
Winter Thermal Comfort in 19 th Century Traditional Buildings of the Town of Florina, in North-Western Greece
 PLEA2 - The 22 nd Conference on Passive and Low Energy Architecture. Beirut, Lebanon, 13-16 November 2 Winter Thermal Comfort in 19 th Century Traditional Buildings of the Town of Florina, in North-Western
ANNUAL SPATIO-TEMPORAL VARIABILITY OF TOULOUSE URBAN HEAT ISLAND. Grégoire Pigeon* and Valéry Masson CNRM-GAME, Météo France-CNRS, Toulouse, France
 J12.4A ANNUAL SPATIO-TEMPORAL VARIABILITY OF TOULOUSE URBAN HEAT ISLAND Grégoire Pigeon* and Valéry Masson CNRM-GAME, Météo France-CNRS, Toulouse, France 1 INTRODUCTION The urban heat island (UHI) has
Chemical mass closure of atmospheric aerosol collected over Athens, Greece.
 Chemical mass closure of atmospheric aerosol collected over Athens, Greece. Paraskevopoulou D. 1, 2, Liakakou E. 1, Theodosi C. 2, Zarmpas P. 2, Gerasopoulos E. 1 1, 2*, Mihalopoulos N. 1 Institute for
8.2 Tropospheric ozone
 8.2 Tropospheric ozone Prev Chapter 8. Ozone Next 8.2 Tropospheric ozone Tropospheric ozone is only about 10% of the total amount of ozone contained in a vertical column in the atmosphere. However, this
MODELING AND AMBIENT MONITORING OF AIR TOXICS IN CORPUS CHRISTI, TEXAS
 MODELING AND AMBIENT MONITORING OF AIR TOXICS IN CORPUS CHRISTI, TEXAS Gary McGaughey, Elena McDonald-Buller, Yosuke Kimura, Hyun-Suk Kim, and David T. Allen* Center for Energy and Environmental Resources,
INFLUENCE OF THE AVERAGING PERIOD IN AIR TEMPERATURE MEASUREMENT
 INFLUENCE OF THE AVERAGING PERIOD IN AIR TEMPERATURE MEASUREMENT Hristomir Branzov 1, Valentina Pencheva 2 1 National Institute of Meteorology and Hydrology, Sofia, Bulgaria, Hristomir.Branzov@meteo.bg
Seasonal Variations of the Urban Heat Island Effect:
 Seasonal Variations of the Urban Heat Island Effect: Examining the Differences in Temperature Between the City of Philadelphia and its Outlying Suburbs By: Frank Vecchio 1 P a g e We re calling for a high
NJDEP TETERBORO AIRPORT AIR QUALITY STUDY
 NJDEP TETERBORO AIRPORT AIR QUALITY STUDY Alan Kao, Principal ENVIRON International Corporation Groton, Massachusetts Final Project Presentation February 11, 2008 Background OUTLINE Recap of monitoring
Colorado State University, Fort Collins, CO Weather Station Monthly Summary Report
 Colorado State University, Fort Collins, CO Weather Station Monthly Summary Report Month: December Year: 2017 Temperature: Mean T max was 47.2 F which is 4.4 above the 1981-2010 normal for the month. This
2B Technologies, Inc. An InDevR Company
 2B Technologies, Inc. An InDevR Company Technical Note No. 40 UV-Absorbing Interferences in Ozone Monitors Date: 22 April 2015 Author: John Birks Background Ozone measurements by absorbance of the 253.7-nm
R. F. Hansen et al. Correspondence to: R. F. Hansen
 Supplement of Atmos. Meas. Tech., 8, 4243 4264, 2015 http://www.atmos-meas-tech.net/8/4243/2015/ doi:10.5194/amt-8-4243-2015-supplement Author(s) 2015. CC Attribution 3.0 License. Supplement of Intercomparison
Colorado State University, Fort Collins, CO Weather Station Monthly Summary Report
 Colorado State University, Fort Collins, CO Weather Station Monthly Summary Report Month: February Year: 2017 Webcam catching a hawk watching over the station. Temperature: Mean T max was 54.4 F which
M. Mielke et al. C5816
 Atmos. Chem. Phys. Discuss., 14, C5816 C5827, 2014 www.atmos-chem-phys-discuss.net/14/c5816/2014/ Author(s) 2014. This work is distributed under the Creative Commons Attribute 3.0 License. Atmospheric
Central Ohio Air Quality End of Season Report. 111 Liberty Street, Suite 100 Columbus, OH Mid-Ohio Regional Planning Commission
 217 218 Central Ohio Air Quality End of Season Report 111 Liberty Street, Suite 1 9189-2834 1 Highest AQI Days 122 Nov. 217 Oct. 218 July 13 Columbus- Maple Canyon Dr. 11 July 14 London 11 May 25 New Albany
INTRODUCTION The Mexico City Metropolitan Area (MCMA), one of the biggest population concentrations in the world, lies at an altitude of 2,240 m above
, one of the biggest population concentrations in the world, lies at an altitude of 2,240 m above") Research Article TheScientificWorldJOURNAL (2002) 2, 844 860 ISSN 1537-744X; DOI 10.1100/tsw.2002.147 Receptor Model Source Apportionment of Nonmethane Hydrocarbons in Mexico City V. Mugica 1,*, J. Watson
Research Article TheScientificWorldJOURNAL (2002) 2, 844 860 ISSN 1537-744X; DOI 10.1100/tsw.2002.147 Receptor Model Source Apportionment of Nonmethane Hydrocarbons in Mexico City V. Mugica 1,*, J. Watson
Chill Hour Assessment for the Yuma Area
 Chill Hour Assessment for the Yuma Area Item Type text; Article Authors Brown, Paul W. Publisher College of Agriculture, University of Arizona (Tucson, AZ) Journal Deciduous Fruit and Nut: A College of
Date: March 6, 2008 RWDI Reference #: W B Pages (Including Cover):
:") RWDI AIR Inc. 650 W oodlawn R oa d W est, Guelph, Ontari o, Ca nad a N1K 1B8 Tel: (51 9) 823-1 31 1 E-mail: info@rwdi.com Fax: (51 9) 823-1 31 6 W eb: www. r wdi.com Date: March 6, 2008 RWDI Reference
RWDI AIR Inc. 650 W oodlawn R oa d W est, Guelph, Ontari o, Ca nad a N1K 1B8 Tel: (51 9) 823-1 31 1 E-mail: info@rwdi.com Fax: (51 9) 823-1 31 6 W eb: www. r wdi.com Date: March 6, 2008 RWDI Reference
CURRENT STATUS OF THE DEVELOPMENT AND EVALUATION OF AN UPDATED DETAILED MECHANISM FOR VOC OXIDATION
 CURRENT STATUS OF THE DEVELOPMENT AND EVALUATION OF AN UPDATED DETAILED MECHANISM FOR VOC OXIDATION William P. L. Carter Statewide Air Pollution Research Center and College of Engineering, Center for Environmental
URBAN HEAT ISLAND IN SEOUL
 URBAN HEAT ISLAND IN SEOUL Jong-Jin Baik *, Yeon-Hee Kim ** *Seoul National University; ** Meteorological Research Institute/KMA, Korea Abstract The spatial and temporal structure of the urban heat island
Supplement of Observation of isoprene hydroxynitrates in the southeastern United States and implications for the fate of NO x
 Supplement of Atmos. Chem. Phys., 15, 11257 11272, 2015 http://www.atmos-chem-phys.net/15/11257/2015/ doi:10.5194/acp-15-11257-2015-supplement Author(s) 2015. CC Attribution 3.0 License. Supplement of
Primary and secondary organic aerosol origin by combined gas-particle phase source apportionment
 Supplementary information for manuscript Primary and secondary organic aerosol origin by combined gas-particle phase source apportionment Crippa Monica 1, Canonaco Francesco 1, Slowik Jay G. 1, El Haddad
Supplement of Summertime OH reactivity from a receptor coastal site in the Mediterranean Basin
 Supplement of Atmos. Chem. Phys., 17, 12645 12658, 2017 https://doi.org/10.5194/acp-17-12645-2017-supplement Author(s) 2017. This work is distributed under the Creative Commons Attribution 3.0 License.
not for commercial-scale installations. Thus, there is a need to study the effects of snow on
 1. Problem Statement There is a great deal of uncertainty regarding the effects of snow depth on energy production from large-scale photovoltaic (PV) solar installations. The solar energy industry claims
Emissions from an international airport increase particle number concentrations fourfold at 10 kilometers downwind
 Supporting Information for Emissions from an international airport increase particle number concentrations fourfold at 10 kilometers downwind N. Hudda 1, T. Gould 2, K. Hartin 3, T. Larson 2, and S.A.
Experiment 5 Reactions of Hydrocarbons
 Experiment 5 Reactions of ydrocarbons ydrocarbons are compounds that only contain carbon and hydrogen. ydrocarbons can be classified further by the type of bonds they contain. If a hydrocarbon contains
Evaluation of Spatial Gradients and Temporal Trends of Black Carbon in Boston MA. George Allen
 Evaluation of Spatial Gradients and Temporal Trends of Black Carbon in Boston MA. George Allen 1. Introduction. The Massachusetts Dept. of Environmental Protection (MA-DEP), Bureau of Waste Prevention,
WEATHER IMPACT. on FLOATING CAR DATA
 WEATHER IMPACT on FLOATING CAR DATA Alexander Sohr Research Scientist, DLR Institute of Transportation Systems Rutherfordstr. 2, 12489 Berlin, Germany TEL +49 3 67 55 458, FAX +49 3 67 55 291, alexander.sohr@dlr.de
AT350 EXAM #1 September 23, 2003
 AT350 EXAM #1 September 23, 2003 Name and ID: Enter your name and student ID number on the answer sheet and on this exam. Record your answers to the questions by using a No. 2 pencil to completely fill
Champaign-Urbana 1998 Annual Weather Summary
 Champaign-Urbana 1998 Annual Weather Summary ILLINOIS STATE WATER SURVEY Audrey Bryan, Weather Observer 2204 Griffith Dr. Champaign, IL 61820 wxobsrvr@sparc.sws.uiuc.edu The development of the El Nìno
Behavior of Primary and Secondary Pollutants in Ambient Air of Rome
 Revista CENIC Ciencias Químicas, Vol. 36, No. Especial, 25 Behavior of Primary and Secondary Pollutants in Ambient Air of Rome Pasquale Avino 1 *, Mario Vincenzo Russo 2 1 Laboratorio Inquinamento Chimico
Supplement of Evaluation of the performance of a particle concentrator for online instrumentation
 Supplement of Atmos. Meas. Tech., 7, 11 135, 1 http://www.atmos-meas-tech.net/7/11/1/ doi:1.519/amt-7-11-1-supplement Author(s) 1. CC Attribution 3. License. Supplement of Evaluation of the performance
Seasons Quiz Please Do Not Write on this Paper Obrigado
 Seasons Quiz Please Do Not Write on this Paper Obrigado Use this diagram of the sun and Earth's path around the sun to answer the next two questions. The N indicates North and Earth is traveling from A
STATISTICAL ANALYSIS OF LAW ENFORCEMENT SURVEILLANCE IMPACT ON SAMPLE CONSTRUCTION ZONES IN MISSISSIPPI (Part 1: DESCRIPTIVE)
") STATISTICAL ANALYSIS OF LAW ENFORCEMENT SURVEILLANCE IMPACT ON SAMPLE CONSTRUCTION ZONES IN MISSISSIPPI (Part 1: DESCRIPTIVE) Tulio Sulbaran, Ph.D 1, David Marchman 2 Abstract It is estimated that every
STATISTICAL ANALYSIS OF LAW ENFORCEMENT SURVEILLANCE IMPACT ON SAMPLE CONSTRUCTION ZONES IN MISSISSIPPI (Part 1: DESCRIPTIVE) Tulio Sulbaran, Ph.D 1, David Marchman 2 Abstract It is estimated that every
Investigating the urban climate characteristics of two Hungarian cities with SURFEX/TEB land surface model
 Investigating the urban climate characteristics of two Hungarian cities with SURFEX/TEB land surface model Gabriella Zsebeházi Gabriella Zsebeházi and Gabriella Szépszó Hungarian Meteorological Service,
Determining correction factors for seasonal and regional variability in
 Determining correction factors for seasonal and regional variability in the tracer ratio method: The seasonal variability in the ΔCFC-12:ΔCO and ΔCFC-11:ΔCO enhancement ratios, observed during a three
Urban heat island effects over Torino
 3 Working Group on Physical Aspects: Soil and Surface 3 Urban heat island effects over Torino M. Milelli 1 1 ARPA Piemonte 1 Introduction Figure 1: Urban heat island generalized scheme (source: EPA). The
Texas Commission on Environmental Quality INTEROFFICE MEMORANDUM
 Texas Commission on Environmental Quality INTEROFFICE MEMORANDUM To: Lorinda Gardner, Director, R15 Date: Carlos Rubinstein, Texas Border Area Director From: Valerie E. Meyers, Ph.D. Toxicology Section,
MAIN ATTRIBUTES OF THE PRECIPITATION PRODUCTS DEVELOPED BY THE HYDROLOGY SAF PROJECT RESULTS OF THE VALIDATION IN HUNGARY
 MAIN ATTRIBUTES OF THE PRECIPITATION PRODUCTS DEVELOPED BY THE HYDROLOGY SAF PROJECT RESULTS OF THE VALIDATION IN HUNGARY Eszter Lábó OMSZ-Hungarian Meteorological Service, Budapest, Hungary labo.e@met.hu
of the 7 stations. In case the number of daily ozone maxima in a month is less than 15, the corresponding monthly mean was not computed, being treated
 Spatial Trends and Spatial Extremes in South Korean Ozone Seokhoon Yun University of Suwon, Department of Applied Statistics Suwon, Kyonggi-do 445-74 South Korea syun@mail.suwon.ac.kr Richard L. Smith
JEP John E. Jack Pflum, P.E. Consulting Engineering 7541 Hosbrook Road, Cincinnati, OH Telephone:
 JEP John E. Jack Pflum, P.E. Consulting Engineering 7541 Hosbrook Road, Cincinnati, OH 45243 Email: jackpflum1@gmail.com Telephone: 513.919.7814 MEMORANDUM REPORT Traffic Impact Analysis Proposed Soccer
BEE-TEX Field Study. Aerodyne Mobile Laboratory May Berk Knighton (PTRMS) Tara Yacovitch, Rob Roscioli, John Nowak (QCL) Cody Floerchinger (EE)
 Tara Yacovitch, Rob Roscioli, John Nowak (QCL) Cody Floerchinger (EE)") BEE-TEX Field Study Aerodyne Mobile Laboratory May- 2014 Berk Knighton (PTRMS) Tara Yacovitch, Rob Roscioli, John Nowak (QCL) Cody Floerchinger (EE) BEETEX BEE-TEX Given the monitoring and modeling technologies
BEE-TEX Field Study Aerodyne Mobile Laboratory May- 2014 Berk Knighton (PTRMS) Tara Yacovitch, Rob Roscioli, John Nowak (QCL) Cody Floerchinger (EE) BEETEX BEE-TEX Given the monitoring and modeling technologies
2007 Area Source Emissions Inventory Methodology 670 RANGE IMPROVEMENT
 San Joaquin Valley AIR POLLUTION CONTROL DISTRICT 2007 Area Source Emissions Inventory Methodology 670 RANGE IMPROVEMENT I. Purpose This document describes the Area Source Methodology used to estimate
An aromatic hydrocarbon study with an extended SAPRC99 mechanism of the CMAQ system: Application for the Houston-Galveston area
 An aromatic hydrocarbon study with an extended SAPRC99 mechanism of the CMAQ system: Application for the Houston-Galveston area Violeta F. Coarfa, Daewon W. Byun Institute for Multidimensional Air Quality
Causes of high PM 10 values measured in Denmark in 2006
 Causes of high PM 1 values measured in Denmark in 26 Peter Wåhlin and Finn Palmgren Department of Atmospheric Environment National Environmental Research Institute Århus University Denmark Prepared 2 October
PHYSICAL PROPERTIES TAHOE.UCDAVIS.EDU 8
 PHYSICAL PROPERTIES 8 Lake surface level Daily since 1900 Lake surface level varies throughout the year. Lake level rises due to high stream inflow, groundwater inflow, and precipitation directly onto
Analysis of gross alpha, gross beta activities and beryllium-7 concentrations in surface air: their variation and statistical prediction model
 Iran. J. Radiat. Res., 2006; 4 (3): 155-159 Analysis of gross alpha, gross beta activities and beryllium-7 concentrations in surface air: their variation and statistical prediction model F.Arkian 1*, M.
Plan for operational nowcasting system implementation in Pulkovo airport (St. Petersburg, Russia)
") Plan for operational nowcasting system implementation in Pulkovo airport (St. Petersburg, Russia) Pulkovo airport (St. Petersburg, Russia) is one of the biggest airports in the Russian Federation (150
Plan for operational nowcasting system implementation in Pulkovo airport (St. Petersburg, Russia) Pulkovo airport (St. Petersburg, Russia) is one of the biggest airports in the Russian Federation (150
C) the seasonal changes in constellations viewed in the night sky D) The duration of insolation will increase and the temperature will increase.
 the seasonal changes in constellations viewed in the night sky D) The duration of insolation will increase and the temperature will increase.") 1. Which event is a direct result of Earth's revolution? A) the apparent deflection of winds B) the changing of the Moon phases C) the seasonal changes in constellations viewed in the night sky D) the
1. Which event is a direct result of Earth's revolution? A) the apparent deflection of winds B) the changing of the Moon phases C) the seasonal changes in constellations viewed in the night sky D) the
Chapter 3. Materials and Methods
 Chapter 3 Materials and Methods CHAPTER3 MATERIALS AND METHODS The present study aims to identify the role of climatic factors in the dispersal of air pollutants released into the atmosphere at some important
Chapter 3. Regression-Based Models for Developing Commercial Demand Characteristics Investigation
 Chapter Regression-Based Models for Developing Commercial Demand Characteristics Investigation. Introduction Commercial area is another important area in terms of consume high electric energy in Japan.
Monthly Long Range Weather Commentary Issued: APRIL 1, 2015 Steven A. Root, CCM, President/CEO
 Monthly Long Range Weather Commentary Issued: APRIL 1, 2015 Steven A. Root, CCM, President/CEO sroot@weatherbank.com FEBRUARY 2015 Climate Highlights The Month in Review The February contiguous U.S. temperature
Experimental and Theoretical Study on the Optimal Tilt Angle of Photovoltaic Panels
 Experimental and Theoretical Study on the Optimal Tilt Angle of Photovoltaic Panels Naihong Shu* 1, Nobuhiro Kameda 2, Yasumitsu Kishida 2 and Hirotora Sonoda 3 1 Graduate School, Kyushu Kyoritsu University,
The Analysis of Ozone Precursors by AutoGC
 The Analysis of Ozone Precursors by AutoGC The Role of Calibration and Quality Control Strategies in Data Management for Fully Automated Thermal Desorption GC FID Systems Orsat, LLC 1416 Southmore Ave
SUPPORTING INFORMATION
 SUPPORTING INFORMATION An MCM modeling study of nitryl chloride (ClNO 2 ) impacts on oxidation, ozone production and nitrogen oxide partitioning in polluted continental outflow Theran P. Riedel 1,2, Glenn
Model Simulation of Ultrafine Particles inside a Road Tunnel
 Model Simulation of Ultrafine Particles inside a Road Tunnel A contribution to subproject SATURN L. Gidhagen 1,2, C. Johansson 2, A. Kristensson 3 and E.Swietlicki 3 1 Swedish Meteorological and Hydrological
SOLAR ACTIVITY DEPENDENCE OF EFFECTIVE WINDS DERIVED FROM IONOSPHERIC DATAAT WUHAN
 Pergamon wwwelseviercom/locate/asi doi: 1,116/SO27-1177()678-l Available online at wwwsciencedirectcom SClENCE DIRECT SOLAR ACTIVITY DEPENDENCE OF EFFECTIVE WINDS DERIVED FROM IONOSPHERIC DATAAT WUHAN
SERVOTOUGH SpectraScan
 SERVOTOUGH SpectraScan Continuous, real-time analysis of light hydrocarbons Jan Hordijk - Servomex Hydrocarbon stream analysis 5 major technologies used in HydroCarbon land for gas: IR (Infra Red) Laser
Optimization of Short-Term Traffic Count Plan to Improve AADT Estimation Error
 International Journal Of Engineering Research And Development e-issn: 2278-067X, p-issn: 2278-800X, www.ijerd.com Volume 13, Issue 10 (October 2017), PP.71-79 Optimization of Short-Term Traffic Count Plan
DEVELOPMENT OF A NEXT-GENERATION ENVIRONMENTAL CHAMBER FACILITY FOR CHEMICAL MECHANISM AND VOC REACTIVITY RESEARCH
 DEVELOPMENT OF A NEXT-GENERATION ENVIRONMENTAL CHAMBER FACILITY FOR CHEMICAL MECHANISM AND VOC REACTIVITY RESEARCH SUMMARY OF PROGRESS AND DRAFT RESEARCH PLAN BY WILLIAM P. L. CARTER COLLEGE OF ENGINEERING
A summary of the weather year based on data from the Zumwalt weather station
 ZUMWALT PRAIRIE WEATHER 2016 A summary of the weather year based on data from the Zumwalt weather station Figure 1. An unusual summer storm on July 10, 2016 brought the second-largest precipitation day
Improving the estimation of the true mean monthly and true mean annual air temperatures in Greece
 ATMOSPHERIC SCIENCE LETTERS Atmos. Sci. Let. (2015) Published online in Wiley Online Library (wileyonlinelibrary.com) DOI: 10.1002/asl.592 Improving the estimation of the true mean monthly and true mean
Identification of Hydrocarbons in Ambient Air
 Identification of Hydrocarbons in Ambient Air Randall Bramston-Cook and Edward Bramston-Cook Lotus Consulting 5781 Campo Walk, Long Beach, Ca 90803 310/569-0128 ebramstoncook@msn.com Presented at 2010
Which graph best shows the relationship between intensity of insolation and position on the Earth's surface? A) B) C) D)
 B) C) D)") 1. The hottest climates on Earth are located near the Equator because this region A) is usually closest to the Sun B) reflects the greatest amount of insolation C) receives the most hours of daylight D)
1. The hottest climates on Earth are located near the Equator because this region A) is usually closest to the Sun B) reflects the greatest amount of insolation C) receives the most hours of daylight D)
Influence of Biogenic VOCs on Photooxidant Formation: Simulation Experiments in EUPHORE and Comparison with Model Calculations
 Introduction Influence of Biogenic VOCs on Photooxidant Formation: Simulation Experiments in EUPHORE and Comparison with Model Calculations Fraunhofer Institut Atmosphärische Umweltforschung, IFU Kreuzeckbahnstr.
Supplement of A new source of methylglyoxal in the aqueous phase
 Supplement of Atmos. Chem. Phys., 16, 2689 2702, 2016 http://www.atmos-chem-phys.net/16/2689/2016/ doi:10.5194/acp-16-2689-2016-supplement Author(s) 2016. CC Attribution 3.0 License. Supplement of A new
Monthly Long Range Weather Commentary Issued: NOVEMBER 16, 2015 Steven A. Root, CCM, Chief Analytics Officer, Sr. VP, sales
 Monthly Long Range Weather Commentary Issued: NOVEMBER 16, 2015 Steven A. Root, CCM, Chief Analytics Officer, Sr. VP, sales sroot@weatherbank.com OCTOBER 2015 Climate Highlights The Month in Review The
Culway Weigh-In-Motion (WIM) Compensating for Calibration Drift Preliminary Report
 Compensating for Calibration Drift Preliminary Report") Department of Transport, Energy and Infrastructure Transport Information Management Section Culway Weigh-In-Motion (WIM) Compensating for Calibration Drift Preliminary Report CARL CARUANA Traffic Registrar
Department of Transport, Energy and Infrastructure Transport Information Management Section Culway Weigh-In-Motion (WIM) Compensating for Calibration Drift Preliminary Report CARL CARUANA Traffic Registrar
Supplementary information for manuscript. Burning of Olive Tree Branches: A Major Organic Aerosol Emission Source in the Mediterranean
 Supplementary information for manuscript Burning of Olive Tree Branches: A Major Organic Aerosol Emission Source in the Mediterranean Evangelia Kostenidou 1, Christos Kaltsonoudis 1,2, Maria Tsiflikiotou
5-7 Organic Chemistry Trilogy
 5-7 Organic Chemistry Trilogy.0 A student investigated the viscosity of liquid hydrocarbons. The student used this method:. Measure 40 cm 3 of the liquid hydrocarbon. 2. Pour the liquid hydrocarbon into