Research Article Weather Forecasting Using Sliding Window Algorithm
|
|
|
- Lynn Blair
- 5 years ago
- Views:
Transcription
1 ISRN Signal Processing Volume 23, Article ID 5654, 5 pages Research Article Weather Forecasting Using Sliding Window Algorithm Piyush Kapoor and Sarabjeet Singh Bedi 2 KvantumInc.,Gurgaon22,India 2 MJP Rohilkhand University, Bareilly 2436, India Correspondence should be addressed to Piyush Kapoor; piyushkapoor7@yahoo.com Received 7 June 23; Accepted 9 August 23 Academic Editors: W.-L. Hwang and G. A. Tsihrintzis Copyright 23 P. Kapoor and S. S. Bedi. This is an open access article distributed under the Creative Commons Attribution License, which permits unrestricted use, distribution, and reproduction in any medium, provided the original work is properly cited. To predict the future s weather condition, the variation in the conditions in past years must be utilized. The probability that the weather condition of the day in consideration will match the same day in previous year is very less. But the probability that it will match within the span of adjacent fortnight of previous year is very high. So, for the fortnight considered for previous year a sliding window is selected of size equivalent to a week. Every week of sliding window is then matched with that of current year s week in consideration. The window best matched is made to participate in the process of predicting weather conditions. The prediction is made based on sliding window algorithm. The monthwise results are being computed for three years to check the accuracy. The results of the approach suggested that the method used for weather condition prediction is quite efficient with an average accuracy of 92.2%.. Introduction Weather forecasting is mainly concerned with the prediction of weather condition in the given future time. Weather forecasts provide critical information about future weather. There are various approaches available in weather forecasting, from relatively simple observation of the sky to highly complex computerized mathematical models. The prediction of weather condition is essential for various applications. Some of them are climate monitoring, drought detection, severe weather prediction, agriculture and production, planning in energy industry, aviation industry, communication, pollution dispersal, and so forth, []. In military operations, there is a considerable historical record of instances when weather conditions have altered the course of battles. Accurate prediction of weather conditions is a difficult task due to the dynamic nature of atmosphere. The weather condition at any instance may be represented by some variables. Out of those variables, one found that the most significant are being selected to be involved in the process of prediction. The selection of variables is dependent on the location for which the prediction is to be made. The variables and their range always varyfromplacetoplace.theweatherconditionofanydayhas some relationship with the weather condition existed in the same tenure of precious year and previous week. A statistical model is designed [2] that could predict the rainfall and temperature with the help of past data by making use of time-delayed feed forward neural network. Artificial neural network was combined with the genetic algorithm to get the more optimized prediction [3]. An improved technique that uses artificial neural network with photovoltaic system was proposed by Isa et al. [4] that utilizes perceptron model with Levenberg Marquardt algorithm. Apart from neural network Fuzzy logic has also been being used in weather prediction models. The rainfall was classified into three fuzzy sets which can be predicted by making use of simple fuzzy rules [5]. Also a fuzzy self-regression model was proposed by Lu Feng and Xu xiao Guang [6]whichmakesuse of the form of self-related sequence number according to observednumber.theself-relatedcoefficientswerecomputed by making use of Fuzzy Logic [7]. A combined approach of neural network with Fuzzy Logic is being proposed for the weather prediction system. The work has applied principle component analysis technique to the fuzzy data by making use of Autoassociative neural networks.
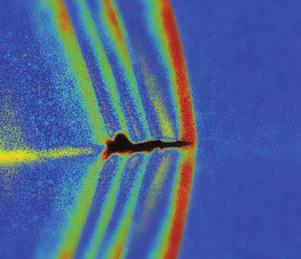
2 2 ISRN Signal Processing But the major shortcoming in the techniques proposed above that they utilized the previous weather conditions to predict the ones in future, but the underlying relationship that exists between previous data had not been being mathematically described and analyzed. The techniques using artificial neural networks (ANN) were only concerned with the adjustment of weights in order to get correct output from the given input. But no relationship among the data was mathematically defined. Also the ANN techniques suffered from anomalies like local minima, overfitting, and so forth. Another problem is that it is hard to decide how much trainingdataissufficienttoadjustweightssothatoptimalaccuracy of the predicted weather conditions can be achieved. The number of other techniques for weather forecasting that used regression with machine learning algorithms was proposed in [8, 9]. But a mathematical model that could represent the relationship among previous data that could be used for prediction is still desired. A new sliding window approach for the same is being proposed in this text for weather prediction. 2. Proposed Work 2.. Methodology. There is always a slightly variation in weather conditions which may depend upon the last seven days or so variation. Here variation refers to difference between previous day parameter and present day s parameter. Also there exists a dependency between the weather conditions persisting in current week in consideration and those of previous years. In this work a methodology is being proposed that could mathematically model these two types of dependency and utilize them to predict the future s weather conditions. To predict the day s weather conditions this work will take into account the conditions prevailing in previous week, thatis,inlastsevendayswhichareassumedtobeknown. Also the weather condition of seven previous days and seven upcoming days for previous year is taken into consideration. For instance if the weather condition of 6 November 22 is to be predicted then we will take into consideration the conditions from 9 November 22 to 5 November 22 and conditions from 9 November to 22 November 2 for previous years. Now in order to model the aforesaid dependencies the current year s variation throughout the week is being matched with those of previous years by making use of sliding window. The best-matched window is selected to make the prediction. The selected window and the current year s weekly variations are together used to predict the weather condition. The reason for applying sliding window matching is that the weather conditions prevailing in a year may not lie or fall on exactly the same date as they might have existed in previous years. That is why seven previous days and seven ongoing days are being considered. Hence a total period of fortnight is checked in previous condition to find the similar one. Sliding window is quite good technique to capture the variation that could match the current year s variation Sliding Window Algorithm. The work proposes to predict a day s weather conditions. For this the previous seven days weather is taken into consideration along with fortnight weather conditions of past years. Suppose we need to predict S. No. Max temp Min temp. Humidity Rainfall Figure : Sliding window concept where W represents Window number and W 2 represent window number 2. weatherof23rdaugust23thenwewilltakeintoconsideration the weather conditions of 6th August 23 to 22nd August 23 along with the weather conditions prevailing in thespanof6thaugustto29thaugustinpastyears.then the day by day variation in current year is computed. The variation is also being computed from the fortnight data of previous year. In this work the four major weather parameters will be taken into consideration, that is, maximum temperature, minimum temperature, Humidity and Rainfall. Hence thesizeofthevariationofthecurrentyearwillberepresented by matrix of size 7 4.Andsimilarlyforpastyearthematrix size would be 4 4. Now, the first step is to divide the matrix of size 4 4 into the sliding windows. Hence, 8 sliding windows can be made of size 7 4each. The concept of sliding window is shown in Figure. Now the next step is to compare every window with the current year s variation. The best-matched window is selected for making the prediction. The Euclidean distance approach isusedforthepurposeofmatching.thereasonfortaking Euclidean distance is its power to represent similarity in spite of its simplicity. Following are the parameters used for the weather condition prediction: () mean: mean of day s weather conditions, that is, maximum temperature, minimum temperature, humidity, and rainfall. After adding each separately, and divide by total day s number Mean = W W 2 Sum of parameter number of days, () (2) variation: calculate day by day variation after taking difference of each parameter. This tells how the next day s Weather is related to previous day s weather; (3) euclidean distance: it compares data variation of current year and previous year. Bythisweareabletomathematicallymodeltheaforesaid defined dependencies. That the relationship between previous year and previous week data is being defined mathematically can be used to predict the future conditions.
3 ISRN Signal Processing 3 Step. Take matrix CD of last seven days for current year s data of size 7 4. Step 2. Take matrix PD of fourteen days for previous year s data of size 4 4. Step 3. Make 8 sliding windows of size 7 4each from the matrix PD as W,W 2,W 3,...,W 8 Step 4. Compute the Euclidean distance of each sliding window with the matrix CD as ED, ED 2, ED 3,...,ED 8 Step 5.SelectmatrixW i as W i = Correponding Matrix (Min.(ED i )) i [, 8] Step 6.Fork =ton (i) For WC k compute the variation vector for the matrix CD of size 6 as VC. (ii) For WC k compute the variation vector for the matrix PD of size 6 as VP. (iii) Mean =Mean(VC) (iv) Mean 2 =Mean(VP) (v) Variation V =(Mean + Mean 2 )/2 (vi) Add V to the previous day s weather condition in consideration to get the predicted condition. Step 7. End Algorithm The sliding window used for predicting the n number of weather conditions (WC, WC 2, WC 3,...,WC n ) is shown in Algorithm. The main logic behind using sliding window approach is that the weather conditions prevailing at some span of day in the year might not have existed in the same span of days in previous year. For instance the weather condition in first week of February 2 might not have existed in the first week of February in 29. The similar weather conditions might have prevailed in previous year but not necessarily in same week but in some days. The probability of finding the similar weather conditions are maximum at the considered fortnight spam. 3. Results and Discussion The previous algorithm is being tested against weather data fortheyears26to2ofthechampawatcity,uttaranchal. The data has been taken from Pantnagar Weather Forecasting Centre. The algorithm has been executed and tested in Matlab 2a version. Thus, in the algorithm in consideration thepreviousyear sdataisbeingutilizedforpredictingthe weather conditions. Hence, the algorithm is tested to predict weather condition for three years, that is, 28 2, which is being tested against the available data. Also it can be concludedthatlearningapproachusedinthealgorithmis supervised. In the test four weather conditions are taken into consideration, that is, minimum temperature, maximum temperature, humidity and rainfall. Temperature, in general, canbemeasuredtoahigherdegreeofaccuracyrelativetoany of the other weather variables. The data of these four factors aretakendaywiseforthepreviouslymentionedfouryears. The algorithm is also being tested daywise. Figures 2, 3, 4, and5 show the variation of actual and predicted four weather conditions for the year 2 day wise. These graphs clearly shows least variation among the actual and predicted weather conditions. The monthwise accuracy of predicted weather conditions is being given in Table Actually Max temp Figure 2: A graph representing predicated versus actual maximum temperature for year 2. Table Month Accuracy of predicted data Jan 97.24% Feb 88.94% Mar 92.25% Apr 98.7% May 93.49% Jun 99.2% Jul 87.9% Aug 78.83% Sep 79.23% Oct 94.35% Nov 98.78% Dec 95.73%


4 4 ISRN Signal Processing Original Figure 3: A graph representing predicated versus actual minimum temperature for the year Original Figure 4: A graph representing predicated versus actual humidity for the year 2. The above result of weather conditions have been from an Indian city. India has a typically tropical type of weather, that is, the weather which has all varieties. The Champawat city lies in the state of Uttaranchal which lies in the planes of Ganges. The monthwise accuracy in Table can be understood by the following facts. The months of April, May, and June are considered to be of summers which correspond to high temperature. The months of November, December, and January are winters having low or cold temperature conditions. Thus, the factors like temperature are quite fixed in these months and hence the accuracy for these is also high. In contrast the months like February, March, August, and September are considered to be the months when weather changes,thatis,aphaseoftransitionfromoneseasonto another. In the months of February and March, the winter season is shifted to summer. And in the month of August and September, the summer is getting over and, winter starts Original Figure 5 Figure 5: A graph representing predicated versus actual rain for the year 2. coming. And hence the weather condition becomes highly unpredictableinthesemonths.alsoitisobservedthatthe weather conditions vary greatly in these months from year to year. This is also being reflected in the results. 4. Conclusion and Future Work The comparison of weather condition variation using sliding window approach has been found to be highly accurate except for the months of seasonal change where conditions are highly unpredictable. The results can be altered by changing the size of the window. Accuracy of the unpredictable months can be increased by increasing the window size to one month. Since ANN techniques are very good in mapping Inputs and outputs, the sliding window algorithm if incorporated with ANN could improve the results drastically even for the months of seasonal change. References [] Y. Radhika and M. Shashi, Atmospheric temperature prediction using support vector machines, Computer Theory and Engineering, vol.,no.,pp , 29. [2]L.L.Lai,H.Braun,Q.P.Zhangetal., Intelligentweather forecast, in Proceedings of the International Conference on Machine Learning and Cybernetics, pp , Shanghai, China, August 24. [3] J. Gill, B. Singh, and S. Singh, Training back propagation neural networks with genetic algorithm for weather forecasting, in Proceedings of the 8th IEEE International Symposium on Intelligent Systems and Informatics (SIISY ), pp , September 2. [4]I.S.Isa,S.Omar,Z.Saad,N.M.Noor,andM.K.Osman, Weather forecasting using photovoltaic system and Neural Network, in Proceedings of the 2nd International Conference 349
5 ISRN Signal Processing 5 on Computational Intelligence, Communication Systems and Networks,pp.96,July2. [5]L.Zuoyong,C.Zhenpei,andL.Jitao, Amodelofweather forecast by fuzzy grade statistics, Fuzzy Sets and Systems, vol. 26, no. 3, pp , 988. [6] L.F.LuFengandX.X.G.XuxiaoGuang, Aforecastingmodel of fuzzy self-regression, Fuzzy Sets and Systems, vol. 58, no. 2, pp ,993. [7] T. Denoeux and M.-H. Masson, Principal component analysis of fuzzy data using autoassociative neural networks, IEEE Transactions on Fuzzy Systems,vol.2,no.3,pp ,24. [8] R. Collobert and S. Bengio, SVMTorch: support vector machines for large-scale regression problems, Machine Learning Research,vol.,no.2,pp.43 6,2. [9] P.-S. Yu, S.-T. Chen, and I.-F. Chang, Support vector regression for real-time flood stage forecasting, Hydrology,vol. 328, no. 3-4, pp , 26.


6 Rotating Machinery Engineering The Scientific World Journal Distributed Sensor Networks Sensors Control Science and Engineering Advances in Civil Engineering Submit your manuscripts at Electrical and Computer Engineering Robotics VLSI Design Advances in OptoElectronics Navigation and Observation Chemical Engineering Active and Passive Electronic Components Antennas and Propagation Aerospace Engineering Modelling & Simulation in Engineering Shock and Vibration Advances in Acoustics and Vibration
WHEN IS IT EVER GOING TO RAIN? Table of Average Annual Rainfall and Rainfall For Selected Arizona Cities
 WHEN IS IT EVER GOING TO RAIN? Table of Average Annual Rainfall and 2001-2002 Rainfall For Selected Arizona Cities Phoenix Tucson Flagstaff Avg. 2001-2002 Avg. 2001-2002 Avg. 2001-2002 October 0.7 0.0
Global Climates. Name Date
 Global Climates Name Date No investigation of the atmosphere is complete without examining the global distribution of the major atmospheric elements and the impact that humans have on weather and climate.
YACT (Yet Another Climate Tool)? The SPI Explorer
? The SPI Explorer") YACT (Yet Another Climate Tool)? The SPI Explorer Mike Crimmins Assoc. Professor/Extension Specialist Dept. of Soil, Water, & Environmental Science The University of Arizona Yes, another climate tool for
YACT (Yet Another Climate Tool)? The SPI Explorer Mike Crimmins Assoc. Professor/Extension Specialist Dept. of Soil, Water, & Environmental Science The University of Arizona Yes, another climate tool for
Weather Prediction Using Historical Data
 Weather Prediction Using Historical Data COMP 381 Project Report Michael Smith 1. Problem Statement Weather prediction is a useful tool for informing populations of expected weather conditions. Weather
Champaign-Urbana 2000 Annual Weather Summary
 Champaign-Urbana 2000 Annual Weather Summary ILLINOIS STATE WATER SURVEY 2204 Griffith Dr. Champaign, IL 61820 wxobsrvr@sws.uiuc.edu Maria Peters, Weather Observer January: January started on a mild note,
Research Article The Application of Baum-Welch Algorithm in Multistep Attack
 e Scientific World Journal, Article ID 374260, 7 pages http://dx.doi.org/10.1155/2014/374260 Research Article The Application of Baum-Welch Algorithm in Multistep Attack Yanxue Zhang, 1 Dongmei Zhao, 2
Short Term Load Forecasting Using Multi Layer Perceptron
 International OPEN ACCESS Journal Of Modern Engineering Research (IJMER) Short Term Load Forecasting Using Multi Layer Perceptron S.Hema Chandra 1, B.Tejaswini 2, B.suneetha 3, N.chandi Priya 4, P.Prathima
Chiang Rai Province CC Threat overview AAS1109 Mekong ARCC
 Chiang Rai Province CC Threat overview AAS1109 Mekong ARCC This threat overview relies on projections of future climate change in the Mekong Basin for the period 2045-2069 compared to a baseline of 1980-2005.
SOIL MOISTURE MODELING USING ARTIFICIAL NEURAL NETWORKS
 Int'l Conf. Artificial Intelligence ICAI'17 241 SOIL MOISTURE MODELING USING ARTIFICIAL NEURAL NETWORKS Dr. Jayachander R. Gangasani Instructor, Department of Computer Science, jay.gangasani@aamu.edu Dr.
Agricultural Science Climatology Semester 2, Anne Green / Richard Thompson
 Agricultural Science Climatology Semester 2, 2006 Anne Green / Richard Thompson http://www.physics.usyd.edu.au/ag/agschome.htm Course Coordinator: Mike Wheatland Course Goals Evaluate & interpret information,
Research Article Calculation for Primary Combustion Characteristics of Boron-Based Fuel-Rich Propellant Based on BP Neural Network
 Combustion Volume 2012, Article ID 635190, 6 pages doi:10.1155/2012/635190 Research Article Calculation for Primary Combustion Characteristics of Boron-Based Fuel-Rich Propellant Based on BP Neural Network
PROJECT REPORT (ASL 720) CLOUD CLASSIFICATION
 CLOUD CLASSIFICATION") PROJECT REPORT (ASL 720) CLOUD CLASSIFICATION SUBMITTED BY- PRIYANKA GUPTA 2011CH70177 RINI KAPOOR 2011CH70179 INDIVIDUAL CONTRIBUTION- Priyanka Gupta- analysed data of region considered in India (West:80,
PROJECT REPORT (ASL 720) CLOUD CLASSIFICATION SUBMITTED BY- PRIYANKA GUPTA 2011CH70177 RINI KAPOOR 2011CH70179 INDIVIDUAL CONTRIBUTION- Priyanka Gupta- analysed data of region considered in India (West:80,
Average temperature ( F) World Climate Zones. very cold all year with permanent ice and snow. very cold winters, cold summers, and little rain or snow
 World Climate Zones. very cold all year with permanent ice and snow. very cold winters, cold summers, and little rain or snow") P r e v i e w Look carefully at the climagraph of Mumbai, India. What is the wettest month (or months) in Mumbai? What is the driest month (or months) in Mumbai? What effects might this city s climate
P r e v i e w Look carefully at the climagraph of Mumbai, India. What is the wettest month (or months) in Mumbai? What is the driest month (or months) in Mumbai? What effects might this city s climate
Application of Text Mining for Faster Weather Forecasting
 International Journal of Computer Engineering and Information Technology VOL. 8, NO. 11, November 2016, 213 219 Available online at: www.ijceit.org E-ISSN 2412-8856 (Online) Application of Text Mining
Interannual variation of MODIS NDVI in Lake Taihu and its relation to climate in submerged macrophyte region
 Yale-NUIST Center on Atmospheric Environment Interannual variation of MODIS NDVI in Lake Taihu and its relation to climate in submerged macrophyte region ZhangZhen 2015.07.10 1 Outline Introduction Data
OVERVIEW OF IMPROVED USE OF RS INDICATORS AT INAM. Domingos Mosquito Patricio
 OVERVIEW OF IMPROVED USE OF RS INDICATORS AT INAM Domingos Mosquito Patricio domingos.mosquito@gmail.com Introduction to Mozambique /INAM Introduction to AGRICAB/SPIRITS Objectives Material & Methods Results
MISSION DEBRIEFING: Teacher Guide
 Activity 2: It s Raining Again?! Using real data from one particular location, students will interpret a graph that relates rainfall to the number of cases of malaria. Background The relationship between
WEATHER PREDICTION FOR INDIAN LOCATION USING MACHINE LEARNING
 Volume 118 No. 22 2018, 1945-1949 ISSN: 1314-3395 (on-line version) url: http://acadpubl.eu/hub ijpam.eu WEATHER PREDICTION FOR INDIAN LOCATION USING MACHINE LEARNING 1 Jitcha Shivang, 2 S.S Sridhar 1
Champaign-Urbana 1999 Annual Weather Summary
 Champaign-Urbana 1999 Annual Weather Summary ILLINOIS STATE WATER SURVEY 2204 Griffith Dr. Champaign, IL 61820 wxobsrvr@sws.uiuc.edu Maria Peters, Weather Observer A major snowstorm kicked off the new
U.S. Outlook For October and Winter Thursday, September 19, 2013
 About This report coincides with today s release of the monthly temperature and precipitation outlooks for the U.S. from the Climate Prediction Center (CPC). U.S. CPC October and Winter Outlook The CPC
Champaign-Urbana 2001 Annual Weather Summary
 Champaign-Urbana 2001 Annual Weather Summary ILLINOIS STATE WATER SURVEY 2204 Griffith Dr. Champaign, IL 61820 wxobsrvr@sws.uiuc.edu Maria Peters, Weather Observer January: After a cold and snowy December,
Jackson County 2013 Weather Data
 Jackson County 2013 Weather Data 61 Years of Weather Data Recorded at the UF/IFAS Marianna North Florida Research and Education Center Doug Mayo Jackson County Extension Director 1952-2008 Rainfall Data
2015 Fall Conditions Report
 2015 Fall Conditions Report Prepared by: Hydrologic Forecast Centre Date: December 21 st, 2015 Table of Contents Table of Figures... ii EXECUTIVE SUMMARY... 1 BACKGROUND... 2 SUMMER AND FALL PRECIPITATION...
GAMINGRE 8/1/ of 7
 FYE 09/30/92 JULY 92 0.00 254,550.00 0.00 0 0 0 0 0 0 0 0 0 254,550.00 0.00 0.00 0.00 0.00 254,550.00 AUG 10,616,710.31 5,299.95 845,656.83 84,565.68 61,084.86 23,480.82 339,734.73 135,893.89 67,946.95
Changing Hydrology under a Changing Climate for a Coastal Plain Watershed
 Changing Hydrology under a Changing Climate for a Coastal Plain Watershed David Bosch USDA-ARS, Tifton, GA Jeff Arnold ARS Temple, TX and Peter Allen Baylor University, TX SEWRU Objectives 1. Project changes
Comparison of Adaline and Multiple Linear Regression Methods for Rainfall Forecasting
 Journal of Physics: Conference Series PAPER OPEN ACCESS Comparison of Adaline and Multiple Linear Regression Methods for Rainfall Forecasting To cite this article: IP Sutawinaya et al 2018 J. Phys.: Conf.
Sierra Weather and Climate Update
 Sierra Weather and Climate Update 2014-15 Kelly Redmond Western Regional Climate Center Desert Research Institute Reno Nevada Yosemite Hydroclimate Workshop Yosemite Valley, 2015 October 8-9 Percent of
DESIGN AND DEVELOPMENT OF ARTIFICIAL INTELLIGENCE SYSTEM FOR WEATHER FORECASTING USING SOFT COMPUTING TECHNIQUES
 DESIGN AND DEVELOPMENT OF ARTIFICIAL INTELLIGENCE SYSTEM FOR WEATHER FORECASTING USING SOFT COMPUTING TECHNIQUES Polaiah Bojja and Nagendram Sanam Department of Electronics and Communication Engineering,
Chapter-3 GEOGRAPHICAL LOCATION, CLIMATE AND SOIL CHARACTERISTICS OF THE STUDY SITE
 Chapter-3 GEOGRAPHICAL LOCATION, CLIMATE AND SOIL CHARACTERISTICS OF THE STUDY SITE Chapter-3 GEOGRAPHICAL LOCATION, CLIMATE AND SOIL CHARACTERISTICS OF THE STUDY SITE Assam, the eastern most state of
Will a warmer world change Queensland s rainfall?
 Will a warmer world change Queensland s rainfall? Nicholas P. Klingaman National Centre for Atmospheric Science-Climate Walker Institute for Climate System Research University of Reading The Walker-QCCCE
Determine the trend for time series data
 Extra Online Questions Determine the trend for time series data Covers AS 90641 (Statistics and Modelling 3.1) Scholarship Statistics and Modelling Chapter 1 Essent ial exam notes Time series 1. The value
Minnesota s Climatic Conditions, Outlook, and Impacts on Agriculture. Today. 1. The weather and climate of 2017 to date
 Minnesota s Climatic Conditions, Outlook, and Impacts on Agriculture Kenny Blumenfeld, State Climatology Office Crop Insurance Conference, Sep 13, 2017 Today 1. The weather and climate of 2017 to date
Future Weather in Toronto and the GTA
 Future Weather in Toronto and the GTA Due to Climate Change Electrical Sector Meeting, Nov. 23 rd, 2011 Christopher Ll. Morgan, PhD Toronto Environment Office Contents 2 Introduction (Why We Did What We
Physical Features of Monsoon Asia. 192 Unit 7 Teachers Curriculum Institute 60 N 130 E 140 E 150 E 60 E 50 N 160 E 40 N 30 N 150 E.
 50 N 60 E 70 E 80 E 90 E 100 E 60 N 110 E 120 E 130 E 140 E 150 E 50 N 160 E 40 N 40 N 30 N 60 E 30 N 150 E Tropic of Cancer 20 N Tropic of Cancer 20 N 10 N 10 N 0 Equator 0 Equator 10 S 10 S 0 500 1,000
Research Article Travel-Time Difference Extracting in Experimental Study of Rayleigh Wave Acoustoelastic Effect
 ISRN Mechanical Engineering, Article ID 3492, 7 pages http://dx.doi.org/.55/24/3492 Research Article Travel-Time Difference Extracting in Experimental Study of Rayleigh Wave Acoustoelastic Effect Hu Eryi
Calculations Equation of Time. EQUATION OF TIME = apparent solar time - mean solar time
 Calculations Equation of Time APPARENT SOLAR TIME is the time that is shown on sundials. A MEAN SOLAR DAY is a constant 24 hours every day of the year. Apparent solar days are measured from noon one day
Study of Changes in Climate Parameters at Regional Level: Indian Scenarios
 Study of Changes in Climate Parameters at Regional Level: Indian Scenarios S K Dash Centre for Atmospheric Sciences Indian Institute of Technology Delhi Climate Change and Animal Populations - The golden
Third Grade Math and Science DBQ Weather and Climate/Representing and Interpreting Charts and Data - Teacher s Guide
 Third Grade Math and Science DBQ Weather and Climate/Representing and Interpreting Charts and Data - Teacher s Guide A document based question (DBQ) is an authentic assessment where students interact with
2019 Settlement Calendar for ASX Cash Market Products. ASX Settlement
 2019 Settlement Calendar for ASX Cash Market Products ASX Settlement Settlement Calendar for ASX Cash Market Products 1 ASX Settlement Pty Limited (ASX Settlement) operates a trade date plus two Business
US Drought Status. Droughts 1/17/2013. Percent land area affected by Drought across US ( ) Dev Niyogi Associate Professor Dept of Agronomy
 Dev Niyogi Associate Professor Dept of Agronomy") Droughts US Drought Status Dev Niyogi Associate Professor Dept of Agronomy Deptof Earth Atmospheric Planetary Sciences Indiana State Climatologist Purdue University LANDSURFACE.ORG iclimate.org climate@purdue.edu
Droughts US Drought Status Dev Niyogi Associate Professor Dept of Agronomy Deptof Earth Atmospheric Planetary Sciences Indiana State Climatologist Purdue University LANDSURFACE.ORG iclimate.org climate@purdue.edu
International Journal of Computer Science Trends and Technology (IJCST) Volume 3 Issue 3, May-June 2015
 Volume 3 Issue 3, May-June 2015") RESEARCH ARTICLE OPEN ACCESS Analysis of Meteorological Data in of Tamil Nadu Districts Based On K- Means Clustering Algorithm M. Mayilvaganan [1], P. Vanitha [2] Department of Computer Science [2], PSG
RESEARCH ARTICLE OPEN ACCESS Analysis of Meteorological Data in of Tamil Nadu Districts Based On K- Means Clustering Algorithm M. Mayilvaganan [1], P. Vanitha [2] Department of Computer Science [2], PSG
Country Presentation-Nepal
 Country Presentation-Nepal Mt.Everest, Shiva Pd. Nepal, DHM South Asia Drought Monitor Workshop Dhaka Bangladesh 2 th April 215 Overview Brief Climatology Climate activities- DHM PPCR (Pilot Program for
Constructing a typical meteorological year -TMY for Voinesti fruit trees region and the effects of global warming on the orchard ecosystem
 Constructing a typical meteorological year -TMY for Voinesti fruit trees region and the effects of global warming on the orchard ecosystem ARMEANU ILEANA*, STĂNICĂ FLORIN**, PETREHUS VIOREL*** *University
STATISTICAL FORECASTING and SEASONALITY (M. E. Ippolito; )
") STATISTICAL FORECASTING and SEASONALITY (M. E. Ippolito; 10-6-13) PART I OVERVIEW The following discussion expands upon exponential smoothing and seasonality as presented in Chapter 11, Forecasting, in
STATISTICAL FORECASTING and SEASONALITY (M. E. Ippolito; 10-6-13) PART I OVERVIEW The following discussion expands upon exponential smoothing and seasonality as presented in Chapter 11, Forecasting, in
Third Grade Math and Science DBQ Weather and Climate/Representing and Interpreting Charts and Data
 Third Grade Math and Science DBQ Weather and Climate/Representing and Interpreting Charts and Data A document based question (DBQ) is an authentic assessment where students interact with content related
Research Article Simplified Robotics Joint-Space Trajectory Generation with a via Point Using a Single Polynomial
 Robotics Volume, Article ID 75958, 6 pages http://dx.doi.org/.55//75958 Research Article Simplified Robotics Joint-Space Trajectory Generation with a via Point Using a Single Polynomial Robert L. Williams
MONTHLY RESERVOIR INFLOW FORECASTING IN THAILAND: A COMPARISON OF ANN-BASED AND HISTORICAL ANALOUGE-BASED METHODS
 Annual Journal of Hydraulic Engineering, JSCE, Vol.6, 5, February MONTHLY RESERVOIR INFLOW FORECASTING IN THAILAND: A COMPARISON OF ANN-BASED AND HISTORICAL ANALOUGE-BASED METHODS Somchit AMNATSAN, Yoshihiko
Analysis of Rainfall and Other Weather Parameters under Climatic Variability of Parbhani ( )
") International Journal of Current Microbiology and Applied Sciences ISSN: 2319-7706 Volume 7 Number 06 (2018) Journal homepage: http://www.ijcmas.com Original Research Article https://doi.org/10.20546/ijcmas.2018.706.295
International Journal of Current Microbiology and Applied Sciences ISSN: 2319-7706 Volume 7 Number 06 (2018) Journal homepage: http://www.ijcmas.com Original Research Article https://doi.org/10.20546/ijcmas.2018.706.295
Lesson Adaptation Activity: Analyzing and Interpreting Data
 Lesson Adaptation Activity: Analyzing and Interpreting Data Related MA STE Framework Standard: 3-ESS2-1. Use graphs and tables of local weather data to describe and predict typical weather during a particular
peak half-hourly New South Wales
 Forecasting long-term peak half-hourly electricity demand for New South Wales Dr Shu Fan B.S., M.S., Ph.D. Professor Rob J Hyndman B.Sc. (Hons), Ph.D., A.Stat. Business & Economic Forecasting Unit Report
1. Introduction. 2. Artificial Neural Networks and Fuzzy Time Series
 382 IJCSNS International Journal of Computer Science and Network Security, VOL.8 No.9, September 2008 A Comparative Study of Neural-Network & Fuzzy Time Series Forecasting Techniques Case Study: Wheat
Champaign-Urbana 1998 Annual Weather Summary
 Champaign-Urbana 1998 Annual Weather Summary ILLINOIS STATE WATER SURVEY Audrey Bryan, Weather Observer 2204 Griffith Dr. Champaign, IL 61820 wxobsrvr@sparc.sws.uiuc.edu The development of the El Nìno
Jackson County 2018 Weather Data 67 Years of Weather Data Recorded at the UF/IFAS Marianna North Florida Research and Education Center
 Jackson County 2018 Weather Data 67 Years of Weather Data Recorded at the UF/IFAS Marianna North Florida Research and Education Center Doug Mayo Jackson County Extension Director 1952-2008 Rainfall Data
UPDATE OF REGIONAL WEATHER AND SMOKE HAZE (December 2017)
") UPDATE OF REGIONAL WEATHER AND SMOKE HAZE (December 2017) 1. Review of Regional Weather Conditions for November 2017 1.1 In November 2017, Southeast Asia experienced inter-monsoon conditions in the first
UPDATE OF REGIONAL WEATHER AND SMOKE HAZE (December 2017) 1. Review of Regional Weather Conditions for November 2017 1.1 In November 2017, Southeast Asia experienced inter-monsoon conditions in the first
STOCHASTIC MODELING OF MONTHLY RAINFALL AT KOTA REGION
 STOCHASTIC MODELIG OF MOTHLY RAIFALL AT KOTA REGIO S. R. Bhakar, Raj Vir Singh, eeraj Chhajed and Anil Kumar Bansal Department of Soil and Water Engineering, CTAE, Udaipur, Rajasthan, India E-mail: srbhakar@rediffmail.com
Research Article Partial Pole Placement in LMI Region
 Control Science and Engineering Article ID 84128 5 pages http://dxdoiorg/11155/214/84128 Research Article Partial Pole Placement in LMI Region Liuli Ou 1 Shaobo Han 2 Yongji Wang 1 Shuai Dong 1 and Lei
Multivariate Regression Model Results
 Updated: August, 0 Page of Multivariate Regression Model Results 4 5 6 7 8 This exhibit provides the results of the load model forecast discussed in Schedule. Included is the forecast of short term system
Climate also has a large influence on how local ecosystems have evolved and how we interact with them.
 The Mississippi River in a Changing Climate By Paul Lehman, P.Eng., General Manager Mississippi Valley Conservation (This article originally appeared in the Mississippi Lakes Association s 212 Mississippi
The 2010/11 drought in the Horn of Africa: Monitoring and forecasts using ECMWF products
 The 2010/11 drought in the Horn of Africa: Monitoring and forecasts using ECMWF products Emanuel Dutra Fredrik Wetterhall Florian Pappenberger Souhail Boussetta Gianpaolo Balsamo Linus Magnusson Slide
Statistical Analysis of Temperature and Rainfall Trend in Raipur District of Chhattisgarh
 Current World Environment Vol. 10(1), 305-312 (2015) Statistical Analysis of Temperature and Rainfall Trend in Raipur District of Chhattisgarh R. Khavse*, R. Deshmukh, N. Manikandan, J. L Chaudhary and
Tracking the Climate Of Northern Colorado Nolan Doesken State Climatologist Colorado Climate Center Colorado State University
 Tracking the Climate Of Northern Colorado Nolan Doesken State Climatologist Colorado Climate Center Colorado State University Northern Colorado Business Innovations November 20, 2013 Loveland, Colorado
Analysis of Historical Pattern of Rainfall in the Western Region of Bangladesh
 24 25 April 214, Asian University for Women, Bangladesh Analysis of Historical Pattern of Rainfall in the Western Region of Bangladesh Md. Tanvir Alam 1*, Tanni Sarker 2 1,2 Department of Civil Engineering,
Global climate predictions: forecast drift and bias adjustment issues
 www.bsc.es Ispra, 23 May 2017 Global climate predictions: forecast drift and bias adjustment issues Francisco J. Doblas-Reyes BSC Earth Sciences Department and ICREA Many of the ideas in this presentation
Final Report. COMET Partner's Project. University of Texas at San Antonio
 Final Report COMET Partner's Project University: Name of University Researcher Preparing Report: University of Texas at San Antonio Dr. Hongjie Xie National Weather Service Office: Name of National Weather
The Research of Urban Rail Transit Sectional Passenger Flow Prediction Method
 Journal of Intelligent Learning Systems and Applications, 2013, 5, 227-231 Published Online November 2013 (http://www.scirp.org/journal/jilsa) http://dx.doi.org/10.4236/jilsa.2013.54026 227 The Research
DAILY QUESTIONS 28 TH JUNE 18 REASONING - CALENDAR
 DAILY QUESTIONS 28 TH JUNE 18 REASONING - CALENDAR LEAP AND NON-LEAP YEAR *A non-leap year has 365 days whereas a leap year has 366 days. (as February has 29 days). *Every year which is divisible by 4
2003 Water Year Wrap-Up and Look Ahead
 2003 Water Year Wrap-Up and Look Ahead Nolan Doesken Colorado Climate Center Prepared by Odie Bliss http://ccc.atmos.colostate.edu Colorado Average Annual Precipitation Map South Platte Average Precipitation
Research Article Propagation Characteristics of Oblique Incident Terahertz Wave in Nonuniform Dusty Plasma
 Antennas and Propagation Volume 216, Article ID 945473, 6 pages http://dx.doi.org/1.1155/216/945473 Research Article Propagation Characteristics of Oblique Incident Terahert Wave in Nonuniform Dusty Plasma
Direct Normal Radiation from Global Radiation for Indian Stations
 RESEARCH ARTICLE OPEN ACCESS Direct Normal Radiation from Global Radiation for Indian Stations Jaideep Rohilla 1, Amit Kumar 2, Amit Tiwari 3 1(Department of Mechanical Engineering, Somany Institute of
peak half-hourly Tasmania
 Forecasting long-term peak half-hourly electricity demand for Tasmania Dr Shu Fan B.S., M.S., Ph.D. Professor Rob J Hyndman B.Sc. (Hons), Ph.D., A.Stat. Business & Economic Forecasting Unit Report for
Highlights of the 2006 Water Year in Colorado
 Highlights of the 2006 Water Year in Colorado Nolan Doesken, State Climatologist Atmospheric Science Department Colorado State University http://ccc.atmos.colostate.edu Presented to 61 st Annual Meeting
Drought in Southeast Colorado
 Drought in Southeast Colorado Nolan Doesken and Roger Pielke, Sr. Colorado Climate Center Prepared by Tara Green and Odie Bliss http://climate.atmos.colostate.edu 1 Historical Perspective on Drought Tourism
TILT, DAYLIGHT AND SEASONS WORKSHEET
 TILT, DAYLIGHT AND SEASONS WORKSHEET Activity Description: Students will use a data table to make a graph for the length of day and average high temperature in Utah. They will then answer questions based
El Nino 2015 in South Sudan: Impacts and Perspectives. Raul Cumba
 El Nino 2015 in South Sudan: Impacts and Perspectives Raul Cumba El Nino 2015-2016 The El Nino Event of 2015-2016 The 2015/16 El Nino Event Officially declared in March 2015 Now approaching peak intensity
SYSTEM BRIEF DAILY SUMMARY
 SYSTEM BRIEF DAILY SUMMARY * ANNUAL MaxTemp NEL (MWH) Hr Ending Hr Ending LOAD (PEAK HOURS 7:00 AM TO 10:00 PM MON-SAT) ENERGY (MWH) INCREMENTAL COST DAY DATE Civic TOTAL MAXIMUM @Max MINIMUM @Min FACTOR
Predicting Floods in North Central Province of Sri Lanka using Machine Learning and Data Mining Methods
 Thilakarathne & Premachandra Predicting Floods in North Central Province of Sri Lanka using Machine Learning and Data Mining Methods H. Thilakarathne 1, K. Premachandra 2 1 Department of Physical Science,
Chapter 3. Regression-Based Models for Developing Commercial Demand Characteristics Investigation
 Chapter Regression-Based Models for Developing Commercial Demand Characteristics Investigation. Introduction Commercial area is another important area in terms of consume high electric energy in Japan.
NASA Products to Enhance Energy Utility Load Forecasting
 NASA Products to Enhance Energy Utility Load Forecasting Erica Zell, Battelle zelle@battelle.org, Arlington, VA ESIP 2010 Summer Meeting, Knoxville, TN, July 20-23 Project Overview Funded by the NASA Applied
P7.7 A CLIMATOLOGICAL STUDY OF CLOUD TO GROUND LIGHTNING STRIKES IN THE VICINITY OF KENNEDY SPACE CENTER, FLORIDA
 P7.7 A CLIMATOLOGICAL STUDY OF CLOUD TO GROUND LIGHTNING STRIKES IN THE VICINITY OF KENNEDY SPACE CENTER, FLORIDA K. Lee Burns* Raytheon, Huntsville, Alabama Ryan K. Decker NASA, Marshall Space Flight
Significant Rainfall and Peak Sustained Wind Estimates For Downtown San Francisco
 Significant Rainfall and Peak Sustained Wind Estimates For Downtown San Francisco Report Prepared by John P. Monteverdi, PhD, CCM July 30, 1998 Mayacamas Weather Consultants 1. Impact of Location The location
Technical note on seasonal adjustment for M0
 Technical note on seasonal adjustment for M0 July 1, 2013 Contents 1 M0 2 2 Steps in the seasonal adjustment procedure 3 2.1 Pre-adjustment analysis............................... 3 2.2 Seasonal adjustment.................................
Research Article Two Mathematical Models for Generation of Crowned Tooth Surface
 e Scientific World Journal, Article ID 6409, 6 pages http://dx.doi.org/0.55/204/6409 Research Article Two Mathematical Models for Generation of Crowned Tooth Surface Laszlo Kelemen and Jozsef Szente University
Alterations to the Flat Weight For Age Scale BHA Data Published 22 September 2016
 Alterations to the Flat Weight For Age Scale BHA Data Published 22 September 2016 Introduction What is weight for age? It is an allowance given to younger horses, usually three-year-olds, to enable them
Atmospheric circulation analysis for seasonal forecasting
 Training Seminar on Application of Seasonal Forecast GPV Data to Seasonal Forecast Products 18 21 January 2011 Tokyo, Japan Atmospheric circulation analysis for seasonal forecasting Shotaro Tanaka Climate
Four Basic Steps for Creating an Effective Demand Forecasting Process
 Four Basic Steps for Creating an Effective Demand Forecasting Process Presented by Eric Stellwagen President & Cofounder Business Forecast Systems, Inc. estellwagen@forecastpro.com Business Forecast Systems,
A Feature Based Neural Network Model for Weather Forecasting
 World Academy of Science, Engineering and Technology 4 2 A Feature Based Neural Network Model for Weather Forecasting Paras, Sanjay Mathur, Avinash Kumar, and Mahesh Chandra Abstract Weather forecasting
ANN and Statistical Theory Based Forecasting and Analysis of Power System Variables
 ANN and Statistical Theory Based Forecasting and Analysis of Power System Variables Sruthi V. Nair 1, Poonam Kothari 2, Kushal Lodha 3 1,2,3 Lecturer, G. H. Raisoni Institute of Engineering & Technology,
Published by ASX Settlement Pty Limited A.B.N Settlement Calendar for ASX Cash Market Products
 Published by Pty Limited A.B.N. 49 008 504 532 2012 Calendar for Cash Market Products Calendar for Cash Market Products¹ Pty Limited ( ) operates a trade date plus three Business (T+3) settlement discipline
Funding provided by NOAA Sectoral Applications Research Project CLIMATE. Basic Climatology Colorado Climate Center
 Funding provided by NOAA Sectoral Applications Research Project CLIMATE Basic Climatology Colorado Climate Center Remember These? Factor 1: Our Energy Source Factor 2: Revolution & Tilt Factor 3: Rotation!
Short Term Load Forecasting Based Artificial Neural Network
 Short Term Load Forecasting Based Artificial Neural Network Dr. Adel M. Dakhil Department of Electrical Engineering Misan University Iraq- Misan Dr.adelmanaa@gmail.com Abstract Present study develops short
What is happening to the Jamaican climate?
 What is happening to the Jamaican climate? Climate Change and Jamaica: Why worry? Climate Studies Group, Mona (CSGM) Department of Physics University of the West Indies, Mona Part 1 RAIN A FALL, BUT DUTTY
LONG TERM LOAD FORECASTING OF POWER SYSTEMS USING ARTIFICIAL NEURAL NETWORK AND ANFIS
 LONG TERM LOAD FORECASTING OF POWER SYSTEMS USING ARTIFICIAL NEURAL NETWORK AND ANFIS Naji Ammar 1, Marizan Sulaiman 2 and Ahmad Fateh Mohamad Nor 2 1 Higher Institute for Water Technology, Agelat, Libya
2017 Settlement Calendar for ASX Cash Market Products ASX SETTLEMENT
 2017 Settlement Calendar for ASX Cash Market Products ASX SETTLEMENT Settlement Calendar for ASX Cash Market Products 1 ASX Settlement Pty Limited (ASX Settlement) operates a trade date plus two Business
2018 Annual Review of Availability Assessment Hours
 2018 Annual Review of Availability Assessment Hours Amber Motley Manager, Short Term Forecasting Clyde Loutan Principal, Renewable Energy Integration Karl Meeusen Senior Advisor, Infrastructure & Regulatory
American International Journal of Research in Science, Technology, Engineering & Mathematics
 American International Journal of Research in Science, Technology, Engineering & Mathematics Available online at http://www.iasir.net ISSN (Print): 2328-3491, ISSN (Online): 2328-3580, ISSN (CD-ROM): 2328-3629
Seasonal Climate Watch November 2017 to March 2018
 Seasonal Climate Watch November 2017 to March 2018 Date issued: Oct 26, 2017 1. Overview The El Niño Southern Oscillation (ENSO) continues to develop towards a La Niña state, and is expected to be in at
Solar Activity during the Rising Phase of Solar Cycle 24
 International Journal of Astronomy and Astrophysics, 213, 3, 212-216 http://dx.doi.org/1.4236/ijaa.213.3325 Published Online September 213 (http://www.scirp.org/journal/ijaa) Solar Activity during the
Memo. I. Executive Summary. II. ALERT Data Source. III. General System-Wide Reporting Summary. Date: January 26, 2009 To: From: Subject:
 Memo Date: January 26, 2009 To: From: Subject: Kevin Stewart Markus Ritsch 2010 Annual Legacy ALERT Data Analysis Summary Report I. Executive Summary The Urban Drainage and Flood Control District (District)
Local Ctimatotogical Data Summary White Hall, Illinois
 SWS Miscellaneous Publication 98-5 STATE OF ILLINOIS DEPARTMENT OF ENERGY AND NATURAL RESOURCES Local Ctimatotogical Data Summary White Hall, Illinois 1901-1990 by Audrey A. Bryan and Wayne Armstrong Illinois
A Hybrid Model of Wavelet and Neural Network for Short Term Load Forecasting
 International Journal of Electronic and Electrical Engineering. ISSN 0974-2174, Volume 7, Number 4 (2014), pp. 387-394 International Research Publication House http://www.irphouse.com A Hybrid Model of