Sky Cover: Shining Light on a Gloomy Problem
|
|
|
- Nathaniel Hensley
- 5 years ago
- Views:
Transcription


1 Sky Cover: Shining Light on a Gloomy Problem Jordan Gerth Cooperative Institute for Meteorological Satellite Studies, Space Science and Engineering Center University of Wisconsin Madison 23 July
2 The Ultimate Problem Not a clear definition Poor instrumentation for observing high cloud Observers occasionally fail to correct it Meteorologists often neglect sky cover due challenges with other parts of the forecast Numerical weather prediction models are grid based and cloud grids are often too bimodal Satellites see the tops of clouds, but not necessarily the surface sky cover 2
3 Defining Sky Cover The National Weather Service (NWS) web site defines sky cover as the expected amount of opaque clouds (in percent) covering the sky valid for the indicated hour. No probabilistic component. No definition of opaque cloud or cloud. The implication is cloud coverage of the celestial dome (all sky visible from a point observer). 3
4 Forecasting Sky Cover The NWS National Digital Forecast Database (NDFD) contains the gridded operational forecast for sky cover. Issues with the national one-hour forecast include: Clear areas with non-zero cloud cover Vastly different cloud classifications for similar cloud scenes Lack of spatial continuity between forecast areas Temporal trends do not match observations 4

5 5
6 6
7 Observing Sky Cover Geostationary satellites are helpful in assessing sky cover because of good Spatial coverage (4 km) Temporal continuity (15 minutes) Effective cloud amount (or effective cloud emissivity) is a close proxy to sky cover, with some exceptions Satellites observe cloud top-down (high cloud first), humans see bottom-up (low cloud first). 7
8 The GOES Imager Effective Cloud Amount (ECA) is the standard effective cloud emissivity product from the GOES Imagers, valid at the indicated time. 8
9 The GOES Imager Celestial Dome ECA is an average of the standard effective cloud emissivity within a box of 11 by 11 pixels, centered on each grid point, valid at the indicated time. 9

10 The GOES Imager Sky Cover Product is a time-average of the celestial dome ECA within a onehour window. The valid time begins at the time indicated on the plot. The average is all scans after the valid time, within one hour. 10
11 Surface Observations These are all sky observations taken from surface stations. The fractional cloud cover from each observation is converted from the reported cloud type in the METAR. Multiple observations within a one-hour window following the valid time, and/or within 10 km, are averaged. Reported Coverage Assigned Value Clear 0% Scattered 40% Broken 75% Overcast 100% Obscured 100% Thin Scattered 25% Thin Broken 60% Thin Overcast 90% KMKE Z 17007KT 10SM FEW050 SCT095 BKN250 26/20 A2973 RMK AO2 SLP062 T
12 12
13 13
14 Blended Sky Cover Analysis For a given point: If satellite sky cover product or surface observation analysis indicates a clear sky, the blended sky cover analysis value is clear. If the surface observation analysis is higher than the satellite sky cover product, the surface observation analysis value is used. Otherwise, the two measurements are blended with a weight depending on the distance to the nearest non-clear surface observation. 14
15 15
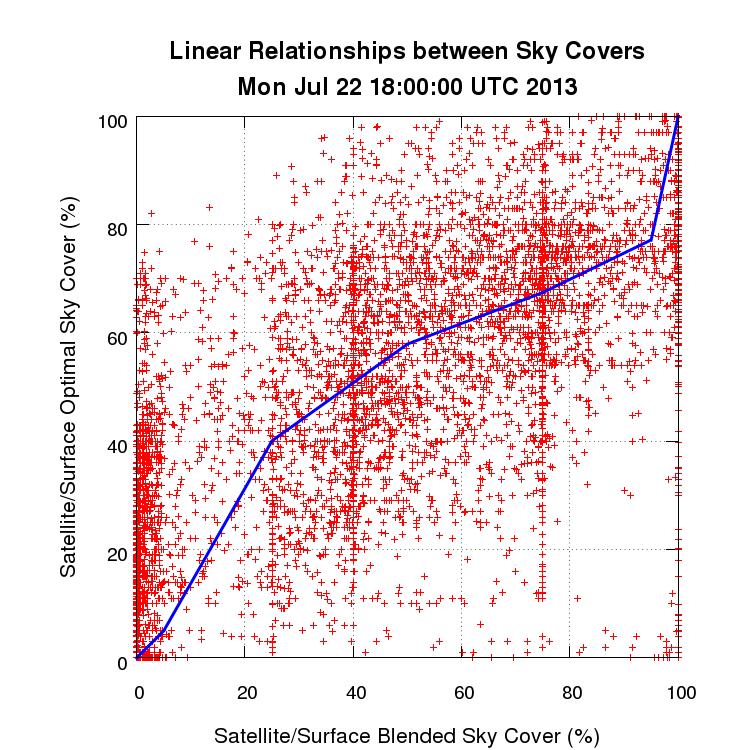
16 Optimal Sky Cover Analysis Uses a linear solver to minimize the mean absolute difference between the blended sky cover analysis and the NDFD one-hour forecast, subject to some constraints, for a selected set of points. The main constraint is that the piecewise linear function must be continuous, and that the minimum (0) and maximum (100) values must be anchored. 16
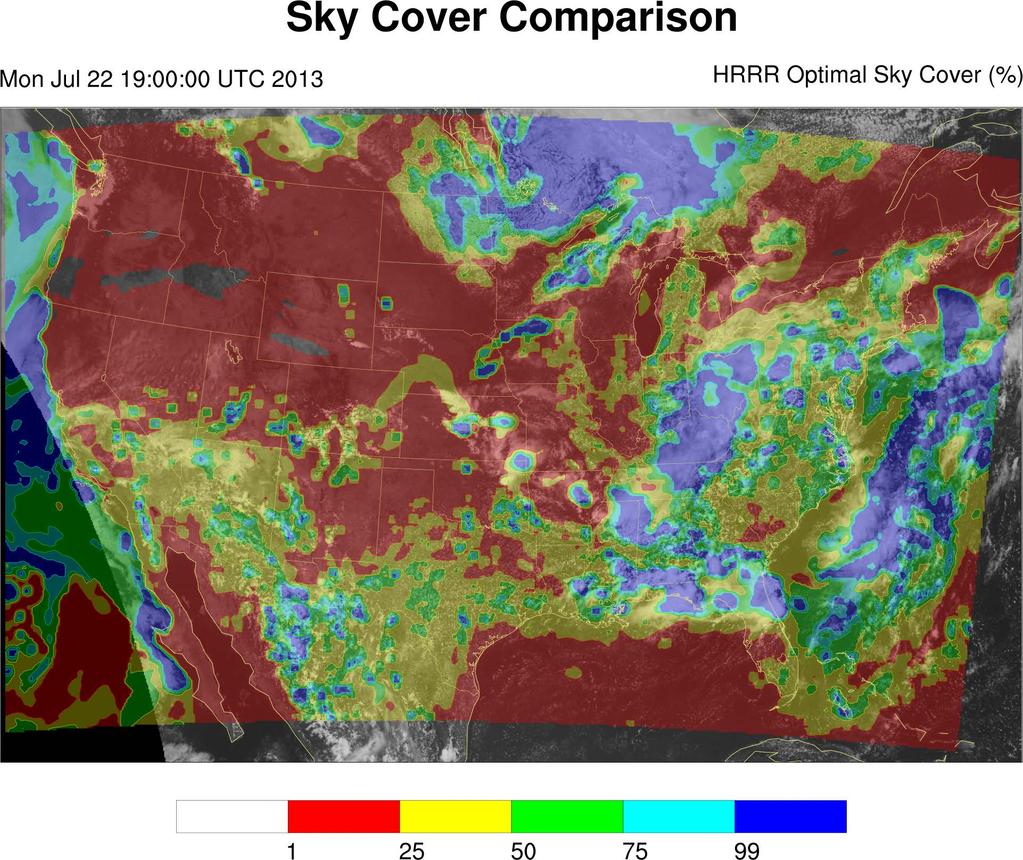
17 The GOES Imager Optimal Sky Cover is a linear optimization of the sky cover product, intended to minimize absolute error when compared the National Digital Forecast Database (NDFD) one-hour forecast. The valid time and range coincides with the sky cover product. 17
18 18
19 Optimizing Sky Cover Model output can be optimized to produce the desired quantity. In this case, the objective is to decrease the mean absolute difference between the optimal sky cover analysis and a linear sum of model variables subject to coefficients and scalars applied to non-zero mixing ratios. The coefficients are further constrained by a tolerance constraint on the mean value. 19
20 Optimizing Sky Cover Variables used: Relative Humidity (all levels) Cloud Water Mixing Ratio, Rain Water Mixing Ratio, Snow Mixing Ratio (all levels) Absolute Vorticity (200 hpa only), partitioned into positive and negative components Pressure levels used: 200 hpa 300 hpa 500 hpa 700 hpa 800 hpa 850 hpa 900 hpa 950 hpa 1000 hpa 20
21 21
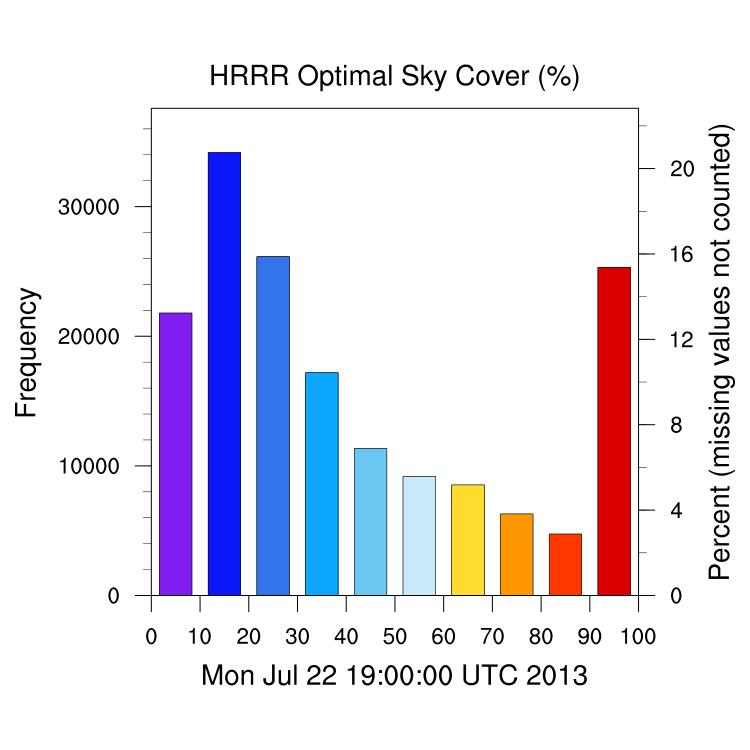
22 The High-Resolution Rapid Refresh (HRRR) Total Cloud Cover is the model output cloud cover from the analysis of the run initiated at the valid time. 22
23 23
24 24
25 Conclusions Current effort is focusing on producing three-, six-, and nine-hour forecasts of sky cover from the HRRR using the output from the optimization model Linear optimization may yield fruit in the investigation of other problems in the atmospheric sciences where: Multiple optimized quantities are required A relationship between the optimized quantities is understood Quantities are subject to constraints relative to each other or supported by the science Questions? Comments? Jordan.Gerth@noaa.gov 25
A New Numerical Weather Prediction Approach to the NDFD's Sky Cover Grid
 A New Numerical Weather Prediction Approach to the NDFD's Sky Cover Grid Jordan Gerth Graduate Research Assistant Cooperative Institute for Meteorological Satellite Studies (CIMSS) and Department of Atmospheric
Atmospheric Pressure. Pressure Altimeter. Pressure Altimeter
 Atmospheric Pressure The : An instrument to measure altitude based on an aneroid barometer. It can be adjusted for changes in atmospheric pressure 1 2 Altimeter Setting Is not SLP, but close to it. If
National Transportation Safety Board Office of Aviation Safety Washington, D.C December 10, 2012 WEATHER STUDY DCA13RA025
 A. ACCIDENT National Transportation Safety Board Office of Aviation Safety Washington, D.C. 20594-2000 December 10, 2012 WEATHER STUDY DCA13RA025 Location: Monterrey, Mexico Date: December 9, 2012 Time:
ERTH 465 Fall Laboratory Exercise 5. Surface Weather Observations (METARS) and Frontal Analysis (300 pts)
 and Frontal Analysis (300 pts)") ERTH 465 Fall 2017 Laboratory Exercise 5 Surface Weather Observations (METARS) and Frontal Analysis (300 pts) Insert in ringed-three hole binder. Point deductions for sloppy or late work. Due date: Tuesday
ERTH 465 Fall 2017 Laboratory Exercise 5 Surface Weather Observations (METARS) and Frontal Analysis (300 pts) Insert in ringed-three hole binder. Point deductions for sloppy or late work. Due date: Tuesday
MxVision WeatherSentry Web Services Content Guide
 MxVision WeatherSentry Web Services Content Guide July 2014 DTN 11400 Rupp Drive Minneapolis, MN 55337 00.1.952.890.0609 This document and the software it describes are copyrighted with all rights reserved.
The enduring fog and low cloud episode of 5-10 December 2015: Big Bubble Fog Trouble
 1. Overview The enduring fog and low cloud episode of 5-10 December 2015: Big Bubble Fog Trouble By Richard H. Grumm National Weather Service State College, PA An enduring low cloud and fog episode affected
Real-Time Meteorological Gridded Data: What s New With HEC-RAS
 Real-Time Meteorological Gridded Data: What s New With HEC-RAS Acquisition and Application of Gridded Meteorological Data in Support of the USACE s Real-Time Water Management Mission Fauwaz Hanbali, Tom
TAF CCCC YYGGggZ YYHHHH dddff(f)gffkt VVVVSM [ww NNNhhh] [Wshhh/dddffKT] [TTTTT xxxx] repeated as needed
![TAF CCCC YYGGggZ YYHHHH dddff(f)gffkt VVVVSM [ww NNNhhh] [Wshhh/dddffKT] [TTTTT xxxx] repeated as needed](/thumbs/80/81003809.jpg "TAF CCCC YYGGggZ YYHHHH dddff(f)gffkt VVVVSM [ww NNNhhh] [Wshhh/dddffKT] [TTTTT xxxx] repeated as needed") Encoding TAFs Terminal Aerodome Forecast (TAF) Terminal forecasts for the world follow an internationally accepted format. The TAFs are issued four times daily for 24 hour periods beginning at 00Z, 06Z,
Encoding TAFs Terminal Aerodome Forecast (TAF) Terminal forecasts for the world follow an internationally accepted format. The TAFs are issued four times daily for 24 hour periods beginning at 00Z, 06Z,
Meteorology METARs. References: FTGU pages AWWS:
 Meteorology 5.09 METARs References: FTGU pages 160-163 AWWS: www.flightplanning.navcanada.ca 5.09 METARs MTPs: Weather Observing Stations METARs Weather Observing Stations Weather observation are taken
Meteorology METARs Weather Observing Stations. MTPs: 5.09 METARs References: FTGU pages AWWS:
 Meteorology 5.09 References: FTGU pages 160-163 AWWS: www.flightplanning.navcanada.ca MTPs: Weather Observing Stations 5.09 Weather Observing Stations Weather observation are taken every hour at selected
University of Maryland. Tuesday, February 7, 12
 AARON SCHULMAN NEIL SPRING University of Maryland Measuring weather-related failures Identify residential IPs that will be subject to weather Ping before, during, and after a weather event Analyze the
Sources of Hourly Surface Data and Weather Maps for the U.S.
 Sources of Hourly Surface Data and Weather Maps for the U.S. Weather Underground Weather Underground http://www.wunderground.com/history/ maintains a deep archive of hourly reports for around the world.
OPTIMISING THE TEMPORAL AVERAGING PERIOD OF POINT SURFACE SOLAR RESOURCE MEASUREMENTS FOR CORRELATION WITH AREAL SATELLITE ESTIMATES
 OPTIMISING THE TEMPORAL AVERAGING PERIOD OF POINT SURFACE SOLAR RESOURCE MEASUREMENTS FOR CORRELATION WITH AREAL SATELLITE ESTIMATES Ian Grant Anja Schubert Australian Bureau of Meteorology GPO Box 1289
TERMINAL AERODROME FORECAST
 1. Introduction TERMINAL AERODROME FORECAST Basically, a Terminal Aerodrome Forecast (or Terminal Area Forecast, TAF) is a message with a defined format with the objective to report a weather forecast
Module 11: Meteorology Topic 5 Content: Weather Maps Notes
 Introduction A variety of weather maps are produced by the National Weather Service and National Oceanographic Atmospheric Administration. These maps are used to help meteorologists accurately predict
CIMSS Hyperspectral IR Sounding Retrieval (CHISR) Processing & Applications
 Processing & Applications") CIMSS Hyperspectral IR Sounding Retrieval (CHISR) Processing & Applications Jun Li @, Elisabeth Weisz @, Jinlong Li @, Hui Liu #, Timothy J. Schmit &, Jason Otkin @ and many other CIMSS collaborators @Cooperative
CIMSS Hyperspectral IR Sounding Retrieval (CHISR) Processing & Applications Jun Li @, Elisabeth Weisz @, Jinlong Li @, Hui Liu #, Timothy J. Schmit &, Jason Otkin @ and many other CIMSS collaborators @Cooperative
Earth and Atmospheric Sciences. Sky condition. Prof. J. Haase EAS535 EAS535
 Sky condition Prof. J. Haase Federal Meteorological Handbook http://www.ofcm.gov/fmh-1/fmh1.htm Estimating cloud height Report cloud levels to nearest 100 feet below 5000 feet (in practice, human observers
FAA-NWS Aviation Weather Weather Policy and Product Transition Panel. Friends and Partners in Aviation Weather October 22, 2014 NOAA NOAA
 FAA-NWS Aviation Weather Weather Policy and Product Transition Panel Friends and Partners in Aviation Weather October 22, 2014 Airplanes have changed. Lockheed Constellation Airbus A380 Aviation weather
ESCI 241 Meteorology Lesson 9 Clouds and Fog
 References and Reading: MT Chapter 7 FORMATION OF CLOUDS ESCI 241 Meteorology Lesson 9 Clouds and Fog When air becomes saturated with water vapor, any excess water vapor condenses to form clouds The air
Dr. Christopher M. Godfrey University of North Carolina at Asheville
 Surface and Upper-Air Observations Surface Observations Collect information for synoptic-scale weather Most surface observations are automated (e.g., Automated Surface Observing System) Also mesoscale
Remote Sensing Observations AOSC 200 Tim Canty
 Remote Sensing Observations AOSC 200 Tim Canty Class Web Site: http://www.atmos.umd.edu/~tcanty/aosc200 Topics for today: Maps Radar Satellite Observations Lecture 04 Feb 7 2019 1 Today s Weather Map http://www.wpc.ncep.noaa.gov/sfc/namussfcwbg.gif
Sources of Hourly Surface Data and Weather Maps for the U.S.
 Sources of Hourly Surface Data and Weather Maps for the U.S. Weather Underground Weather Underground http://www.wunderground.com/history/ maintains a deep archive of hourly reports for around the world.
F O U N D A T I O N A L C O U R S E
 F O U N D A T I O N A L C O U R S E December 6, 2018 Satellite Foundational Course for JPSS (SatFC-J) F O U N D A T I O N A L C O U R S E Introduction to Microwave Remote Sensing (with a focus on passive
Table 1-2. TMY3 data header (line 2) 1-68 Data field name and units (abbreviation or mnemonic)
 1-68 Data field name and units (abbreviation or mnemonic)") 1.4 TMY3 Data Format The format for the TMY3 data is radically different from the TMY and TMY2 data.. The older TMY data sets used columnar or positional formats, presumably as a method of optimizing data
1.4 TMY3 Data Format The format for the TMY3 data is radically different from the TMY and TMY2 data.. The older TMY data sets used columnar or positional formats, presumably as a method of optimizing data
1 AOS 452 Lab 1: Meteorological data decoding and forecast preparation
 1 AOS 452 Lab 1: Meteorological data decoding and forecast preparation This semester we will be using a variety of programs and software specific to meteorology. The first program we will focus on is:
NOAA Research and Development Supporting NextGen. Darien Davis NOAA Office of Oceanic and Atmospheric Research June 22, 2009
 NOAA Research and Development Supporting NextGen Darien Davis Darien.l.davis@noaa.gov NOAA Office of Oceanic and Atmospheric Research June 22, 2009 FAA/NOAA Coordination Developing an integrated science
Add NOAA nowcoast Layers to Maps
 WebEOC Maps Add-on Quick Reference Guide Add NOAA nowcoast Layers to Maps Overview With Maps Add-on, you can configure an unlimited number of map layers. These layers allow you to control the data you
ERTH 465 Fall Laboratory Exercise 5. Surface Weather Observations (METARS) and Frontal Analysis (300 pts)
 and Frontal Analysis (300 pts)") ERTH 465 Fall 2017 Laboratory Exercise 5 Surface Weather Observations (METARS) and Frontal Analysis (300 pts) Insert in ringed-three hole binder. Point deductions for sloppy or late work. Due date: Tuesday
ERTH 465 Fall 2017 Laboratory Exercise 5 Surface Weather Observations (METARS) and Frontal Analysis (300 pts) Insert in ringed-three hole binder. Point deductions for sloppy or late work. Due date: Tuesday
DAVE LEVIN AARON SCHULMAN
 YOUNDO LEE DAVE LEVIN NEIL SPRING RAMAKRISHNA PADMANABHAN University of Maryland AARON SCHULMAN Stanford Weather causes residential link failures Lightning destroys equipment and causes interference Water
1 AOS 452 Lab 1: Meteorological data decoding and forecast preparation
 1 AOS 452 Lab 1: Meteorological data decoding and forecast preparation This semester we will be using a variety of programs and software specific to meteorology. The first program we will focus on is:
CHAPTER 9 - SPECIAL OBSERVATIONS
 CHAPTER 9 - AL OBSERVATIONS 9.1 Introduction This chapter explains the criteria for taking special observations (). 9.2 Special Observations s are taken whenever mandatory criteria are met, and at the
Dual-Regression Surface and Atmospheric Sounding Algorithm for Initializing Physical Retrievals and Direct Radiance Assimilation
 SPACE SCIENCE AND ENGINEERING CENTER Dual-Regression Surface and Atmospheric Sounding Algorithm for Initializing Physical Retrievals and Direct Radiance Assimilation W. L. Smith Sr. 1,2,3, E. Weisz 1,
Experimental MOS Precipitation Type Guidance from the ECMWF Model
 Experimental MOS Precipitation Type Guidance from the ECMWF Model Phillip E. Shafer David E. Rudack National Weather Service Meteorological Development Laboratory Silver Spring, MD Development Overview:
CLOUD CLASSIFICATION AND CLOUD PROPERTY RETRIEVAL FROM MODIS AND AIRS
 6.4 CLOUD CLASSIFICATION AND CLOUD PROPERTY RETRIEVAL FROM MODIS AND AIRS Jun Li *, W. Paul Menzel @, Timothy, J. Schmit @, Zhenglong Li *, and James Gurka # *Cooperative Institute for Meteorological Satellite
University of Maryland. Monday, November 7, 11
 AARON SCHULMAN NEIL SPRING University of Maryland Residential links may fail Links are not redundant Equipment updates are rare Equipment operates in an uncontrolled environment photo credit: Ode Street
22nd-26th February th International Wind Workshop Tokyo, Japan
 New developments in the High Resolution Winds Product (HRW), at the Satellite Application Facility on support to Nowcasting and Very short range forecasting (NWCSAF) 22nd-26th February 2010 10th International
Maps and Remote Sensing AOSC 200 Tim Canty
 Maps and Remote Sensing AOSC 200 Tim Canty Class Web Site: http://www.atmos.umd.edu/~tcanty/aosc200 Topics for today: Weather Maps Radar Satellite Observations Lecture 04 Feb 7 2019 1 Today s Weather Map
University of Maryland. Friday, February 10, 12
 AARON SCHULMAN NEIL SPRING University of Maryland Residential links may fail Links are not redundant Equipment updates are rare Equipment operates in an uncontrolled environment photo credit: Patrick Shoemaker,
MACIS documentation. a. Temporal resolution: For each month and the hole year
 MACIS documentation Wind: 1. Relative frequency of mean wind speed b. Treshold values: mean wind speed greater, greater equal, less, less equal 3, 5, 10, 12, 15 20, 22, 25 kt 2. Relative frequency of gusts
The UW-CIMSS Advanced Dvorak Technique (ADT) : An Automated IR Method to Estimate Tropical Cyclone Intensity
 : An Automated IR Method to Estimate Tropical Cyclone Intensity") The UW-CIMSS Advanced (ADT) : An Automated IR Method to Estimate Tropical Cyclone Intensity Timothy Olander and Christopher Velden University of Wisconsin Madison, USA Cooperative Institute for Meteorological
The UW-CIMSS Advanced (ADT) : An Automated IR Method to Estimate Tropical Cyclone Intensity Timothy Olander and Christopher Velden University of Wisconsin Madison, USA Cooperative Institute for Meteorological
Weather vs. Climate. Tucson NWS homepage:
 Weather vs. Climate Tucson NWS homepage: www.nws.noaa.gov/twc/ A Weather Forecaster? Betty claims to know exactly when it s going to rain because her knee starts to hurt. Ms. Betty Martin of Newburgh,
KEY TO DECODING THE U.S. METAR OBSERVATION REPORT
 KEY TO DECODING THE U.S. METAR OBSERVATION REPORT Example METAR Report METAR KABC 121755Z AUTO 21016G24KT 180V240 1SM R11/P6000FT -RA BR BKN015 0VC025 06/04 A2990 RMK A02 PK WND 20032/25 WSHFT 1715 VIS
Atmospheric Motion Vectors: Product Guide
 Atmospheric Motion Vectors: Product Guide Doc.No. Issue : : EUM/TSS/MAN/14/786435 v1a EUMETSAT Eumetsat-Allee 1, D-64295 Darmstadt, Germany Tel: +49 6151 807-7 Fax: +49 6151 807 555 Date : 9 April 2015
Surface Radiation Budget from ARM Satellite Retrievals
 Surface Radiation Budget from ARM Satellite Retrievals P. Minnis, D. P. Kratz, and T. P. charlock Atmospheric Sciences National Aeronautics and Space Administration Langley Research Center Hampton, Virginia
Hyperspectral IR clear and cloudy sounding retrieval study
 Hyperspectral IR clear and cloudy sounding retrieval study Jun Li @, Timothy J. Schmit #, Chian-Yi Liu @, Elisabeth Weisz @, Li Guan @, and Allen Huang @ @Cooperative Institute for Meteorological Satellite
Assimilation of Satellite Infrared Brightness Temperatures and Doppler Radar Observations in a High-Resolution OSSE
 Assimilation of Satellite Infrared Brightness Temperatures and Doppler Radar Observations in a High-Resolution OSSE Jason Otkin and Becky Cintineo University of Wisconsin-Madison, Cooperative Institute
STATUS OF JAPANESE METEOROLOGICAL SATELLITES AND RECENT ACTIVITIES OF MSC
 STATUS OF JAPANESE METEOROLOGICAL SATELLITES AND RECENT ACTIVITIES OF MSC Daisaku Uesawa Meteorological Satellite Center, Japan Meteorological Agency Abstract MTSAT-1R is the current operational Japanese
Seamless nowcasting. Open issues
 Federal Department of Home Affairs FDHA Federal Office of Meteorology and Climatology MeteoSwiss Seamless nowcasting INCA Open issues Pierre Eckert Matteo Buzzi, Marco Sassi, Guido della Bruna, Marco Gaia
Metar And Taf Decoding
 Metar And Taf Decoding 1 / 6 2 / 6 3 / 6 Metar And Taf Decoding examples: kmem 230853z auto 18014g18kt 10sm clr 16/m02 a3008 rmk ao2 slp117 t01561022 tsno $ klax 161550z cor 11004kt 2 1/2sm hz bkn011 bkn015
Summary of Fog Occurrence at Tampico and Veracruz, Mexico Jerome Fast, PNNL August 29, 2005
 Summary of Fog Occurrence at Tampico and Veracruz, Mexico Jerome Fast, PNNL August 29, Motivation Surface observations from Tampico and Veracruz were analyzed to determine how frequently fog occurs along
John R. Mecikalski #1, Martha C. Anderson*, Ryan D. Torn #, John M. Norman*, George R. Diak #
 P4.22 THE ATMOSPHERE-LAND EXCHANGE INVERSE (ALEXI) MODEL: REGIONAL- SCALE FLUX VALIDATIONS, CLIMATOLOGIES AND AVAILABLE SOIL WATER DERIVED FROM REMOTE SENSING INPUTS John R. Mecikalski #1, Martha C. Anderson*,
A Performance Assessment of the National Ceiling and Visibility Analysis Product
 10.3 A Performance Assessment of the National Ceiling and Visibility Analysis Product Andrew F. Loughe, 1,3* Brian P. Pettegrew, 1,3 Judy K. Henderson, 3 Joan E. Hart, 1,3 Sean Madine, 2,3 Jennifer Mahoney
Observing Weather: Making the Invisible Visible. Dr. Michael J. Passow
 Observing Weather: Making the Invisible Visible Dr. Michael J. Passow What Is Weather? Weather refers to the conditions of the atmosphere at a certain place and time. Weather differs from Climate, which
Improving the accuracy of solar irradiance forecasts based on Numerical Weather Prediction
 Improving the accuracy of solar irradiance forecasts based on Numerical Weather Prediction Bibek Joshi, Alistair Bruce Sproul, Jessie Kai Copper, Merlinde Kay Why solar power forecasting? Electricity grid
Weather Forecasting. pencils, colored daily weather maps for consecutive days (5)
") Long-Term Projects Weather Forecasting Every three hours, the National Weather Service collects data from about 800 weather stations located around the world. Daily newspapers summarize this weather data
Long-Term Projects Weather Forecasting Every three hours, the National Weather Service collects data from about 800 weather stations located around the world. Daily newspapers summarize this weather data
Aircraft-based Observations: Impact on weather forecast model performance
 Aircraft-based Observations: Impact on weather forecast model performance Stephen S. Weygandt Eric James, Stan Benjamin, Bill Moninger, Brian Jamison, Geoff Manikin* NOAA Earth System Research Laboratory
2014 HIGHLIGHTS. SHC Task 46 is a five-year collaborative project with the IEA SolarPACES Programme and the IEA Photovoltaic Power Systems Programme.
 2014 HIGHLIGHTS SHC Solar Resource Assessment and Forecasting THE ISSUE Knowledge of solar energy resources is critical when designing, building and operating successful solar water heating systems, concentrating
SATELLITE SIGNATURES ASSOCIATED WITH SIGNIFICANT CONVECTIVELY-INDUCED TURBULENCE EVENTS
 SATELLITE SIGNATURES ASSOCIATED WITH SIGNIFICANT CONVECTIVELY-INDUCED TURBULENCE EVENTS Kristopher Bedka 1, Wayne Feltz 1, John Mecikalski 2, Robert Sharman 3, Annelise Lenz 1, and Jordan Gerth 1 1 Cooperative
MET 3502 Synoptic Meteorology. Lecture 5: Surface Weather Elements
 MET 3502 Synoptic Meteorology Lecture 5: Surface Weather Elements Surface Weather Elements Not observations of the surface, but Observations made by an observer (or instrument) at the surface Example:
Electronic Station Data Definitions
 Electronic Station Data Definitions CODE DATE TIME Station Code Date and time of OBS TYPE Observation Type ST - "Standard Observations" collected at 0600 and 1800, RAW - hourly s collected every hour,
Journal of the Meteorological Society of Japan, Vol. 75, No. 1, pp , Day-to-Night Cloudiness Change of Cloud Types Inferred from
 Journal of the Meteorological Society of Japan, Vol. 75, No. 1, pp. 59-66, 1997 59 Day-to-Night Cloudiness Change of Cloud Types Inferred from Split Window Measurements aboard NOAA Polar-Orbiting Satellites
APPLICATIONS WITH METEOROLOGICAL SATELLITES. W. Paul Menzel. Office of Research and Applications NOAA/NESDIS University of Wisconsin Madison, WI
 APPLICATIONS WITH METEOROLOGICAL SATELLITES by W. Paul Menzel Office of Research and Applications NOAA/NESDIS University of Wisconsin Madison, WI July 2004 Unpublished Work Copyright Pending TABLE OF CONTENTS
July 13, 2017 Session #1 In Lieu of the Surface Observation Including EWINS Authority, RTMA, Web Cams, and Remote Observation Systems
 July 13, 2017 Session #1 In Lieu of the Surface Observation Including EWINS Authority, RTMA, Web Cams, and Remote Observation Systems Part 121 Operator Perspective: Equivalent Level of Safety Using Remote
TAF Decoder Courtesy of the Aviation Weather Center
 TAF Decoder Courtesy of the Aviation Weather Center A Terminal Aerodrome Forecast (TAF) is a concise statement of the expected meteorological conditions at an airport during a specified period (usually
Jordan Gerth Cooperative Institute for Meteorological Satellite Studies University of Wisconsin at Madison 27 January 2011
 Jordan Gerth Cooperative Institute for Meteorological Satellite Studies University of Wisconsin at Madison 27 January 2011 91 st American Meteorological Society Annual Meeting First Conference on Transition
WG4: interpretation and applications
 Federal Department of Home Affairs FDHA Federal Office of Meteorology and Climatology MeteoSwiss WG4: interpretation and applications Pierre Eckert MeteoSwiss, Geneva Topics FIELDEXTRA presentation by
Lecture 4b: Meteorological Satellites and Instruments. Acknowledgement: Dr. S. Kidder at Colorado State Univ.
 Lecture 4b: Meteorological Satellites and Instruments Acknowledgement: Dr. S. Kidder at Colorado State Univ. US Geostationary satellites - GOES (Geostationary Operational Environmental Satellites) US
LARGE-SCALE WRF-SIMULATED PROXY ATMOSPHERIC PROFILE DATASETS USED TO SUPPORT GOES-R RESEARCH ACTIVITIES
 LARGE-SCALE WRF-SIMULATED PROXY ATMOSPHERIC PROFILE DATASETS USED TO SUPPORT GOES-R RESEARCH ACTIVITIES Jason Otkin, Hung-Lung Huang, Tom Greenwald, Erik Olson, and Justin Sieglaff Cooperative Institute
Mark Miller NOAA NextGen Weather Program Manager July 21, 2010
 Mark Miller NOAA NextGen Weather Program Manager July 21, 2010 1 Progress toward an initial operating capability and beyond! Current Status FY10 Capability Evaluation Aligning with NWS Future Service Plans
Appendix. Atmosphere Investigation Data Work Sheet. Ozone Data Work Sheet. Atmospheric Haze Data Work Sheet. Clouds 7 Measurement Data Work Sheet
 Appendix Atmosphere Investigation Data Work Sheet Ozone Data Work Sheet Atmospheric Haze Data Work Sheet Clouds 7 Measurement Data Work Sheet GLOBE 2000 Appendix - 1 Atmosphere Atmosphere Investigation
Arctic Weather Every 10 Minutes: Design & Operation of ABI for PCW
 Arctic Weather Every 10 Minutes: Design and Operation of ABI for PCW Dr. Paul C. Griffith and Sue Wirth 31st Space Symposium, Technical Track, Colorado Springs, Colorado This document is not subject to
ROAD WEATHER INFORMATION SYSTEM DEVICE TESTING LEVEL C
 Page 1 of 11 Date: Jan. 05, 2009 This procedure outlines Level C device test to be performed on Road Weather Information System. Level C device testing demonstrates that each device is fully operational
Introduction of the Hyperspectral Environmental Suite (HES) on GOES-R and beyond
 on GOES-R and beyond") Introduction of the Hyperspectral Environmental Suite (HES) on GOES-R and beyond Timothy J. Schmit SaTellite Applications and Research (STAR) Advanced Satellite Products Team (ASPT) Presented by Jun Li
Introduction of the Hyperspectral Environmental Suite (HES) on GOES-R and beyond Timothy J. Schmit SaTellite Applications and Research (STAR) Advanced Satellite Products Team (ASPT) Presented by Jun Li
MSG system over view
 MSG system over view 1 Introduction METEOSAT SECOND GENERATION Overview 2 MSG Missions and Services 3 The SEVIRI Instrument 4 The MSG Ground Segment 5 SAF Network 6 Conclusions METEOSAT SECOND GENERATION
National Climatic Data Center DATA DOCUMENTATION FOR. DATA SET 3280 (DSI-3280) Surface Airways Hourly. May 4, 2005
 Surface Airways Hourly. May 4, 2005") National Climatic Data Center DATA DOCUMENTATION FOR DATA SET 3280 (DSI-3280) Surface Airways Hourly May 4, 2005 National Climatic Data Center 151 Patton Ave. Asheville, NC 28801-5001 USA Table of Contents
National Climatic Data Center DATA DOCUMENTATION FOR DATA SET 3280 (DSI-3280) Surface Airways Hourly May 4, 2005 National Climatic Data Center 151 Patton Ave. Asheville, NC 28801-5001 USA Table of Contents
London Heathrow Field Site Metadata
 London Heathrow Field Site Metadata Field Site Information Name: Heathrow src_id (Station ID number): 708 Geographic Area: Greater London Latitude (decimal ): 51.479 Longitude (decimal ): -0.449 OS Grid
Lab 19.2 Synoptic Weather Maps
 Lab 19.2 Synoptic Weather Maps Name: Partner: Purpose The purpose of this lab is to have you read and interpret the information displayed on synoptic weather maps. You will also learn the techniques used
Temperature, Observations, and Maps AOSC 200 Tim Canty. Weather and Climate
 Temperature, Observations, and Maps AOSC 200 Tim Canty Class Web Site: http://www.atmos.umd.edu/~tcanty/aosc200 Topics for today: Climate Weather Observations Weather Maps Lecture 03 Feb 5 2019 1 Weather
ES1 Investigating Weather Maps/Station Models Act# 10 Name Block Date
 yay, bonus pt. because oops, no HO, book, heading this date =MP ES1 Investigating Weather Maps/Station Models Act# 10 Name Block Date Weather INTRODUCTION: Weather maps combine meteorological data from
Aviation Weather Reports
 Aviation Weather Reports Aviation Weather Reports METAR: hourly weather report (issued on the hour every hour) SPECI: special weather observations issued at times other than on the hour, as a result of
FAA Weather Research Plans
 FAA Weather Research Plans Presented to: Friends /Partners in Aviation Weather Vision Forum By: Ray Moy FAA Aviation Weather Office Date: Aviation Weather Research Program (AWRP) Purpose: Applied Research
Introducing Atmospheric Motion Vectors Derived from the GOES-16 Advanced Baseline Imager (ABI)
") Introducing Atmospheric Motion Vectors Derived from the GOES-16 Advanced Baseline Imager (ABI) Jaime Daniels NOAA/NESDIS, Center for Satellite Applications and Research Wayne Bresky, Andrew Bailey, Americo
Introducing Atmospheric Motion Vectors Derived from the GOES-16 Advanced Baseline Imager (ABI) Jaime Daniels NOAA/NESDIS, Center for Satellite Applications and Research Wayne Bresky, Andrew Bailey, Americo
David Ruth Meteorological Development Laboratory National Weather Service, NOAA. Measuring Forecast Continuity
 David Ruth Meteorological Development Laboratory National Weather Service, NOAA Measuring Forecast Continuity National Digital Forecast Database (NDFD) Contains a seamless mosaic of NWS digital forecasts
Mid-Atlantic Ice Storm 4 March 2015
 1. Overview Mid-Atlantic Ice Storm 4 March 2015 By Richard H. Grumm National Weather Service State College, PA A large 500 hpa ridge over the southern United States (Fig. 1a-e)) built into the Mid-Atlantic
Assimilation of precipitation-related observations into global NWP models
 Assimilation of precipitation-related observations into global NWP models Alan Geer, Katrin Lonitz, Philippe Lopez, Fabrizio Baordo, Niels Bormann, Peter Lean, Stephen English Slide 1 H-SAF workshop 4
P1.34 MULTISEASONALVALIDATION OF GOES-BASED INSOLATION ESTIMATES. Jason A. Otkin*, Martha C. Anderson*, and John R. Mecikalski #
 P1.34 MULTISEASONALVALIDATION OF GOES-BASED INSOLATION ESTIMATES Jason A. Otkin*, Martha C. Anderson*, and John R. Mecikalski # *Cooperative Institute for Meteorological Satellite Studies, University of
Applications of future GEO advanced IR sounder for high impact weather forecasting demonstration with regional OSSE
 Applications of future GEO advanced IR sounder for high impact weather forecasting demonstration with regional OSSE Jun Li @, Tim Schmit &, Zhenglong Li @, Feng Zhu @*, Pei Wang @*, Agnes Lim @, and Robert
Wind tracing from SEVIRI clear and overcast radiance assimilation
 Wind tracing from SEVIRI clear and overcast radiance assimilation Cristina Lupu and Tony McNally ECMWF, Reading, UK Slide 1 Outline Motivation & Objective Analysis impact of SEVIRI radiances and cloudy
Methodology for the creation of meteorological datasets for Local Air Quality modelling at airports
 Methodology for the creation of meteorological datasets for Local Air Quality modelling at airports Nicolas DUCHENE, James SMITH (ENVISA) Ian FULLER (EUROCONTROL Experimental Centre) About ENVISA Noise
AERODROME METEOROLOGICAL OBSERVATION AND FORECAST STUDY GROUP (AMOFSG)
") AMOFSG/9-SN No. 31 22/8/11 AERODROME METEOROLOGICAL OBSERVATION AND FORECAST STUDY GROUP (AMOFSG) NINTH MEETING Montréal, 26 to 30 September 2011 Agenda Item 5: Observing and forecasting at the aerodrome
AMOFSG/9-SN No. 31 22/8/11 AERODROME METEOROLOGICAL OBSERVATION AND FORECAST STUDY GROUP (AMOFSG) NINTH MEETING Montréal, 26 to 30 September 2011 Agenda Item 5: Observing and forecasting at the aerodrome
CLOUD VELOCITY ESTIMATION FROM AN ARRAY OF SOLAR RADIATION MEASUREMENTS
 CLOUD VELOCITY ESTIMATION FROM AN ARRAY OF SOLAR RADIATION MEASUREMENTS Juan L. Bosch Yuehai Zheng Jan Kleissl Department of Mechanical and Aerospace Engineering Center for Renewable Resources and Integration
FORENSIC WEATHER CONSULTANTS, LLC
 MOST INFORMATION HAS BEEN CHANGED FOR THIS SAMPLE REPORT FORENSIC WEATHER CONSULTANTS, LLC Howard Altschule Certified Consulting Meteorologist 1971 Western Avenue, #200 Albany, New York 12203 518-862-1800
Analyzing/Forecasting Weather
 Analyzing/Forecasting Weather Focus Question Dude Its wind. It blows everywhere. Meteorologist to Nicholas Cage in The Weatherman VA SOL SOL 3 The student will investigate and understand how to read and
Combining Polar Hyper-spectral and Geostationary Multi-spectral Sounding Data A Method to Optimize Sounding Spatial and Temporal Resolution
 Combining Polar Hyper-spectral and Geostationary Multi-spectral Sounding Data A Method to Optimize Sounding Spatial and Temporal Resolution W. L. Smith 1,2, E. Weisz 1, and J. McNabb 2 1 University of
Section 7: Hazard Avoidance
 7.1 In-Flight Hazard Awareness Section 7: Hazard Avoidance As technology improves, pilots have more and more real-time information within reach in all phases of flight. Terrain proximity, real-time weather
Climate Discovery Teacher s Guide
 Unit:Little Ice Age Lesson: 1 Materials & Preparation Time: Introduction: 30 min Data collection: 10 minutes daily (for one or more weeks) Part 1 graphing/analysis: 45 min Part 2 graphing/analysis: 45
Global Solar Dataset for PV Prospecting. Gwendalyn Bender Vaisala, Solar Offering Manager for 3TIER Assessment Services
 Global Solar Dataset for PV Prospecting Gwendalyn Bender Vaisala, Solar Offering Manager for 3TIER Assessment Services Vaisala is Your Weather Expert! We have been helping industries manage the impact
Probability of Cloud-Free-Line-of-Sight (PCFLOS) Derived From CloudSat and CALIPSO Cloud Observations
 Derived From CloudSat and CALIPSO Cloud Observations") Probability of Cloud-Free-Line-of-Sight (PCFLOS) Derived From CloudSat and CALIPSO Cloud Observations Donald L. Reinke, Thomas H. Vonder Haar Cooperative Institute for Research in the Atmosphere Colorado
Probability of Cloud-Free-Line-of-Sight (PCFLOS) Derived From CloudSat and CALIPSO Cloud Observations Donald L. Reinke, Thomas H. Vonder Haar Cooperative Institute for Research in the Atmosphere Colorado
Chapter 12: Meteorology
 Chapter 12: Meteorology Section 1: The Causes of Weather 1. Compare and contrast weather and climate. 2. Analyze how imbalances in the heating of Earth s surface create weather. 3. Describe how and where
Satellite data assimilation for Numerical Weather Prediction II
 Satellite data assimilation for Numerical Weather Prediction II Niels Bormann European Centre for Medium-range Weather Forecasts (ECMWF) (with contributions from Tony McNally, Jean-Noël Thépaut, Slide