Appendix 28a.1. Climate Change. Frontier Oil Sands Mine Project Integrated Application Supplemental Information Request, Round 2
|
|
|
- Rodney Jefferson
- 5 years ago
- Views:
Transcription
1 Frontier Oil Sands Mine Project ESRD and CEAA Responses Appendix 28a.1: Climate Change Appendix 28a.1 Climate Change
2 ESRD and CEAA Responses Appendix 28a.1: Climate Change Frontier Oil Sands Mine Project
3 Frontier Oil Sands Mine Project ESRD and CEAA Responses Appendix 28a.1: Climate Change Table of Contents APPENDIX 28A.1 28a a a a a.1.5 CLIMATE CHANGE Introduction...28a a a Background...28a.1-1 Athabasca River Basin Characteristics...28a.1-2 Assessment Methods...28a a a Modelling Approach...28a a a a Hydrology Model Setup...28a.1-5 Model Data Input...28a.1-5 Model Calibration and Validation...28a.1-6 Baseline Climate Conditions and Future Climate Scenarios...28a.1-20 Results of Assessment of Effects of Climate Change on the Lower Athabasca River Basin...28a a a a Baseline Climate for Model Simulations...28a.1-21 Estimating Changes in Future Temperature and Precipitation...28a.1-22 Future Daily Climate Scenarios...28a a a a Effects of Climate Change on Flows in the Lower Athabasca River Basin...28a.1-24 Potential Climate Changes and Water Withdrawals on Athabasca River Flows...28a.1-28 Summary...28a.1-29 References...28a.1-32 Abbreviations...28a.1-33 List of Tables Table 28a.1-1 Table 28a.1-2 Table 28a.1-3 Table 28a.1-4 Climate Stations Selected for Sub-Basins within Hydrologic Regions of Athabasca River Basin... 28a.1-6 Characteristics of Sub-Basins Used for Model Calibration and Validation... 28a.1-8 Selected Climate Change Models and Scenarios for Athabasca River Basin... 28a.1-21 Hydrologic Effects of Forecasted Climate Change on Athabasca River Flows... 28a.1-25 ESRD/CEAA Page 28a.1-i
4 ESRD and CEAA Responses Appendix 28a.1: Climate Change Frontier Oil Sands Mine Project Table 28a.1-5 Table 28a.1-6 Table 28a.1-7 Forecasted Percentage Changes in Athabasca River Mean Seasonal Flows at Fort McMurray Compared to Baseline Flows ( ) by the 2060s... 28a.1-28 Change to Athabasca River Flows in Reach 4 Considering Climate Change Effects in the 2060s... 28a.1-30 Change to Athabasca River Water Level in Reach 4 Considering Climate Change Effects in 2060s... 28a.1-31 List of Figures Figure 28a.1-1 Comparisons of Simulated and Observed Flow Statistics and Mean Monthly Flows on Calibration Sub-Basins... 28a.1-13 Figure 28a.1-2 Comparisons of Simulated and Observed Flow Statistics and Mean Monthly Flows on Validation Sub-Basins... 28a.1-16 Figure 28a.1-3 Percent Changes in Average Annual Precipitation for the 2060s at Index Climate Stations... 28a.1-23 Figure 28a.1-4 Changes in Average Annual Temperature for the 2060s at Index Climate Stations... 28a.1-23 Figure 28a.1-5 Forecasted Effects of Climate Change on Mean Monthly Flows... 28a.1-27 List of Attachments Attachment 28a.1A Attachment 28a.1B Attachment 28a.1C Attachment 28a.1D Attachment 28a.1E Athabasca River Basin Surficial Geology Hydrometric Stations in the Athabasca River Basin Climate Stations in the Athabasca River Basin Calibrated Hydrologic Simulation Program-Fortran Model Parameters for Athabasca River Basin Climate Change Forecasts at Index Climate Stations ESRD/CEAA Page 28a.1-ii
5 Frontier Oil Sands Mine Project ESRD and CEAA Responses Appendix 28a.1: Climate Change 28a.1.1 Introduction 28a Background Teck submitted an and supporting environmental impact assessment (EIA) for the Frontier Oil Sands Mine Project (the Project) in November As part of the regulatory review process for the Project, Alberta Environment and Sustainable Resource Development (ESRD) requested additional information in the first round of supplemental information requests (ESRD/CEAA SIR 86b) regarding the implications of the natural flow decline observed on the Athabasca River below Fort McMurray on the model, with respect to flow and water quality. During the second round of SIRs, ESRD requested a reassessment of the changes in flows and water levels in the Athabasca River using flow trends derived from data on flows recorded at the Athabasca River below Fort McMurray hydrometric station (ESRD/CEAA Round 2 SIR 28). Teck believes that estimating future flow changes by extrapolating historical trends over a part of a cycle likely exaggerates potential future effects on flows. This is true even when using a 50-year record of flows for Athabasca River below Fort McMurray. In addition, this type of estimate may not be consistent with the predictions based on most climate change scenarios and, therefore, may not be appropriate for use in the assessment of hydrologic effects. To address the concerns raised by ESRD, the effects of potential climate change on the Athabasca River flows were further assessed using outputs from climate change scenarios projected by a number of General Circulation Models (GCMs). Forecasts of future climate conditions were analyzed using a calibrated and validated hydrologic model (i.e., the Hydrological Simulation Program-Fortran [HSPF] model) for the Athabasca River basin and its tributaries. The modelling approach consisted of selecting one scenario that, on an annual basis, would be considered as an average of the range of possible forecasts (referred to as the scenario representing future median conditions) and four possible forecasts that would represent the future extreme forecasts (wetter or drier and warmer or cooler conditions) relative to the median conditions. In essence, the approach is a sensitivity analysis of selected future changes in climate parameters, such as air temperature, precipitation and potential evapotranspiration, on flows in the Athabasca River and its tributary streams. The 2051 to 2080 period was selected to quantify the hydrologic effects of potential future climate forecasts because this period corresponds to a time when all mine development areas are expected to have been reclaimed (see the response to ESRD/CEAA Round 1 SIR 462c, Figure 462c-1). Characterizing climate change depends not only on future conditions but also on the baseline climate to which the predictions are compared. The 1961 to 1990 period was used as the climate baseline period to estimate the incremental changes in temperature and precipitation predicted by the GCMs. This appendix presents an assessment of the effects of potential climate change scenarios on the Athabasca River flows and water levels. ESRD/CEAA Page 28a.1-1
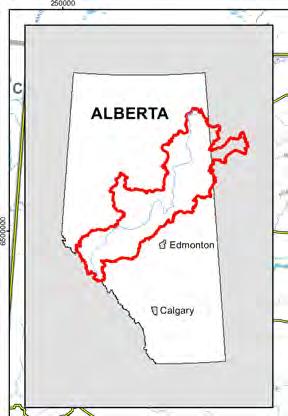
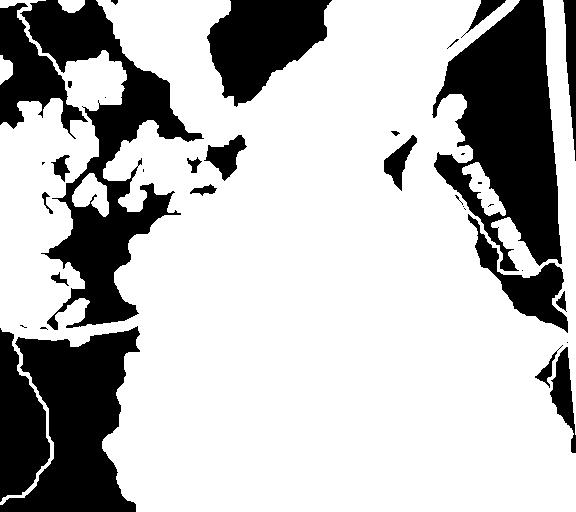
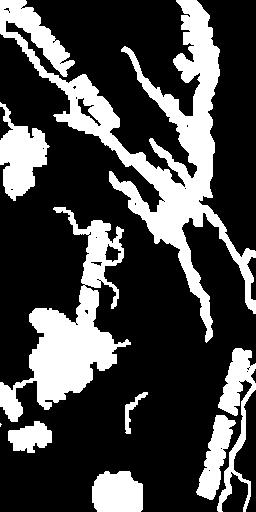
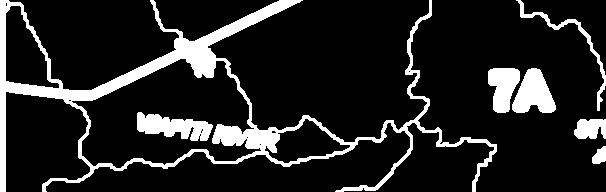
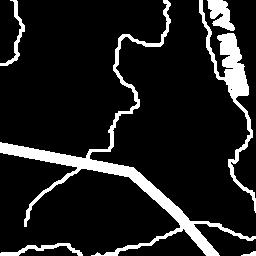
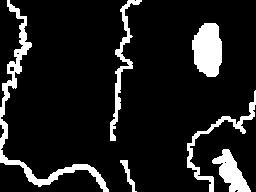
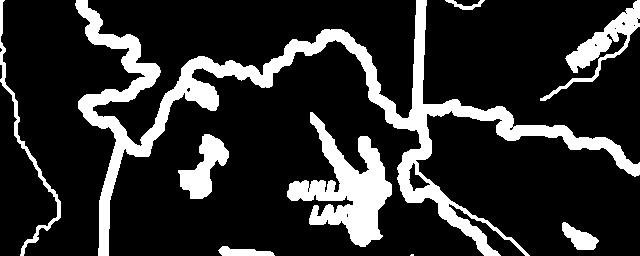
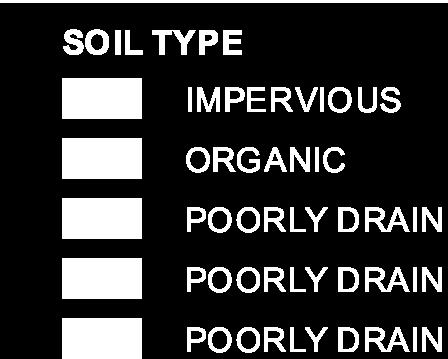
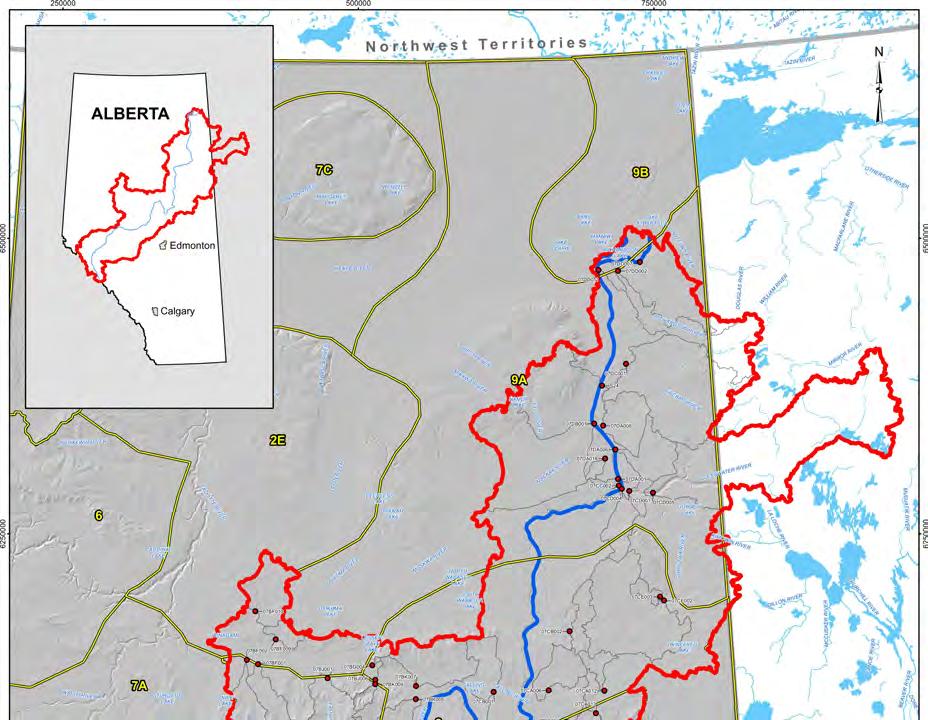
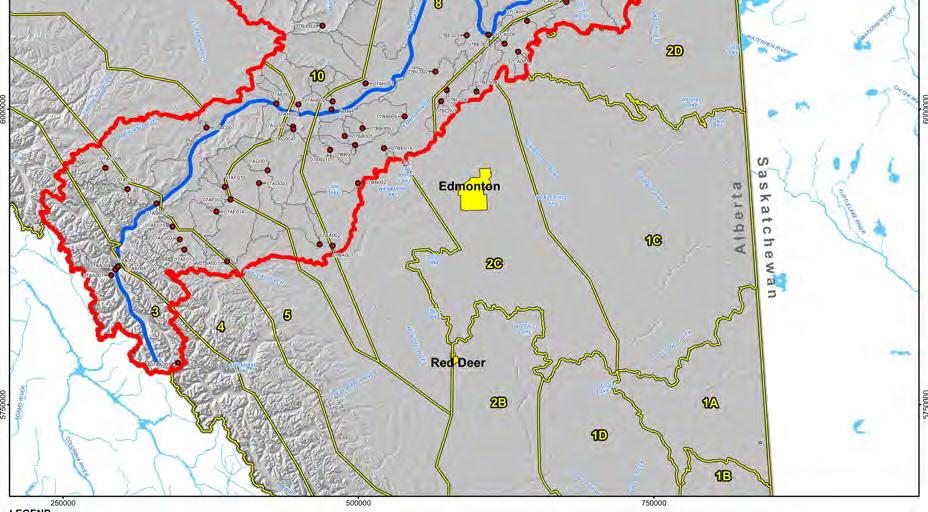
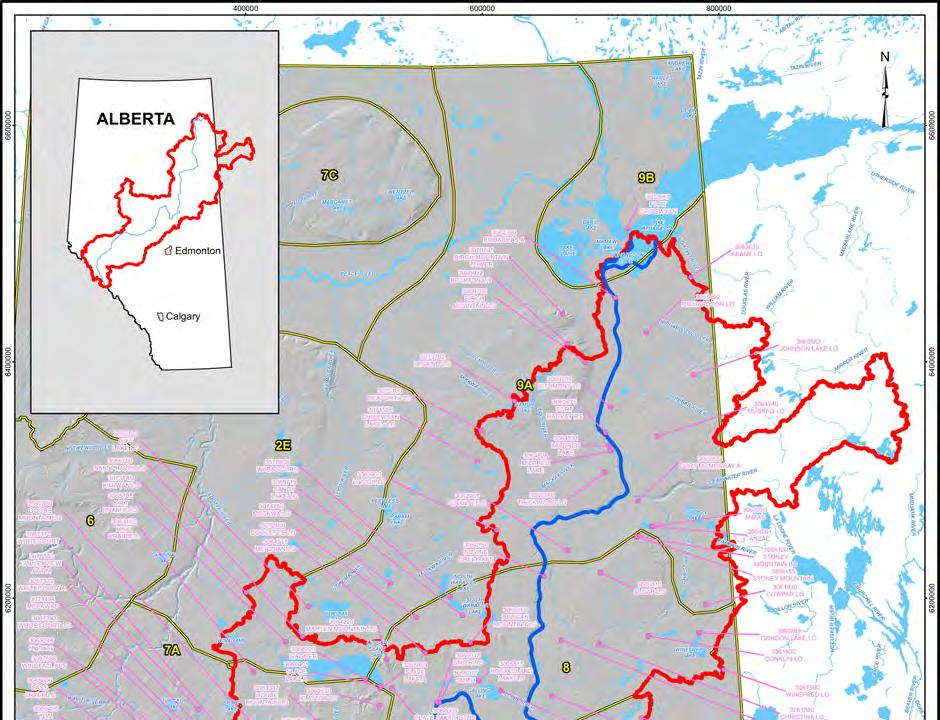
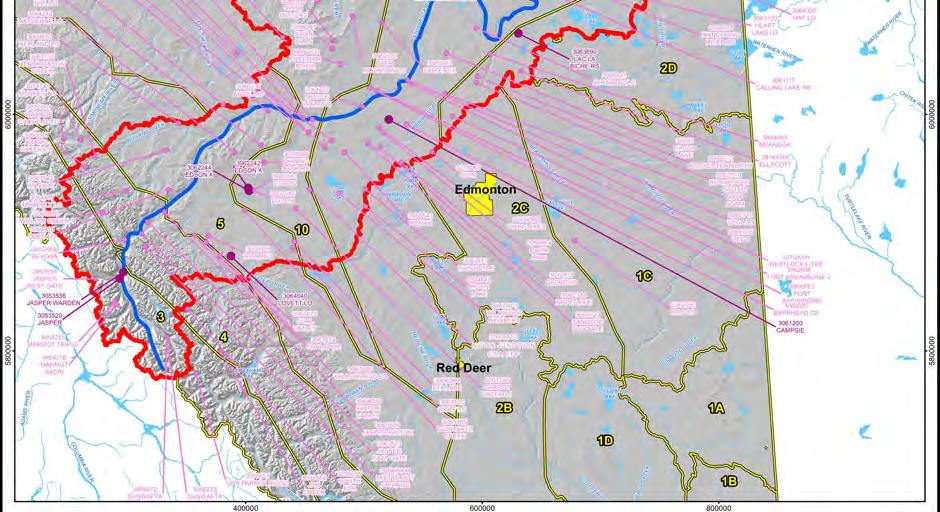
6 ESRD and CEAA Responses Appendix 28a.1: Climate Change Frontier Oil Sands Mine Project 28a Athabasca River Basin Characteristics The Athabasca River starts in the Rocky Mountains near Mount Columbia (elevation 3,747 m amsl and flows northeast for 1,300 km before discharging through the Peace- Athabasca Delta and emptying into Lake Athabasca (elevation 208 m amsl) (RAMP 2013a; Volume 2, Section ). Flows from the basin eventually make their way to the Arctic Ocean via the Slave and Mackenzie River systems. The river drains an area of approximately 138,000 km². The river flows past the urban centres of Jasper, Hinton, Whitecourt, Athabasca and Fort McMurray prior to emptying into Lake Athabasca. The Athabasca River basin includes the McLeod, Pembina and Clearwater Rivers. As a major river system, the Athabasca River is influenced by a variety of climate, terrain and landscape characteristics found within its basin (RAMP 2013b). The seasonality of climatic conditions is a major factor affecting river flow conditions. Cold winters, when most of the seasonal precipitation falls as snow, are typically followed by warm summers, when snow and glacial melt waters from the river s headwaters combine with runoff from localized snowmelt and rainfall events throughout the basin. As the river flows toward Lake Athabasca, water is contributed to the river from individual subbasins. The Athabasca River basin encompasses the following ecoregions (natural regions) (University of Alberta 2005): Rocky Mountain (Alpine, Subalpine, Mountain) Boreal Foothills Boreal Mixedwood (dry and wet) Boreal Uplands Boreal Lowlands Canadian Shield (Athabasca Plains) The surficial geology of a basin is one of the main factors influencing the hydrologic response of the basin. The surficial geology characteristics considered for modelling the Athabasca River basin are shown in Attachment 28a.1A, Figure 28a.1A-1. The Athabasca River basin was sub-divided into nine land types based on the following major surficial geology classifications: well drained sand and rapidly drained sand well drained till and rapidly drained till well drained clay loam organic soil poorly drained sand (lowland glaciolacustrine) poorly drained till (lowland glaciofluvial) ESRD/CEAA Page 28a.1-2
7 Frontier Oil Sands Mine Project ESRD and CEAA Responses Appendix 28a.1: Climate Change poorly drained clay loam (lowland glacial) impervious/fractured rock impervious/glacier The head watersheds of the Athabasca River basin are covered by glaciers. Major portions of the upper areas of the Athabasca River basin are also classified as impervious. However, most of these areas are fractured, thus increasing the travel time of runoff compared to strictly impervious areas. The characteristics of the vegetation cover in a basin also play an important role in the basin s hydrologic response through interception of precipitation, evapotranspiration of intercepted precipitation and water stored in the soil layer, and shading of solar radiation (which affects snow melt rate). 28a.1.2 Assessment Methods 28a Modelling Approach To evaluate the potential effects of climate change on the Athabasca River flow, an understanding of how the climate variables have been changing and how they might change in the future is required. General Circulation Models were used to forecast future climate change scenarios in the Athabasca River basin. The continuous (dynamic) HSPF model developed by the United States Environmental Protection Agency (U.S. EPA) was calibrated and validated for the Athabasca River basin, based on the recorded climate and flow data in the basin up to 2006, as part of the Lower Athabasca River Regional Planning Study completed by Golder Associates Ltd. for ESRD (Golder 2009). As part of the current climate change effect analysis work completed for the Frontier Project, the baseline climate data was extended by five years to 2011, and the HSPF model validation statistics and comparison were re-evaluated based on the longer period of baseline data records. The recorded climate data series were adjusted using the forecasted monthly climate changes from the GCMs and were used as inputs to the HSPF model for estimating future Athabasca River flow data. Flow statistics (mean annual flow, mean open-water flow, mean ice-cover flow, flood peak flows and 10-year 7-day low flow or 7Q10) were derived from the simulated flow series and compared with the baseline statistics that did not include the effects of potential climate change. The general modelling approach used for implementing the HSPF model to the Athabasca River basin required the following tasks: Compile available model input data, including data on climate, soil, vegetation and flow data from gauged watersheds for calibration and validation purposes. Assess changes in land use patterns in gauged watersheds during the period of available climate and flow data. ESRD/CEAA Page 28a.1-3
8 ESRD and CEAA Responses Appendix 28a.1: Climate Change Frontier Oil Sands Mine Project Select one period (5 to 10 years) of climate and flow data that is relatively free of trends and without land use changes for calibration purposes and another similar period (5 to 10 years) for validation purposes. The calibration and validation periods should ideally include both hydrologically wet and dry years. Sub-divide basin into sub-basins that are physiographically different, have different geologic characteristics, experience different climate regimes, and have flow data at convenient locations (outlet of sub-basin). Select climate stations where data would be representative of the climatic regime within each gauged watershed selected for calibration and validation purposes. Calibrate model for each gauged watershed using statistics, such as annual yield, monthly yield, winter flows and flood flows. Compare observed and simulated hydrographs visually. Validate model for each gauged watershed using input from selected period and comparing observed and simulated data for the same period. Adjust calibration parameters if necessary. Use model calibration parameters for each gauged watershed to represent model parameters for each sub-basin encompassing the gauged watershed(s) used for calibration purposes. Run the model for the entire basin using available climate data from climate stations in the basin and compare with flows recorded at several hydrometric stations on the main stem of the Athabasca River from Jasper to Fort McMurray. Run the model for the entire basin using the baseline (1961 to 2011) climate data for the basin, and compare with flows recorded at several hydrometric stations on the main stem of the Athabasca River over the same time period (i.e., 1961 to 2011). Summarize key hydrologic variables (annual and monthly water yield, particularly) at these locations and compare with those using the climate station data. Derive five future climate change scenarios from GCMs to represent the possible range of climate regimes for future 30-year time periods. Run the selected and calibrated hydrologic model for the Athabasca River basin with the five climate change scenarios. Summarize key hydrologic variables (annual and monthly water yield, particularly) at Fort McMurray hydrometric station. Compare with those using the baseline data. Summarize seasonal changes in mean flows at Fort McMurray hydrometric station. Compare with those using the baseline data. ESRD/CEAA Page 28a.1-4
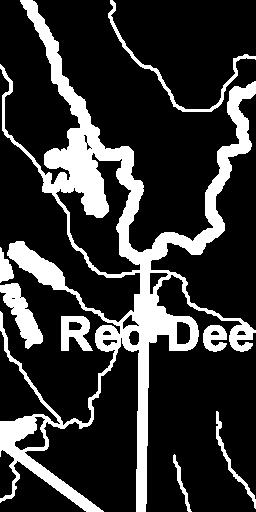
9 Frontier Oil Sands Mine Project ESRD and CEAA Responses Appendix 28a.1: Climate Change 28a Hydrology Model Setup The HSPF model used for the Athabasca River flow estimation simulates stream flows as the sum of three components: surface flow, interflow and groundwater. The relative magnitude of each component depends on land use, soils and vegetation cover. The model user can specify specific parameters for various land use types to represent the physical processes in a basin. The Athabasca River basin was subdivided into 75 sub-basins to represent the basin in the HSPF model, based on the drainage network and the locations of Water Survey Canada (WSC) stations on gauged sub-basins selected for calibration and validation of the model. The 75 sub-basins were further sub-divided based on surficial geology. The locations of the hydrometric stations for the selected gauged sub-basins are shown in Attachment 28a.1B, Figure 28a.1B-1. 28a Model Data Input The following data were used to run the HSPF model: Temperature and precipitation data for the calibration and validation of the model were from climate stations closest (specific selection based on availability of concurrent climate and flow data) to the gauged sub-basins. Climate stations in the basin are shown in Attachment 28a.1C, Figure 28a.1C-1. To account for the spatial variability of precipitation, precipitation data from different stations were assigned to the different hydrologic regions encompassed by the Athabasca River basin. Hydrologic regions of Alberta were developed by Golder (2006) for ESRD. These regions represent areas within which the climate, geology and hydrologic responses are more or less homogeneous but are different from adjacent regions. Hydrologic regions provide a rationale for assigning climate stations to the sub-basins of the Athabasca River basin. Hydrologic regions of the Lower Athabasca River basin are shown in Attachment 28a.1B, Figure 28a.1B-1. The climate stations selected for precipitation and temperature data for the sub-basins within the hydrologic regions encompassing the Athabasca River basin are listed in Table 28a.1-1. Wind speed and dew point temperature data were from the Edmonton International Airport station, Edson station or Fort McMurray station depending on the hydrologic region (see Table 28a.1-1), and solar radiation data were from the Edmonton Stony Plain station and Aurora climate station. The solar radiation data from the Edmonton Stony Plain station were assumed to be representative of the hydrologic region above Fort McMurray, and the data from the Aurora climate station were assumed to be representative of the hydrologic region below Fort McMurray. Solar radiation tends to be generally less spatially variable than most other climatic variables. Evapotranspiration and lake evaporation data were derived using the Morton Model (Morton et al. 1985), with air temperature, dew point temperature, precipitation and solar radiation used as input data. ESRD/CEAA Page 28a.1-5
10 ESRD and CEAA Responses Appendix 28a.1: Climate Change Frontier Oil Sands Mine Project Channel cross-sections used in generating depth-area-volume-flow tables were estimated from data used by WSC to develop rating curves at the hydrometric gauging stations. Recorded stream flows at several hydrometric stations in the basin were used for model calibration and validation. Simulation of HSPF model was completed based on input of climate data from 1961 to Table 28a.1-1 Climate Stations Selected for Sub-Basins within Hydrologic Regions of Athabasca River Basin Hydrologic Region Climate Station(s) Selected for Precipitation and Temperature Data 3 and 4 Jasper and Jasper Warden Edson 5 and 10.1 (south of Athabasca River) Edson Climate Station(s) Selected for Wind Speed and Dew Point Temperature Data Edson 8.1 (south of Athabasca River) Campsie Edmonton International Airport 8.2 and 10.2 (north of Athabasca River) Slave Lake 2C Lac La Biche Fort McMurray 9A Fort McMurray Fort McMurray Edmonton International Airport for wind speed Edson for dew point temperature 28a Model Calibration and Validation The general approach used to calibrate and validate the HSPF model for the Athabasca River basin was as follows: Select the climate station(s) to represent each hydrologic region, and adjust temperature and precipitation data for elevation if the climate station is at an elevation different from most of the sub-basin elevations. Select gauged sub-basins that are dominated by one surficial geology type, and select the model parameters for this surficial geology type. Repeat the process for the other surficial geology types. The purpose of this approach was to establish basin-wide model parameters that can be transferred to other sub-basins in the Athabasca River basin that have similar surficial geology. The effects of land cover or vegetation types were indirectly considered during modelling through calibration of the parameters that simulate their influences. The vegetation types were considered through the following HSPF model parameters: FOREST (fraction of the pervious land segment that is covered by forest), CEPSC (interception storage capacity) and LZETP (lower zone evapotranspiration parameter). ESRD/CEAA Page 28a.1-6
11 Frontier Oil Sands Mine Project ESRD and CEAA Responses Appendix 28a.1: Climate Change Select one gauged sub-basin with a given hydrologic region for calibration and another nearby gauged sub-basin for validation. The model calibration parameters for each gauged watershed can be used for all subbasins (gauged and ungauged) in the basin, which are similar in topographic, climatic, soil and vegetation characteristics. The sub-basins used for calibration and validation, as well as location, drainage area, land type and other information on the sub-basins are listed in Table 28a.1-2. At least three years of meteorological and hydrologic data were used to calibrate the HSPF model. Calibration began with an initial estimate of the model parameters based on the lower and upper limits of each model parameter as described in the HSPF manual. Then, the simulated monthly and annual runoff volumes were compared to the observed volumes at hydrologic gauging stations. Appropriate parameters were adjusted until the simulated monthly and annual volumes were acceptably close to the observed values. Once streamflow volumes were calibrated, flow hydrographs were calibrated using both interflow and channel routing parameters. The shapes of event hydrographs, and to some extent the peak flows, were calibrated by changing the interflow parameters and the appropriate stage-storage-discharge relationships. A combination of manual and automatic (using a model independent parameter estimation tool PEST) calibration were used to derive the model s calibration parameters. The calibration parameters for each of the nine land types are listed in Attachment 28a.1D, Table 28a.1D-1. Values in parentheses in Table 28a.1D-1 identify instances when slight changes were made in the parameters of similar land types but located in different parts of the basin. The sub-basins used for calibration and validation are listed in Table 28a.1-2, and hydrometric stations are shown in Attachment 28a.1B, Figure 28a.1B-1. ESRD/CEAA Page 28a.1-7
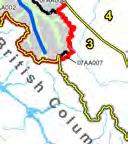
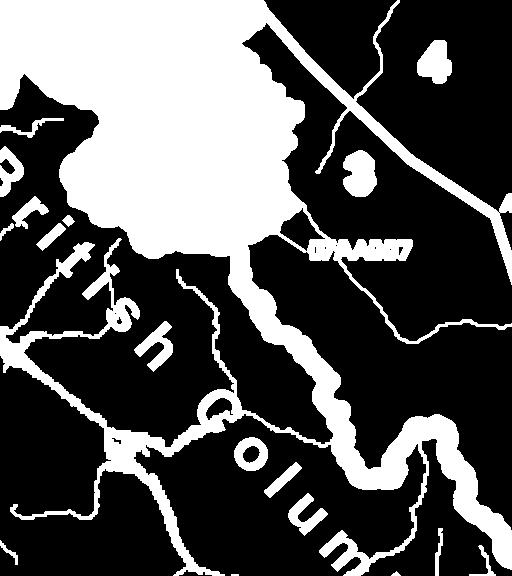
12 ESRD and CEAA Responses Appendix 28a.1: Climate Change Frontier Oil Sands Mine Project Table 28a.1-2 Characteristics of Sub-Basins Used for Model Calibration and Validation Hydrologic Region Station Number Sub-Basin Name 3 07AA002 Athabasca River near Jasper 07AA001 07AA007 Miette River near Jasper Sunwapta River at Athabasca Glacier 4 07AD002 Athabasca River at Hinton 07BA003 Lovett River near the Mouth 5 07AE001 Athabasca River near Windfall 07AF907 Erith River below Hanlan Creek 8 07BE001 Athabasca River at Athabasca 07BK007 Driftwood River near the Mouth Calibration or Validation Latitude [degminsec] Longitude [degminsec] Gross Drainage Area [km 2 ] Percent Land Type Validation ,880 26% Well Drained Till, 54% Impervious, 20% Glacier Calibration % Well Drained Till, 49% Impervious, 20% Glacier Percent of Hydrologic Region Contributing to Station (1) Record Length On Main Stem? Calibration or Validation Period Start Year End Year 3 100% Yes % No Calibration % Glacier 3 100% No Validation ,780 26% Well Drained Till,2% Well Drained Sand, 64% Impervious, 8% Glacier Calibration % Well and Rapidly Drained Till Validation ,600 49% Well Drained Till,6% Well Drained Sand,1% Poorly Drained Sand,37% Impervious,7% Glacier Calibration % Well Drained Till, 40% Well Drained Clay Loam Validation ,600 62% Well Drained Till, 12% Well Drained Sand, 5% Well Drained Loam, 3% Poorly Drained Sand,1% Poorly Drained Loam, 10% Impervious, 2% Glacier,5% Organic Calibration ,100 56% Well Drained Till, 41% Well Drained Sand, 3% Organic 3 70%, 4 30% Yes % No %, 4 26%, 5 36% Yes % No C 4%, 2E 8%, 3 9%, 4 9%, 5 17%, 8 29%, 10 23% Yes % No ESRD/CEAA Page 28a.1-8
13 Frontier Oil Sands Mine Project ESRD and CEAA Responses Appendix 28a.1: Climate Change Table 28a.1-2 Characteristics of Sub-Basins Used for Model Calibration and Validation (cont d) Hydrologic Region Station Number Sub-Basin Name 9A 07DA001 Athabasca River below Fort McMurray 07CD001 07DB005 Clearwater River at Draper Mackay River above Dunkirk River Calibration or Validation Latitude [degminsec] Longitude [degminsec] Gross Drainage Area [km 2 ] Percent Land Type Validation ,000 43% Well Drained Till, 8% Well Drained Sand,3% Well Drained Loam, 1% Poorly Drained Till, 2% Poorly Drained Sand, 1% Poorly Drained Loam, 6% Impervious, 1% Glacier, 13% Organic, 23% from Clearwater basin N/A ,800 Calibrated separately (see section text for details) Percent of Hydrologic Region Contributing to Station (1) 2C 4%, 2E 3%, 3 4%, 4 4%, 5 15%, 8 45%, 9A 5%, 10 20% 8 10%, 9A 90% + SK Province Record Length On Main Stem? Calibration or Validation Period Start Year End Year Yes No Calibration , % Organic 8 100% No NOTE: (1) First number represents hydrologic region and the percentage number represents percent of hydrologic region contributing to station. ESRD/CEAA Page 28a.1-9
14 ESRD and CEAA Responses Appendix 28a.1: Climate Change Frontier Oil Sands Mine Project The specific model calibration assessment method for the Athabasca River basin is summarized below: Model parameters for the well and rapidly drained till land type were calibrated using the recorded stream flows at Lovett River near the Mouth (Environment Canada hydrometric station 07BA003; see Attachment 28a.1B, Figure 28a.1B-1). The entire Lovett River sub-basin is covered by the well and rapidly drained till land type. The precipitation data used were from the Lovett Lookout station, and missing winter precipitation data were filled using data from the Edson climate station (see Attachment 28a.1C, Figure 28a.1C-1). Model parameters for the well-drained clay loam land type were calibrated using the recorded stream flows at Erith River below Hanlan Creek (Environment Canada hydrometric station 07AF907; see Attachment 28a.1B, Figure 28a.1B-1). The surficial geology of the Erith River sub-basin is approximately 60% well and rapidly drained till and 40% well drained clay loam. During the calibration process, the model parameters for the well and rapidly drained till land type as determined during the calibration on the Lovett River sub-basin were transferred to the Erith River subbasin. The precipitation data used were from the Lovett Lookout station, and missing winter precipitation data were filled using data from the Edson climate station (see Attachment 28a.1C, Figure 28a.1C-1). Model parameters for the organic land type were calibrated using the recorded stream flows at Mackay River above Dunkirk River (Environment Canada hydrometric station 07DB005; see Attachment 28a.1B, Figure 28a.1B-1). The entire Mackay River above Dunkirk River watershed was assumed to be covered by the organic land type. The precipitation data used were from Livock Lookout station, and missing winter precipitation data were filled using data from the Fort McMurray Airport climate station (see Attachment 28a.1C, Figure 28a.1C-1). Model parameters for the glacier land type were calibrated using the recorded stream flows at Sunwapta River at Athabasca Glacier (Environment Canada hydrometric station 07AA007; see Attachment 28a.1B, Figure 28a.1B-1). The entire Sunwapta River sub-basin was assumed to be covered by glaciers. The precipitation data used were from Jasper and Jasper Warden climate stations (see Attachment 28a.1C, Figure 28a.1C-1). Model parameters for the impervious/fractured rock land type were calibrated using the recorded stream flows at Miette River near Jasper (Environment Canada hydrometric station 07AA001; see Attachment 28a.1B, Figure 28a.1B-1). The surficial geology of the Miette River sub-basin is approximately 31% well and rapidly drained till, 20% glacier and 49% impervious/fractured rock. During the calibration process, the model parameters for the well and rapidly drained till and glacier land types were transferred from those obtained during the calibration of the Lovett River and Sunwapta River sub-basins, respectively. The precipitation data used were from Jasper and Jasper Warden climate stations (see Attachment 28a.1C, Figure 28a.1C-1). ESRD/CEAA Page 28a.1-10
15 Frontier Oil Sands Mine Project ESRD and CEAA Responses Appendix 28a.1: Climate Change Model parameters for the well and rapidly drained sand land type were calibrated using the recorded stream flows at Driftwood River near the Mouth (Environment Canada hydrometric station 07BK007; see Attachment 28a.1B, Figure 28a.1B-1). The surficial geology of the Driftwood River sub-basin is approximately 56% well and rapidly drained till, 3% organic and 41% well and rapidly drained sand. During the calibration process, the model parameters for the well and rapidly drained till and organic land types were transferred from those obtained during the calibration of the Lovett River and Mackay River above Dunkirk River sub-basins, respectively. The precipitation data used were from the Slave Lake climate station (see Attachment 28a.1C, Figure 28a.1C-1). Model parameters for the poorly drained till (lowland glaciofluvial), poorly drained sand (lowland glaciolacustrine), and poorly drained clay loam (lowland glacial) land types were obtained from the Regional Surface Water Hydrology Study for Re- Calibration of HSPF Model (Golder 2003). The sub-basins used for validation are listed in Table 28a.1-2. The validation of the calibrated HSPF model was based on a comparison of observed and simulated flows at gauging stations on the main stem of the Athabasca River (see Attachment 28a.1B, Figure 28a.1B-1), namely, Athabasca River near Jasper (Environment Canada hydrometric station 07AA002), Athabasca River at Hinton (Environment Canada hydrometric station 07AD002), Athabasca River near Windfall (Environment Canada hydrometric station 07AE001), Athabasca River at Athabasca (Environment Canada hydrometric station 07BE001), Athabasca River below McMurray (Environment Canada hydrometric station 07DA001) and Clearwater River at Draper (Environment Canada hydrometric station 07CD001). Model parameters for the Clearwater River at Draper were calibrated and validated separately because most of the sub-basin lies within the province of Saskatchewan and the land type information was not available. The portion of the Clearwater River sub-basin with missing surficial geology data was assumed to be covered by rapidly drained sand (i.e., extending the surficial geology data available on the Alberta side of the border), and the calibration and validation was done using recorded stream flow data. The accuracy of the model calibration and validation was evaluated by comparing the following measured and simulated flow parameters: mean annual flow mean open-water (March to October) flow mean monthly flow (12 months) 2-, 10- and 25-year peak flood flows ESRD/CEAA Page 28a.1-11
16 ESRD and CEAA Responses Appendix 28a.1: Climate Change Frontier Oil Sands Mine Project MODEL CALIBRATION AND VALIDATION STATISTICS Comparisons of simulated and observed flow statistics and mean monthly plots on the six gauged sub-basins used for calibration, each dominated by one particular land type, are shown in Figure 28a.1-1. Flow statistics and mean monthly plots for the six sub-basins used for validation of the calibrated HSPF model are compared in Figure 28a.1-2. The outcome of the calibration and validation of the HSPF model was deemed to be good, reasonable or poor based on the following criteria: Good: observed mean annual flow or mean open-water flow replicated to less than 10% and mean monthly flows replicated to within 20%, except for winter (very low flow) months when a difference of less than 40% was deemed to be good Reasonable: observed mean annual flow or mean open-water flow replicated to less than 15% Poor: mean monthly flows replicated to within 40%, except for winter (very low flow) months when a difference of less than 60% was deemed to be reasonable difference between observed and simulated mean annual flows is greater than 15% difference between observed and simulated mean monthly flows is greater than 40%, except for winter (very low flow) months when a difference greater than 60% was deemed to be poor The calibration on mean annual and mean open-water flows was generally good for five calibration sub-basins and poor on the Lovett River sub-basin. For mean monthly flows, the calibration was reasonable, although there were some significant differences between observed and simulated values for some winter months, which was not unexpected. The reasons for some of the significant variances between observed and simulated statistics can be explained as follows. For the calibration of these sub-basins, climate data were not generally available within the sub-basin itself; instead, the data were transferred from other locations. For example, the calibration on the Driftwood River sub-basin was based on climate data recorded at Slave Lake station (more than 40 km from the centre of the sub-basin). The drainage areas of the calibration sub-basins are relatively small, and, therefore, are more likely to be subject to uncertainties because of the spatial variability in precipitation than larger basins. The timing and magnitude of actual within-basin precipitation can be different from the recorded data at the climate station used for calibration. Redistribution of snow on the landscape can significantly influence the rate and timing of snow melt and the soil water regime, and hence watershed yield. These processes are difficult to model, primarily because of a general lack of required data, except perhaps in research basins. Hence, it was difficult to get good calibration for small sub-basins that are more prone to be affected by localized precipitation. ESRD/CEAA Page 28a.1-12
17 Frontier Oil Sands Mine Project ESRD and CEAA Responses Appendix 28a.1: Climate Change Simulated and recorded flow statistics for Sunwapta River at Athabasca Glacier (Station 07AA007) - Calibration (Glacier) ( ) Calibration Statistic Recorded [m 3 /s] Simulated [m 3 Difference [%] /s] Mean Annual Flow Mean Open-Water Flow % 2-Year Peak Flow % 10-Year Peak Flow % 25-Year Peak Flow % Mean Monthly Flows Month Observed Simulated Difference Jan Feb Mar Apr May % Jun % Jul % Aug % Sep % Oct % Nov Dec Notes: 1 Open water season is from May to October. - Recorded data are not available. Figure 2-1a Mean Monthly Flow [m 3 /s] Sunwapta River at Athabasca Glacier (07AA007) - Glacier Observed Simulated Jan Feb Mar Apr May Jun Jul Aug Sep Oct Nov Dec Simulated and recorded flow statistics for Miette River near Jasper (Station 07AA001) - Calibration (Impervious/Fractured Rock) ( ) Calibration Statistic Recorded [m 3 /s] Simulated [m 3 /s] Difference [%] Mean Annual Flow % Mean Open-Water Flow % 2-Year Peak Flow % 10-Year Peak Flow % 25-Year Peak Flow % Mean Monthly Flows Month Observed Simulated Difference Jan % Feb % Mar % Apr % May % Jun % Jul % Aug % Sep % Oct % Nov % Dec % Note: 1 Open water season is from May to October. Figure 28a.1-1 Figure 2-1b Mean Monthly Flow [m 3 /s] Miette River near Jasper (07AA001) - Impervious Jan Feb Mar Apr May Jun Jul Aug Sep Oct Nov Dec Comparisons of Simulated and Observed Flow Statistics and Mean Monthly Flows on Calibration Sub-Basins Observed Simulated ESRD/CEAA Page 28a.1-13
18 ESRD and CEAA Responses Appendix 28a.1: Climate Change Frontier Oil Sands Mine Project Simulated and recorded flow statistics for Lovett River near the Mouth (Station 07BA003) - Calibration (Well and Rapidly Drained Till) ( ) Calibration Recorded [m 3 /s] Simulated [m 3 Difference [%] Statistic /s] Mean Annual Flow Mean Open-Water Flow % 2-Year Peak Flow % 10-Year Peak Flow % 25-Year Peak Flow % Mean Monthly Flows Month Observed Simulated Difference Jan Feb Mar Apr May % Jun % Jul % Aug % Sep % Oct % Nov Dec Notes: 1 Open water season is from May to October. - Recorded data are not available. Simulated and recorded flow statistics for Erith River below Hanlan Creek (Station 07AF907) - Calibration (Well Drained Clay Loam) ( ) Calibration Statistic Recorded [m 3 /s] Simulated [m 3 Difference [%] /s] Mean Annual Flow Mean Open-Water Flow % 2-Year Peak Flow % 10-Year Peak Flow % 25-Year Peak Flow % Mean Monthly Flows Month Observed Simulated Difference Jan Feb Mar Apr May % Jun % Jul % Aug % Sep % Oct % Nov Dec Notes: 1 Open water season is from May to October. - Recorded data are not available. Figure 2-1c Mean Monthly Flow [m 3 /s] Figure 2-1d Mean Monthly Flow [m 3 /s] Lovett River near the Mouth (07BA003) - Well and Rapidly Drained Till Observed Simulated Jan Feb Mar Apr May Jun Jul Aug Sep Oct Nov Dec Erith River below Hanlan Creek (07AF907) - Well Drained Clay Loam Observed Simulated Jan Feb Mar Apr May Jun Jul Aug Sep Oct Nov Dec Figure 28a.1-1 Comparisons of Simulated and Observed Flow Statistics and Mean Monthly Flows on Calibration Sub-Basins (cont d) ESRD/CEAA Page 28a.1-14
19 Frontier Oil Sands Mine Project ESRD and CEAA Responses Appendix 28a.1: Climate Change Simulated and recorded flow statistics for Driftwood River near the Mouth (Station 07BK007) ( ) - Calibration (Well and Rapidly Drained Sand) Calibration Statistic Recorded [m 3 /s] Simulated [m 3 Difference [%] /s] Mean Annual Flow % Mean Open-Water Flow % 2-Year Peak Flow % 10-Year Peak Flow % 25-Year Peak Flow % Mean Monthly Flows Month Observed Simulated Difference Jan % Feb % Mar % Apr % May % Jun % Jul % Aug % Sep % Oct % Nov % Dec % Note: 1 Open water season is from May to October. Simulated and recorded flow statistics for Mackay River above Dunkirk River (Station 07DB005) - Calibration (Organic Soil) ( ) Calibration Recorded [m 3 /s] Simulated [m 3 Difference [%] Statistic /s] Mean Annual Flow Mean Open-Water Flow % 2-Year Peak Flow % 10-Year Peak Flow % 25-Year Peak Flow % Mean Monthly Flows Month Observed Simulated Difference Jan Feb Mar % Apr % May % Jun % Jul % Aug % Sep % Oct % Nov Dec Notes: 1 Open water season is from May to October. - Recorded data are not available. Figure 2-1e Mean Monthly Flow [m 3 /s] Figure 2-1f Mean Monthly Flow [m 3 /s] Driftwood River near the Mouth (07BK007) - Well/Rapidly Drained Sand Observed Simulated Jan Feb Mar Apr May Jun Jul Aug Sep Oct Nov Dec Mackay River above Dunkirk River (07DB005) - Organic Soil Observed Simulated Jan Feb Mar Apr May Jun Jul Aug Sep Oct Nov Dec Figure 28a.1-1 Comparisons of Simulated and Observed Flow Statistics and Mean Monthly Flows on Calibration Sub-Basins (cont d) ESRD/CEAA Page 28a.1-15
20 ESRD and CEAA Responses Appendix 28a.1: Climate Change Frontier Oil Sands Mine Project Simulated and recorded flow statistics for Athabasca River near Jasper (07AA002) Validation ( ) Statistic Recorded [m 3 /s] Simulated [m 3 Difference [%] /s] Mean Annual Flow % Mean Open-Water Flow % 2-Year Peak Flow % 10-Year Peak Flow % 25-Year Peak Flow % Mean Monthly Flows Jan % Feb % Mar % Apr % May % Jun % Jul % Aug % Sep % Oct % Nov % Dec % Note: 1 Open water season is from May to October. Figure 2-2a Mean Monthly Flows [m 3 /s] Athabasca River near Jasper (07AA002) Observed Simulated Jan Feb Mar Apr May Jun Jul Aug Sep Oct Nov Dec Simulated and recorded flow statistics for Athabasca River at Hinton (Station 07AD002) Validation ( ) Statistic Recorded [m 3 /s] Simulated [m 3 Difference [%] /s] Mean Annual Flow % Mean Open-Water Flow % 2-Year Peak Flow % 10-Year Peak Flow % 25-Year Peak Flow % Mean Monthly Flows Jan % Feb % Mar % Apr % May % Jun % Jul % Aug % Sep % Oct % Nov % Dec % Note: 1 Open water season is from May to October. Figure 28a.1-2 Figure 2-2b Mean Monthly Flow [m 3 /s] Athabasca River at Hinton (07AD002) Observed Simulated Jan Feb Mar Apr May Jun Jul Aug Sep Oct Nov Dec Comparisons of Simulated and Observed Flow Statistics and Mean Monthly Flows on Validation Sub-Basins ESRD/CEAA Page 28a.1-16
21 Frontier Oil Sands Mine Project ESRD and CEAA Responses Appendix 28a.1: Climate Change Simulated and recorded flow statistics for Athabasca River near Windfall (Station 07AE001) Validation ( ) Statistic Recorded [m 3 /s] Simulated [m 3 Difference [%] /s] Mean Annual Flow % Mean Open-Water Flow % 2-Year Peak Flow % 10-Year Peak Flow % 25-Year Peak Flow % Mean Monthly Flows Jan % Feb % Mar % Apr % May % Jun % Jul % Aug % Sep % Oct % Nov % Dec % Note: 1 Open water season is from May to October. Figure 2-2c Mean Monthly Flow [m 3 /s] Athabasca River near Winfall (07AE001) Observed Simulated Jan Feb Mar Apr May Jun Jul Aug Sep Oct Nov Dec Simulated and recorded flow statistics for Athabasca River at Athabasca (Station 07BE001) Validation ( ) Statistic Recorded [m 3 /s] Simulated [m 3 Difference [%] /s] Mean Annual Flow % Mean Open-Water Flow % 2-Year Peak Flow % 10-Year Peak Flow % 25-Year Peak Flow % Mean Monthly Flows Jan % Feb % Mar % Apr % May % Jun % Jul % Aug % Sep % Oct % Nov % Dec % Note: 1 Open water season is from May to October. Figure 28a.1-2 Figure 2-2d Mean Monthly Flow [m 3 /s] Athabasca River at Athabasca (07BE001) Jan Feb Mar Apr May Jun Jul Aug Sep Oct Nov Dec Comparisons of Simulated and Observed Flow Statistics and Mean Monthly Flows on Validation Sub-Basins (cont d) Observed Simulated ESRD/CEAA Page 28a.1-17
22 ESRD and CEAA Responses Appendix 28a.1: Climate Change Frontier Oil Sands Mine Project Recorded and simulated flow statistics for Athabasca River below Fort McMurray (Station 07DA001) Validation ( ) Statistic Recorded [m 3 /s] Simulated [m 3 Difference [%] /s] Mean Annual Flow % Mean Open-Water Flow % 2-Year Peak Flow % 10-Year Peak Flow % 25-Year Peak Flow % Mean Monthly Flows Jan % Feb % Mar % Apr % May % Jun % Jul % Aug % Sep % Oct % Nov % Dec % Note: 1 Open water season is from May to October. Recorded and simulated flow statistics for Clearwater River at Draper (Station 07CD001) Validation ( ) Statistic Recorded [m 3 /s] Simulated [m 3 Difference [%] /s] Mean Annual Flow % Mean Open-Water Flow % 2-Year Peak Flow % 10-Year Peak Flow % 25-Year Peak Flow % Mean Monthly Flows Jan % Feb % Mar % Apr % May % Jun % Jul % Aug % Sep % Oct % Nov % Dec % Note: 1 Open water season is from May to October. Figure 28a.1-2 Mean Monthlly Flow [m 3 /s] Comparisons of Simulated and Observed Flow Statistics and Mean Monthly Flows on Validation Sub-Basins (cont d) 0 Figure 2-2f Mean Monthly Flow [m 3 /s] Figure 2-2e 0 Athabasca River below Fort McMurray (07DA001) Observed Simulated Jan Feb Mar Apr May Jun Jul Aug Sep Oct Nov Dec Clearwater River at Draper (07CD001) Observed Simulated Jan Feb Mar Apr May Jun Jul Aug Sep Oct Nov Dec ESRD/CEAA Page 28a.1-18
23 Frontier Oil Sands Mine Project ESRD and CEAA Responses Appendix 28a.1: Climate Change In addition, climate stations tend to be located at relatively low elevations compared to the runoff-producing areas in the upper Athabasca River basin. Extrapolating the station data to high elevation sub-basins can be problematic. For example, precipitation data at the Jasper climate station, which is located at an elevation of about 1,050 m amsl, was used for simulation of runoff from the Miette River sub-basin. The summer and winter precipitation was adjusted using an orographic adjustment factor. More than 70% of the Miette River sub-basin is at an elevation greater than 2,000 m amsl, with a maximum elevation up to 2,500 m amsl. It is possible that extrapolation of the orographic adjustment factor to the very high elevations in this sub-basin may have resulted in some errors in the simulated runoff values. In practice, there should be a cap on the application of the orographic adjustment with elevation because rainfall tends to decrease past certain elevations. The calibration shows differences between observed and simulated values for winter flows in the small sub-basins because (1) there are uncertainties in low winter flow values and (2) small differences in magnitude usually manifest themselves as large percentage changes because the differences are divided by small winter flow values. Other factors that may have affected the calibration of the model are spatial variability in frozen soil conditions, spatial variability in vegetation cover, land use changes over time, variable impervious glaciated and fractured areas, and water withdrawals and returns. Adjustments for these factors can be made within the model for specific studies on standalone sub-basins; however, given that the model is being implemented for the entire Athabasca River basin with the focus on the natural flows in the lower reaches of the basin, these adjustments are not considered necessary at this stage. Further attempts at refining the calibration of the model did not result in significant improvements in model performance. Also, given that the performance of the model at the validation nodes on the main stem of the Athabasca River is considered good, the HSPF model is considered calibrated with parameters as listed in Attachment 28a.1D, Table 28a.1D-1 for the Athabasca River basin. The calibrated model reproduced the measured discharges at the validation nodes on the main stem of the Athabasca River well to reasonably well, giving confidence in the use of the model for assessing the hydrologic effects of potential future climate changes (see Figure 28a.1-2). The validation nodes capture sub-basins with different land types (in different percentages within each sub-basin as listed in Table 28a.1-2) and different climate regimes. The combination of a range of land types and climate regimes at the validation nodes is likely a more rigorous test of the performance of the calibrated model. However, it may be argued that the drainage areas at these nodes are much larger than those of the small sub-basins, and differences in responses between small sub-basins tend to be masked, thus improving the model performance at the validation stage. Notwithstanding the foregoing, it is concluded that the calibrated HSPF model has been validated and is appropriate for assessing the effects of climate change on the flow in the Athabasca River basin. ESRD/CEAA Page 28a.1-19
24 ESRD and CEAA Responses Appendix 28a.1: Climate Change Frontier Oil Sands Mine Project 28a Baseline Climate Conditions and Future Climate Scenarios To address the effects of potential climate change on flows in the Athabasca River basin, the calibrated and validated HSPF model for the basin was used to simulate the hydrologic effects of forecasted future climate scenarios. An analysis of the effects of climate change depends not only on future conditions but also on the baseline climate to which the predictions are compared. The baseline climate data input to the HSPF model for baseline flow simulations were obtained from the records at six index climate stations within the Athabasca River basin. The baseline climate data used for climate change scenarios (changes in future climate variables) were based on the recommendation of the Intergovernmental Panel on Climate Change (IPCC). The IPCC recommends that 1961 to 1990 be adopted as the climatological baseline period in impact assessments (IPCC 2013). The Canadian Climate Change Scenarios Network (CCCSN) allows users to download GCMs output from the IPCC Fourth Assessment Report (AR4) (IPCC 2007). The average changes in climate variables were downloaded from CCCSN (CCCSN 2013) at the locations of index stations in the Athabasca River basin for the 24 available combinations of GCMs and associated emission scenarios (the combinations referred to as GCM-scenarios) recommended by IPCC. The forecast of climate change relative to the 1961 to 1990 baseline period represents the forecasted total climate change between the modelled baseline period (1961 to 1990) as represented by its 30-year average and the modelled future period (i.e., 2051 to 2080, called the 2060s) as represented by its 30-year average. Scatterplots of mean temperature and precipitation changes for seasonal and annual averages from 24 GCM-scenarios at each index climate station for the Athabasca River basin were prepared (Attachment 28a.1E) to select representative GCM-scenarios associated with the extreme changes forecasted for the basin. The forecasted climate changes at the index climate stations for the 2051 to 2080 period relative to the 1961 to 1990 baseline period for annual and seasonal averages are shown in Attachment 28a.1E, Figures 28a.1E-1 to 28a.1E-6. Five selected representative GCMs and scenarios for the Athabasca River basin are listed in Table 28a.1-3. The five selected scenarios represent climate conditions that were cooler and drier (BCM2.0 SR-B1), cooler and wetter (INMCM3.0 SR-A2), warmer and wetter (MIROC3.2 hires SR-A1B), and warmer and drier (CNRMCM3 SR-A2) than median conditions (CGCM3T47 SR-B1). These five scenarios bound the range of reasonably possible future climate regimes from several GCMs for temperature and precipitation. The changes in climate variables forecasted by the selected GCM-scenarios and the baseline climate data recorded at index climate stations within the Athabasca River basin provide the future climate scenarios for the 2060s. ESRD/CEAA Page 28a.1-20
25 Frontier Oil Sands Mine Project ESRD and CEAA Responses Appendix 28a.1: Climate Change Table 28a.1-3 Selected Climate Change Models and Scenarios for Athabasca River Basin Modelling Centre Country Climate Change Model Emissions Scenario Scenario Run Climate Condition Bjerknes Centre for Climate Research (BCCR) Norway BCM2.0 SR-B1 Run 1 Cool and dry Canadian Centre for Climate Modelling and Analysis (CCCma) Météo-France/Centre National de Recherches Meteorologiques (CNRM) Canada CGCM3T47 SR-B1 Mean Median France CNRMCM3 SR-A2 Run 1 Warm and dry Institute for Numerical Mathematics (INM) Russia INMCM3.0 SR-A2 Run 1 Cool and wet Center for Climate System Research (University of Tokyo), National Institute for Environmental Studies, and Frontier Research Center for Global Change (JAMSTEC) Japan MIROC3.2 hires SR-A1B Run 1 Warm and wet 28a.1.3 Results of Assessment of Effects of Climate Change on the Lower Athabasca River Basin The effects of climate change on river flows in the Athabasca River basin will affect water use and water management in the basin. Changes in future climate regimes and their effects on flows in the basin were provided. 28a Baseline Climate for Model Simulations The HSPF model is a continuous simulation model that requires daily temperature and precipitation data as inputs. The baseline input daily series for HSPF were obtained from the records at climate stations within the Athabasca River basin. The daily series of temperature and precipitation were compiled for six index climate stations (Attachment 28a.1C, Figure 28a.1C-1) in the Athabasca River basin. The criteria used to select the index stations were: range of climate variables recorded by the station (e.g., precipitation, temperature, wind speed), length of recorded data (preferably from 1960 to the present and at least covering the baseline period of 1961 to 1990), reliable and good quality data with low numbers of missing data, and spatial distribution to cover most of the hydrologic regions in the Athabasca River basin. The index climate stations are the following: Jasper and Jasper Warden, covering sub-basins in hydrologic regions 3 and 4 Edson, covering sub-basins in hydrologic regions 5 and 10 South Campsie, covering sub-basins in hydrologic region 8 South Slave Lake, covering sub-basins in hydrologic regions 10 North and 8 North ESRD/CEAA Page 28a.1-21
26 ESRD and CEAA Responses Appendix 28a.1: Climate Change Frontier Oil Sands Mine Project Lac La Biche, covering sub-basins in hydrologic region 2C Fort McMurray, covering sub-basins in hydrologic region 9A These stations provide good coverage of the Athabasca River basin. Missing data at the index stations were filled in by developing a relationship between monthly precipitation data from nearby climate station to the index station within the same hydrologic region. 28a Estimating Changes in Future Temperature and Precipitation The GCMs provide the changes in the average monthly temperature and precipitation values compared to the baseline (1961 to 1990) average values. The changes in forecasted mean temperature and precipitation compared to baseline values for the index stations in the Athabasca River basin are listed in Attachment 28a.1E, Tables 28a.1E-1 to 28a.1E-6 for Jasper, Edson, Campsie, Slave Lake, Lac La Biche and Fort McMurray climate stations, respectively. The changes in precipitation are expressed as the percentage of the difference between future value and baseline value relative to the baseline value, and the changes in temperature are expressed as the difference between the future value and the baseline value. The changes in mean annual precipitation and mean annual temperature, respectively, relative to the baseline values are shown in Figures 28a.1-3 and 28a.1-4. The average changes in mean annual precipitation in the basin vary from -5.2% at Lac La Biche station to +28% at Fort McMurray and Lac La Biche stations as listed in Attachment 28a.1E, Table 28a.1E-1 to 28a.1E-6. The range of the changes in precipitation is much wider on a monthly basis, varying from -22% at Edson and Lac La Biche stations to +99% at Fort McMurray and Lac La Biche stations. The general trend appears to be increased precipitation relative to the baseline period, but with greater variability in the monthly changes. The average increases in mean annual temperature varies from 1.22 C at Jasper station to 5.38 C at Fort McMurray station as listed in Attachment 28a.1E, Tables 28a.1E-1 to 28a.1E-6. The range of the changes in temperature depends on the season under consideration; increases are generally higher for the winter months than for the summer months. ESRD/CEAA Page 28a.1-22
27 Frontier Oil Sands Mine Project ESRD and CEAA Responses Appendix 28a.1: Climate Change Percentage Change Relative to Baseline ( ) Jasper Edson Campsie Slave lake Lac La Biche Fort McMurray BCM2.0(SR-B1) CGCM3T47(SR-B1) CNRMCM3(SR-A2) INMCM3.0(SR-A2) MIROC3.2 hires (SR-A1B) Climate Change Model and Scenario Figure 28a.1-3 Percent Changes in Average Annual Precipitation for the 2060s at Index Climate Stations Change in 0 C Relative to Baseline ( ) Figure 28a.1-4 Jasper Edson Campsie Slave lake Lac La Biche Fort McMurray BCM2.0(SR-B1) CGCM3T47(SR-B1) CNRMCM3(SR-A2) INMCM3.0(SR-A2) MIROC3.2 hires (SR-A1B) Climate Change Model and Scenario Changes in Average Annual Temperature for the 2060s at Index Climate Stations ESRD/CEAA Page 28a.1-23
28 ESRD and CEAA Responses Appendix 28a.1: Climate Change Frontier Oil Sands Mine Project 28a Future Daily Climate Scenarios The daily series of temperature and precipitation data for the future climate scenarios were generated by adjusting the daily baseline climate data recorded at index climate stations as described in Section 28a by the differences in the temperature and precipitation forecasted by the selected GCM-scenarios as described in Section 28a a Effects of Climate Change on Flows in the Lower Athabasca River Basin The HSPF model calibrated for the Athabasca River basin was run with the baseline climate data (Section 28a.1.3.1) and the adjusted future climate data (Section 28a.1.3.3). Results of a comparison between flow statistics (mean annual flow; mean open-water and ice-cover flows; 2-, 10-, 25- and 100-year flood flows; 7Q10 low flow; and mean monthly flows) for the five selected climate change scenarios are summarized in Table 28a.1-4 for the Athabasca River flow below Fort McMurray station. The forecasted changes in mean monthly flows are presented graphically in Figure 28a.1-5. General conclusions from the comparison of flow statistics presented in Table 28a.1-4 are summarized as follows: For the cool and wet climate conditions represented by INMCM3.0 (Run 1)-SR-A2 climate change scenario, the flow statistics for Athabasca River at the station below Fort McMurray will increase relative to baseline values except for the August mean monthly flow for which a decrease of about 8% is predicted. The mean annual and mean open-water season flows will increase by about 17% and 13%, respectively. The mean ice-cover flow will increase by about 46%, and the largest increase in the mean monthly flow will be about 88% in March. For the cool and dry, and median climate conditions represented by BCM2.0 (Run 1)- SR-B1 and CGCM3T47 (Mean)-SR-B1, respectively, some flow statistics will decrease relative to baseline values, while others will increase. The decrease in mean annual and mean open-water season flows will be less than 6%. The mean ice-cover flow will increase. The largest decrease in the mean monthly flows will be about 23% in August. For the warm and dry climate condition represented by CNRMCM3 (Run 1)-SR-A2 climate change scenario, all the flow statistics will decrease except the March mean monthly flow. The mean annual and mean open-water season flows will decrease by about 22% and 25%, respectively. The mean ice-cover flow will decrease by about 3%, and the largest decrease in the mean monthly flow will be about 41% in August. For the warm and wet climate condition represented by the MIROC3.2 hires (Run 1)- SR-A1B scenario, most of the forecasted flow statistics will decrease relative to baseline values. The mean annual and mean open-water season flows will decrease by about 18% and 28%, respectively. However, the mean ice-cover flow will increase. The mean monthly flows will decrease for most months except February, March and April. The largest decrease in the mean monthly flows will be about 53% in August. ESRD/CEAA Page 28a.1-24
29 Frontier Oil Sands Mine Project ESRD and CEAA Responses Appendix 28a.1: Climate Change Table 28a.1-4 Hydrologic Effects of Forecasted Climate Change on Athabasca River Flows Baseline Flows ( ) (m 3 /s) Forecasted Change in Flows at Athabasca River below Fort McMurray WSC 07DA001 Compared to Baseline Flows ( ) BCM2.0 (Run 1) SR-B1 (Cool-Dry Conditions) Change (%) CGCM3T47 (Mean) SR-B1 (Median Conditions) Change (%) CNRMCM3 (Run 1) SR-A2 (Warm Dry Conditions) Change (%) INMCM3.0 (Run 1) SR-A2 (Cool-Wet Conditions) Change (%) MIROC3.2 hires (Run 1) SR-A1B (Warm-Wet Conditions) Change (%) Mean Annual Flow % -2.5% -22.2% 17.1% -18.4% Mean Open-Water Flow 1, % -5.7% -24.9% 13.0% -28.2% Mean Ice-Cover Flow % 20.2% -2.8% 46.1% 50.5% 2-Year Peak Flow 2, % -4.3% -24.1% 27.7% -28.0% 10-Year Peak Flow 3, % 0.4% -21.0% 43.3% -21.4% 25-Year Peak Flow 4, % 2.7% -19.6% 50.4% -19.4% 100-Year Peak Flow 4, % 6.1% -17.8% 60.4% -17.2% 7Q10-Low Flow % -3.8% -20.0% 22.7% -9.1% Mean Monthly Flows Jan % 2.1% -10.5% 24.1% 4.0% Feb % 10.8% -6.9% 38.8% 37.7% Mar % 52.2% 6.9% 88.1% 149% Apr % 25.1% -1.3% 44.0% 50.4% May 1, % -1.0% -22.4% 11.6% -2.7% Jun 1, % 9.2% -10.1% 35.3% -23.8% Jul 1, % -10.0% -30.6% 16.0% -49.5% Aug 1, % -22.5% -41.2% -7.7% -52.8% Sep % -13.9% -33.2% -2.9% -31.8% Oct % -2.0% -12.7% 12.7% -5.4% Nov % 1.4% -10.6% 20.4% -2.7% Dec % 2.6% -11.6% 24.0% -0.7% NOTE: Baseline flow data ( ) at the Athabasca River below Fort McMurray hydrometric station (WSC 07DA001) are simulated from baseline climate data. ESRD/CEAA Page 28a.1-25
30 ESRD and CEAA Responses Appendix 28a.1: Climate Change Frontier Oil Sands Mine Project Table 28a.1-4 Hydrologic Effects of Forecasted Climate Change on Athabasca River Flows (cont d) Baseline Flows ( ) Forecasted Flows at Athabasca River below Fort McMurray WSC 07DA001 BCM2.0 (Run 1) SR-B1 (Cool-Dry Conditions) CGCM3T47 (Mean) SR-B1 (Median conditions) CNRMCM3 (Run 1) SR-A2 (Warm Dry Conditions) INMCM3.0 (Run 1) SR-A2 (Cool-Wet Conditions) MIROC3.2 hires (Run 1) SR-A1B (Warm-Wet Conditions) (m 3 /s) (m 3 /s) (m 3 /s) (m 3 /s) (m 3 /s) (m 3 /s) Mean Annual Flow Mean Open-Water Flow 1,073 1,026 1, , Mean Ice-Cover Flow Year Peak Flow 2,331 2,324 2,231 1,769 2,978 1, Year Peak Flow 3,454 3,746 3,466 2,729 4,949 2, Year Peak Flow 4,006 4,434 4,114 3,219 6,025 3, Year Peak Flow 4,820 5,427 5,116 3,960 7,732 3,979 7Q10-Low Flow Mean Monthly Flows Jan Feb Mar Apr May 1,139 1,061 1, ,271 1,108 Jun 1,362 1,321 1,487 1,225 1,843 1,037 Jul 1,701 1,670 1,531 1,180 1, Aug 1,313 1,086 1, , Sep Oct Nov Dec NOTE: Baseline flow data ( ) at the Athabasca River below Fort McMurray hydrometric station (WSC 07DA001) are simulated from baseline climate data. ESRD/CEAA Page 28a.1-26
 Forecasted Percentage Change in Flows at Athabasca River below McMurray WSC 07DA001")
31 Frontier Oil Sands Mine Project ESRD and CEAA Responses Appendix 28a.1: Climate Change Change [%] 180% 160% 140% 120% 100% 80% 60% 40% 20% 0% -20% -40% -60% -80% -100% -120% (a) Forecasted Percentage Change in Flows at Athabasca River below McMurray WSC 07DA001 Compared to Baseline Flows ( ) BCM2.0 (Run 1) - SR-B1 CGCM3T47 (Mean) - SR-B1 CNRMCM3 (Run 1) - SR-A2 INMCM3.0 (Run 1) - SR-A2 MIROC3.2 hires (Run 1) - SR-A1B Jan Feb Mar Apr May Jun Jul Aug Sep Oct Nov Dec Month Mean Monthly Flow [m 3 /s] (b) Forecasted Flows at Athabasca River below McMurray WSC 07DA001 BCM2.0 (Run 1) - SR-B1 CGCM3T47 (Mean) - SR-B1 CNRMCM3 (Run 1) - SR-A2 INMCM3.0 (Run 1) - SR-A2 MIROC3.2 hires (Run 1) - SR-A1B Baseline Flows ( ) Jan Feb Mar Apr May Jun Jul Aug Sep Oct Nov Dec Month Figure 28a.1-5 Forecasted Effects of Climate Change on Mean Monthly Flows ESRD/CEAA Page 28a.1-27
32 ESRD and CEAA Responses Appendix 28a.1: Climate Change Frontier Oil Sands Mine Project The forecasted percentage changes in the Athabasca River mean seasonal flows at the station below Fort McMurray compared to baseline flows (1961 to 1990) due to potential climate change by the 2060s are summarized in Table 28a.1-5. Table 28a.1-5 Forecasted Percentage Changes in Athabasca River Mean Seasonal Flows at Fort McMurray Compared to Baseline Flows ( ) by the 2060s Period Cool-Dry Conditions [BCM2.0 (Run 1) SR-B1] (%) Median Conditions [CGCM3T47 (Mean) - SR-B1] (%) Warm Dry Conditions [CNRMCM3 (Run 1) SR-A2] (%) Cool-Wet Conditions [INMCM3.0 (Run 1) SR-A2] (%) Warm-Wet Conditions [MIROC3.2 hires (Run 1) - SR-A1B] (%) Based on Trend of Historical Recorded Data below Fort McMurray (%) Annual Winter Spring Summer Fall As listed in Table 28a.1-5, in the instances when climate change scenarios result in decreasing flows, the maximum forecasted change in mean annual and seasonal flows for Athabasca River is significantly lower than the percentage change predicted based on trends of recorded historical data. Hence, estimates of future flow changes based on simply extrapolating historical trends over part of a cycle, even when using 50-years of recorded flows for Athabasca River below Fort McMurray, can be grossly exaggerated, may not be consistent with the predictions based on most climate change scenarios and, therefore, may not be appropriate for use in the assessment of hydrologic effects. 28a Potential Climate Changes and Water Withdrawals on Athabasca River Flows The development of the Water Management Framework for the Athabasca River below Fort McMurray (AENV and DFO 2007) is based on historical flows for the river from 1958 to If flows were to decrease in the future because of climate change, the Water Management Framework restrictions would be invoked more often. Expected percentages of flow reductions from potential climate change (as listed in Table 28a.1-5, and a summary of water withdrawals from the lower reach of the Athabasca River provided in Volume 5, Section 3, Tables 3-13 and 3-29 and ESRD/CEAA Appendix 308a.3, Table 308a.3-8) were used to assess the level of uncertainty in predicting changes in seasonal flow parameters. The predicted changes in Athabasca River flows and water levels, respectively, as a result of the total allowable water withdrawals under the Water Management Framework restrictions including the effects of reduced Athabasca River flows from climate change ESRD/CEAA Page 28a.1-28
33 Frontier Oil Sands Mine Project ESRD and CEAA Responses Appendix 28a.1: Climate Change for Base Case, Application Case and Planned Development Case (PDC) are listed in Tables 28a.1-6 and 28a.1-7. The results indicate that under climate change scenarios that reduce Athabasca River flows (e.g., CNRMCM3 [Run 1] - SR-A2), more frequent restrictions on water withdrawals would be imposed. Consequently, the percent reductions in seasonal flows from water withdrawal are less relative to those without the effects of climate change or climate change scenarios that increase flows in Athabasca River (INMCM3.0 [Run 1] - SR-A2). 28a Summary The results of simulations of five forecasted climate conditions (median and extremes of wet or dry and cool or warm conditions) on the Athabasca River support the conclusion that, under predicted future climate change scenarios, more frequent restrictions on water withdrawals would be imposed; consequently, the percentage reductions in seasonal flows due to water withdrawal are less compared to those without the effects of climate change. ESRD/CEAA Page 28a.1-29
34 ESRD and CEAA Responses Appendix 28a.1: Climate Change Frontier Oil Sands Mine Project Table 28a.1-6 Model Scenario MIROC3.2 hires (Run 1) - SR- A1B CNRMCM3 (Run 1) - SR-A2 INMCM3.0 (Run 1) - SR-A2 BCM2.0 (Run 1) - SR-B1 CGCM3T47 (Mean) - SR-B1 Change to Athabasca River Flows in Reach 4 Considering Climate Change Effects in the 2060s Season Baseline Flow ( ) Stream Flow Discharge Flows with Climate Change (No Water Withdrawal) Stream Flow Discharge Change from Climate Change Only Stream Flow Discharge Climate Change plus Water Withdrawal for Frontier Project Base Case Change From Baseline Flow Application Case Stream Flow Discharge Change From Baseline Flow Planned Development Case Stream Flow Discharge Change From Baseline Flow (m 3 /s) (m 3 /s) (%) (m 3 /s) (%) (m 3 /s) (%) (m 3 /s) (%) winter spring summer 1, fall winter spring summer 1,463 1, , , , fall winter spring summer 1,463 1, , , , fall winter spring summer 1,463 1, , , , fall winter spring summer 1,463 1, , , , fall ESRD/CEAA Page 28a.1-30
35 Frontier Oil Sands Mine Project ESRD and CEAA Responses Appendix 28a.1: Climate Change Table 28a.1-7 Model Scenario MIROC3.2 hires (Run 1) - SR- A1B CNRMCM3 (Run 1) - SR-A2 INMCM3.0 (Run 1) - SR-A2 BCM2.0 (Run 1) - SR-B1 CGCM3T47 (Mean) - SR-B1 Change to Athabasca River Water Level in Reach 4 Considering Climate Change Effects in 2060s Season Baseline Water Level ( ) Stream Flow Discharge Water Level with Climate Change (No Water Withdrawal) Water Level Change from Climate Change Only Water Level Climate Change plus Water Withdrawal for Frontier Project Base Case Change From Baseline Water Level Application Case Water Level Change From Baseline Water Level Planned Development Case Water Level Change From Baseline Water Level (m) (m) (m) (m) (m) (m) (m) (m) (m) winter spring summer fall winter spring summer fall winter spring summer fall winter spring summer fall winter spring summer fall ESRD/CEAA Page 28a.1-31
36 ESRD and CEAA Responses Appendix 28a.1: Climate Change Frontier Oil Sands Mine Project 28a.1.4 References AENV and DFO (Alberta Environment and Fisheries and Oceans Canada) Water Management Framework: Instream Flow Needs and Water Management System for the Lower Athabasca River. February Edmonton, Alberta. CCCSN (Canadian Climate Change Scenarios Network) Baseline Climate Data. Available at: Accessed April Golder (Golder Associates Ltd.) Regional Surface Water Hydrology Study for Re-Calibration of HSPF Model. Report Prepared for Canadian Natural Resources Ltd., Shell Canada Energy, Suncor Energy Inc. and Syncrude Canada Ltd. March Calgary, Alberta. Golder Hydrologic Regions of Alberta. Prepared for Alberta Environment and Sustainable Resource Development. March Golder Hydro-Climate Model selection and Application on the Athabasca and Beaver River Basins. Submitted to Oil Sands Environmental Management Division of Alberta Environment and Sustainable Resource Development. August IPCC (Intergovernmental Panel on Climate Change) The Physical Science Basis. Contribution of Working Group I to the Fourth Assessment Report of the Intergovernmental Panel on Climate Change. S. Solomon, D. Qin, M. Manning, Z. Chen, M. Marquis, K.B. Averyt, M. Tignor and H.L. Miller (eds.). Cambridge University Press, Cambridge, United Kingdom and New York, NY, USA. IPCC (Intergovernmental Panel on Climate Change) Climate Change 2007: Synthesis Report. Available at: report_synthesis_report.htm. Accessed April Morton, F.I., F. Richard and S. Fogarasi Operational Estimates of Areal Evapotranspiration and Lake Evaporation Program WREVAP. National Hydrology Research Institute. Inland Waters Directorate. Environment Canada. Ottawa, Ontario. RAMP (Regional Aquatics Monitoring Program). 2013a. Overview of Athabasca River basin landscape. Available at: Accessed: April 2013 RAMP. 2013b. Athabasca River Basin. Available at: Accessed April University of Alberta Atlas of Alberta Lakes. University of Alberta Press, Edmonton, Alberta. ESRD/CEAA Page 28a.1-32
37 Frontier Oil Sands Mine Project ESRD and CEAA Responses Appendix 28a.1: Climate Change 28a.1.5 Abbreviations 7Q10...lowest 7-day consecutive flow that occurs, on average, once every 10 years CCCSN...Canadian Climate Change Scenarios Network EIA...Environmental Impact Assessment ESRD...Alberta Environment and Sustainable Resource Development GCM... General Circulation Model HSPF...Hydrological Simulation Program-Fortran IPCC... Intergovernmental Panel on Climate Change JME...Jackpine Mine Expansion m amsl...metres above mean sea level PDC... Planned Development Case U.S. EPA... United States Environmental Protection Agency WSC... Water Survey Canada ESRD/CEAA Page 28a.1-33
38 ESRD and CEAA Responses Appendix 28a.1: Climate Change Frontier Oil Sands Mine Project ESRD/CEAA Page 28a.1-34
39 Frontier Oil Sands Mine Project ESRD and CEAA Responses Attachment 28a.1A: Athabasca River Basin Surficial Geology Attachment 28a.1A Athabasca River Basin Surficial Geology
40 ESRD and CEAA Responses Attachment 28a.1A: Athabasca River Basin Surficial Geology Frontier Oil Sands Mine Project


41
42 ESRD and CEAA Responses Attachment 28a.1A: Athabasca River Basin Surficial Geology Frontier Oil Sands Mine Project
43 Frontier Oil Sands Mine Project ESRD and CEAA Responses Attachment 28a.1B: Hydrometric Stations in the Athabasca River Basin Attachment 28a.1B Hydrometric Stations in the Athabasca River Basin
44 ESRD and CEAA Responses Attachment 28a.1B: Hydrometric Stations in the Athabasca River Basin Frontier Oil Sands Mine Project
45
46 ESRD and CEAA Responses Attachment 28a.1B: Hydrometric Stations in the Athabasca River Basin Frontier Oil Sands Mine Project
47 Frontier Oil Sands Mine Project ESRD and CEAA Responses Attachment 28a.1C: Climate Stations in the Athabasca River Basin Attachment 28a.1C Climate Stations in the Athabasca River Basin
48 ESRD and CEAA Responses Attachment 28a.1C: Climate Stations in the Athabasca River Basin Frontier Oil Sands Mine Project


49
Appendix D. Model Setup, Calibration, and Validation
 . Model Setup, Calibration, and Validation Lower Grand River Watershed TMDL January 1 1. Model Selection and Setup The Loading Simulation Program in C++ (LSPC) was selected to address the modeling needs
Flood Forecasting Tools for Ungauged Streams in Alberta: Status and Lessons from the Flood of 2013
 Flood Forecasting Tools for Ungauged Streams in Alberta: Status and Lessons from the Flood of 2013 John Pomeroy, Xing Fang, Kevin Shook, Tom Brown Centre for Hydrology, University of Saskatchewan, Saskatoon
Chiang Rai Province CC Threat overview AAS1109 Mekong ARCC
 Chiang Rai Province CC Threat overview AAS1109 Mekong ARCC This threat overview relies on projections of future climate change in the Mekong Basin for the period 2045-2069 compared to a baseline of 1980-2005.
Changing Hydrology under a Changing Climate for a Coastal Plain Watershed
 Changing Hydrology under a Changing Climate for a Coastal Plain Watershed David Bosch USDA-ARS, Tifton, GA Jeff Arnold ARS Temple, TX and Peter Allen Baylor University, TX SEWRU Objectives 1. Project changes
PRELIMINARY DRAFT FOR DISCUSSION PURPOSES
 Memorandum To: David Thompson From: John Haapala CC: Dan McDonald Bob Montgomery Date: February 24, 2003 File #: 1003551 Re: Lake Wenatchee Historic Water Levels, Operation Model, and Flood Operation This
A Report on a Statistical Model to Forecast Seasonal Inflows to Cowichan Lake
 A Report on a Statistical Model to Forecast Seasonal Inflows to Cowichan Lake Prepared by: Allan Chapman, MSc, PGeo Hydrologist, Chapman Geoscience Ltd., and Former Head, BC River Forecast Centre Victoria
Climate also has a large influence on how local ecosystems have evolved and how we interact with them.
 The Mississippi River in a Changing Climate By Paul Lehman, P.Eng., General Manager Mississippi Valley Conservation (This article originally appeared in the Mississippi Lakes Association s 212 Mississippi
4. THE HBV MODEL APPLICATION TO THE KASARI CATCHMENT
 Application of HBV model to the Kasari River, 1994 Page 1 of 6 Application of the HBV model to the Kasari river for flow modulation of catchments characterised by specific underlying features by R. Vedom,
HYDROLOGIC AND WATER RESOURCES EVALUATIONS FOR SG. LUI WATERSHED
 HYDROLOGIC AND WATER RESOURCES EVALUATIONS FOR SG. LUI WATERSHED 1.0 Introduction The Sg. Lui watershed is the upper part of Langat River Basin, in the state of Selangor which located approximately 20
Lake Tahoe Watershed Model. Lessons Learned through the Model Development Process
 Lake Tahoe Watershed Model Lessons Learned through the Model Development Process Presentation Outline Discussion of Project Objectives Model Configuration/Special Considerations Data and Research Integration
2015 Fall Conditions Report
 2015 Fall Conditions Report Prepared by: Hydrologic Forecast Centre Date: December 21 st, 2015 Table of Contents Table of Figures... ii EXECUTIVE SUMMARY... 1 BACKGROUND... 2 SUMMER AND FALL PRECIPITATION...
The elevations on the interior plateau generally vary between 300 and 650 meters with
 11 2. HYDROLOGICAL SETTING 2.1 Physical Features and Relief Labrador is bounded in the east by the Labrador Sea (Atlantic Ocean), in the west by the watershed divide, and in the south, for the most part,
Climatic and Ecological Conditions in the Klamath Basin of Southern Oregon and Northern California: Projections for the Future
 Climatic and Ecological Conditions in the Klamath Basin of Southern Oregon and Northern California: Projections for the Future A Collaborative Effort by: CLIMATE LEADERSHIP INITIATIVE INSTITUTE FOR A SUSTAINABLE
REDWOOD VALLEY SUBAREA
 Independent Science Review Panel Conceptual Model of Watershed Hydrology, Surface Water and Groundwater Interactions and Stream Ecology for the Russian River Watershed Appendices A-1 APPENDIX A A-2 REDWOOD
APPLICATIONS OF DOWNSCALING: HYDROLOGY AND WATER RESOURCES EXAMPLES
 APPLICATIONS OF DOWNSCALING: HYDROLOGY AND WATER RESOURCES EXAMPLES Dennis P. Lettenmaier Department of Civil and Environmental Engineering For presentation at Workshop on Regional Climate Research NCAR
Climate Change Impact Assessment on Long Term Water Budget for Maitland Catchment in Southern Ontario
 215 SWAT CONFERENCE, PURDUE Climate Change Impact Assessment on Long Term Water Budget for Maitland Catchment in Southern Ontario By Vinod Chilkoti Aakash Bagchi Tirupati Bolisetti Ram Balachandar Contents
Water Supply Conditions and Outlook June 4, 2018
 Water Supply Conditions and Outlook June 4, 2018 Flow Forecasting & Operations Planning Water Security Agency Overview Water supply conditions across Saskatchewan are generally good with most reservoir
3.0 TECHNICAL FEASIBILITY
 3.0 TECHNICAL FEASIBILITY 3.1 INTRODUCTION To enable seasonal storage and release of water from Lake Wenatchee, an impoundment structure would need to be constructed on the lake outlet channel. The structure
2. PHYSICAL SETTING FINAL GROUNDWATER MANAGEMENT PLAN. 2.1 Topography. 2.2 Climate
 FINAL GROUNDWATER MANAGEMENT PLAN 2. PHYSICAL SETTING Lassen County is a topographically diverse area at the confluence of the Cascade Range, Modoc Plateau, Sierra Nevada and Basin and Range geologic provinces.
Geostatistical Analysis of Rainfall Temperature and Evaporation Data of Owerri for Ten Years
 Atmospheric and Climate Sciences, 2012, 2, 196-205 http://dx.doi.org/10.4236/acs.2012.22020 Published Online April 2012 (http://www.scirp.org/journal/acs) Geostatistical Analysis of Rainfall Temperature
GLACIER AND SNOWMELT MODELLING USING SWAT: GANGA BASIN CASE STUDY. INRM Consultants Pvt. Ltd.
 GLACIER AND SNOWMELT MODELLING USING SWAT: GANGA BASIN CASE STUDY INRM Consultants Pvt. Ltd. Introduction Snowmelt Runoff contribution in the Himalayan Rivers Estimation of Average contribution of Snowmelt
RELATIVE IMPORTANCE OF GLACIER CONTRIBUTIONS TO STREAMFLOW IN A CHANGING CLIMATE
 Proceedings of the Second IASTED International Conference WATER RESOURCE MANAGEMENT August 20-22, 2007, Honolulu, Hawaii, USA ISGN Hardcopy: 978-0-88986-679-9 CD: 978-0-88-986-680-5 RELATIVE IMPORTANCE
Water Yield and Precipitation Inputs for ECA-AB Analysis Grand Prairie Forest Management Area Weyerhaeuser Canada Ltd.
 Water Yield and Precipitation Inputs for ECA-AB Analysis Grand Prairie Forest Management Area Weyerhaeuser Canada Ltd. Prepared by Watertight Solutions August 30, 2007 Introduction The objective of this
TABLE OF CONTENTS. 3.1 Synoptic Patterns Precipitation and Topography Precipitation Regionalization... 11
 TABLE OF CONTENTS ABSTRACT... iii 1 INTRODUCTION... 1 2 DATA SOURCES AND METHODS... 2 2.1 Data Sources... 2 2.2 Frequency Analysis... 2 2.2.1 Precipitation... 2 2.2.2 Streamflow... 2 2.3 Calculation of
Regional Climate Change: Current Impacts and Perspectives Greater Lake Nipissing Stewardship Council Annual Meeting Wednesday April 16, 2014
 Regional Climate Change: Current Impacts and Perspectives Greater Lake Nipissing Stewardship Council Annual Meeting Wednesday April 16, 2014 Speaker: Peter Bullock, Stantec Consulting Information Source:
HYDROLOGICAL MODELING OF HIGHLY GLACIERIZED RIVER BASINS. Nina Omani, Raghavan Srinivasan, Patricia Smith, Raghupathy Karthikeyan, Gerald North
 HYDROLOGICAL MODELING OF HIGHLY GLACIERIZED RIVER BASINS Nina Omani, Raghavan Srinivasan, Patricia Smith, Raghupathy Karthikeyan, Gerald North Problem statement Glaciers help to keep the earth cool High
A SURVEY OF HYDROCLIMATE, FLOODING, AND RUNOFF IN THE RED RIVER BASIN PRIOR TO 1870
 A SURVEY OF HYDROCLIMATE, FLOODING, AND RUNOFF IN THE RED RIVER BASIN PRIOR TO 1870 W. F. RANNIE (UNIVERSITY OF WINNIPEG) Prepared for the Geological Survey of Canada September, 1998 TABLE OF CONTENTS
9. PROBABLE MAXIMUM PRECIPITATION AND PROBABLE MAXIMUM FLOOD
 9. PROBABLE MAXIMUM PRECIPITATION AND PROBABLE MAXIMUM FLOOD 9.1. Introduction Due to the size of Watana Dam and the economic importance of the Project to the Railbelt, the Probable Maximum Flood (PMF)
Study of Hydrometeorology in a Hard Rock Terrain, Kadirischist Belt Area, Anantapur District, Andhra Pradesh
 Open Journal of Geology, 2012, 2, 294-300 http://dx.doi.org/10.4236/ojg.2012.24028 Published Online October 2012 (http://www.scirp.org/journal/ojg) Study of Hydrometeorology in a Hard Rock Terrain, Kadirischist
Fenhe (Fen He) Map of River. Table of Basic Data. China 10
 Map of River. Table of Basic Data. China 10") Fenhe (Fen He) Map of River Table of Basic Data Name(s): Fenhe (in Huanghe River) Location: Shanxi Province, Northern China Area: 39,471 km 2 Origin: Mt. Guancen (2,147 m) Outlet: Huanghe Serial No. :
Fenhe (Fen He) Map of River Table of Basic Data Name(s): Fenhe (in Huanghe River) Location: Shanxi Province, Northern China Area: 39,471 km 2 Origin: Mt. Guancen (2,147 m) Outlet: Huanghe Serial No. :
Disentangling Impacts of Climate & Land Use Changes on the Quantity & Quality of River Flows in Southern Ontario
 Disentangling Impacts of Climate & Land Use Changes on the Quantity & Quality of River Flows in Southern Ontario by Trevor Dickinson & Ramesh Rudra, Water Resources Engineering University of Guelph Acknowledgements
Impacts of climate change on flooding in the river Meuse
 Impacts of climate change on flooding in the river Meuse Martijn Booij University of Twente,, The Netherlands m.j.booij booij@utwente.nlnl 2003 in the Meuse basin Model appropriateness Appropriate model
Preliminary Runoff Outlook February 2018
 Preliminary Runoff Outlook February 2018 Prepared by: Flow Forecasting & Operations Planning Water Security Agency General Overview The Water Security Agency (WSA) is preparing for 2018 spring runoff including
University of Florida Department of Geography GEO 3280 Assignment 3
 G E O 3 2 8 A s s i g n m e n t # 3 Page 1 University of Florida Department of Geography GEO 328 Assignment 3 Modeling Precipitation and Elevation Solar Radiation Precipitation Evapo- Transpiration Vegetation
Lower Tuolumne River Accretion (La Grange to Modesto) Estimated daily flows ( ) for the Operations Model Don Pedro Project Relicensing
 Estimated daily flows ( ) for the Operations Model Don Pedro Project Relicensing") Lower Tuolumne River Accretion (La Grange to Modesto) Estimated daily flows (1970-2010) for the Operations Model Don Pedro Project Relicensing 1.0 Objective Using available data, develop a daily time series
Lower Tuolumne River Accretion (La Grange to Modesto) Estimated daily flows (1970-2010) for the Operations Model Don Pedro Project Relicensing 1.0 Objective Using available data, develop a daily time series
CLIMATE RESILIENCE FOR ALBERTA MUNICIPALITIES CLIMATE PROJECTIONS NORTHERN ALBERTA. Dr. Mel Reasoner Reasoner Environmental Consulting
 CLIMATE RESILIENCE FOR ALBERTA MUNICIPALITIES CLIMATE PROJECTIONS NORTHERN ALBERTA Dr. Mel Reasoner Reasoner Environmental Consulting Probability of occurrence Increase in Mean Temperature & Variance Less
The Climate of Oregon Climate Zone 4 Northern Cascades
 /05 E55 Unbound issue No. 9/ is Does not circulate Special Report 916 May 1993 The Climate of Oregon Climate Zone 4 Property of OREGON STATE UNIVERSITY Library Serials Corvallis, OR 97331-4503 Agricultural
Missouri River Basin Water Management
 Missouri River Basin Water Management US Army Corps of Engineers Missouri River Navigator s Meeting February 12, 2014 Bill Doan, P.E. Missouri River Basin Water Management US Army Corps of Engineers BUILDING
Snowcover interaction with climate, topography & vegetation in mountain catchments
 Snowcover interaction with climate, topography & vegetation in mountain catchments DANNY MARKS Northwest Watershed Research Center USDA-Agricultural Agricultural Research Service Boise, Idaho USA RCEW
Supplementary Materials for
 advances.sciencemag.org/cgi/content/full/3/12/e1701169/dc1 Supplementary Materials for Abrupt shift in the observed runoff from the southwestern Greenland ice sheet Andreas P. Ahlstrøm, Dorthe Petersen,
HyMet Company. Streamflow and Energy Generation Forecasting Model Columbia River Basin
 HyMet Company Streamflow and Energy Generation Forecasting Model Columbia River Basin HyMet Inc. Courthouse Square 19001 Vashon Hwy SW Suite 201 Vashon Island, WA 98070 Phone: 206-463-1610 Columbia River
What is the difference between Weather and Climate?
 What is the difference between Weather and Climate? Objective Many people are confused about the difference between weather and climate. This makes understanding the difference between weather forecasts
Rong Jiang. Map of River. Table of Basic Data. China 14. Serial No. : China-14
 Rong Jiang Map of River Table of Basic Data Name(s): Rong Jiang Location: Guangdong Province, Coastways China Area: 4,408 km 2 Serial No. : China-14 N 23 11' ~ 23 55' E 115 37' ~ 116 38' Length of the
Colorado s 2003 Moisture Outlook
 Colorado s 2003 Moisture Outlook Nolan Doesken and Roger Pielke, Sr. Colorado Climate Center Prepared by Tara Green and Odie Bliss http://climate.atmos.colostate.edu How we got into this drought! Fort
Climate Change Impact Assessment on Indian Water Resources. Ashvin Gosain, Sandhya Rao, Debajit Basu Ray
 Climate Change Impact Assessment on Indian Water Resources Ashvin Gosain, Sandhya Rao, Debajit Basu Ray Objectives of the Study To quantify the impact of the climate change on the water resources of the
Typical Hydrologic Period Report (Final)
") (DELCORA) (Final) November 2015 (Updated April 2016) CSO Long-Term Control Plant Update REVISION CONTROL REV. NO. DATE ISSUED PREPARED BY DESCRIPTION OF CHANGES 1 4/26/16 Greeley and Hansen Pg. 1-3,
(DELCORA) (Final) November 2015 (Updated April 2016) CSO Long-Term Control Plant Update REVISION CONTROL REV. NO. DATE ISSUED PREPARED BY DESCRIPTION OF CHANGES 1 4/26/16 Greeley and Hansen Pg. 1-3,
2003 Moisture Outlook
 2003 Moisture Outlook Nolan Doesken and Roger Pielke, Sr. Colorado Climate Center Prepared by Tara Green and Odie Bliss http://climate.atmos.colostate.edu Through 1999 Through 1999 Fort Collins Total Water
COUPLING A DISTRIBUTED HYDROLOGICAL MODEL TO REGIONAL CLIMATE MODEL OUTPUT: AN EVALUATION OF EXPERIMENTS FOR THE RHINE BASIN IN EUROPE
 P.1 COUPLING A DISTRIBUTED HYDROLOGICAL MODEL TO REGIONAL CLIMATE MODEL OUTPUT: AN EVALUATION OF EXPERIMENTS FOR THE RHINE BASIN IN EUROPE Jan Kleinn*, Christoph Frei, Joachim Gurtz, Pier Luigi Vidale,
2003 Water Year Wrap-Up and Look Ahead
 2003 Water Year Wrap-Up and Look Ahead Nolan Doesken Colorado Climate Center Prepared by Odie Bliss http://ccc.atmos.colostate.edu Colorado Average Annual Precipitation Map South Platte Average Precipitation
Inter-linkage case study in Pakistan
 7 th GEOSS Asia Pacific Symposium GEOSS AWCI Parallel Session: 26-28 May, 2014, Tokyo, Japan Inter-linkage case study in Pakistan Snow and glaciermelt runoff modeling in Upper Indus Basin of Pakistan Maheswor
Climatic Change Implications for Hydrologic Systems in the Sierra Nevada
 Climatic Change Implications for Hydrologic Systems in the Sierra Nevada Part Two: The HSPF Model: Basis For Watershed Yield Calculator Part two presents an an overview of why the hydrologic yield calculator
Weather and Climate of the Rogue Valley By Gregory V. Jones, Ph.D., Southern Oregon University
 Weather and Climate of the Rogue Valley By Gregory V. Jones, Ph.D., Southern Oregon University The Rogue Valley region is one of many intermountain valley areas along the west coast of the United States.
Hydrologic Forecast Centre Manitoba Infrastructure, Winnipeg, Manitoba. MARCH OUTLOOK REPORT FOR MANITOBA March 23, 2018
 Page 1 of 21 Hydrologic Forecast Centre Manitoba Infrastructure, Winnipeg, Manitoba MARCH OUTLOOK REPORT FOR MANITOBA March 23, 2018 Overview The March Outlook Report prepared by the Hydrologic Forecast
Hydro-meteorological Analysis of Langtang Khola Catchment, Nepal
 Hydro-meteorological Analysis of Langtang Khola Catchment, Nepal Tirtha R. Adhikari 1, Lochan P. Devkota 1, Suresh.C Pradhan 2, Pradeep K. Mool 3 1 Central Department of Hydrology and Meteorology Tribhuvan
A Review of the 2007 Water Year in Colorado
 A Review of the 2007 Water Year in Colorado Nolan Doesken Colorado Climate Center, CSU Mike Gillespie Snow Survey Division, USDA, NRCS Presented at the 28 th Annual AGU Hydrology Days, March 26, 2008,
Presentation Overview. Southwestern Climate: Past, present and future. Global Energy Balance. What is climate?
 Southwestern Climate: Past, present and future Mike Crimmins Climate Science Extension Specialist Dept. of Soil, Water, & Env. Science & Arizona Cooperative Extension The University of Arizona Presentation
Three main areas of work:
 Task 2: Climate Information 1 Task 2: Climate Information Three main areas of work: Collect historical and projected weather and climate data Conduct storm surge and wave modeling, sea-level rise (SLR)
The relationship between catchment characteristics and the parameters of a conceptual runoff model: a study in the south of Sweden
 FRIEND: Flow Regimes from International Experimental and Network Data (Proceedings of the Braunschweie _ Conference, October 1993). IAHS Publ. no. 221, 1994. 475 The relationship between catchment characteristics
YUKON SNOW SURVEY BULLETIN & WATER SUPPLY FORECAST May 1, 2008
 YUKON SNOW SURVEY BULLETIN & WATER SUPPLY FORECAST 1, 2008 Prepared and issued by: Water Resources Section Environmental Programs Branch Environment Yukon Yukon Snow Survey 2008 1 PREFACE The Yukon Snow
Weather History on the Bishop Paiute Reservation
 Weather History on the Bishop Paiute Reservation -211 For additional information contact Toni Richards, Air Quality Specialist 76 873 784 toni.richards@bishoppaiute.org Updated 2//214 3:14 PM Weather History
Drought in Southeast Colorado
 Drought in Southeast Colorado Nolan Doesken and Roger Pielke, Sr. Colorado Climate Center Prepared by Tara Green and Odie Bliss http://climate.atmos.colostate.edu 1 Historical Perspective on Drought Tourism
Northern Rockies Adaptation Partnership: Climate Projections
 Northern Rockies Adaptation Partnership: Climate Projections Contents Observed and Projected Climate for the NRAP Region... 2 Observed and Projected Climate for the NRAP Central Subregion... 8 Observed
Global Climates. Name Date
 Global Climates Name Date No investigation of the atmosphere is complete without examining the global distribution of the major atmospheric elements and the impact that humans have on weather and climate.
Stream Discharge and the Water Budget
 Regents Earth Science Unit 6: Water Cycle & Climate Name: Lab # Stream Discharge and the Water Budget Introduction: The United States Geological Survey (USGS) measures and publishes values for the daily
NIDIS Intermountain West Regional Drought Early Warning System February 7, 2017
 NIDIS Drought and Water Assessment NIDIS Intermountain West Regional Drought Early Warning System February 7, 2017 Precipitation The images above use daily precipitation statistics from NWS COOP, CoCoRaHS,
ESTIMATING SNOWMELT CONTRIBUTION FROM THE GANGOTRI GLACIER CATCHMENT INTO THE BHAGIRATHI RIVER, INDIA ABSTRACT INTRODUCTION
 ESTIMATING SNOWMELT CONTRIBUTION FROM THE GANGOTRI GLACIER CATCHMENT INTO THE BHAGIRATHI RIVER, INDIA Rodney M. Chai 1, Leigh A. Stearns 2, C. J. van der Veen 1 ABSTRACT The Bhagirathi River emerges from
Appendix A Calibration Memos
 Appendix A Calibration Memos University of Washington Department of Civil and Environmental Engineering TO: Joe Dvorak FROM: Margaret Hahn and Richard Palmer RE: DVSVM Calibration DATE: June 28, 21 This
Water Management for Environmental Restoration Flows In the Big Bend reach, Rio Grande Rio Bravo
 University of California, Davis Department of Land, Air and Water Resources Water Management for Environmental Restoration Flows In the Big Bend reach, Rio Grande Rio Bravo 46 th Annual Meeting 8 9 March,
Fire Season Prediction for Canada, Kerry Anderson Canadian Forest Service
 Fire Season Prediction for Canada, 2014 Kerry Anderson Canadian Forest Service 1 Introduction The Canadian Forest Service is now presenting monthly and seasonal forecast maps through the Canadian Wildland
Webinar and Weekly Summary February 15th, 2011
 Webinar and Weekly Summary February 15th, 2011 -Assessment of current water conditions - Precipitation Forecast - Recommendations for Drought Monitor Upper Colorado Normal Precipitation Upper Colorado
MARMOT CREEK BASIN: MANAGING FORESTS FOR WATER
 MARMOT CREEK BASIN: MANAGING FORESTS FOR WATER CABIN AND TWIN CREEK EXPERIMENTS 1962-1987 MARMOT CREEK SUBBASINS Subbasin Drainage Treatment Area (ha) (completion date) Cabin Creek 212 (50%)* Commercial
Climate Change RMJOC Study Summary
 Climate Change RMJOC Study Summary Erik Pytlak Weather and Streamflow Forecasting Bonneville Power Administration Portland, OR IPCC: International Panel on Climate Change Established by the United Nations
YUKON SNOW SURVEY BULLETIN & WATER SUPPLY FORECAST May 1, 2007
 YUKON SNOW SURVEY BULLETIN & WATER SUPPLY FORECAST 1, 2007 Prepared and issued by: Water Resources Section Environmental Programs Branch Environment Yukon Yukon Snow Survey 2007 1 PREFACE The Yukon Snow
Table 1 - Infiltration Rates
 Stantec Consulting Ltd. 100-300 Hagey Boulevard, Waterloo ON N2L 0A4 November 14, 2017 File: 161413228/10 Attention: Mr. Michael Witmer, BES, MPA, MCIP, RPP City of Guelph 1 Carden Street Guelph ON N1H
Tracking the Climate Of Northern Colorado Nolan Doesken State Climatologist Colorado Climate Center Colorado State University
 Tracking the Climate Of Northern Colorado Nolan Doesken State Climatologist Colorado Climate Center Colorado State University Northern Colorado Business Innovations November 20, 2013 Loveland, Colorado
NIDIS Intermountain West Drought Early Warning System April 18, 2017
 1 of 11 4/18/2017 3:42 PM Precipitation NIDIS Intermountain West Drought Early Warning System April 18, 2017 The images above use daily precipitation statistics from NWS COOP, CoCoRaHS, and CoAgMet stations.
The Climate of Payne County
 The Climate of Payne County Payne County is part of the Central Great Plains in the west, encompassing some of the best agricultural land in Oklahoma. Payne County is also part of the Crosstimbers in the
Workshop: Build a Basic HEC-HMS Model from Scratch
 Workshop: Build a Basic HEC-HMS Model from Scratch This workshop is designed to help new users of HEC-HMS learn how to apply the software. Not all the capabilities in HEC-HMS are demonstrated in the workshop
Direction and range of change expected in the future
 Direction and range of Air Temperature Over the past 30 years, air Across the greater PNW and temperature has been Columbia Basin, an ensemble increasing an average of forecast from ten of the best 0.13
NIDIS Intermountain West Drought Early Warning System February 12, 2019
 NIDIS Intermountain West Drought Early Warning System February 12, 2019 Precipitation The images above use daily precipitation statistics from NWS COOP, CoCoRaHS, and CoAgMet stations. From top to bottom,
12 SWAT USER S MANUAL, VERSION 98.1
 12 SWAT USER S MANUAL, VERSION 98.1 CANOPY STORAGE. Canopy storage is the water intercepted by vegetative surfaces (the canopy) where it is held and made available for evaporation. When using the curve
January 25, Summary
 January 25, 2013 Summary Precipitation since the December 17, 2012, Drought Update has been slightly below average in parts of central and northern Illinois and above average in southern Illinois. Soil
YUKON SNOW SURVEY BULLETIN & WATER SUPPLY FORECAST May 1, Prepared and issued by: Water Resources Branch Environment Yukon
 YUKON SNOW SURVEY BULLETIN & WATER SUPPLY FORECAST 1, 215 Prepared and issued by: Water Resources Branch Environment Yukon PREFACE The Yukon Snow Survey Bulletin and Water Supply Forecast is prepared and
Supplementary appendix
 Supplementary appendix This appendix formed part of the original submission and has been peer reviewed. We post it as supplied by the authors. Supplement to: Lowe R, Stewart-Ibarra AM, Petrova D, et al.
THE STATE OF SURFACE WATER GAUGING IN THE NAVAJO NATION
 THE STATE OF SURFACE WATER GAUGING IN THE NAVAJO NATION Aregai Tecle Professor of Hydrology Northern Arizona University Flagstaff, AZ Acknowledgement Many thanks to my research team mates and Elisabeth
FORM A GEOGRAPHY 1114 LABORATORY FINAL EXAM Teaching Assistant SAMPLE Lab Meeting. Place all answers on the answer sheet; 2 points per question
 FORM A GEOGRAPHY 1114 NAME LABORATORY FINAL EXAM Teaching Assistant SAMPLE Lab Meeting Place all answers on the answer sheet; 2 points per question FORMULAS PPT = (PET-D) + S ± = Δ SOIL G = V H Q = V A
DROUGHT IN MAINLAND PORTUGAL
 DROUGHT IN MAINLAND Ministério da Ciência, Tecnologia e Ensino Superior Instituto de Meteorologia, I. P. Rua C Aeroporto de Lisboa Tel.: (351) 21 844 7000 e-mail:informacoes@meteo.pt 1749-077 Lisboa Portugal
The Climate of Seminole County
 The Climate of Seminole County Seminole County is part of the Crosstimbers. This region is a transition region from the Central Great Plains to the more irregular terrain of southeastern Oklahoma. Average
The Colorado Drought : 2003: A Growing Concern. Roger Pielke, Sr. Colorado Climate Center.
 The Colorado Drought 2001-2003: 2003: A Growing Concern Roger Pielke, Sr. Colorado Climate Center Prepared by Tara Green and Odie Bliss http://climate.atmos.colostate.edu 2 2002 Drought History in Colorado
Flood Inundation Mapping under different climate change scenarios in the upper Indus River Basin, Pakistan
 Flood Inundation Mapping under different climate change scenarios in the upper Indus River Basin, Pakistan Sohaib Baig (doctoral student) 16 November 2017 Disaster Prevention Research Institute 1 Kyoto
Laboratory Exercise #3 The Hydrologic Cycle and Running Water Processes
 Laboratory Exercise #3 The Hydrologic Cycle and Running Water Processes page - 1 Section A - The Hydrologic Cycle Figure 1 illustrates the hydrologic cycle which quantifies how water is cycled throughout
HAIDA GWAII CLIMATE ASSESSMENT 2010 Special Report for MIEDS Franc Pridoehl
 HAIDA GWAII CLIMATE ASSESSMENT 2010 Special Report for MIEDS Franc Pridoehl INTRODUCTION Climatic conditions have varied considerably on Haida Gwaii over the past centuries and millennia (Hebda 2007).
2016 Meteorology Summary
 2016 Meteorology Summary New Jersey Department of Environmental Protection AIR POLLUTION AND METEOROLOGY Meteorology plays an important role in the distribution of pollution throughout the troposphere,
Hydrologic Forecast Centre Manitoba Infrastructure, Winnipeg, Manitoba. FEBRUARY OUTLOOK REPORT FOR MANITOBA February 23, 2018
 Page 1 of 17 Hydrologic Forecast Centre Manitoba Infrastructure, Winnipeg, Manitoba FEBRUARY OUTLOOK REPORT FOR MANITOBA February 23, 2018 Overview The February Outlook Report prepared by the Hydrologic
Drought Monitoring with Hydrological Modelling
 st Joint EARS/JRC International Drought Workshop, Ljubljana,.-5. September 009 Drought Monitoring with Hydrological Modelling Stefan Niemeyer IES - Institute for Environment and Sustainability Ispra -
CoCoRaHS Monitoring Colorado s s Water Resources through Community Collaborations
 CoCoRaHS Monitoring Colorado s s Water Resources through Community Collaborations Nolan Doesken Colorado Climate Center Atmospheric Science Department Colorado State University Presented at Sustaining
Hydrologic Response of SWAT to Single Site and Multi- Site Daily Rainfall Generation Models
 Hydrologic Response of SWAT to Single Site and Multi- Site Daily Rainfall Generation Models 1 Watson, B.M., 2 R. Srikanthan, 1 S. Selvalingam, and 1 M. Ghafouri 1 School of Engineering and Technology,
Regents Earth Science Unit 7: Water Cycle and Climate
 Regents Earth Science Unit 7: Water Cycle and Climate Name Section Coastal and Continental Temperature Ranges Lab # Introduction: There are large variations in average monthly temperatures among cities
YUKON SNOW SURVEY BULLETIN & WATER SUPPLY FORECAST May 1, Prepared and issued by: Water Resources Branch Environment Yukon
 YUKON SNOW SURVEY BULLETIN & WATER SUPPLY FORECAST 1, 213 Prepared and issued by: Water Resources Branch Environment Yukon PREFACE The Yukon Snow Survey Bulletin and Water Supply Forecast is prepared and
Technical Note: Hydrology of the Lake Chilwa wetland, Malawi
 Technical Note: Hydrology of the Lake Chilwa wetland, Malawi Matthew McCartney June 27 Description Lake Chilwa is located in the Southern region of Malawi on the country s eastern boarder with Mozambique