WATER BODIES V2 ALGORITHM
|
|
|
- Neal Parrish
- 5 years ago
- Views:
Transcription

1 26/03/2015 WATER BODIES V2 ALGORITHM USING PROBA-V 10 day mean composites multispectral data


2 Water Bodies V2 PROBA-V µ-satellite, gap filler SPOT <-> Sentinel PROBA-V S1-TOC synthesis products - full daily coverage: Lat. 35 N and 75 N Lat. 35 S and 56 S - full coverage every 2days at the equator - spectral bands: - S1 TOC data at 1km spatial resolution (atmospheric correction: SMAC 4.0) (Berthelot and Dedieu, 1998) Spectral band Wavelength (µm) BLUE RED NIR SWIR /03/2015 2
3 Water Body Detection Algorithm (WBDA) General overview Input data 10 PROBA-V S1-TOC PROBA-V S1-TOC 1 MEAN COMPOSITE MC10 MC10 Status Map 2 COLOR TRANSFORM Hue/Value WB Potential (GLSDEM) 3 WB DETECTION Water Bodies Permanent Glaciers WBs history <dekad N-x - N> Volcanic Soils WB OCCURRENCE Main processing steps: mean compositing color transformation water body detection water body occurrence calculation 4 Quality Layer 26/03/2015 3
 MC10 status map Bit Name Description 1-3 Observation 000: clear 010: undefined 011: cloud 100: snow / ice 4 Land/sea mask 0: sea 1: land 5 Mean composite SWIR quality flag 0: bad mean")
4 Processing step 1: Mean Compositing Input data 10 PROBA-V S1-TOC PROBA-V S1-TOC MC10 Status Map 1 MEAN COMPOSITE MC10 10-days mean compositing averaging the valid reflectances Ref. Vancutsem et al. (2007) MC10 status map Bit Name Description 1-3 Observation 000: clear 010: undefined 011: cloud 100: snow / ice 4 Land/sea mask 0: sea 1: land 5 Mean composite SWIR quality flag 0: bad mean composite 1: good mean composite 6 Mean composite NIR quality flag 0: bad mean composite 1: good mean composite 7 Mean composite RED quality flag 0: bad mean composite 1: good mean composite 8 (Most significant) Mean composite BLUE quality flag 0: bad mean composite 1: good mean composite 01 Dec /03/2015 4
5 WB detection - Input data Input data 10 PROBA-V PROBA-V S1-TOC MC10 Status Map WB Potential (GLSDEM) Permanent Glaciers Volcanic Soils Water body potential mask - Global Land Survey Digital Elevation Model (GLSDEM) Ref.: USGS (2008), GLSDEM, 90m scene GLSDEM_p123r024_utmz13, Global Land Cover Facility, University of Maryland, College Park, Maryland. ( Permanent glacier mask - National Snow and Ice Data Centre (NSIDC) Ref.: GLIMS and NSIDC (2005, updated 2014): Global Land Ice Measurements from Space glacier database. Compiled and made available by the international GLIMS community and the National Snow and Ice Data Center, Boulder CO, U.S.A. DOI: /N5V ( Downloaded as shape and rasterized to the PROBA-V 1 km world size. Volcanic soil mask - The Holocene Volcano List Ref.: Smithsonian Institution, National Museum of natural History, Global Volcanism Program. ( Delineated on Google Earth and rasterized to the PROBA-V 1 km world size. 26/03/2015 5
 GLSDEM ( 90 m; 1 m) b) detected lowest")
6 Input data Constructing the WB potential mask 1. Search for the lowest points in the terrain Pixel elevation elevation of its eight neighbors a) GLSDEM ( 90 m; 1 m) b) detected lowest points Detected pixels with 8 neighbors of equal elevation Level 1 otherwise Level 2 26/03/2015 6


7 Input data Constructing the WB potential mask 2. Filtering and expanding the detected lowest points - an imaginary water level is raised in steps of 1m - the maximum rise of 5m is reached - minimum size is 9 pixels - Added pixels Level 2 26/03/2015 7

8 Input data Constructing the WB potential mask 3. Deriving the 1 km WBPM from the 90 m potential WBs Set the WBPM pixel when: - at least one of the corresponding pixels has Level 1 - minimum 9 of corresponding pixels have Level 2 26/03/2015 8

9 Processing step 2: HSV color transform 10 PROBA-V PROBA-V S1-TOC 1 MEAN COMPOSITE MC10 MC10 Status Map 2 COLOR TRANSFORM Hue/Value WB Potential (GLSDEM) 3 WB DETECTION Detected WBs Permanent Glaciers WBs history <dekad N-x - N> Volcanic Soils 4 WB OCCURRENCE Quality Layer Red NIR SWIR HUE Saturation VALUE dominant wavelength the degree of purity of the color brightness approximation use HUE and VALUE for WB detection Ref. Pekel et al. (2014) 26/03/2015 9
10 Processing step 3: Water Body detection 10 PROBA-V PROBA-V S1-TOC 1 MEAN COMPOSITE MC10 MC10 Status Map 2 COLOR TRANSFORM Hue/Value WB Potential (GLSDEM) 3 WB DETECTION Detected WBs Permanent Glaciers WBs history <dekad N-x - N> Volcanic Soils 4 WB Quality Layer OCCURRENCE Defining the thresholds on HUE and VALUE - Empirically & Iteratively 26/03/


11 Water Body detection The Ethiopian Rift Valley One of the focus areas for developing the WBDA Some typical values for HUE and VALUE Dekad : SWIR, NIR & Red RGB channels 26/03/

12 Water Body detection Defining the thresholds Lake Basaka Lake Koka Lake near Asendabo Lake Abijato Lake Awasa Lake Ziway Lake Langano Lake Shala Lake North of Denfo Lake Abaya Lake Chamo Dekad : SWIR, NIR & Red RGB channels 2D scatter plot: HUE - VALUE 26/03/

13 Water Body detection Defining the thresholds Lake Basaka Lake Koka Lake near Asendabo Lake Abijato Lake Awasa Lake Ziway Lake Langano Lake Shala Lake North of Denfo Lake Abaya Lake Chamo Dekad : SWIR, NIR & Red RGB channels 2D scatter plot: HUE - VALUE 26/03/
14 Water Body detection Defining the thresholds 20 lakes are detected Further refining the thresholds considerably increased the commission errors Lake Basaka Lake Koka HUE 130 Lake near Asendabo Lake Abijato Lake Awasa Lake Ziway Lake Langano Lake Shala Lake North of Denfo Lake Abaya VALUE 0.08 Lake Chamo Dekad : SWIR, NIR & Red RGB channels 2D scatter plot: HUE - VALUE 26/03/


15 Water Body detection Decision Tree Classification Refined thresholds /03/


16 Water Body detection Decision Tree Classification result In total 32 WBs were detected on dekad 21 Oct WBs were detected using the rough thresholds 12 WBs were detected using the refined thresholds Dekad : SWIR, NIR & Red RGB channels DTC result 26/03/
17 Water Body Occurrence estimation 10 PROBA-V PROBA-V S1-TOC 1 MEAN COMPOSITE MC10 MC10 Status Map 2 COLOR TRANSFORM Hue/Value WB Potential (GLSDEM) 3 WB DETECTION Detected WBs Permanent Glaciers WBs history <dekad N-x - N> Volcanic Soils 4 WB OCCURRENCE Quality Layer To qualify the occurrence of the detected water bodies 26/03/
18 Water Body Occurrence estimation Deriving the General WB Occurrence using per pixel temporal-sequential statistics: - Total number of temporal cloud free observations (ntobs)* - Total number of temporal WB detections (ntwbs) - Maximum number of continuous temporal WB detections (mctwbs) General Water Body Occurrence * Max 64 dekads WWWW ffffffffffffffffff = nnnnnnnnnn nnnnnnnnnn mctwbs (absolute number) L M H α VH WBf (%) GWBO - Permanent - Very High - High - Medium - Low - Very Low VH 26/03/

19 Water Body Occurrence estimation WB Occurrence MC10_ Lake Wedecha K'oftu Chilotes Guda a b a b a Chelekleka b Hora Bishoftu a b From MC10_ (1) till MC10_ (31) Dekads Very High Very High Very Low Very High High Very High Very High Very High Very High Very High Very High Budamada a Very Low False det. b Very Low No detection Water body detected Cloudy Occurrence 26/03/


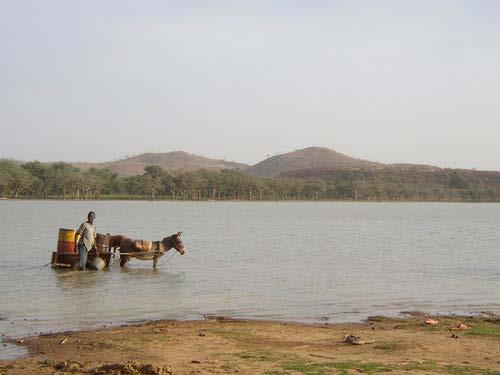


20 Water Body The Sahel test area MC10_ /03/


21 1200 Sahel - WB Occurrence Number of pixels Permanent Very High High Medium Low Very Low Decision Tree Classification Dekads Water Body Occurrence 26/03/
22 Water Body Detection Conclusion Water body detection using HSV transformed Red NIR SWIR bands proved to be successful (MODIS, Pekel 2014). Applying the adapted WBDA to PROBA-V 1km revealed successful WB detection. Applying the Water Body Potential Mask considerable decreased the commission errors. The Water Body Occurrence reflects the history of the WBs and therefore adds additional information to the product. Water Body Detection Upcoming Adapting the WBDA for historical SPOT-VGT processing ( ) Adapting the WBDA for PROBA-V 300m & 100m processing 26/03/


23 Questions? MC10_ /03/
24 26/03/
25 Water Body A first Quality Assessment Detailed observations of detected WBs on 7 areas selected worldwide Validation using Google Earth (not always possible) Top - Left Id Name Lat Lon Remark / Observations 1 Sahel Detected WBs show a good correlation with the rain season 2 South Africa Several WBs could not be validated (mining, salt planes?) 3 India Confusion with dark soils (not in the VSM) 4 China Confusion with dark industrial areas, large cities SZA! 5 Argentina Confusion with salt planes & desert flooded Yes/No? 6 Canada Confusion with dense dark vegetation SZA & NDVI! 7 Poland Small WBs masked due to adjacency with vegetation A full quality assessment will be done according the Service Validation Plan [GIOGL1-SVP], for the year /03/
Copernicus Global Land Operations Cryosphere and Water
 Date Issued: 10.10.1017 Copernicus Global Land Operations Cryosphere and Water CGLOPS-2 Framework Service Contract N 199496 (JRC) QUALITY ASSESSMENT REPORT WATER BODIES COLLECTION 300M VERSION 1 Issue
The LSA-SAF Albedo products
 The LSA-SAF Albedo products G. Jacob, D. Carrer & J.-L. Roujean CNRM-GAME, Météo France, Toulouse 2 Outline Method for retrieval Theoretical Framework Available Input BRDF Inversion Algorithm overview
ECNU WORKSHOP LAB ONE 2011/05/25)
") ECNU WORKSHOP LAB ONE (Liam.Gumley@ssec.wisc.edu 2011/05/25) The objective of this laboratory exercise is to become familiar with the characteristics of MODIS Level 1B 1000 meter resolution data. After
ECNU WORKSHOP LAB ONE (Liam.Gumley@ssec.wisc.edu 2011/05/25) The objective of this laboratory exercise is to become familiar with the characteristics of MODIS Level 1B 1000 meter resolution data. After
THE LAND-SAF SURFACE ALBEDO AND DOWNWELLING SHORTWAVE RADIATION FLUX PRODUCTS
 THE LAND-SAF SURFACE ALBEDO AND DOWNWELLING SHORTWAVE RADIATION FLUX PRODUCTS Bernhard Geiger, Dulce Lajas, Laurent Franchistéguy, Dominique Carrer, Jean-Louis Roujean, Siham Lanjeri, and Catherine Meurey
Methods review for the Global Land Cover 2000 initiative Presentation made by Frédéric Achard on November 30 th 2000
 Methods review for the Global Land Cover 2000 initiative Presentation made by Frédéric Achard on November 30 th 2000 1. Contents Objectives Specifications of the GLC-2000 exercise Strategy for the analysis
MODIS-derived Snow Metrics Algorithm
 MODIS-derived Snow Metrics Algorithm Version.0 Jiang Zhu, Chuck Lindsay. Geographic Information Network of Alaska, UAF. National Park Service, Anchorage April, 6, 05 Introduction The National Park Service
MODIS Snow Cover Mapping Decision Tree Technique: Snow and Cloud Discrimination
 67 th EASTERN SNOW CONFERENCE Jiminy Peak Mountain Resort, Hancock, MA, USA 2010 MODIS Snow Cover Mapping Decision Tree Technique: Snow and Cloud Discrimination GEORGE RIGGS 1, AND DOROTHY K. HALL 2 ABSTRACT
Director: Soroosh Sorooshian
 Director: Soroosh Sorooshian X. Gao B. Imam K. Hsu S. O Rourke D. Hohnbaum J. Li G.H. Park D. Braithwaite E. Pritchard B. Khakbaz W. Chu A. Behrangi Alex R. Sutlana Joey A. Zahraei Developing state-of-the-art
Data Quality and Uncertainty
 Data Quality and Uncertainty The power of GIS analysis is based on the assembly of layers of data, but as data layers increase, errors multiply - quality decreases. Garbage in, garbage out. High quality
REMOTELY SENSED INFORMATION FOR CROP MONITORING AND FOOD SECURITY
 LEARNING OBJECTIVES Lesson 4 Methods and Analysis 2: Rainfall and NDVI Seasonal Graphs At the end of the lesson, you will be able to: understand seasonal graphs for rainfall and NDVI; describe the concept
MONTHLY OPERATIONS REPORT
 LY OPERATIONS REPORT MOR#023 Reporting period from 6-Oct-205 to 5-Nov-205 Reference: PROBA-V_D5_MOR-023_205-_v.0 Author(s): Erwin Wolters, Dennis Clarijs, Sindy Sterckx, Alex Geboers Version:.0 Date: 8//205
In-flight Calibration Techniques Using Natural Targets. CNES Activities on Calibration of Space Sensors
 In-flight Calibration Techniques Using Natural Targets CNES Activities on Calibration of Space Sensors Bertrand Fougnie, Patrice Henry (DCT/SI, CNES, Toulouse, France) In-flight Calibration using Natural
VIIRS Radiometric Calibration for Reflective Solar Bands: Antarctic Dome C Site and Simultaneous Nadir Overpass Observations
 VIIRS Radiometric Calibration for Reflective Solar Bands: Antarctic Dome C Site and Simultaneous Nadir Overpass Observations Slawomir Blonski, * Changyong Cao, Sirish Uprety, ** and Xi Shao * NOAA NESDIS
Data Quality and Uncertainty. Accuracy, Precision, Data quality and Errors
 Data Quality and Uncertainty The power of GIS analysis is based on the assembly of layers of data, but as data layers increase, errors multiply (and quality decreases). Garbage in, garbage out. High quality
ESA-GLOBCOVER - A Global Land Cover Service at 300 m from ENVISAT MERIS Time Series
 October 15, 2008 (Jena Germany) ESA-GLOBCOVER - A Global Land Cover Service at 300 m from ENVISAT MERIS Time Series Defourny P.1, Bontemps S., Vancutsem C.1, Pekel J.F.1,, Vanbogaert E.1, Bicheron P.2,
Remote Sensing products and global datasets. Joint Research Centre, European Commission
 Remote Sensing products and global datasets Joint Research Centre, European Commission Setting the stage. Needs and requirements for integrated approach(es) for land degradation assessment. in Special
Introduction to Satellite Derived Vegetation Indices
 Introduction to the Use of Geospatial Information Technology for Drought Risk Management 13-17 November, 2017 Tonle Bassac II Restaurant, Phnom Penh, Cambodia Introduction to Satellite Derived Vegetation
Data Fusion and Multi-Resolution Data
 Data Fusion and Multi-Resolution Data Nature.com www.museevirtuel-virtualmuseum.ca www.srs.fs.usda.gov Meredith Gartner 3/7/14 Data fusion and multi-resolution data Dark and Bram MAUP and raster data Hilker
DAMAGE DETECTION OF THE 2008 SICHUAN, CHINA EARTHQUAKE FROM ALOS OPTICAL IMAGES
 DAMAGE DETECTION OF THE 2008 SICHUAN, CHINA EARTHQUAKE FROM ALOS OPTICAL IMAGES Wen Liu, Fumio Yamazaki Department of Urban Environment Systems, Graduate School of Engineering, Chiba University, 1-33,
Cloud screening and snow detection with MERIS. Rene Preusker, Jürgen Fischer, Carsten Brockmann, Marco Zühlke, Uwe krämer, Anja Hünerbein
 Cloud screening and snow detection with MERIS Rene Preusker, Jürgen Fischer, Carsten Brockmann, Marco Zühlke, Uwe krämer, Anja Hünerbein Prelude The following algorithm has been compiled in the frame of
Reduction of Cloud Obscuration in the MODIS Snow Data Product
 59th EASTERN SNOW CONFERENCE Stowe, Vermont USA 2002 Reduction of Cloud Obscuration in the MODIS Snow Data Product GEORGE RIGGS 1 AND DOROTHY K. HALL 2 ABSTRACT A challenging problem in snow mapping is
USE OF SATELLITE INFORMATION IN THE HUNGARIAN NOWCASTING SYSTEM
 USE OF SATELLITE INFORMATION IN THE HUNGARIAN NOWCASTING SYSTEM Mária Putsay, Zsófia Kocsis and Ildikó Szenyán Hungarian Meteorological Service, Kitaibel Pál u. 1, H-1024, Budapest, Hungary Abstract The
SAFNWC/MSG Dust flag.
 SAFNWC/MSG Dust flag. Dust Week 1-5 March 2010 Hervé LE GLEAU, Marcel DERRIEN Centre de météorologie Spatiale. Lannion Météo-France 1 Plan SAFNWC context Dust flag in SAFNWC/MSG Cma product Algorithm description
European Space Agency
 Guidelines - Guidelines how/when to interact during the WebEx session: - Due to the number of attendees, please keep always your webcam and microphone switched-off - You can use anytime the chat to all
An Approach to Estimate the Water Level and Volume of Dongting Lake by using Terra/MODIS Data
 National Institute for Environmental Studies, Japan An Approach to Estimate the Water Level and Volume of Dongting Lake by using Terra/MODIS Data 2002 Jan. Feb. Mar. Apr. May Jun. Jul. Aug. Sep. Oct. Nov.
PROBA-V CLOUD MASK VALIDATION
 Version: 1 Page 1 PROBA-V CLOUD MASK VALIDATION Validation Report Version 1.0 Kerstin Stelzer, Michael Paperin, Grit Kirches, Carsten Brockmann 25.04.2016 Version: 1 Page 2 Table of content Abbreviations
Remote Sensing of Snow GEOG 454 / 654
 Remote Sensing of Snow GEOG 454 / 654 What crysopheric questions can RS help to answer? 2 o Where is snow lying? (Snow-covered area or extent) o How much is there? o How rapidly is it melting? (Area, depth,
Software requirements * : Part III: 2 hrs.
 Title: Product Type: Developer: Target audience: Format: Software requirements * : Data: Estimated time to complete: Mapping snow cover using MODIS Part I: The MODIS Instrument Part II: Normalized Difference
SATELLITE REMOTE SENSING
 SATELLITE REMOTE SENSING of NATURAL RESOURCES David L. Verbyla LEWIS PUBLISHERS Boca Raton New York London Tokyo Contents CHAPTER 1. SATELLITE IMAGES 1 Raster Image Data 2 Remote Sensing Detectors 2 Analog
Estimation of Wavelet Based Spatially Enhanced Evapotranspiration Using Energy Balance Approach
 Estimation of Wavelet Based Spatially Enhanced Evapotranspiration Using Energy Balance Approach Dr.Gowri 1 Dr.Thirumalaivasan 2 1 Associate Professor, Jerusalem College of Engineering, Department of Civil
Sentinel-3 Sea and Land Surface Temperature Radiometer (SLSTR) Mireya Etxaluze (STFC RAL Space)
 Mireya Etxaluze (STFC RAL Space)") Sentinel-3 Sea and Land Surface Temperature Radiometer (SLSTR) Mireya Etxaluze (STFC RAL Space) RAL Space Radiometry Group Dave Smith Mireya Etxaluze, Ed Polehampton, Caroline Cox, Tim Nightingale, Dan
Sentinel-3 Sea and Land Surface Temperature Radiometer (SLSTR) Mireya Etxaluze (STFC RAL Space) RAL Space Radiometry Group Dave Smith Mireya Etxaluze, Ed Polehampton, Caroline Cox, Tim Nightingale, Dan
Defourny P. (1), Bontemps S. (1), Brockmann C. (3), Achard F. (2), Boettcher M. (3), De Maet T. (1), Land_Cover_CCI
, Bontemps S. (1), Brockmann C. (3), Achard F. (2), Boettcher M. (3), De Maet T. (1), Land_Cover_CCI") Defourny P. (1), Bontemps S. (1), Brockmann C. (3), Achard F. (2), Boettcher M. (3), De Maet T. (1), Land_Cover_CCI Gamba P. (4), Hagemann S. (5), Hartley A. (6), Hoffman L., (11), Khlystova I.G. (5),
Defourny P. (1), Bontemps S. (1), Brockmann C. (3), Achard F. (2), Boettcher M. (3), De Maet T. (1), Land_Cover_CCI Gamba P. (4), Hagemann S. (5), Hartley A. (6), Hoffman L., (11), Khlystova I.G. (5),
SAFNWC/MSG SEVIRI CLOUD PRODUCTS
 SAFNWC/MSG SEVIRI CLOUD PRODUCTS M. Derrien and H. Le Gléau Météo-France / DP / Centre de Météorologie Spatiale BP 147 22302 Lannion. France ABSTRACT Within the SAF in support to Nowcasting and Very Short
Landcover Dynamics in the Niger Inland Delta (Mali)
") Fakultät Forst-, Geo- Hydrowissenschaften Institut f. Photogrammetrie & Fernerkundung, Professur Fernerkundung Landcover Dynamics in the Niger Inland Delta (Mali) A Classification Approach for MERIS Data
Fakultät Forst-, Geo- Hydrowissenschaften Institut f. Photogrammetrie & Fernerkundung, Professur Fernerkundung Landcover Dynamics in the Niger Inland Delta (Mali) A Classification Approach for MERIS Data
Predicting ectotherm disease vector spread. - Benefits from multi-disciplinary approaches and directions forward
 Predicting ectotherm disease vector spread - Benefits from multi-disciplinary approaches and directions forward Naturwissenschaften Stephanie Margarete THOMAS, Carl BEIERKUHNLEIN, Department of Biogeography,
Sub-pixel regional land cover mapping. with MERIS imagery
 Sub-pixel regional land cover mapping with MERIS imagery R. Zurita Milla, J.G.P.W. Clevers and M. E. Schaepman Centre for Geo-information Wageningen University 29th September 2005 Overview Land Cover MERIS
School on Modelling Tools and Capacity Building in Climate and Public Health April Remote Sensing
 2453-5 School on Modelling Tools and Capacity Building in Climate and Public Health 15-26 April 2013 Remote Sensing CECCATO Pietro International Research Institute for Climate and Society, IRI The Earth
ANALYSIS OF THE FACTOR WHICH GIVES INFLUENCE TO AVHRR NDVI DATA
 ANALYSIS OF THE FACTOR WHICH GIVES INFLUENCE TO AVHRR NDVI DATA Jong-geol Park and Ryutaro Tateishi Center for Environmental Remote Sensing Chiba University, Japan amon@ceres.cr.chiba-u.ac.jp tateishi@ceres.cr.chiba-u.ac.jp
Comparison of MSG-SEVIRI and SPOT-VEGETATION data for vegetation monitoring over Africa
 Comparison of MSG-SEVIRI and SPOT-VEGETATION data for vegetation monitoring over Africa Bernard LACAZE CNRS UMR 8586 PRODIG Pôle Image et Campus Spatial, Université Paris Diderot Paris 7 Objectives Comparison
AGOG 485/585 /APLN 533 Spring Lecture 5: MODIS land cover product (MCD12Q1). Additional sources of MODIS data
. Additional sources of MODIS data") AGOG 485/585 /APLN 533 Spring 2019 Lecture 5: MODIS land cover product (MCD12Q1). Additional sources of MODIS data Outline Current status of land cover products Overview of the MCD12Q1 algorithm Mapping
AGOG 485/585 /APLN 533 Spring 2019 Lecture 5: MODIS land cover product (MCD12Q1). Additional sources of MODIS data Outline Current status of land cover products Overview of the MCD12Q1 algorithm Mapping
Intercomparison of Snow Extent Products from Earth Observation Data
 Intercomparison of Snow Extent Products from Earth Observation Data, Elisabeth Ripper, Gabriele Bippus, Helmut Rott FMI Richard Fernandes Kari Luojus Sari Metsämäki Dorothy Hall David Robinson Bojan Bojkov
The current status of FY-3D
 The current status of FY-3D Xiang Fang National Satellite Meteorological Center, China Meteorological Administration (NSMC/CMA) OUTLINE Overview Key instruments onboard FY-3D Products and data service
Polar Multi-Sensor Aerosol Product: User Requirements
 Polar Multi-Sensor Aerosol Product: User Requirements Doc.No. Issue : : EUM/TSS/REQ/13/688040 v2 EUMETSAT EUMETSAT Allee 1, D-64295 Darmstadt, Germany Tel: +49 6151 807-7 Fax: +49 6151 807 555 Telex: 419
NESDIS Global Automated Satellite Snow Product: Current Status and Recent Results Peter Romanov
 NESDIS Global Automated Satellite Snow Product: Current Status and Recent Results Peter Romanov NOAA-CREST, City University of New York (CUNY) Center for Satellite Applications and Research (STAR), NOAA/NESDIS
Spatial Decision Tree: A Novel Approach to Land-Cover Classification
 Spatial Decision Tree: A Novel Approach to Land-Cover Classification Zhe Jiang 1, Shashi Shekhar 1, Xun Zhou 1, Joseph Knight 2, Jennifer Corcoran 2 1 Department of Computer Science & Engineering 2 Department
MONTHLY OPERATIONS REPORT
 MONTHLY OPERATIONS REPORT MOR#027 Reporting period from 16-Feb-2016 to 15-Mar-2016 Reference: PROBA-V_D5_MOR-027_2016-03_v1.0 Author(s): Dennis Clarijs, Sindy Sterckx, Alex Geboers, Erwin Wolters Version:
Status of CNES Cal/Val Activities
 GSICS Executive Panel Meeting 16-17th May 2014, Guangzhou, China Status of CNES Cal/Val Activities Patrice Henry CNES 1 Summary Overview of CNES Cal/Val Activities Summary Re-Calibration Activities POLDER(s)/PARASOL
Land cover/land use mapping and cha Mongolian plateau using remote sens. Title. Author(s) Bagan, Hasi; Yamagata, Yoshiki. Citation Japan.
 Bagan, Hasi; Yamagata, Yoshiki. Citation Japan.") Title Land cover/land use mapping and cha Mongolian plateau using remote sens Author(s) Bagan, Hasi; Yamagata, Yoshiki International Symposium on "The Imp Citation Region Specific Systems". 6 Nove Japan.
Title Land cover/land use mapping and cha Mongolian plateau using remote sens Author(s) Bagan, Hasi; Yamagata, Yoshiki International Symposium on "The Imp Citation Region Specific Systems". 6 Nove Japan.
Data assimilation of IASI radiances over land.
 Data assimilation of IASI radiances over land. PhD supervised by Nadia Fourrié, Florence Rabier and Vincent Guidard. 18th International TOVS Study Conference 21-27 March 2012, Toulouse Contents 1. IASI
SNOW COVER MAPPING USING METOP/AVHRR AND MSG/SEVIRI
 SNOW COVER MAPPING USING METOP/AVHRR AND MSG/SEVIRI Niilo Siljamo, Markku Suomalainen, Otto Hyvärinen Finnish Meteorological Institute, P.O.Box 503, FI-00101 Helsinki, Finland Abstract Weather and meteorological
Utilization of Global Map for Societal Benefit Areas
 Utilization of Global Map for Societal Benefit Areas The Fourth GEOSS AP Symposium Bali Indonesia, 11th March 2010 Shuhei Kojima Geographical Survey Institute Ministry of Land, Infrastructure, Transport
VALIDATION RESULTS OF THE OPERATIONAL LSA-SAF SNOW COVER MAPPING
 VALIDATION RESULTS OF THE OPERATIONAL LSA-SAF SNOW COVER MAPPING Niilo Siljamo, Otto Hyvärinen Finnish Meteorological Institute, Erik Palménin aukio 1, P.O.Box 503, FI-00101 HELSINKI Abstract Hydrological
Proceedings Combining Water Indices for Water and Background Threshold in Landsat Image
 Proceedings Combining Water Indices for Water and Background Threshold in Landsat Image Tri Dev Acharya 1, Anoj Subedi 2, In Tae Yang 1 and Dong Ha Lee 1, * 1 Department of Civil Engineering, Kangwon National
General Aspects I: What is a cloud?
 Cloud Detection General Aspects I: What is a cloud? I can tell you, if I see... A visible aggregate of minute water droplets and/or ice particles in the atmosphere above the earth s surface Global total
Comparison of PROBA-V, METOP and emodis NDVI anomalies over the Horn of Africa Third Main Title Line Third Line
 Comparison of PROBA-V, METOP and emodis NDVI anomalies over the Horn of Africa Third Main Title Line Third Line Evaluation of PROBA-V satellite data quality Michele Meroni Felix Rembold 0 5 Report EUR
o 3000 Hannover, Fed. Rep. of Germany
 1. Abstract The use of SPOT and CIR aerial photography for urban planning P. Lohmann, G. Altrogge Institute for Photogrammetry and Engineering Surveys University of Hannover, Nienburger Strasse 1 o 3000
Land Management and Natural Hazards Unit --- DESERT Action 1. Land Management and Natural Hazards Unit Institute for Environment and Sustainability
 Land Management and Natural Hazards Unit --- DESERT Action 1 Monitoring Drought with Meteorological and Remote Sensing Data A case study on the Horn of Africa Paulo Barbosa and Gustavo Naumann Land Management
Spatial Drought Assessment Using Remote Sensing and GIS techniques in Northwest region of Liaoning, China
 Spatial Drought Assessment Using Remote Sensing and GIS techniques in Northwest region of Liaoning, China FUJUN SUN, MENG-LUNG LIN, CHENG-HWANG PERNG, QIUBING WANG, YI-CHIANG SHIU & CHIUNG-HSU LIU Department
Snow Cover Applications: Major Gaps in Current EO Measurement Capabilities
 Snow Cover Applications: Major Gaps in Current EO Measurement Capabilities Thomas NAGLER ENVEO Environmental Earth Observation IT GmbH INNSBRUCK, AUSTRIA Polar and Snow Cover Applications User Requirements
NESDIS Global Automated Satellite Snow Product: Current Status and Planned Upgrades Peter Romanov
 NESDIS Global Automated Satellite Snow Product: Current Status and Planned Upgrades Peter Romanov NOAA-CREST, City University of New York (CUNY) Center for Satellite Applications and Research (STAR), NOAA/NESDIS
C o p e r n i c u s L a n d M o n i t o r i n g S e r v i c e
 C o p e r n i c u s L a n d M o n i t o r i n g S e r v i c e Integration into existing Snow and Ice Services and draft product specifications Annett BARTSCH b.geos Copernicus High Resolution Snow and
Extension of the targets for the GOSAT SWIR XCO 2 and XCH 4 retrievals
 Extension of the targets for the GOSAT SWIR XCO 2 and XCH 4 retrievals Y. Yoshida 1 (yoshida.yukio@nies.go.jp), N. Kikuchi 1, M. Inoue 1, I. Morino 1, O. Uchino 1, T. Yokota 1, and TCCON partners 2 1 National
Chapter 2 Earth s Interlocking Systems pg The Earth and Its Forces pg
 Chapter 2 Earth s Interlocking Systems pg. 24 55 2 1 The Earth and Its Forces pg. 27 33 Connecting to Your World and Internal Forces Shaping the Earth The Earth is unique in the solar system because it
Recent Update on MODIS C6 and VIIRS Deep Blue Aerosol Products
 Recent Update on MODIS C6 and VIIRS Deep Blue Aerosol Products N. Christina Hsu, Photo taken from Space Shuttle: Fierce dust front over Libya Corey Bettenhausen, Andrew M. Sayer, and Rick Hansell Laboratory
Comparison of NASA AIRS and MODIS Land Surface Temperature and Infrared Emissivity Measurements from the EOS AQUA platform
 Comparison of NASA AIRS and MODIS Land Surface Temperature and Infrared Emissivity Measurements from the EOS AQUA platform Robert Knuteson, Steve Ackerman, Hank Revercomb, Dave Tobin University of Wisconsin-Madison
7.1 INTRODUCTION 7.2 OBJECTIVE
 7 LAND USE AND LAND COVER 7.1 INTRODUCTION The knowledge of land use and land cover is important for many planning and management activities as it is considered as an essential element for modeling and
Surface WAter Microwave Product Series [SWAMPS]
![Surface WAter Microwave Product Series [SWAMPS]](/thumbs/87/97403550.jpg "Surface WAter Microwave Product Series [SWAMPS]") Surface WAter Microwave Product Series [SWAMPS] Version 3.2 Release Date: May 01 2018 Contact Information: Kyle McDonald, Principal Investigator: kmcdonald2@ccny.cuny.edu Kat Jensen: kjensen@ccny.cuny.edu
Surface WAter Microwave Product Series [SWAMPS] Version 3.2 Release Date: May 01 2018 Contact Information: Kyle McDonald, Principal Investigator: kmcdonald2@ccny.cuny.edu Kat Jensen: kjensen@ccny.cuny.edu
Monitoring Vegetation Growth of Spectrally Landsat Satellite Imagery ETM+ 7 & TM 5 for Western Region of Iraq by Using Remote Sensing Techniques.
 Monitoring Vegetation Growth of Spectrally Landsat Satellite Imagery ETM+ 7 & TM 5 for Western Region of Iraq by Using Remote Sensing Techniques. Fouad K. Mashee, Ahmed A. Zaeen & Gheidaa S. Hadi Remote
Long-Term Time Series of Water Vapour Total Columns from GOME, SCIAMACHY and GOME-2
 Graphics: ESA Graphics: ESA Graphics: ESA Long-Term Time Series of Water Vapour Total Columns from GOME, SCIAMACHY and GOME-2 S. Noël, S. Mieruch, H. Bovensmann, J. P. Burrows Institute of Environmental
INTERPRETATION OF MSG IMAGES, PRODUCTS AND SAFNWC OUTPUTS FOR DUTY FORECASTERS
 INTERPRETATION OF MSG IMAGES, PRODUCTS AND SAFNWC OUTPUTS FOR DUTY FORECASTERS M. Putsay, M. Rajnai, M. Diószeghy, J. Kerényi, I.G. Szenyán and S. Kertész Hungarian Meteorological Service, H-1525 Budapest,
Determination of the NDSI index and cloud mask algorithm (The Case Study: Sepidan Region, Iran)
") 2012 International Conference on Future Environment and Energy IPCBEE vol.28(2012) (2012)IACSIT Press, Singapoore Determination of the NDSI index and cloud mask algorithm (The Case Study: Sepidan Region,
2012 International Conference on Future Environment and Energy IPCBEE vol.28(2012) (2012)IACSIT Press, Singapoore Determination of the NDSI index and cloud mask algorithm (The Case Study: Sepidan Region,
Evaluation of updated JXAM5 snow cover extent product using ground based snow depth information
 2 nd International Satellite Snow Product Intercomparison Workshop ISSPI-2 University Memorial Center (UMC), University of Colorado Boulder, 14-16 September 2015 Evaluation of updated JXAM5 snow cover
The PRECIS Regional Climate Model
 The PRECIS Regional Climate Model General overview (1) The regional climate model (RCM) within PRECIS is a model of the atmosphere and land surface, of limited area and high resolution and locatable over
P3.24 EVALUATION OF MODERATE-RESOLUTION IMAGING SPECTRORADIOMETER (MODIS) SHORTWAVE INFRARED BANDS FOR OPTIMUM NIGHTTIME FOG DETECTION
 SHORTWAVE INFRARED BANDS FOR OPTIMUM NIGHTTIME FOG DETECTION") P3.24 EVALUATION OF MODERATE-RESOLUTION IMAGING SPECTRORADIOMETER (MODIS) SHORTWAVE INFRARED BANDS FOR OPTIMUM NIGHTTIME FOG DETECTION 1. INTRODUCTION Gary P. Ellrod * NOAA/NESDIS/ORA Camp Springs, MD
P3.24 EVALUATION OF MODERATE-RESOLUTION IMAGING SPECTRORADIOMETER (MODIS) SHORTWAVE INFRARED BANDS FOR OPTIMUM NIGHTTIME FOG DETECTION 1. INTRODUCTION Gary P. Ellrod * NOAA/NESDIS/ORA Camp Springs, MD
MSG/SEVIRI AND METOP/AVHRR SNOW EXTENT PRODUCTS IN H-SAF
 MSG/SEVIRI AND METOP/AVHRR SNOW EXTENT PRODUCTS IN H-SAF Niilo Siljamo, Otto Hyvärinen Finnish Meteorological Institute, Erik Palménin aukio 1, Helsinki, Finland Abstract Weather and meteorological processes
Software requirements * : Part III: 2 hrs.
 Title: Product Type: Developer: Target audience: Format: Software requirements * : Data: Estimated time to complete: Mapping snow cover using MODIS Part I: The MODIS Instrument Part II: Normalized Difference
1. Introduction. Jai Kumar, Paras Talwar and Krishna A.P. Department of Remote Sensing, Birla Institute of Technology, Ranchi, Jharkhand, India
 Cloud Publications International Journal of Advanced Remote Sensing and GIS 2015, Volume 4, Issue 1, pp. 1026-1032, Article ID Tech-393 ISSN 2320-0243 Research Article Open Access Forest Canopy Density
In-flight Spectral Calibration of MERIS/OLCI. Jürgen Fischer, Rene Preusker, Rasmus Lindstrot Institute for Space Science Free University Berlin
 In-flight Spectral Calibration of MERIS/OLCI Jürgen Fischer, Rene Preusker, Rasmus Lindstrot Institute for Space Science Free University Berlin 1 MERIS Instrument 2 MERIS Instrument Concept 3 MERIS Operation
TEMPO Aerosols. Need for TEMPO-ABI Synergy
 TEMPO Aerosols Need for TEMPO-ABI Synergy Omar Torres, Hiren Jethva, Changwoo Ahn CEOS - 2018 NOAA-College Park May 04, 2018 Use of near UV Satellite Observations for retrieving aerosol properties over
Module 2.1 Monitoring activity data for forests using remote sensing
 Module 2.1 Monitoring activity data for forests using remote sensing Module developers: Frédéric Achard, European Commission (EC) Joint Research Centre (JRC) Jukka Miettinen, EC JRC Brice Mora, Wageningen
Learning Objectives. Thermal Remote Sensing. Thermal = Emitted Infrared
 November 2014 lava flow on Kilauea (USGS Volcano Observatory) (http://hvo.wr.usgs.gov) Landsat-based thermal change of Nisyros Island (volcanic) Thermal Remote Sensing Distinguishing materials on the ground
Detection of surface water with SPOT/VEGETATION
 Detection of surface water with SPOT/VEGETATION Monitoring and assessing CILSS countries surface water availability Bruno Combal, Eva Haas, Etienne Bartholomé EUR 23934 EN - 2009 The mission of the JRC-IES
Flood mapping for index-based disaster risk transfer and insurance mechanisms
 Flood mapping for index-based disaster risk transfer and insurance mechanisms Atmospheric and Environmental Research (AER) African Risk Capacity (ARC) Contributors: AER: John Galantowicz, Jeff Picton,
NASA Flood Monitoring and Mapping Tools
 National Aeronautics and Space Administration ARSET Applied Remote Sensing Training http://arset.gsfc.nasa.gov @NASAARSET NASA Flood Monitoring and Mapping Tools www.nasa.gov Outline Overview of Flood
Digital Elevation Models (DEM) / DTM
 / DTM") Digital Elevation Models (DEM) / DTM Uses in remote sensing: queries and analysis, 3D visualisation, layers in classification Fogo Island, Cape Verde Republic ASTER DEM / image Banks Peninsula, Christchurch,
Digital Elevation Models (DEM) / DTM Uses in remote sensing: queries and analysis, 3D visualisation, layers in classification Fogo Island, Cape Verde Republic ASTER DEM / image Banks Peninsula, Christchurch,
Status and Data Applications of China Highresolution Earth Observation System. Earth Observation System and Data Center, CNSA Sep, 2016
 Status and Data Applications of China Highresolution Earth Observation System Earth Observation System and Data Center, CNSA Sep, 2016 Outlines Introduction Development of the Space-based System CHEOS
AUTOMATIC EXTRACTION OF ALUVIAL FANS FROM ASTER L1 SATELLITE DATA AND A DIGITAL ELEVATION MODEL USING OBJECT-ORIENTED IMAGE ANALYSIS
 AUTOMATIC EXTRACTION OF ALUVIAL FANS FROM ASTER L1 SATELLITE DATA AND A DIGITAL ELEVATION MODEL USING OBJECT-ORIENTED IMAGE ANALYSIS Demetre P. Argialas, Angelos Tzotsos Laboratory of Remote Sensing, Department
DETECTING HUMAN ACTIVITIES IN THE ARCTIC OCEAN BY CONSTRUCTING AND ANALYZING SUPER-RESOLUTION IMAGES FROM MODIS DATA INTRODUCTION
 DETECTING HUMAN ACTIVITIES IN THE ARCTIC OCEAN BY CONSTRUCTING AND ANALYZING SUPER-RESOLUTION IMAGES FROM MODIS DATA Shizhi Chen and YingLi Tian Department of Electrical Engineering The City College of
Regional Glacier Mapping Using Optical Satellite Data Time Series Solveig Havstad Winsvold, Andreas Kääb, Member, IEEE, and Christopher Nuth
 IEEE JOURNAL OF SELECTED TOPICS IN APPLIED EARTH OBSERVATIONS AND REMOTE SENSING 1 Regional Glacier Mapping Using Optical Satellite Data Time Series Solveig Havstad Winsvold, Andreas Kääb, Member, IEEE,
SIMULATION OF SPACEBORNE MICROWAVE RADIOMETER MEASUREMENTS OF SNOW COVER FROM IN-SITU DATA AND EMISSION MODELS
 SIMULATION OF SPACEBORNE MICROWAVE RADIOMETER MEASUREMENTS OF SNOW COVER FROM IN-SITU DATA AND EMISSION MODELS Anna Kontu 1 and Jouni Pulliainen 1 1. Finnish Meteorological Institute, Arctic Research,
Project title. Evaluation of MIR data from SPOT4/VEGETATION for the monitoring of climatic phenomena impact on vegetation
 Project title 1 Evaluation of MIR data from SPOT4/VEGETATION for the monitoring of climatic phenomena impact on vegetation Principal investigator: M-Christine IMBERTI Co-investigator: Frédéric BIARD Stockholm
Spectral surface albedo derived from GOME-2/Metop measurements
 Spectral surface albedo derived from GOME-2/Metop measurements Bringfried Pflug* a, Diego Loyola b a DLR, Remote Sensing Technology Institute, Rutherfordstr. 2, 12489 Berlin, Germany; b DLR, Remote Sensing
RGB in Broadcast Meteorology
 RGB in Broadcast Meteorology AHI Imagery for Weather Commentary on Clouds Yuki Takano Atmosphere and Ocean Research Institute The University of Tokyo collaborated with Shotaro Watanabe (Weather Map Co.
Atmospheric Correction Using Hyperion
 Atmospheric Correction Using Hyperion Progress and Issues Investigation: Correlative Analysis of EO-1, Landsat, and Terra Data of the DOE ARM CART Sites: An Investigation of Instrument Performance and
Status of Land Surface Temperature Product Development for JPSS Mission
 Status of Land Surface Temperature Product Development for JPSS Mission Yuling Liu 1,2, Yunyue Yu 2, Peng Yu 1,2 and Heshun Wang 1,2 1 ESSIC at University of Maryland, College Park, MD USA 2 Center for
How to display RGB imagery by SATAID
 How to display RGB imagery by SATAID Akihiro SHIMIZU Meteorological Satellite Center (MSC), Japan Meteorological Agency (JMA) Ver. 2015110500 RGB imagery on SATAID SATAID software has a function of overlapping
Interannual variation of MODIS NDVI in Lake Taihu and its relation to climate in submerged macrophyte region
 Yale-NUIST Center on Atmospheric Environment Interannual variation of MODIS NDVI in Lake Taihu and its relation to climate in submerged macrophyte region ZhangZhen 2015.07.10 1 Outline Introduction Data
Environmental Remote Sensing GEOG 2021
 Environmental Remote Sensing GEOG 2021 Lecture 3 Spectral information in remote sensing Spectral Information 2 Outline Mechanisms of variations in reflectance Optical Microwave Visualisation/analysis Enhancements/transforms
A Method for MERIS Aerosol Correction : Principles and validation. David Béal, Frédéric Baret, Cédric Bacour, Kathy Pavageau
 A Method for MERIS Aerosol Correction : Principles and validation David Béal, Frédéric Baret, Cédric Bacour, Kathy Pavageau Outlook Objectives Principles Training neural networks Validation Comparison
Indian National (Weather) SATellites for Agrometeorological Applications
 SATellites for Agrometeorological Applications") Indian National (Weather) SATellites for Agrometeorological Applications Bimal K. Bhattacharya Agriculture-Terrestrial Biosphere- Hydrology Group Space Applications Centre (ISRO) Ahmedabad 380015, India
Indian National (Weather) SATellites for Agrometeorological Applications Bimal K. Bhattacharya Agriculture-Terrestrial Biosphere- Hydrology Group Space Applications Centre (ISRO) Ahmedabad 380015, India