Jaclyn Ashley Shafer. Bachelor of Science Meteorology Florida Institute of Technology 2006
|
|
|
- Victoria Chambers
- 5 years ago
- Views:
Transcription
1 A Verification of the National Hurricane Center s Tropical Cyclone Wind Speed Probability Forecast Product by Jaclyn Ashley Shafer Bachelor of Science Meteorology Florida Institute of Technology 2006 A thesis submitted to the Department of Marine and Environmental Systems Florida Institute of Technology in partial fulfillment of the requirements for the degree of Master of Science in Meteorology Melbourne, Florida August, 2008
2 Copyright 2008 Jaclyn Ashley Shafer All Rights Reserved The author grants permission to make single copies
3 ABSTRACT A Verification of the National Hurricane Center s Tropical Cyclone Wind Speed Probability Forecast Product by Jaclyn Ashley Shafer Committee Chair: Michael Splitt, M.S. In 2004, Colorado State University created a tropical cyclone (TC) probability forecast product that was adopted as an experimental product by the National Hurricane Center (NHC) in 2005 and transitioned to operations in With the exception of a recent evaluation of the cumulative probability products for the Atlantic basin, little verification has been performed for the interval probabilities especially for land threatening or land falling events. An objective evaluation of the product s performance and interpretation of the product for operational application, e.g. discerning which forecast probabilities represent low/moderate/high risk for the various wind speed and forecast interval categories, is presented. This project focuses on four hurricane seasons from and includes all storms approaching areas of interested centered on Cocoa Beach, FL, Charleston, SC, New Orleans, LA and Corpus Christi, TX. Verification statistics are computed for each of the 21 forecast categories of the NHC probability product; three wind speed criteria ( 34 Kt, 50 Kt, and 64 Kt) and seven forecast time intervals (12, 24, 36, 48, 72, 96, and 120 hours). Verifications include use of reliability and sharpness diagrams, as well as additional statistics designed to quantitatively measure the product s performance. iii
4 Table of Contents Abstract... iii List of Figures... v List of Tables... viii List of Abbreviations... x Acknowledgements... xi 1. Introduction Methodology Product Forecasts Verification Verification Data Verification Tools Constructing a Relative Operating Characteristics (ROC) Diagram Optimal Threshold Selection Bootstrap Technique Reliability and Frequency Distribution Diagrams Results Relative Operating Characteristics (ROC) Diagrams Optimal Thresholds Product Evaluation Optimal Threshold Based Statistics Frequency Distribution and Reliability Diagrams Frequency Distribution Diagrams Reliability Diagrams Summary References Appendix A Appendix B Appendix C iv
5 List of Figures Figure 1: Google image of the four areas of interest... 3 Figure 2: Wind speed probability product for Cocoa Beach, Florida... 4 Figure 3: Successive forecast time intervals... 8 Figure 4: HURREVAC generated image for hurricane Frances... 8 Figure 5: Example ROC-diagram Figure 6: ROC-diagram for visual optimal threshold selection method Figure 7: ROC-diagram for TSS optimal threshold selection method Figure 8: Hypothetical Reliability Diagrams Figure 9.A: ROC-diagram for Cocoa Beach, FL 34 kt, with X forecasts Figure 9.B: ROC-diagram for Cocoa Beach, FL 50 kt, with X forecasts Figure 9.C: ROC-diagram for Cocoa Beach, FL 64 kt, with X forecasts Figure 9.D: ROC-diagram for Cocoa Beach, FL 34 kt, no X forecasts Figure 9.E: ROC-diagram for Cocoa Beach, FL 50 kt, no X forecasts Figure 9.F: ROC-diagram for Cocoa Beach, FL 64 kt, no X forecasts Figure 10.A: ROC-diagram with confidence intervals with X forecasts Figure 10.B: ROC-diagram with confidence intervals no X forecasts Figure 11: ROC curves with confidence intervals 34 kt, 12 h Figure 12: Illustration of X forecast affect on ROC curves Figure 13.A: Optimal thresholds for Cocoa Beach, FL 34 kt Figure 13.B: Optimal thresholds for Cocoa Beach, FL 50 kt Figure 13.C: Optimal thresholds for Cocoa Beach, FL 64 kt Figure 14.A: Score plots for Cocoa Beach, FL 34 kt, 120 h, with X Forecasts Figure 14.B: Score plots for Cocoa Beach, FL 34 kt, 120 h no X Forecasts Figure 15: HSS for Cocoa Beach, FL 34 kt, 12 h v
6 Figure 16.A: Accuracy TSS optimal threshold selection method Figure 16.B: Accuracy HSS optimal threshold selection method Figure 16.C: Accuracy 34 kt Figure 17.A: Bias Score TSS optimal threshold selection method Figure 17.B: Bias Score HSS optimal threshold selection method Figure 18.A: PoD TSS optimal threshold selection method Figure 18.B: PoD HSS optimal threshold selection method Figure 19.A: PoFD TSS optimal threshold selection method Figure 19.B: PoFD HSS optimal threshold selection method Figure 20.A: Threat Score TSS optimal threshold selection method Figure 20.B: Threat Score HSS optimal threshold selection method Figure 21.A: False Alarm Ratio TSS optimal threshold selection method Figure 21.B: False Alarm Ratio HSS optimal threshold selection method Figure 22.A: True Skill Statistic TSS optimal threshold selection method.. 51 Figure 22.B: True Skill Statistic HSS optimal threshold selection method.. 51 Figure 23.A: Heidke Skill Score TSS optimal threshold selection method.. 52 Figure 23.B: Heidke Skill Score HSS optimal threshold selection method.. 52 Figure 24.A: Frequency Distribution: 34 kt, 12 h, Cocoa Beach, FL AOI Figure 24.B: Reliability Diagram: 34 kt, 12 h, Cocoa Beach, FL AOI Figure 25.A: Frequency Distribution: 34 kt, 24 h, Cocoa Beach, FL AOI Figure 25.B: Reliability Diagram: 34 kt, 24 h, Cocoa Beach, FL AOI Figure 26.A: Frequency Distribution: 34 kt, 36 h, Cocoa Beach, FL AOI Figure 26.B: Reliability Diagram: 34 kt, 36 h, Cocoa Beach, FL AOI Figure 27.A: Frequency Distribution: 34 kt, 48 h, Cocoa Beach, FL AOI Figure 27.B: Reliability Diagram: 34 kt, 48 h, Cocoa Beach, FL AOI Figure 28.A: Frequency Distribution: 34 kt, 72 h, Cocoa Beach, FL AOI Figure 28.B: Reliability Diagram: 34 kt, 72 h, Cocoa Beach, FL AOI Figure 29.A: Frequency Distribution: 34 kt, 96 h, Cocoa Beach, FL AOI Figure 29.B: Reliability Diagram: 34 kt, 96 h, Cocoa Beach, FL AOI vi
7 Figure 30.A: Frequency Distribution: 34 kt, 120 h, Cocoa Beach, FL AOI Figure 30.B: Reliability Diagram: 34 kt, 120 h, Cocoa Beach, FL AOI Figure A.1.A: ROC-diagram for Charleston, SC 34 kt, with X forecasts Figure A.1.B: ROC-diagram for Charleston, SC 50 kt, with X forecasts Figure A.1.C: ROC-diagram for Charleston, SC 64 kt, with X forecasts Figure A.1.D: ROC-diagram for Charleston, SC 34 kt, no X forecasts Figure A.1.E: ROC-diagram for Charleston, SC 50 kt, no X forecasts Figure A.1.F: ROC-diagram for Charleston, SC 64 kt, no X forecasts Figure B.1.A: ROC-diagram for New Orleans, LA 34 kt, with X forecasts. 83 Figure B.1.B: ROC-diagram for New Orleans, LA 50 kt, with X forecasts. 83 Figure B.1.C: ROC-diagram for New Orleans, LA 64 kt, with X forecasts. 84 Figure B.1.D: ROC-diagram for New Orleans, LA 34 kt, no X forecasts Figure B.1.E: ROC-diagram for New Orleans, LA 50 kt, no X forecasts Figure B.1.F: ROC-diagram for New Orleans, LA 64 kt, no X forecasts Figure C.1.A: ROC-diagram for Corpus Christi, TX 34 kt with X forecasts Figure C.1.B: ROC-diagram for Corpus Christi, TX 50 kt with X forecasts Figure C.1.C: ROC-diagram for Corpus Christi, TX 64 kt with X forecasts Figure C.1.D: ROC-diagram for Corpus Christi, TX 34 kt no X forecasts Figure C.1.E: ROC-diagram for Corpus Christi, TX 50 kt no X forecasts Figure C.1.F: ROC-diagram for Corpus Christi, TX 64 kt no X forecasts vii
8 List of Tables Table 1: Example of data collected for Cocoa Beach, FL AOI... 6 Table 2: Classification definitions Table 3: Contingency Table Table 4: Verification Statistics Table 5: Maximum probability forecast for Cocoa Beach, FL AOI Table 6.A: Optimal thresholds for Cocoa Beach, FL AOI with X forecasts 33 Table 6.B: Optimal thresholds for Cocoa Beach, FL AOI no X forecasts Table 7: Distribution of FA and CN for Cocoa Beach, FL AOI 64 kt Table 8: Distribution of Hit, Miss, FA and CN for Cocoa Beach, FL AOI 34 kt, TSS method Table 9: Distribution of Hit, Miss, FA and CN for Cocoa Beach, FL AOI 34 kt, HSS method Table 10: Optimal Thresholds selected optimizing TSS, HSS and Bias Table 11.A: PoD, TSS and HSS metrics based on optimal thresholds from TSS method Table 11.B: PoD, TSS and HSS metrics based on optimal thresholds from HSS method Table 11.C: PoD, TSS and HSS metrics based on optimal thresholds from Bias Score method Table A.1.A: Optimal thresholds for Charleston, SC AOI with X forecasts Table A.1.B: Optimal thresholds for Charleston, SC AOI no X forecasts viii
9 Table B.1.A: Optimal thresholds for New Orleans, LA AOI with X forecasts Table B.1.B: Optimal thresholds for New Orleans, LA AOI no X forecasts Table C.1.A: Optimal thresholds for Corpus Christi, TX AOI with X forecasts Table C.1.B: Optimal thresholds for Corpus Christi, TX AOI no X forecasts ix
10 List of Abbreviations 45 WS: 45 th Weather Squadron AOI: CCAFS: CN: FA: FD: HSS: HURREVAC: IP: KSC: NHC: NSS: PoD: PoFD: ROC: TC: TSS: WPFP: Area of Interest Cape Canaveral Air Force Station Correct Negative False Alarm Frequency Distribution Heidke Skill Score Hurricane Evacuation Interval Probability Kennedy Space Center National Hurricane Center Normalized Skill Score Probability of Detection Probability of False Detection Relative Operating Characteristics Tropical Cyclone True Skill Statistic Tropical Cyclone Wind Speed Probability Forecast Product x
11 Acknowledgements I would first like to thank my family and friends for all of their support over the years. Mom, even through all the trials and tribulations you were there every step of the way. I greatly appreciate everything you have done for me and would not be where I am without your love, guidance and support. Leslie, just remember! I would also like to thank my advisors, Dr. Steven Lazarus and Mr. Michael Splitt, for all their dedication, guidance and encouragement throughout both my undergraduate and graduate careers. I sincerely thank Mr. David Froiseth and fellow Scitorians of Scitor Corporation for the internship opportunity that started it all! My professional career would not be where it is without you and I thank you for everything! I also thank Mike McAleenan, Bill Roeder, Kathy Winters and all other members of the 45 th Weather Squadron for their warm welcome and assistance with this project. xi
12 1. INTRODUCTION The 45 th Weather Squadron (45 WS) provides comprehensive weather services to America s space program at Cape Canaveral Air Force Station (CCAFS), Patrick Air Force Base and NASA s Kennedy Space Center (KSC). Given the location of these facilities, on the Florida central east coast, tropical cyclones (TC) pose a potentially significant threat to these agencies. When a TC threatens the area, the 45 WS provides detailed information to launch agencies concerning the storm threat including track, timing, intensity and size (Winters et al. 2006). One of the support tools used by the 45 WS is the Tropical Cyclone Wind Speed Probability Forecast Product (WPFP) which is issued by the National Hurricane Center (NHC). The 45 WS relays the WPFP and other TC information to senior managers who then decide if and when to begin actions necessary to protect resources. As a recent product, the WPFP has yet to be fully evaluated especially for land-falling or land-threatening TC events. By land-threatening we are referring to storms that might make land-fall or, a possibility exists that coastal cities in our area of interest will be affected by tropical storm (34-63 kt, m/s) or hurricane (64+ kt, 33+ m/s) force winds. Herein, we address two key questions 1.) How well does the product perform and 2.) What probability values are significant for making a yes/no decision? In a related study, Knaff and DeMaria (2006) evaluated the performance of the WPFP. Their study focuses on the entire Atlantic basin and includes all storms 1
13 in the 2006 hurricane season. Verification includes bias score (see Table 4) and Brier skill score, which measures the improvement of the probabilistic forecast relative to climatology (Stefanova et. al 2002), as well as the use of reliability diagrams (detailed discussion of reliability diagrams later in methodology section). Results of their work show the product has biases ranging from 0.70 to 0.95; perfect score is 1, and the probability product is more skillful than the deterministic forecasts (abbreviated OFCL, the official NHC forecast) in declaring if an event will happen (brier skill score ranges from 0.1 to 0.25; perfect score is 1, 0 indicates no skill). Reliability diagrams indicated that product s predicted probabilities of an event corresponded closely with the observed frequencies (61 st IHC 2006). The purpose of this project is to determine the performance of the WPFP issued by the NHC for land-threatening and land-falling storms. This study presents results composited from four hurricane seasons from 2004 to 2007 and includes all TCs affecting areas of interest (AOI) centered on Cocoa Beach, FL Charleston, SC, Corpus Christi, TX and New Orleans, LA (see Figure 1). The methodology, data, and results follow. 2
, Cocoa Beach, FL (Purple), New Orleans, LA (Pink), Corpus Christi, TX (Orange).")
14 Figure 1: Google Earth image of southeast United States outlining the four areas of interest. Charleston, SC (Green), Cocoa Beach, FL (Purple), New Orleans, LA (Pink), Corpus Christi, TX (Orange). Gold stars indicate location of listed cities. 3
15 2. METHODOLOGY 2.1: Product Forecasts The NHC issues tropical cyclone wind speed probabilities when a storm is a potential threat to coastal regions of the United States and other countries in the Atlantic and eastern Pacific basins. Every six hours, the WPFP provides probabilities for surface wind speeds of at least 34 kt (17 m/s), 50 kt (26 m/s) and 64 kt (33 m/s) for different, but fixed, forecast time intervals including 12, 24, 36, 48, 72, 96, and 120 h (Department of Commerce 2008). Figure 2: Wind speed probability product for Cocoa Beach, Florida issued during hurricane Wilma on 22 October 2005 at 0300Z. X forecasts indicate probabilities less than 0.4%. See text for more detail. An example of the probability forecast product is shown in Figure 2. Probabilities are given for each wind speed criteria and forecast time interval at 4
16 Cocoa Beach, Florida during hurricane Wilma in October The product shows two columns of data listed per forecast time interval; the left column lists the interval forecasts and the right (parenthetical) column lists the cumulative. The interval probability (IP) is defined as the probability of first occurrence of a wind speed threshold within a given forecast time interval and is thus related to predicting the onset of the event in question. The cumulative probability is an integrated quantity defined as the sum of the preceding IP for a given forecast hour within the 120 h forecast time period (NHC Product Description 2006). For this study, the IP for each storm, from the hurricane seasons that affected our AOIs, were used. These probabilities can be converted into binary (i.e. yes/no) forecasts based on a user determined threshold (see Section for detailed discussion). When a probability greater than 0% is forecast during at least one of the seven forecast intervals for at least one city within the AOI, X forecasts (representing < 0.4%) are issued in the remaining forecast interval positions for each city within the AOI (e.g., see Table 1). These < 0.4% forecasts are included in the original data set in order to identify missed forecasts (i.e. binary no events that were incorrect forecasts). Unfortunately, this can saturate the data set with correct negative forecasts (i.e., binary no events that were correct forecasts). This is an important issue in the context of the verification statistics presented and is discussed later in more detail. As a result, a second data compositing method was 5
17 applied and is also presented here. This alternative data set includes only those probabilities greater than 0.4% (red numbers, Table 1). This approach, while eliminating the spurious correct negative forecasts, also eliminates the missed forecasts that are included in the original data set. Verification statistics are calculated using both data sets to compare and test the impact of the correct negatives and missed forecasts on the performance of the WFPF. Table 1: Hypothetical probabilities (%) for cities within the Cocoa Beach, FL AOI. The X forecasts represent probabilities less than 0.4%. City 12 h 24 h 36 h 48 h 76 h 96 h 120 h Jacksonville X X X X X X 1 Daytona X X X X X X 2 Cocoa Beach X X X X X X X Fort Pierce X X X X X X X West Palm Beach X X X X X X X Miami X X X X X X X 2.2: Verification 2.2.1: Verification Data A data base from an emergency management tool referred to as the Hurricane Evacuation (HURREVAC) software package was mined for ground truth TC observations including position (i.e., observed track), intensity, size and movement. An example of the graphical output from HURREVAC, for hurricane 6
18 Frances, is shown in Figure 4. The actual 34 kt (17 m/s), 50 kt (26 m/s) and 64 kt (33 m/s) wind radii are displayed in the figure. When the NHC issues probability forecasts for land-threatening or land-falling storms potentially affecting our AOI s, ground truth observations, provided by HURREVAC, are used to separate the probabilities into occurred and did not occur events. For example, consider the probability forecasts issued 06 UTC on 4 September 2004 for hurricane Frances (not shown). For this cycle, the 12 h forecast interval corresponds to the UTC time window. HURREVAC output (Figure 3) indicates that winds greater than or equal to 34 kt (17 m/s) occurred (green arrows, Figure 3) in Cocoa Beach, Fort Pierce, West Palm Beach, and Miami, Florida but did not occur (red arrows, Figure 3) in Jacksonville and Daytona Beach within the 12 h forecast time interval. This procedure was repeated for each wind speed criteria and forecast time interval for all storms in the study. Unfortunately, it is not possible to unambiguously determine first occurrence for the initial forecast interval (i.e., 0-12 h) because the onset of a given wind speed criteria may have occurred at an earlier time. The WPFP does not recognize if, at the time of the forecast, onset occurred previously. Because the WPFP is issued every six hours (with forecasts out to 120 h), there is a six hour overlap between successive forecasts for the 0 to 12 h window (see Figure 3). If the wind speed criteria onset occurs within this overlap period (yellow shaded area, Figure 3), we opt to treat these probabilities as a yes (i.e., it occurred) for both 0 to 12 h forecast intervals. It is also possible that, for a slow moving storm, 7
19 the wind speed criteria may extend into subsequent 0-12 h forecasts as well. Regardless, these instances are considered a yes Figure 3: Two successive 0 12 h forecast time intervals (Green and Purple brackets) with overlapping times shaded in yellow. Labels are hypothetical UTC times (i.e. 06 = 06Z). See text. 64Kt 34Kt 50Kt 34 kt 50 kt 64 kt Figure 4: HURREVAC generated image for hurricane Frances valid 1800 UTC 4 September The red arrows indicate did not occur events; green arrows indicate occurred events. Arrows and wind radii labels added for clarification. 8
20 2.2.2: Verification Tools Many verification statistics exist for evaluating the performance of a forecast system based on binary (yes/no) forecasts as well as the use of reliability diagrams (detailed discussion in later sections). In order to take advantage of these tools, the probabilities were converted accordingly. The forecasts were separated into occurred and did not occur events, through the verification process using HURREVAC, and then two additional categories were defined; event forecast to occur and event forecast not to occur. In order to determine in which of these two categories a forecast probability falls, we identify an optimal threshold (through Relative Operating Characteristics (ROC) diagrams discussed later) defined as the probability where, if the product forecasts a probability greater than or equal to the threshold value, the event is forecast to occur and, if the product forecasts a probability less than the optimal threshold, the event is forecast not to occur. At this point, the probabilities have been converted to binary (yes/no) forecasts and can be classified as a Hit, Miss, False Alarm (FA) or Correct Negative (CN) (see Table 2). These classifications are necessary for the verification statistics used to quantitatively measure the performance of the WPFP. 9
21 Table 2: Definitions of each classification given to the probability forecasts Classification Definition Hit Event Forecast to Occur, Event Occurred Miss Event Forecast Not to Occur, Event Occurred False Alarm (FA) Event Forecast to Occur, Event Did Not Occur Correct Negative (CN) Event Forecast Not to Occur, Event Did Not Occur : Constructing a Relative Operating Characteristics (ROC) Diagram For a probabilistic forecast system, a Relative Operating Characteristics (ROC) diagram illustrates the varying quality of the forecast system at different forecast probabilities. Depending on specific user needs, the ROC curve can be used to help identify optimum strategy in any specific application (Mason 1999). For this study, ROC diagrams were constructed for each wind speed criteria and forecast time interval to help determine the corresponding optimal thresholds. A ROC-diagram is defined, on the x-axis, by the Probability of False Detection (or false alarm rate), i.e. PoFD = FA / (CN + FA), and, on the y-axis, by the Probability of Detection, i.e. PoD = Hits / (Hits + Misses) where Hit, Miss, FA, and CN are defined in Table 2. The ROC-diagram is created by calculating a unique PoD and PoFD for each threshold probability (using increments of 1% for threshold values ranging 10
22 from 0 to 100%). The number of hits, misses, FAs and CNs are calculated for each individual threshold value where the sample space consists of all data within a particular forecast interval and wind speed criteria. Hence, each data point on the ROC-diagram represents an estimate of a PoFD, PoD pair for a given threshold value (see Figure 5). Figure 5: An example ROC-diagram constructed for a given wind speed criteria and forecast time interval. The PoD and PoFD (false alarm rate) is plotted for threshold values ranging from 0% - 100% in 1% increments. See text for details. 11
23 : Optimal Threshold Selection Various approaches can be taken to determine an optimal threshold from the ROC-diagram. For example, if an optimal forecast is defined as one in which there are minimal false alarms and a maximum number of hits, then the highest skill (i.e., optimal threshold) is represented by the ROC data point that is closest to the upper left hand corner (PoFD = 0, PoD = 1) of the diagram (e.g., see Figure 6). As an alternative one can calculate what is referred to as the True Skill Statistic (TSS, see Table 4). Like the PoD and PoFD, the TSS can be calculated for each probability threshold increment. On a ROC diagram, the TSS is the vertical distance between a (PoFD, PoD) pair and the diagonal line defined by PoD = PoFD (MANZATO 2005). The TSS based optimal threshold is identified as the data point with the greatest vertical distance to the line PoD = PoFD (e.g., see Figure 7). We also use a non-roc diagram approach for determining optimal thresholds based on the maximum Heidke Skill Score (HSS, see Table 4). Unlike the TSS, this statistic, one of several accepted standards of forecasting in the scientific community (NOAA 2004), is difficult to visually determine on the ROC-diagram. As a result, the HSS is calculated for each probability threshold increment where the probability threshold value corresponding to the maximum HSS is considered to be optimal. 12
 is plotted for threshold values ranging from 0% - 100% in 1% increments.")
24 Figure 6: ROC-diagram constructed for a given wind speed criteria and forecast time interval. The PoD and PoFD (false alarm rate) is plotted for threshold values ranging from 0% - 100% in 1% increments. The yellow star (21%) identifies the optimal threshold probability based on maximum PoD and minimal PoFD (see text for details). 13
, as a Hit, Miss, FA, or")
25 Figure 7: Same as Figure 5. The yellow star (23%) identifies the optimal threshold probability based on maximum. Using any of the aforementioned approaches to identify an optimal threshold, the probabilities are reclassified, using Table 3 (replacing threshold with optimal threshold ), as a Hit, Miss, FA, or CN. This process is repeated for each wind speed criteria and forecast time interval. 14
26 Table 3: Contingency table showing classification of each probability forecast. Note: False Alarm (FA), Correct Negative (CN). Occurred Did Not Occur Forecast % Threshold Hit FA Forecast % < Threshold Miss CN : Bootstrap Technique Here we use what is referred to as the bootstrap method to assess the robustness of the PoD and PoFD values computed to construct the ROC diagram. By selecting multiple subsamples from the original data set, with replacement, and then recalculating the PoD and PoFD values for each bootstrap subsample, confidence intervals are calculated for each data point to show uncertainty in the ROC curves (Cheng 1995). By with replacement we mean, each time a subsample is selected, the corresponding PoD and PoFD are calculated and recorded. Then the subsample is replaced in the original data set before the next subsample is drawn. Confidence intervals were calculated for both the PoD and PoFD, determining the uncertainty in the x and y directions. The R verification program, version developed by the R Foundation for Statistical Computing, was used to calculate the confidence intervals with an alpha of 0.05 for 1000 iterations. Examples of uncertainty in the ROC diagrams are shown and discussed later in more detail (see section 3.1). These confidence intervals prove valuable in 15
27 the selection of optimal thresholds and the interpretation of the verification statistics calculated to gauge the performance of the WPFP (see Table 4). Table 4: Description of verification statistics Statistic Formula Range Definition 0 to 1; Perfect is Fraction of observed events PoD Hits / (Hits + Misses) 1 that were correctly forecast PoFD False Alarm Ratio Accuracy Threat Score Bias Score True Skill Statistic Heidke Skill Score FA / (CN + FA) FA / (Hits + FA) (Hits + CN) / Total Hits / (Hits + Misses + FA) (Hits + FA) / (Hits + Misses) PoD PoFD 2C ratio (POD-PoFD)/(((C ratio *POD) + POD)(C ratio 1)+C ratio + 1 Where C ratio = Total Observed Yes/Total Observed No 0 to 1; Perfect is 0 0 to 1; Perfect is 0 0 to 1; Perfect is 1 0 to 1; Perfect is 1 0 to Infinity; Perfect is 1-1 to 1; Perfect is 1, 0 indicates no skill -1 to 1; Perfect is 1, 0 indicates no skill A measure of the product s ability to forecast non-events A measure of the product s ability to forecast events Fraction of events that were correctly forecast A measure of how well the forecast yes events correspond to the observed events Indicates if the product under forecasts (BIAS <1) or over forecasts (BIAS >1) A measure of how well the product distinguishes observed events from nonobserved events Presents the skill as a percentage improvement over the skill expected due to random chance 16
28 : Reliability and Frequency Distribution Diagrams Reliability diagrams are frequently used for assessing probability forecasts for binary events (Wilks 1995). To construct one of these diagrams, probability forecasts ranging from 0 100%, generally placed in 10% interval bins, are plotted on the x-axis and the observed relative frequency of event occurrence is calculated, per bin, and plotted on the y-axis. Figure 8 A-F show a series of hypothetical reliability diagrams demonstrating observed frequency as a function of forecast probability with various outcomes one may expect (Hamill 1997). Depending on where the reliability plot falls in relation to the desired diagonal line (where the forecast probability is equivalent to the observed frequency) indicates whether the product is under (above the diagonal) or over (below the diagonal) forecasting. In theory, a perfect forecast system will result in forecasts with a given probability being consistent with the observed frequency (Hartmann 2002). Frequency distributions (FD), also known as sharpness diagrams, are shown in the corner of each diagram. FD plots display the forecast probability from 0 100% on the x- axis and the number of times forecast on the y-axis (Jolliffe et. al 2003). 17
29 Figure 8: Hypothetical reliability diagrams showing observed relative frequency as a function of forecast probability for (a) climatological forecasts, (b) forecasts exhibiting minimal resolution, (c) forecasts showing an under-forecasting bias, (d) forecasts showing good resolution at the expense of reliability, (e) reliable forecasts of a rare event, and (f) verification dataset limited by small sample size. Inset boxes are frequency distributions (Wilks 1995). In addition to the ROC curves and the statistics listed in Table 4, reliability and frequency distribution diagrams were constructed for all wind speed criteria and forecast time intervals to help evaluate the performance of the WPFP (see section for more detail). These diagrams do not require the use of a defined threshold value for product evaluation but instead are a direct comparison of the model probabilities to observed frequency. 18
30 3. RESULTS The work presented herein focuses on the performance of the National Hurricane Center s Tropical Cyclone Wind Speed Probability Forecast Product (WFPF) for land-threatening and land-falling storms. Recall, by land-threatening we are referring to storms that might make land-fall or, a possibility exists that coastal cities in our area of interest will be affected by tropical storm (34-63 kt, m/s) or hurricane (64+ kt, 33+ m/s) force winds. Assessment includes direct evaluation of the product s probabilities as well as through the use of skill scores developed for binary forecasts. Relative Operating Characteristics (ROC) diagrams are also constructed to assess the quality of the forecast system derived from the position of the curve (see section 3.1 for more detail). Optimal thresholds are then selected to transform the probabilities into binary (yes/no) forecasts. 19
 Diagrams")
31 3.1: Relative Operating Characteristics (ROC) Diagrams A B 20
32 C D 21


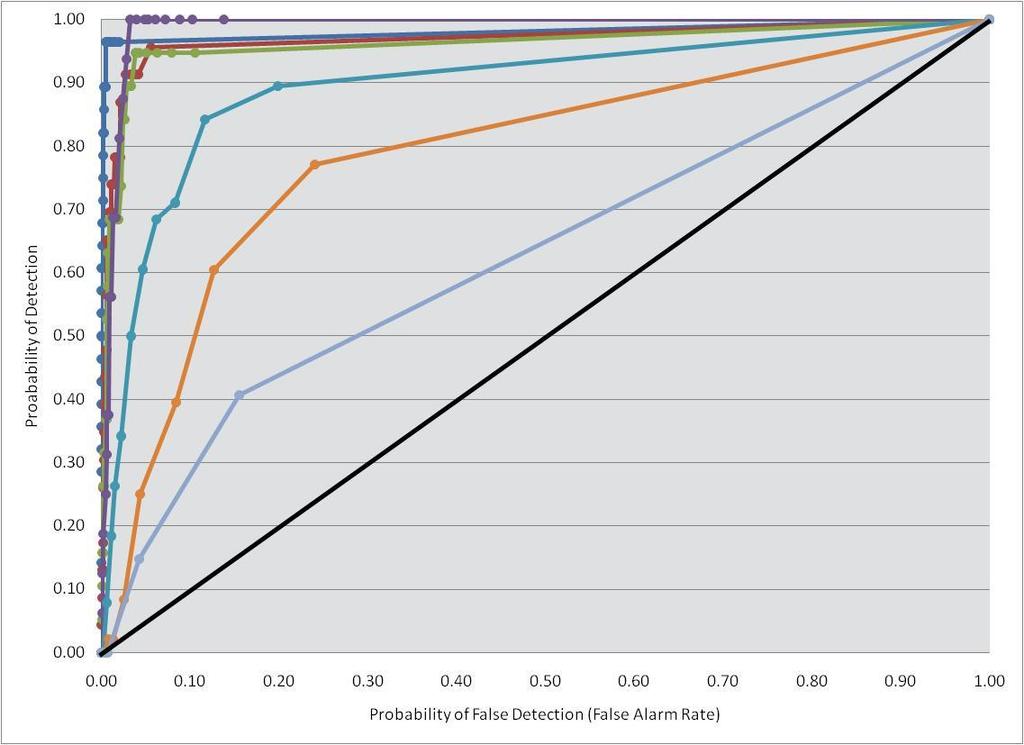
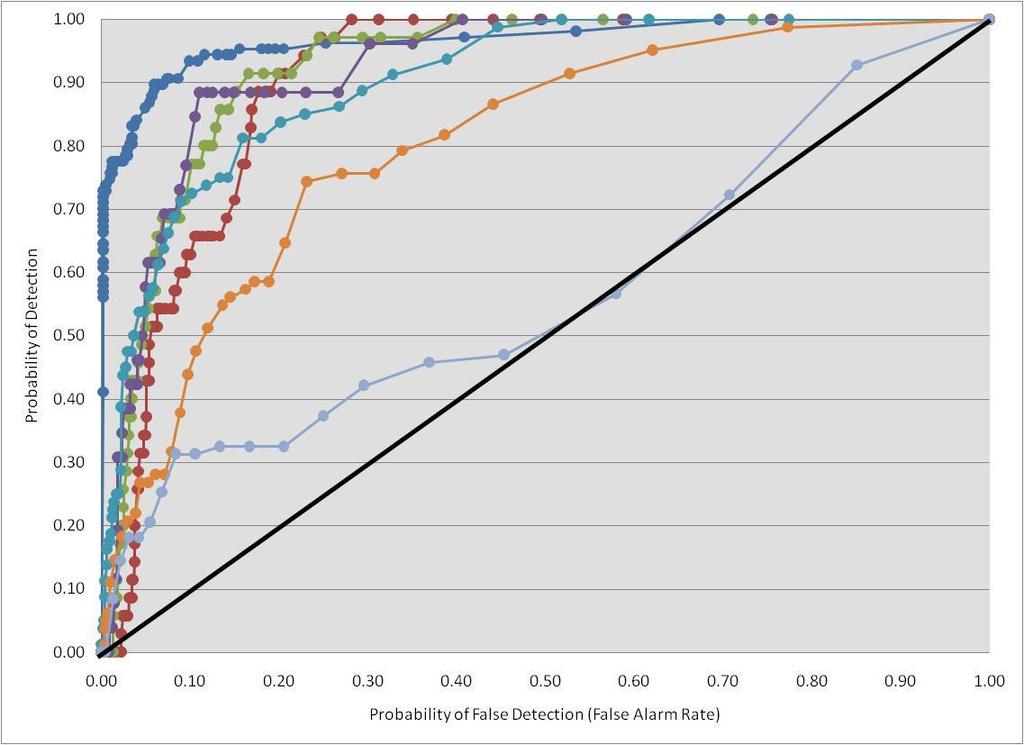
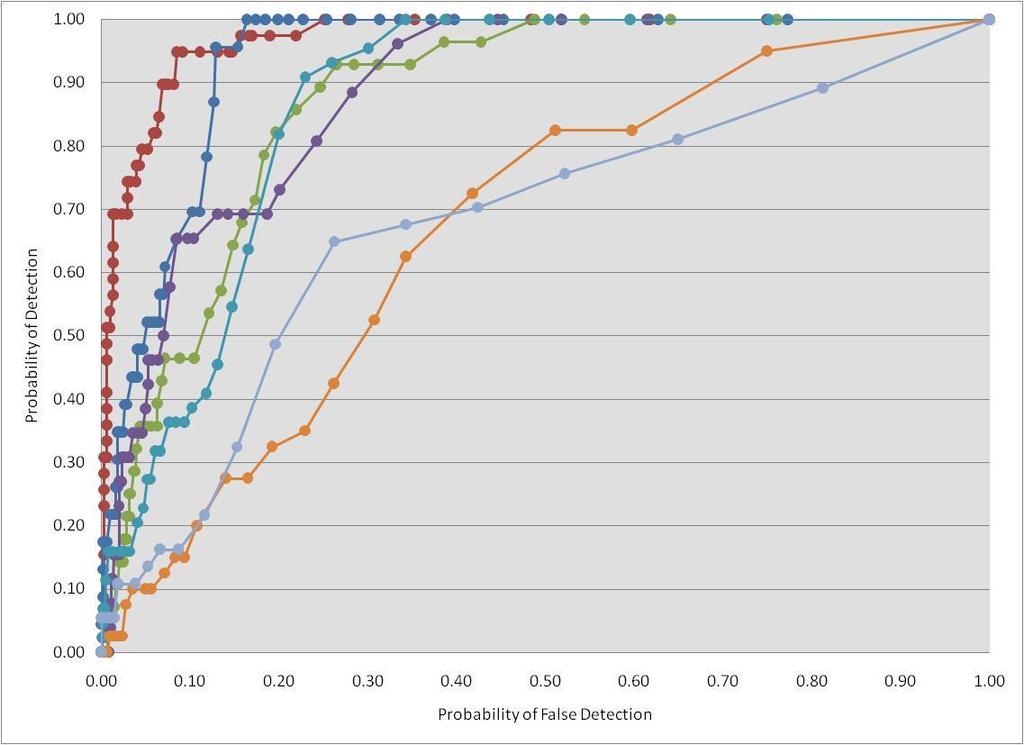
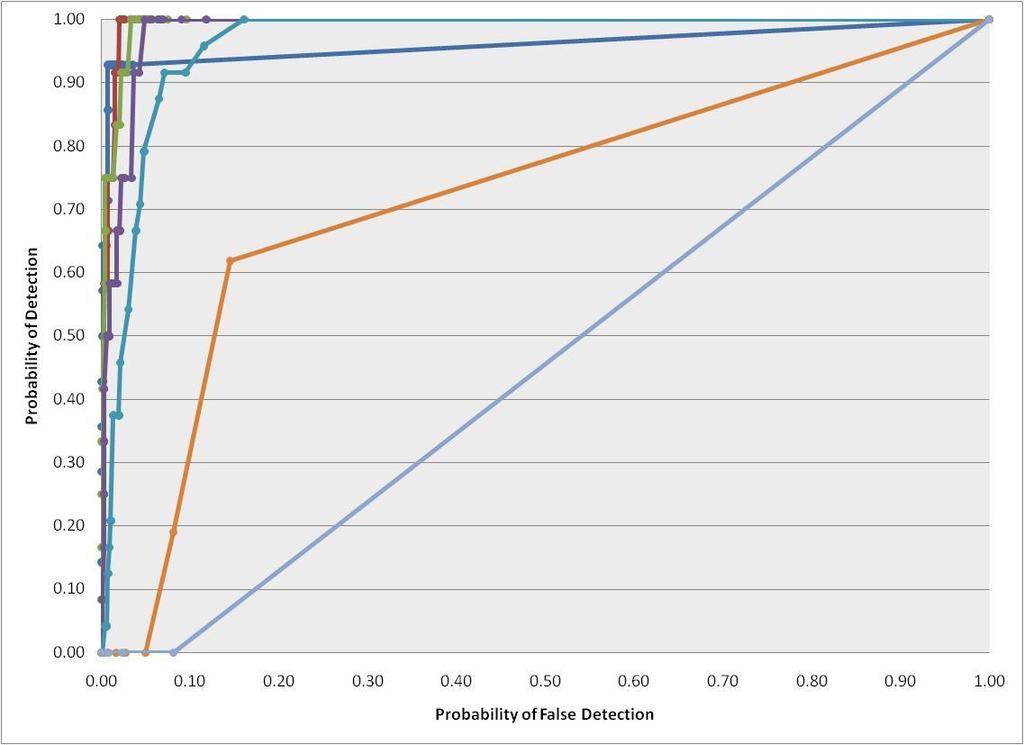
33 E F Figure 9: Relative Operating Characteristics (ROC) diagrams for the Cocoa Beach, FL AOI for 34 kt, 50 kt and 64 kt wind radii with X forecasts A, B, C respectively and 34 kt, 50 kt, and 64 kt wind radii without X forecasts, D, E, F respectively. See text for details. 22
34 As previously mentioned ROC-diagrams were constructed for each wind speed criteria and forecast time interval for a given area of interest (AOI). Figures 9 A F show these diagrams for the Cocoa Beach, FL AOI. To evaluate the skill of the forecast system, based on the ROC-diagram, we are interested in where the ROC-curve lies in relation to the PoD = PoFD line (indicated by the bold black line on the diagram). Because there is skill only when the hit rate (PoD) exceeds the false alarm rate (PoFD), the ROC curve will lie above the 45 degree line (PoD = PoFD) if the forecast system is skillful and the area under the curve will exceed 0.5. If the curve lies below the line, negative skill is indicated (Mason et. al 1999). 23
35 The ROC diagram in Figure 9.A shows each ROC-curve for the 34 kt (17 m/s) wind speed criteria at each of the seven forecast time intervals (12, 24, 36, 48, 72, 96, and 120 h). As the forecast time interval increases, the ROC-curve approaches the PoD = PoFD (no skill) line. As expected, we see the area under the curve decrease, from 0.97 to 0.76, for the 12 h and 120 h forecast time intervals respectively. This trend is evident in all ROC-curves within this AOI when X forecasts are included as well as when they are not. This suggests that as the forecast time interval increases, the skill of the forecast system decreases for all wind speed criteria. In order to evaluate the robustness of the ROC curves, and to distinguish one curve as significantly different from another, we incorporate an estimate of the uncertainty via the bootstrap technique (see section ). If the confidence intervals do not overlap, the curves are significantly different from one another. Figures 10.A and 10.B show the uncertainty in the ROC curves for the 34 kt wind speed criteria for the Cocoa Beach, FL AOI with and without X forecasts respectively. In both scenarios, although not as distinct in the earlier forecast time intervals (12 48 h), the ROC curves are significantly different; thus there is a clear deterioration in skill as the forecast time interval increases. Similar results exist for all wind speed criteria and additional AOI s. 24
 with X")

36 A B Figure 10: 34 kt ROC diagrams with confidence intervals plotted using the bootstrap technique for the Cocoa Beach, FL AOI A) with X forecasts, B) without X forecasts. 12 h: Dark Blue, 24 h: Red, 36 h: Green, 48 h: Purple, 72 h: Light Blue, 96 h: Orange, 120 h: Magenta. 25
37 Figures 9.A and 9.D show the ROC diagrams for the 34 kt (17m/s) wind speed criteria with X forecasts included and without respectively. Comparing the two diagrams for the same forecast time intervals, it appears that the ROC curves in Figure 9.D have less skill than the curves with the same forecast time interval in Figure 9.A. To determine whether or not this is the case, we consider the confidence intervals of the ROC curves. As an example, consider the 34 kt, 12 h forecast time interval ROC curves with and without X forecasts (Figure 11). It appears the two curves are different in what might be considered to be critical part of the diagram, i.e., towards the upper left hand corner (zoomed in), but are the same elsewhere. 26


38 Figure 11: ROC curves with confidence intervals plotted for the 34 kt, 12 h forecast time interval. The blue line is with X forecasts included, the red is without. As a result of including the X forecasts, the PoD is greater with this data set due to the greater number of CN events. In some cases this will affect the selection of the optimal threshold value as a result of the change in the distribution of the points that constitute the ROC curve. The data points shift towards the bottom left corner with the large number of CNs skewing the data set (see Figure 12). 27
39 1% 1% 16% Optimal Threshold 8% Optimal Threshold Figure 12: Illustration of X forecasts affect on ROC curves and optimal threshold selection for the visual optimal selection method. Blue: With X, Red: No X for the Cocoa Beach, FL AOI 34 kt, 24 h forecast time interval 28
40 Consider another impact of the CN forecasts on the ROC curves. When comparing the 64 kt (33 m/s), 120 h forecast time interval curves in Figures 9.C and 9.F, the curve in 9.C is skillful. The curve lies above the PoD = PoFD line and the area under the curve is greater than 0.5 (area is 0.63). However, when a majority of the CN forecasts are removed, the curve has negative skill (see Figure 9.F). The CN forecasts affect the quality of the forecast system (based on the interpretation of the ROC diagram discussed in section ) and affect the optimal thresholds selected depending on which data set, X or No X, is evaluated. All wind speed criteria and AOI s exhibited similar trends. As expected, the skill of the forecast system decreases as the forecast time interval increases, and the overall skill of the system is lower when the X forecasts are removed from the data set (Figures 9.D, E, F). The comparison of the two data sets may suggest the exclusion of the X forecasts gives a more accurate representation of the skill of the forecast system by eliminating the affects of the large number of CN forecasts. Note however, by excluding the X forecast events, there are occasional instances when missed forecasts (i.e. events forecast not to occur but did), which should be included in the evaluation of the product s performance, are eliminated. ROCdiagrams for all remaining AOI s are shown in appendices. 29
41 3.2: Optimal Thresholds As previously discussed, one method that can be used to identify an optimal threshold value is to choose a value that minimizes false alarms and maximizes the number of hits. In this approach, the highest skill (i.e. optimal threshold) is represented by the ROC data point that is closest to the upper left corner of the diagram. Note however, this is not the only method for selection of the optimal threshold. Many skill scores exist from which one can select an optimal threshold. In addition to the various skill scores, an optimal threshold can be based on cost/benefit/risk analyses (not conducted here) that are tailored to the specific needs of the customer (e.g. NASA s interest in protecting the space shuttle). For this study, we include threshold value estimates based on the optimization of TSS and HSS. Many discussions exist regarding which metric is best. The TSS is widely used in verification statistics and is recommended as a proper formulation of a skill score (Murphy and Daan 1985). However, Doswell et. al (1990) argue that the TSS has difficulty dealing with cases involving the forecast of rare events and thus recommend the HSS as a better metric. In rare event situations, the number of CN forecasts may be much larger than the numbers for the other quantities in the contingency table (e.g. Table 3) (Jollife 2003). This results in potentially misrepresentative values of PoD and PoFD thereby affecting the resulting ROC curves and optimal threshold selection. Recall, the HSS is designed to account for the proportion of forecasts that would have been correct by 30
42 chance in the absence of skill. As a result, the HSS may be a better metric to estimate the PoD and PoFD and thus an improved optimal threshold. A measure of sensitivity of the optimal threshold to the threshold selection method and data set was determined by evaluating the consistency of the optimal threshold values as a function of time, wind speed, and AOI. The three selection methods are as follows: Visual -- selecting the data point closest to the upper left corner of diagram maximizing PoD and minimizing PoFD, TSS -- selecting data point with maximum vertical distance to the PoD = PoFD line, and HSS the probability threshold corresponding to maximum HSS value. 31
43 Table 5: Maximum probability forecast as a function of wind speed criteria and forecast time interval issued for the Cocoa Beach, FL AOI. All hurricane seasons included. Max Probability Forecast Forecast Interval 34 Kts 50 Kts 64 Kts 12 h h h h h h h
44 Table 6: Optimal thresholds selected for Cocoa Beach, FL AOI A) with X forecasts and B) without X forecasts. Results from each method of selection listed. A 34 Kt 50 Kt 64 Kt Forecast Int. Visual TSS HSS Visual TSS HSS Visual TSS HSS 12 hr hr hr hr hr hr hr B 34 Kt 50 Kt 64 Kt Forecast Int. Visual TSS HSS Visual TSS HSS Visual TSS HSS 12 hr hr hr hr hr hr hr

45 Figure 13.A: Optimal thresholds as a function of forecast time interval selected for Cocoa Beach, FL AOI for the 34 kt wind speed criteria. 34

46 Figure 13.B: Same as 13.A for 50 kt wind speed criteria Figure 13.C: Same as 13.A for 64 kt wind speed 35
47 Table 5 lists the maximum probabilities forecast for each wind speed criteria and forecast time interval for the Cocoa Beach, FL AOI. Notice as the forecast time interval increases, the maximum forecast probability decreases monotonically. This is an expected trend given the nature of the forecast system; there is less skill at increased lead times. Similarly, one might expect as the forecast time interval increases, the value of the optimal threshold will decrease monotonically. However, Tables 6.A and 6.B both indicate the expected trend is not evident regardless of data set and optimal threshold selection method. When the X forecasts are included in the data set, the visual and TSS methods indicate the values increase as the forecast approaches the 48 h interval and then decrease as expected. The HSS has a similar trend however the values begin to decrease at the 24 h forecast time interval. Regardless of data set, the optimal thresholds behave similarly however the monotonic trend is weak when X forecasts are removed. This is particularly true for the visual and TSS selection methods for the 34 kt wind speed criteria. The optimal threshold values change very little regardless of forecast time interval. Similarly, optimal thresholds selected using the HSS method show little variation for both data sets as well as for all wind speeds and forecast time intervals. The behavior of the optimal thresholds as a function of time is consistent for all wind speed criteria (see Figures 13.A, B and C for graphical representation of optimal thresholds). Ultimately, the visual and TSS optimal threshold selection methods are sensitive to the inclusion/exclusion of X forecasts in the data set. The 36
48 HSS selection method is more consistent regardless of data set and instills more confidence when making yes/no based operational decisions. For the early forecast time intervals (12 36 h) the visual and TSS methods returned higher optimal threshold values when X forecasts were excluded from the data set. The optimal thresholds for later forecast time intervals ( h) showed the values were similar. Note however, there are some exceptions. Consider, for example, the 34 kt, 120 h forecast time interval optimal thresholds (see Table 6.A and 6.B). When X forecasts are included in the data set, the visual and TSS methods have an optimal threshold of 1% while HSS is at 12%. If the X forecasts are removed from the data set, all three methods exhibit the same 12% optimal threshold. From a decision maker s perspective, 1% as an optimal threshold is not as valuable as 12%. A value of 1% is at the extreme end of all possible threshold values and does not instill much confidence in decision making situations. 37

49 Figure 14.A: PoD, PoFD, TSS and HSS as a function of probability forecast for the 34 kt wind speed criteria at the 120 h forecast time interval with X forecasts included in the data set 38

50 Figure 14.B: Same as figure 14.A without X forecasts in data set The choice of data set, with X forecasts or without, has a strong influence on the optimal threshold selection using the visual and TSS methods, especially in the earlier forecast intervals. The HSS accounts for the proportion of forecasts that would have been correct by chance in the absence of skill. Figure 14 shows the HSS values calculated for each threshold with and without X forecasts respectively for the 34 kt wind speed criteria and 12 h forecast time interval. Comparing the two curves, the HSS does not change much regardless of whether or not X forecasts are 39
51 included in the data set. Notice, as a function of probability threshold, HSS remains relatively constant from 15% to 80%; no distinct peak in the HSS exists to undoubtedly determine the optimal threshold. For this wind speed and forecast time interval, the optimal threshold, based on HSS, was found to be 50%. This threshold sits in the middle of the flat area of HSS values and has some uncertainty associated with it; as do all threshold values. To account for this uncertainty, HSS was recalculated with the PoD and PoFD associated with the lower vertical confidence interval at the 50% threshold (see Figure 11). The values of PoD and PoFD at this confidence interval are 0.71 and 0.01 resulting in an HSS of This suggests any probability threshold with an HSS value greater than 0.70 could just as easily been labeled the optimal threshold when considering the uncertainty in the skill score (see Figure 15). 40

52 Figure 15: HSS (y-axis) as a function of probability forecast for the 34 kt wind speed criteria at the 12 h forecast time interval with X forecasts (Purple) and without (Green). Black line is HSS = 0.70; calculated from PoD and PoFD based on lower vertical confidence interval. See text for detail. Optimal thresholds were selected for each wind speed criteria and forecast time interval using three different selection methods (visual, TSS, and HSS). The sensitivity of the optimal thresholds to threshold selection method and data set (with X or no X) was examined by evaluating the consistency of the thresholds obtained for each. As stated previously, the thresholds were expected to decrease monotonically as the forecast time interval increased. Ultimately, TSS proved sensitive to the X forecasts while HSS remained consistent. 41
53 In some cases there are distinct peaks in the skill (TSS and HSS) as a function of probability forecast -- thereby indicating a clear optimal threshold selection (see Figures 14.A and 14.B). However, there are also flat areas in the various skill scores implying the exact optimal threshold is not as clear. Although TSS and HSS are both frequently used as forecast skill metrics, there is quite a difference in their characteristics and resulting optimal threshold values. Haklander et. al (2003) suggest a new skill score by combining both the TSS and HSS. This score, the Normalized Skill Score (NSS) is defined as follows: NSS (%) = 0.5*( (TSS (%) / TSS max ) + (HSS (%) / HSS max ) ), where TSSmax and HSSmax is the maximum TSS and HSS value respectively for any probability threshold (%). The maximum values for TSS and HSS do not necessarily occur for the same probability threshold (Haklander 2003). The NSS may return optimal thresholds where the peak in TSS and flat areas associated with HSS overlap for applicable indicating a more accurate optimal threshold. It is recommended, for future work, that the NSS be applied as an additional metric for determining optimal thresholds. 42
54 3.3: Product Evaluation 3.3.1: Optimal Threshold Based Statistics Heretofore we have presented an evaluation of the WPFP based on two data sets (one with X forecasts, one without) and a variety of verification statistics. Given the behavior and sensitivity of the optimal thresholds discussed, the product performance is now gauged solely using thresholds derived from the no X forecast data set. The resulting performance metrics (see Table 4) are based on the optimal thresholds selected optimizing two commonly used skill scores, TSS and HSS. 43


55 Figure 16.A: Accuracy vs. forecast time interval based on the optimal thresholds selected using the TSS method per wind speed criteria (34 kt Blue, 50 kt Red, 64 kt Green) and forecast time interval for the Cocoa Beach, FL AOI. Figure 16.B: Same as 16.A using the HSS optimal threshold selection method 44
56 Figure 16.C: Accuracy vs. forecast time interval based on the optimal thresholds selected using the TSS (Blue) and HSS (Red) methods for the 34 kt wind speed criteria per forecast time interval for the Cocoa Beach, FL AOI. Black line depicts hypothetical accuracy if the forecasts were always no. 45
 /")
 /")
57 Figure 17.A: Bias Score (Table 4; Bias = (Hits + FA) / (Hits + Misses)). Same criteria as 16.A Figure 17.B: Bias Score (Table 4; Bias = (Hits + FA) / (Hits + Misses)). Same criteria as 16.B 46


58 Figure 18.A: Probability of Detection (Table 4; PoD = Hits / Hits + Misses)). Same criteria as 16.A Figure 18.B: Probability of Detection Table 4; PoD = Hits / Hits + Misses)). Same criteria as 15.B 47
). Same criteria as 16.")
59 Figure 19.A: Probability of False Detection (Table 4; PoFD = FA / (Hits + FA)). Same criteria as 16.A Figure 19.B: Probability of False Detection (Table 4; PoFD = FA / (Hits + FA)). Same criteria as 16.B 48
). Same criteria as 16.")
60 Figure 20.A: Threat Score (Table 4; Threat Score = Hits / (Hits + Misses + FA)). Same criteria as 16.A Figure 20.B: Threat Score (Table 4; Threat Score = Hits / (Hits + Misses + FA)). Same criteria as 16.B 49


61 Figure 21.A: False Alarm Ratio (Table 4; FAR = FA / (Hits + FA)). Same criteria as 16.A Figure 21.B: False Alarm Ratio (Table 4; FAR = FA / (Hits + FA)). Same criteria as 16.B 50


62 Figure 22.A: True Skill Statistic (Table 4; TSS = PoD PoFD). Same criteria as 16.A Figure 22.B: True Skill Statistic (Table 4; TSS = PoD PoFD). Same criteria as 16.B 51
/(((C ratio *POD) + POD)(C ratio 1)+C ratio + 1, Where C ratio = Total Observed Yes/Total Observed No. Same criteria as 16.")
63 Figure 23.A: Heidke Skill Score (Table 4; HSS = 2C ratio (POD- PoFD)/(((C ratio *POD) + POD)(C ratio 1)+C ratio + 1, Where C ratio = Total Observed Yes/Total Observed No. Same criteria as 16.A Figure 23.B: Heidke Skill Score (Table 4; HSS = 2C ratio (POD- PoFD)/(((C ratio *POD) + POD)(C ratio 1)+C ratio + 1, Where C ratio = Total Observed Yes/Total Observed No. Same criteria as 16.B 52
64 Accuracy, also known as percent correct, is one of several commonly used forecast verification statistics (see Table 4). This statistic, by definition, is greatly influenced by the number of CN forecasts and can inflate when the data set is dominated by them. Accuracy values as a function of forecast time interval are depicted, for the TSS and HSS optimal threshold selection methods, in Figures 16.A and 16.B respectively for the Cocoa Beach, FL AOI. Comparing the two figures, the HSS based accuracy is higher as a function of forecast interval and wind speed criteria than the TSS based results. Regardless of forecast time interval and wind speed criteria, the HSS based accuracy remains around 90% while the TSS method fluctuates between 70% and 90%. However, both selection methods return values of accuracy less than what it would be if the simplistic scenario, always no, forecast was issued every time. For example, consider the 34 kt wind speed criteria at each forecast time interval. The accuracy is recalculated for forecasting always no and is plotted against the original accuracy calculated using the TSS and HSS selection methods (see Figure 16.C). Both the TSS and HSS methods show accuracy below the skill line of the simplistic forecast. The problem is that accuracy does not penalize the simplistic forecast for missed forecasts. Overall, accuracy can give a false sense of skill in the forecast system and is not a reliable single performance metric. Although both optimal threshold selection methods returned values of accuracy lower than if the forecast was always no, other performance metrics show some skill in the forecast system 53
65 (discussed later). The remaining metrics perform poorly if the forecast is always no. Figures 17.A and 17.B show the results of the bias score for the WFPF based on the TSS and HSS optimal threshold selection methods respectively. Recall, bias score (perfect score is 1.00) is an indication of how much the forecast system over or under forecasts events (see Table 4). Comparing the bias scores between the two optimal threshold methods, larger values are found when TSS is optimized. Bias scores ranged from 0.00 to 8.00, generally increasing as the forecast time interval increased indicating that the forecast system is over forecasting events (i.e., bias is greater than 1.00). Using the HSS optimal threshold selection method, bias values ranged between 1.00 and 2.00 and increases with forecast time interval. The bias score indicates the forecast system over forecasts regardless of threshold selection method. Based on the bias metric, HSS is a better score in which to select the optimal thresholds. However, it is clear that it is not sensible to base performance on a single metric! Consider the PoD and PoFD per wind speed criteria and forecast time interval for each optimal threshold selection method (see Figures 18.A, B and 19.A, B). Based on the optimization of TSS, the WPFP over forecasts more (greater bias scores) producing higher values of PoD and PoFD. Conversely, the PoD and PoFD, is lower using the HSS method. There are, however, some outliers worth discussing. For example, Figures 18.A and 18.B show a significant decrease in PoD at the 120 h forecast time interval. This 54
66 behavior is due to the distribution of Hits, Misses, FAs and CNs within the data set. If we examine the 64 kt, 120 h forecast time interval no Hits and only one Missed forecast exist. The number of occurred events is low for this wind speed and forecast time interval indicating the sample size is too small. Recall from Table 4, PoD = Hits / (Hits + Misses), indicating PoD = 0.00 at this wind speed and forecast time interval. Figure 19.B shows a distinct peak in the 64 kt wind speed criteria at the 96 h forecast time interval. Again, this is due to the number of Hits, Misses, FAs and CNs in the data set. Recall from Table 4, PoFD = FA / (CN + FA). At the 96 h forecast time interval, the amount of FAs is considerably higher than the remaining forecast time intervals (see Table 7). 55
67 Table 7: The distribution of FAs and CNs for the 64 kt wind speed criteria according to the optimal threshold (%) selected per forecast interval for Cocoa Beach, FL AOI. Optimal thresholds (%) according to HSS selection method in parentheses next to forecast time interval. Forecast Time Interval False Alarms (FA) Correct Negatives (CN) PoFD 12 h (14) h (32) h (21) h (14) h (6) h (2) h (6) Table 8: The distribution of Hits, Misses, FAs and CNs for the 34 kt wind speed criteria according to the optimal threshold (%) selected per forecast interval for the Cocoa Beach, FL AOI. Optimal thresholds (%) according to TSS selection method in parentheses next to forecast time interval. Forecast Time Interval Hit Miss FA CN Threat Score 12 h (23) h (10) h (14) h (16) h (12) h (9) h (12) Table 9: Same as Table 8 according to HSS optimal threshold selection method 56
68 Forecast Time Interval Hit Miss FA CN Threat Score 12 h (50) h (51) h (33) h (33) h (28) h (17) h (12) Figures 20.A and 20.B show the threat score, commonly referred to as the Critical Success Index, for each wind speed criteria and forecast time interval for the Cocoa Beach, FL AOI. This statistic is a measure of how well the event forecast to occur probabilities and observed events correspond to one another (see Table 4). Unlike TSS, HSS, and accuracy, threat score is not influenced by CN forecasts and focuses only on the forecast to occur events (Schaefer 1990). As a function of forecast time interval, the threat score is expected to decrease as forecast time interval increases. Recall from the bias score, the forecast system over forecasts; this is especially true at longer forecast time intervals. This suggests the number of FA forecasts will increase as the forecast time interval increases. Consider, for example, the 34 kt wind speed criteria; Tables 8 and 9 show the distribution of Hit, Miss, FA and CN forecasts at all forecast time intervals for this wind speed. Generally, as the forecast time interval increases, there is an increase in the number of FA forecasts. In addition, the false alarm ratio (see Table 4) is calculated for all forecast time intervals and reflects the increasing trend in FA 57
69 forecasts (see Figures 21.A and 21.B). Similar results exist for all wind speed criteria. Notice there is a significant decrease in threat score, and similar increase in false alarm ratio, between the 12 h and remaining forecast time intervals. These differences are driven by the lower number of FA forecasts at the 12 h lead time and comparatively high FA forecasts at all additional forecast time intervals. Recall threat score ranges from 0 (all forecasts are incorrect) to 1 (all forecasts are correct). Values of threat score for the Cocoa Beach, FL AOI were found to be lower than 0.50 with the exception of the 12 h forecast time interval. These scores are seemingly low however according to studies performed by Kuligowskil et. al (2001) and McDonald et. al (2000), results from this project are similar and considered good performance values of threat score. TSS and HSS have been utilized throughout this study to select optimal threshold values. Based on the optimal thresholds, these scores can also be used as measures of skill to gauge the performance of the WPFP. Recall, TSS is a measure of how well the product distinguishes observed events from non-observed events. HSS presents the skill of the forecast system as a percentage improvement over the skill expected due to random chance (Table 4). Figures 22.A, B and 23.A, B show the TSS and HSS respectively as a function of forecast time interval for the Cocoa Beach, FL AOI. Regardless of optimal threshold selection method, TSS shows a gradual decrease in skill as the forecast lead time increases. This trend is expected due to the nature of a forecast system. Regardless of optimal threshold selection 58
70 method, values of TSS remain between 0.50 and 0.85 in the early forecast time intervals (12 h 48 h). These values are considered desirable based on results from a study performed by John Beven in 2008 showing TSS also ranging between 0.50 and The skill of the forecast system is still within the desirable range for the 34 kt and 50kt wind speeds at the 72 h interval however all wind speed criteria drop below 0.50 in the 96 h and 120 h forecast time intervals. Values of HSS also decrease as forecast time increases regardless of optimal threshold selection method. Notice, there is a significant decrease in skill from the 12 h to 24 h forecast time interval (see Figures 23.A and 23.B). This is driven by the comparatively low amount of CN and FA forecasts and high number of Hit forecasts based on the optimal threshold selected at the 12 h forecast interval. Overall, resulting values of HSS convey skill in the forecast system greater than the skill expected due to random chance for the 12 h to 72 h forecast time intervals. Values of HSS remain above 0.30, with the exception of the 64 kt wind speed based on the TSS optimal threshold selection, and the forecast system is considered skillful (Chu 2007). The remaining forecast time intervals show little to no improvement in skill compared to skill due to random chance. Arguments have been made supporting both TSS and HSS as the best metric for selecting optimal thresholds. However, the choice is left to the user to decide depending on their individual needs. Some, for example, may prefer optimizing based on TSS due to higher values of PoD; FA forecasts may not be a 59
71 concern. Conversely, some users may prefer the HSS method due to lower PoFD and bias scores interpreting this as a better performance metric. An objective of this project is not to decide for the user which method is best, but instead, based on each commonly used metric, gauge the performance of the WPFP : Frequency Distribution and Reliability Diagrams In addition to the optimal threshold based statistics used to gauge the performance of the WPFP, frequency distribution and reliability diagrams were also constructed to assess the probability forecasts. These diagrams do not require the use of a defined threshold value for product evaluation but instead is a direct comparison of the model probabilities to observed frequency. 60

72 Figure 24.A: Frequency Distribution diagram constructed for the 34 kt, 12 h forecast interval for the Cocoa Beach, FL AOI Figure 24.B: Reliability diagram constructed for the 34 kt, 12 h forecast time interval for the Cocoa Beach, FL AOI 61

73 Figure 25.A: Same as Figure 24.A for the 24 h forecast time interval Figure 25.B: Same as Figure 24.B for the 24 h forecast time interval 62

74 Figure 26.A: Same as Figure 24.A for the 36 h forecast time interval Figure 26.B: Same as Figure 24.B for the 36 h forecast time interval 63
75 Figure 27.A: Same as Figure 24.A for the 48 h forecast time interval Figure 27.B: Same as Figure 24.B for the 48 h forecast time interval 64
76 Figure 28.A: Same as Figure 24.A for the 72 h forecast time interval Figure 28.B: Same as Figure 24.B for the 72 h forecast time interval 65

77 Figure 29.A: Same as Figure 24.A for the 96 h forecast time interval Figure 29.B: Same as Figure 24.B for the 96 h forecast time interval 66
78 Figure 30.A: Same as Figure 24.A for the 120 h forecast time interval Figure 30.B: Same as Figure 24.B for the 120 h forecast time interval : Frequency Distribution Diagrams Figures A show the frequency distribution diagrams for the Cocoa Beach, FL AOI for the 34 kt wind speed criteria at each forecast time interval. These diagrams indicate the number of times a given probability was forecast. Preferably, at the earlier forecast time intervals, the distribution of the forecasts should be sharp (i.e. majority of the forecasts should be at the extremes of the probability forecasts). Notice, at the 12 h forecast time interval the distribution shows a majority of the forecasts are less than 10% or greater than 95%. As the forecast time interval increases, the distribution becomes less sharp and the number 67
79 of lower probabilities increases; the 120 h forecast time interval shows all forecasts were of probabilities less than 20%. The frequency distributions show the breakdown of the probabilities within the data set which aids in the interpretation of the reliability diagrams constructed to evaluate the forecast probability product : Reliability Diagrams Recall, reliability diagrams are frequently used for assessing probability forecasts for binary events (Wilks 1995). Figures B show the reliability diagrams for the Cocoa Beach, FL AOI for the 34 kt wind speed criteria at each forecast time interval. Since the reliability diagrams are constructed with the probabilities in 10% bins, as opposed to plotting the reliability for each individual probability, the desired result (black line, i.e. Figure 24.B) is plotted using the bin mean. Depending on where the reliability plot falls in relation to the desired result indicates whether the product is under (above the desired result) or over (below the desired result) forecasting. In theory, a perfect forecast system will result in forecasts with a given probability being consistent with the observed frequency (Hartmann 2002). Notice in the early forecast time intervals, with the exception of the 12 h forecast, the reliability diagrams show the product is over forecasting. At the 12 h forecast time interval, the reliability plot, where the sample size is large, closely 68
80 follows the desired result (see Figure 24.A). However, figures B show the reliability plot is well below the desired result line. The later forecast time intervals (72 h 120 h) show the reliability plot closely follows the desired result indicating improved reliability and less over forecasting (see Figures B). Recall from section 3.2 the optimal thresholds selected using the TSS and HSS methods indicated over forecasting (bias greater than 1.00). Due to the information derived from the reliability diagrams, this result is not surprising given the product over forecasts in general! If the user chose to remove bias from the forecast system, the new optimal thresholds would be extremely high and the performance metrics would indicate poor skill values. For example, consider the hypothetical optimal thresholds selected by removing the bias for the 34 kt wind speed criteria for the Cocoa Beach, FL AOI (see Table 10). Table 10: Optimal thresholds selected optimizing TSS, HSS and Bias for the 34 kt wind speed criteria for the Cocoa Beach, FL AOI. TSS HSS Bias
81 Notice, with the exception of the 12 h forecast time interval, the optimal thresholds necessary to remove the bias in the forecast system are unreasonably high. This is particularly true for the earlier forecast time intervals (24 h 48 h). The skill of the forecast system is expected to decrease when the bias is removed because of these high threshold values. With optimal thresholds so high, the product begins to act as though it forecasts always no. Tables 11.A, 11.B and 11.C show the PoD, TSS and HSS at each forecast time interval for the 34 kt wind speed criteria for the Cocoa Beach, FL AOI. With the exception of the 12 h forecast time interval, the PoD decreases significantly when the bias score is optimized. Due to this, the TSS and HSS values also decrease. Note the PoFD, false alarm ratio and threat score did not show significant differences between the three optimal threshold selection methods. As a result of the significant drop in the PoD and resulting TSS and HSS values, it is not recommended that the threshold values are optimized based on the bias score. It would appear the HSS selection method is a sensible middle road between the other two methods. Nevertheless, the choice is left for the user to decide based on individual needs. Table 11.A: Performance metrics based on the optimal thresholds selected using the TSS method for 34 kt wind speed criteria for the Cocoa Beach, FL AOI TSS Method PoD TSS HSS 12 h h h
82 48 h h h h Table 11.B: Performance metrics based on the optimal thresholds selected using the HSS method for 34 kt wind speed criteria for the Cocoa Beach, FL AOI HSS Method PoD TSS HSS 12 h h h h h h h
83 Table 11.C: Performance metrics based on the optimal thresholds selected using the Bias method for 34 kt wind speed criteria for the Cocoa Beach, FL AOI Bias Method PoD TSS HSS 12 h h h h h h h Summary The purpose of this project is to evaluate the performance of the National Hurricane Center s Tropical Cyclone Wind Speed Probability Forecast Product (WPFP) and to determine how to best utilize the product for operational applications. Results are composited from the 2004 to 2007 hurricane seasons and include all tropical cyclones affecting areas of interest centered on Cocoa Beach, FL, Charleston, SC, Corpus Christi, TX and New Orleans, LA. Through the construction of ROC diagrams and the optimization of the True Skill Statistic (TSS) and the Heidke Skill Score (HSS), optimal thresholds were 72
84 determined for three wind speed criteria (34 kt, 50 kt, and 64 kt) at seven different forecast time intervals (12, 24, 36, 48, 72, 96, and 120 h) to convert the probabilities into binary (yes/no) forecasts. There are many verification statistics that exist based on binary forecasts which are used to gauge the performance of a forecast system. The optimal thresholds were selected based on two different data sets, one being a subset of the other. The original data set included X forecasts (representing forecasts less than 0.4%) which incorporated any missed forecasts (i.e. binary no forecasts that were incorrect) but also saturated the data set with correct negative forecasts (i.e. binary no forecasts that were correct). In order to test the impact of these events on the optimal threshold selection, a second data set was composited including only the probabilities greater than 0.4%. Ultimately, the optimal thresholds selected based on maximum TSS were sensitive to the data set. When X forecasts were included, the optimal threshold values were lower compared to when X forecasts were excluded from the data set. The HSS optimal threshold selection method proved to be more robust returning consistent optimal threshold values regardless of the data set. Overall, when comparing the optimal thresholds selected from each data set and selection method, the no X forecast data set instilled more confidence in the threshold values for decision make purposes. Due to this, verification statistics were based on the resulting optimal thresholds selected from the no X forecast data set. 73
85 As previously mentioned, many verification statistics exist based on binary forecasts for evaluating the performance of a forecast system. Overall, based on the optimal thresholds selected by optimizing TSS and HSS, the WPFP performed well. As expected, the skill of the forecast system decreased as the forecast time interval increased; nevertheless, the performance metrics (TSS, HSS, threat score etc.) remained within the acceptable range indicating skill, regardless of wind speed. This is particularly true during the earlier forecast times (12 h 72 h). In addition to the optimal threshold based verification statistics, reliability diagrams were constructed to assess the performance of the forecast system based on binary events. Recall, reliability diagrams demonstrate observed frequency as a function of forecast probability and do not depend of optimal threshold selection. In theory, a perfect forecast system will result in forecasts with a given probability being consistent with the observed frequency (Hartmann 2002). As previously discussed, the position of the reliability plot in relation to the desired result (the one-to-one line where probability forecast is equivalent to the observed frequency) is an indication of whether the product over or under forecasts. Ultimately, based on the reliability diagrams, the product was found to over forecast. This is particularly true in the earlier forecast time intervals. As the forecast time interval increased, with the exception of the 12 h forecast, less over forecasting was observed in the forecast system. 74
86 The sensitivity of the optimal thresholds and skill of the forecast system were determined by evaluating each as a function of forecast time, wind speed and AOI. Ultimately, the optimal thresholds did not behave as expected. Given the nature of a forecast system, the maximum probability forecast per time interval decreased monotonically as the forecast time increased. Due to this, the optimal thresholds were also expected to decrease this way. Instead, with the exception of the 12 h forecast, the optimal thresholds increased until the 48 h forecast interval and then decreased as expected. This trend in optimal thresholds existed regardless of selection method and was consistent for all wind speed criteria. Based on the threshold values selected, various verification statistics were calculated to aid in gauging the performance of the WPFP. Given the nature of a forecast system, the skill is expected to decrease as the forecast time interval increases. As evident from the bias score, threat score, TSS and HSS, this trend exists for all wind speed criteria. Once again, the 12 h forecast time interval is an outlier. Values of the previously mentioned skill scores were significantly higher at this time period. This difference was also reflected in the reliability diagrams. At the 12 h forecast time interval, the forecast system closely followed the desired trend. All successive time periods showed significant over forecasting in the system. These findings suggest the forecast system is treating the 12 h interval differently. It is currently unclear as to why this is the case however it will be investigated in greater detail as part of the future work of the project. 75
87 The evaluation of the performance of the WPFP is intended to aid in operational based yes/no decisions at Cape Canaveral Air Force Station and Kennedy Space Center. The optimal thresholds selected are tailored to fit the needs of a particular user to determine optimum strategy for any specific application (e.g., protecting the space shuttle and other resources). Based on the results of this study, it is recommended the 45 th Weather Squadron rely on the optimal thresholds selected using the Heidke Skill Score (HSS) optimal threshold selection method; however, the ultimate choice is left for the user. References Beven, J., 2008: Verification of National Hurricane Center Forecasts of Extratropical Transition. 28 th Conference on Hurricanes and Tropical Meteorology, 28 April 2 May 2008, Paper 10C.2 Cheng, R. C. 1995: Bootstrap methods in computer simulation experiments. 27th Conference on Winter Simulation, 3-6 December 1995, Chu, P., C. Lee, M. Lu, and X. Zhao, 2007: Climate Prediction of Tropical Cyclone Activity in the Vicinity of Taiwan Using the Multivariate Least Absolute Deviation Regression Method. Terr. Atmos. Ocean. Sci. Vol. 18, No. 4,
88 Department of Commerce, National Oceanic & Atmospheric Administration, National Weather Service, 2008: National Weather Service Instruction Operations and Services Tropical Cyclone Weather Services Program, NWSPD 10-6 TROPICAL CYCLONE PRODUCTS June 2008 Haklander, A.J., and A. Van Delden 2003: Thunderstorm predictors and their forecast skill for the Netherlands. Atmospheric Research. 5, 3584 Hartmann, H.C., Pagano, T.C., Sorooshiam, S. and Bales, R. 2002: Confidence builder: evaluating seasonal climate forecasts from user perspectives. Bull Amer. Met. Soc., 84, Harvey, L. O., K. R. Hammond, C. M. Lusk, and E. F. Mross, 1992: The application of signal detection theory to weather forecasting behavior. Mon. Wea. Rev., 120, Jolliffe, I.T., and D. B. Stephenson, 2004: Forecast Verification A Practitioner s Guide in Atmospheric Science. John Wiley & Sons Ltd, pg 48-51, Knabb, Richard, 2008: Tropical Cyclone Surface Wind Speed Probabilities (TCSWSP) in the National Digital Forecast Database (NDFD). Available from the website of the National Hurricane Center at Kuligowski, R.J., and A.P. Barros, 2001: Blending Multiresolution Satellite Data with Application to the Initialization of an Orographic Precipitation Model. J. Appl. Meteor., 40, Manzato, A. 2005: An Odds Ratio Parameterization for ROC Diagram and Skill Score Indices. Wea. and Forecasting, Vol. 20, Issue 6, December 2005, Mason, S.J., and N.E. Graham, 1999: Conditional Probabilities, Relative Operating Characteristics, and Relative Operating Levels. Wea. Forecasting, 14, McDonald, B. E., T. M. Graziano, and C. K. Kluepfel, 2000: The NWS National QPF Verification Program, 15th Conference on Hydrology, 9-14 Jan., American Meteorological Society,
89 Moskaitis, J., 2007: Verification of deterministic tropical cyclone intensity forecasts: Moving beyond mean absolute error, 28 th Conference on Hurricanes and Tropical Meteorology, June 2007, Paper 14A.7 Murphy, A.H., and H. Daan, 1985: Forecast Evaluation. Probability, Statistics, and Decision Making in Atmospheric Sciences, Westview Press, National Hurricane Center November 2006: Tropical Cyclone Wind Speed Probability Product Description. Available from the web site of the National Hurricane Center at National Oceanic and Atmospheric Administration 2004 FY Annual Performance Plan. Available from the web site of the National Oceanic and Atmospheric Administration at Schaefer, J.T., 1990: The Critical Success Index as an Indicator of Warning Skill. Wea. Forecasting, 5, Stefanova, L., and T.N. Krishnamurti, 2002: Interpretation of Seasonal Climate Forecast Using Brier Skill Score, The Florida State University Superensemble, and the AMIP-I Dataset. J. Climate, 15, Wilks, D. S 1995: Statistical Methods in the Atmospheric Sciences: An Introduction. Academic Press, 467 Winters, K. A., J. W. Weems, F. C. Flinn, G. B. Kubat, S. B. Cocks, and J. T. Madura, 2006: Providing Tropical Cyclone Weather Support to Space Launch Operations, 27th Conference on Hurricanes and Tropical Meteorology, April 2006, Paper 13A.5 Appendix A: Charleston, SC 78

90 A B 79
91 C D 80
 diagrams for the")

92 E F Figure A.1: Relative Operating Characteristics (ROC) diagrams for the Charleston, SC AOI for 34 kt, 50 kt and 64 kt wind radii with X forecasts A, B, C respectively and 34 kt, 50 kt, and 64 kt wind radii without X forecasts, D, E, F respectively. 81
93 Table A.1: Optimal thresholds selected for Charleston, SC AOI A) with X forecasts and B) without X forecasts. Results from TSS and HSS selection method listed. A 34 Kt 50 Kt 64 Kt Forecast Int. TSS HSS TSS HSS TSS HSS 12 hr hr hr hr hr hr hr B 34 Kt 50 Kt 64 Kt Forecast Int. TSS HSS TSS HSS TSS HSS 12 hr hr hr hr hr hr hr
94 Appendix B: New Orleans, LA A B 83
95 C D 84
 diagrams for the")

96 E F Figure B.1: Relative Operating Characteristics (ROC) diagrams for the New Orleans, LA AOI for 34 kt, 50 kt and 64 kt wind radii with X forecasts A, B, C respectively and 34 kt, 50 kt, and 64 kt wind radii without X forecasts, D, E, F respectively. 85
97 Table B.1: Optimal thresholds selected for New Orleans, LA AOI A) with X forecasts and B) without X forecasts. Results from TSS and HSS selection method listed. A 34 Kt 50 Kt 64 Kt Forecast Int. TSS HSS TSS HSS TSS HSS 12 hr hr hr hr hr hr hr B 34 Kt 50 Kt 64 Kt Forecast Int. TSS HSS TSS HSS TSS HSS 12 hr hr hr hr hr hr hr
98 Appendix C: Corpus Christi, TX A B 87
99 C D 88
 diagrams for the Corpus Christi, TX AOI for 34 kt, 50 kt and 64 kt wind radii with X")
100 E F Figure C.1: Relative Operating Characteristics (ROC) diagrams for the Corpus Christi, TX AOI for 34 kt, 50 kt and 64 kt wind radii with X forecasts A, B, C respectively and 34 kt, 50 kt, and 64 kt wind radii without X forecasts, D, E, F respectively. 89
Denis Nikolayevich Botambekov. Master of Science In Hydrometeorology Kazakh National University 2006
 Statistical Evaluation of the National Hurricane Center s Tropical Cyclone Wind Speed Probability Forecast Product by Denis Nikolayevich Botambekov Master of Science In Hydrometeorology Kazakh National
Evaluating Forecast Quality
 Evaluating Forecast Quality Simon J. Mason International Research Institute for Climate Prediction Questions How do we decide whether a forecast was correct? How do we decide whether a set of forecasts
NHC Ensemble/Probabilistic Guidance Products
 NHC Ensemble/Probabilistic Guidance Products Michael Brennan NOAA/NWS/NCEP/NHC Mark DeMaria NESDIS/STAR HFIP Ensemble Product Development Workshop 21 April 2010 Boulder, CO 1 Current Ensemble/Probability
The Local Wind Forecast and Its Uncertainty (Completing the Wind Forecast)
") The Local Wind Forecast and Its Uncertainty (Completing the Wind Forecast) Florida Governor Hurricane Conference May 11-16 2014 Pablo Santos Meteorologist In Charge NWS Miami/South Florida Forecast Office
The Local Wind Forecast and Its Uncertainty (Completing the Wind Forecast) Florida Governor Hurricane Conference May 11-16 2014 Pablo Santos Meteorologist In Charge NWS Miami/South Florida Forecast Office
Scenario-based Language for Hurricane Decision Support
 Scenario-based Language for Hurricane Decision Support David Sharp NOAA/National Weather Service Melbourne, FL Pablo Santos NOAA/National Weather Service Miami, FL Weather Model Outcomes (as seen on TV)
Ensemble Verification Metrics
 Ensemble Verification Metrics Debbie Hudson (Bureau of Meteorology, Australia) ECMWF Annual Seminar 207 Acknowledgements: Beth Ebert Overview. Introduction 2. Attributes of forecast quality 3. Metrics:
COLORADO STATE UNIVERSITY FORECAST OF ATLANTIC HURRICANE ACTIVITY FROM AUGUST 4-17, 2015
 COLORADO STATE UNIVERSITY FORECAST OF ATLANTIC HURRICANE ACTIVITY FROM AUGUST 4-17, 2015 We expect that the next two weeks will be characterized by below-average amounts (
The Worst Places for Hurricanes
 The Worst Places for Hurricanes Hurricane Hotspots By now, everyone knows that the last two hurricane seasons have been particularly severe. Severe yes, but compared to what? Hurricane experts are saying
Wind Speed Probability Products
 Wind Speed Probability Products Daniel Brown National Hurricane Center 2018 WMO Course 6 March 2018 Wind Speed Probabilities A Tool to Deal with Uncertainty Hurricane Irene Advisory Number 12 Issued 5:00
Categorical Verification
 Forecast M H F Observation Categorical Verification Tina Kalb Contributions from Tara Jensen, Matt Pocernich, Eric Gilleland, Tressa Fowler, Barbara Brown and others Finley Tornado Data (1884) Forecast
William H. Bauman III * NASA Applied Meteorology Unit / ENSCO, Inc. / Cape Canaveral Air Force Station, Florida
 12.5 INTEGRATING WIND PROFILING RADARS AND RADIOSONDE OBSERVATIONS WITH MODEL POINT DATA TO DEVELOP A DECISION SUPPORT TOOL TO ASSESS UPPER-LEVEL WINDS FOR SPACE LAUNCH William H. Bauman III * NASA Applied
Wind Speed Probability Products. Daniel Brown and Michael Brennan National Hurricane Center
 Wind Speed Probability Products Daniel Brown and Michael Brennan National Hurricane Center 2017 WMO Course 7 March 2017 Wind Speed Probabilities A Tool to Deal with Uncertainty Hurricane Irene Advisory
Tropical Update. 12 PM EDT Friday, October 7, 2016 Hurricane Matthew & Tropical Storm Nicole
 Tropical Update 12 PM EDT Friday, October 7, 2016 Hurricane Matthew & Tropical Storm Nicole This update is intended for government and emergency response officials, and is provided for informational and
Tropical Update 6 AM EDT Friday, October 7, 2016 Hurricane Matthew & Hurricane Nicole
 Tropical Update 6 AM EDT Friday, October 7, 2016 Hurricane Matthew & Hurricane Nicole This update is intended for government and emergency response officials, and is provided for informational and situational
Verification of Probability Forecasts
 Verification of Probability Forecasts Beth Ebert Bureau of Meteorology Research Centre (BMRC) Melbourne, Australia 3rd International Verification Methods Workshop, 29 January 2 February 27 Topics Verification
Jaclyn A. Shafer * NASA Applied Meteorology Unit / ENSCO, Inc. / Cape Canaveral Air Force Station, Florida
 12.6 DETERMINING THE PROBABILITY OF VIOLATING UPPER-LEVEL WIND CONSTRAINTS FOR THE LAUNCH OF MINUTEMAN III BALLISTIC MISSILES AT VANDENBERG AIR FORCE BASE Jaclyn A. Shafer * NASA Applied Meteorology Unit
3.4 A Tool To Interpret The National Hurricane Center Wind Probability Forecasts
 3.4 A Tool To Interpret The National Hurricane Center Wind Probability Forecasts William P. Roeder 45th Weather Squadron Patrick AFB, FL Mary C. Szpak Harvard University Cambridge, MA 1. Introduction The
National Hurricane Center Forecast Accuracy: Past and Present James L. Franklin Branch Chief, Hurricane Specialist Unit National Hurricane Center
 National Hurricane Center Forecast Accuracy: Past and Present James L. Franklin Branch Chief, Hurricane Specialist Unit National Hurricane Center 30 January 2012 1 NHC Forecast Verification NHC verifies
A Comparison of Tornado Warning Lead Times with and without NEXRAD Doppler Radar
 MARCH 1996 B I E R I N G E R A N D R A Y 47 A Comparison of Tornado Warning Lead Times with and without NEXRAD Doppler Radar PAUL BIERINGER AND PETER S. RAY Department of Meteorology, The Florida State
COLORADO STATE UNIVERSITY FORECAST OF ATLANTIC HURRICANE ACTIVITY FROM SEPTEMBER 15 SEPTEMBER 28, 2015
 COLORADO STATE UNIVERSITY FORECAST OF ATLANTIC HURRICANE ACTIVITY FROM SEPTEMBER 15 SEPTEMBER 28, 2015 We expect that the next two weeks will be characterized by below-average amounts (
152 STATISTICAL PREDICTION OF WATERSPOUT PROBABILITY FOR THE FLORIDA KEYS
 152 STATISTICAL PREDICTION OF WATERSPOUT PROBABILITY FOR THE FLORIDA KEYS Andrew Devanas 1, Lydia Stefanova 2, Kennard Kasper 1, Sean Daida 1 1 NOAA/National Wear Service, Key West, Florida, 2 COAPS/Florida
SIXTH INTERNATIONAL WORKSHOP on TROPICAL CYCLONES. Working Group: Phillipe Caroff, Jeff Callaghan, James Franklin, Mark DeMaria
 WMO/CAS/WWW Topic 0.1: Track forecasts SIXTH INTERNATIONAL WORKSHOP on TROPICAL CYCLONES Rapporteur: E-mail: Lixion A. Avila NOAA/National Hurricane Center 11691 SW 17th Street Miami, FL 33165-2149, USA
Model verification and tools. C. Zingerle ZAMG
 Model verification and tools C. Zingerle ZAMG Why verify? The three most important reasons to verify forecasts are: to monitor forecast quality - how accurate are the forecasts and are they improving over
COLORADO STATE UNIVERSITY FORECAST OF ATLANTIC HURRICANE ACTIVITY FROM AUGUST 31 SEPTEMBER 13, 2012
 COLORADO STATE UNIVERSITY FORECAST OF ATLANTIC HURRICANE ACTIVITY FROM AUGUST 31 SEPTEMBER 13, 2012 We expect that the next two weeks will be characterized by average amounts (70-130 percent) of activity
The Wind Hazard: Messaging the Wind Threat & Corresponding Potential Impacts
 The Wind Hazard: Messaging the Wind Threat & Corresponding Potential Impacts Scott Spratt Warning Coordination Meteorologist NWS Melbourne, FL David Sharp Science & Operations Officer NWS Melbourne, FL
A New Method for Estimating Tropical Cyclone Wind Speed Probabilities
 DECEMBER 2009 D E M A R I A E T A L. 1573 A New Method for Estimating Tropical Cyclone Wind Speed Probabilities MARK DEMARIA AND JOHN A. KNAFF NOAA/NESDIS, Fort Collins, Colorado RICHARD KNABB NOAA/NWS/Central
Tropical Update. 5 PM EDT Sunday, October 7, 2018 Tropical Storm Michael, Tropical Storm Leslie, & Invest 92L (30%)
") Tropical Update 5 PM EDT Sunday, October 7, 2018 Tropical Storm Michael, Tropical Storm Leslie, & Invest 92L (30%) This update is intended for government and emergency response officials, and is provided
Tropical Update 5 PM EDT Sunday, October 7, 2018 Tropical Storm Michael, Tropical Storm Leslie, & Invest 92L (30%) This update is intended for government and emergency response officials, and is provided
Revisiting predictability of the strongest storms that have hit France over the past 32 years.
 Revisiting predictability of the strongest storms that have hit France over the past 32 years. Marie Boisserie L. Descamps, P. Arbogast GMAP/RECYF 20 August 2014 Introduction Improving early detection
Tropical Update. 5 PM EDT Thursday, August 27, 2015 Tropical Storm Erika
 Tropical Update 5 PM EDT Thursday, August 27, 2015 Tropical Storm Erika This update is intended for government and emergency response officials, and is provided for informational and situational awareness
Verification of the operational NWP models at DWD - with special focus at COSMO-EU
 Verification of the operational NWP models at DWD - with special focus at COSMO-EU Ulrich Damrath Ulrich.Damrath@dwd.de Ein Mensch erkennt (und das ist wichtig): Nichts ist ganz falsch und nichts ganz
COLORADO STATE UNIVERSITY FORECAST OF ATLANTIC HURRICANE ACTIVITY FROM SEPTEMBER 1 SEPTEMBER 14, 2015
 COLORADO STATE UNIVERSITY FORECAST OF ATLANTIC HURRICANE ACTIVITY FROM SEPTEMBER 1 SEPTEMBER 14, 2015 We expect that the next two weeks will be characterized by below-average amounts (
RSMC-Miami Update Daniel Brown Warning Coordination Meteorologist
 RSMC-Miami Update 2016 Daniel Brown Warning Coordination Meteorologist L-0324 Emergency Management Hurricane Preparedness Training Course Funding provided by FEMA s National Hurricane Program - partnership
COLORADO STATE UNIVERSITY FORECAST OF ATLANTIC HURRICANE ACTIVITY FROM AUGUST 14 AUGUST 27, 2014
 COLORADO STATE UNIVERSITY FORECAST OF ATLANTIC HURRICANE ACTIVITY FROM AUGUST 14 AUGUST 27, 2014 We expect that the next two weeks will be characterized by below-average amounts (less than 70 percent)
Upgrade of JMA s Typhoon Ensemble Prediction System
 Upgrade of JMA s Typhoon Ensemble Prediction System Masayuki Kyouda Numerical Prediction Division, Japan Meteorological Agency and Masakazu Higaki Office of Marine Prediction, Japan Meteorological Agency
William H. Bauman III* NASA Applied Meteorology Unit / ENSCO, Inc. / Cape Canaveral Air Force Station, Florida
 P2.8 FLOW REGIME BASED CLIMATOLOGIES OF LIGHTNING PROBABILITIES FOR SPACEPORTS AND AIRPORTS William H. Bauman III* NASA Applied Meteorology Unit / ENSCO, Inc. / Cape Canaveral Air Force Station, Florida
COLORADO STATE UNIVERSITY FORECAST OF ATLANTIC HURRICANE ACTIVITY FROM AUGUST 17 AUGUST 30, 2012
 COLORADO STATE UNIVERSITY FORECAST OF ATLANTIC HURRICANE ACTIVITY FROM AUGUST 17 AUGUST 30, 2012 We expect that the next two weeks will be characterized by above-average amounts (greater than 130 percent)
Tropical Update. 5 PM EDT Thursday, September 7, 2017 Hurricane Irma, Hurricane Jose, and Hurricane Katia
 Tropical Update 5 PM EDT Thursday, September 7, 2017 Hurricane Irma, Hurricane Jose, and Hurricane Katia This update is intended for government and emergency response officials, and is provided for informational
OBJECTIVE CALIBRATED WIND SPEED AND CROSSWIND PROBABILISTIC FORECASTS FOR THE HONG KONG INTERNATIONAL AIRPORT
 P 333 OBJECTIVE CALIBRATED WIND SPEED AND CROSSWIND PROBABILISTIC FORECASTS FOR THE HONG KONG INTERNATIONAL AIRPORT P. Cheung, C. C. Lam* Hong Kong Observatory, Hong Kong, China 1. INTRODUCTION Wind is
Tropical Update. 5 AM EDT Thursday, September 7, 2017 Hurricane Irma, Hurricane Jose, and Hurricane Katia
 Tropical Update 5 AM EDT Thursday, September 7, 2017 Hurricane Irma, Hurricane Jose, and Hurricane Katia This update is intended for government and emergency response officials, and is provided for informational
Improvements to, and Verification of, Intraseasonal to Seasonal Prediction of Tropical Cyclogenesis
 Improvements to, and Verification of, Intraseasonal to Seasonal Prediction of Tropical Cyclogenesis David Meyer and Tom Murphree Naval Postgraduate School dwmeyer@nps.edu and murphree@nps.edu 15W (Talas)
Supplementary Figure 1. Summer mesoscale convective systems rainfall climatology and trends. Mesoscale convective system (MCS) (a) mean total
 (a) mean total") Supplementary Figure 1. Summer mesoscale convective systems rainfall climatology and trends. Mesoscale convective system (MCS) (a) mean total rainfall and (b) total rainfall trend from 1979-2014. Total
Supplementary Figure 1. Summer mesoscale convective systems rainfall climatology and trends. Mesoscale convective system (MCS) (a) mean total rainfall and (b) total rainfall trend from 1979-2014. Total
4B.4 STATISTICAL SHORT-RANGE GUIDANCE FOR PEAK WIND SPEEDS AT EDWARDS AIR FORCE BASE, CA
 4B.4 STATISTICAL SHORT-RANGE GUIDANCE FOR PEAK WIND SPEEDS AT EDWARDS AIR FORCE BASE, CA Joseph G. Dreher* and Winifred Crawford NASA Applied Meteorology Unit / ENSCO, Inc. / Cape Canaveral Air Force Station,
Tropical Update. 11 AM EDT Tuesday, October 9, 2018 Hurricane Michael, Tropical Storm Leslie, Tropical Storm Nadine
 Tropical Update 11 AM EDT Tuesday, October 9, 2018 Hurricane Michael, Tropical Storm Leslie, Tropical Storm Nadine This update is intended for government and emergency response officials, and is provided
Operational and Statistical Prediction of Rapid Intensity Change. Mark DeMaria and Eric Blake, NCEP/NHC John Kaplan, AOML/HRD
 Operational and Statistical Prediction of Rapid Intensity Change Mark DeMaria and Eric Blake, NCEP/NHC John Kaplan, AOML/HRD Outline Evaluation of NHC forecasts and deterministic models for rapid intensification
COLORADO STATE UNIVERSITY FORECAST OF ATLANTIC HURRICANE ACTIVITY FROM AUGUST 16 AUGUST 29, 2013
 COLORADO STATE UNIVERSITY FORECAST OF ATLANTIC HURRICANE ACTIVITY FROM AUGUST 16 AUGUST 29, 2013 We expect that the next two weeks will be characterized by above-average amounts (greater than 130 percent)
HVX-HURREVAC (Beta) Webinar Series
 Webinar Series") HVX-HURREVAC (Beta) Webinar Series Day 1 - An introduction to HURREVAC and the new web-based HVX platform 2018 HVX-HURREVAC Webinar Series 1. Intro to HURREVAC and General Overview of the Program (August
HVX-HURREVAC (Beta) Webinar Series Day 1 - An introduction to HURREVAC and the new web-based HVX platform 2018 HVX-HURREVAC Webinar Series 1. Intro to HURREVAC and General Overview of the Program (August
COLORADO STATE UNIVERSITY FORECAST OF ATLANTIC HURRICANE ACTIVITY FROM SEPTEMBER 25 OCTOBER 8, 2014
 COLORADO STATE UNIVERSITY FORECAST OF ATLANTIC HURRICANE ACTIVITY FROM SEPTEMBER 25 OCTOBER 8, 2014 We expect that the next two weeks will be characterized by below-average amounts (
A COMPREHENSIVE 5-YEAR SEVERE STORM ENVIRONMENT CLIMATOLOGY FOR THE CONTINENTAL UNITED STATES 3. RESULTS
 16A.4 A COMPREHENSIVE 5-YEAR SEVERE STORM ENVIRONMENT CLIMATOLOGY FOR THE CONTINENTAL UNITED STATES Russell S. Schneider 1 and Andrew R. Dean 1,2 1 DOC/NOAA/NWS/NCEP Storm Prediction Center 2 OU-NOAA Cooperative
COLORADO STATE UNIVERSITY FORECAST OF ATLANTIC HURRICANE ACTIVITY FROM AUGUST 30 SEPTEMBER 12, 2013
 COLORADO STATE UNIVERSITY FORECAST OF ATLANTIC HURRICANE ACTIVITY FROM AUGUST 30 SEPTEMBER 12, 2013 We expect that the next two weeks will be characterized by average amounts (70-130 percent) of activity
VERFICATION OF OCEAN WAVE ENSEMBLE FORECAST AT NCEP 1. Degui Cao, H.S. Chen and Hendrik Tolman
 VERFICATION OF OCEAN WAVE ENSEMBLE FORECAST AT NCEP Degui Cao, H.S. Chen and Hendrik Tolman NOAA /National Centers for Environmental Prediction Environmental Modeling Center Marine Modeling and Analysis
Methods of forecast verification
 Methods of forecast verification Kiyotoshi Takahashi Climate Prediction Division Japan Meteorological Agency 1 Outline 1. Purposes of verification 2. Verification methods For deterministic forecasts For
Tropical Update. 5 AM EDT Wednesday, September 6, 2017 Hurricane Irma, Tropical Storm Jose, and Tropical Storm Katia
 Tropical Update 5 AM EDT Wednesday, September 6, 2017 Hurricane Irma, Tropical Storm Jose, and Tropical Storm Katia This update is intended for government and emergency response officials, and is provided
Understanding the Microphysical Properties of Developing Cloud Clusters During TCS-08
 Understanding the Microphysical Properties of Developing Cloud Clusters During TCS-08 PI: Elizabeth A. Ritchie Department of Atmospheric Sciences, University of Arizona Room 542, Physics-Atmospheric Sciences
Overview of the Tropical Cyclone Guidance Project
 Overview of the Tropical Cyclone Guidance Project Dr. Jonathan L. Vigh With thanks to Mahsa Mirzargar (Univ. of Miami) Shanghai Typhoon Institute 09 July 2018 NCAR is sponsored by the National Science
Verification challenges in developing TC response procedures based on ensemble guidance
 Verification challenges in developing TC response procedures based on ensemble guidance Grant Elliott Senior Metocean Meteorologist ECMWF UEF 2016 workshop Disclaimer and important notice This presentation
Hurricane Matthew. National Weather Service Wilmington NC. Steven Pfaff, WCM.
 Hurricane Matthew Threat Assessment for northeast South Carolina & southeast North Carolina National Weather Service Wilmington NC 515 PM EDT Monday October 3, 2016 Steven Pfaff, WCM Steven.Pfaff@noaa.gov
Major Hurricane Matthew Briefing Situation Overview
 Major Hurricane Matthew Briefing Situation Overview At 5 p.m. Tuesday, Category 4 Hurricane Matthew was about 860 miles South-Southeast of Mayport, Florida, moving north around 10 mph. Maximum sustained
Careful, Cyclones Can Blow You Away!
 Title: Careful, Cyclones Can Blow You Away! (Meteorology) Grade(s): 6-8 Introduction: Most people associate twisters with tornadoes, but in fact tropical twisters come from hurricanes. Hurricanes are what
Predicting uncertainty in forecasts of weather and climate (Also published as ECMWF Technical Memorandum No. 294)
") Predicting uncertainty in forecasts of weather and climate (Also published as ECMWF Technical Memorandum No. 294) By T.N. Palmer Research Department November 999 Abstract The predictability of weather
Predicting uncertainty in forecasts of weather and climate (Also published as ECMWF Technical Memorandum No. 294) By T.N. Palmer Research Department November 999 Abstract The predictability of weather
Recommendations on trajectory selection in flight planning based on weather uncertainty
 Recommendations on trajectory selection in flight planning based on weather uncertainty Philippe Arbogast, Alan Hally, Jacob Cheung, Jaap Heijstek, Adri Marsman, Jean-Louis Brenguier Toulouse 6-10 Nov
GFDL Hurricane Model Ensemble Performance During the 2012 Hurricane Season
 GFDL Hurricane Model Ensemble Performance During the 2012 Hurricane Season Tim Marchok (NOAA / GFDL) Matt Morin (DRC HPTG / GFDL) Morris Bender (NOAA / GFDL) HFIP Team Telecon 12 December 2012 Acknowledgments:
Allison Monarski, University of Maryland Masters Scholarly Paper, December 6, Department of Atmospheric and Oceanic Science
 Allison Monarski, University of Maryland Masters Scholarly Paper, December 6, 2011 1 Department of Atmospheric and Oceanic Science Verification of Model Output Statistics forecasts associated with the
Verification of Tropical Storm Track Prediction in Southeast Asia Using GFS Model
 1 Verification of Tropical Storm Track Prediction in Southeast Asia Using GFS Model Honors Thesis Presented to the College of Agriculture and Life Sciences Department of Earth and Atmospheric Sciences
Basic Verification Concepts
 Basic Verification Concepts Barbara Brown National Center for Atmospheric Research Boulder Colorado USA bgb@ucar.edu Basic concepts - outline What is verification? Why verify? Identifying verification
COLORADO STATE UNIVERSITY FORECAST OF ATLANTIC HURRICANE ACTIVITY FROM AUGUST 16 29, 2018
 COLORADO STATE UNIVERSITY FORECAST OF ATLANTIC HURRICANE ACTIVITY FROM AUGUST 16 29, 2018 We expect that the next two weeks will be characterized by below-normal amounts of hurricane activity. (as of 16
COLORADO STATE UNIVERSITY FORECAST OF ATLANTIC HURRICANE ACTIVITY FROM AUGUST 18-31, 2017
 COLORADO STATE UNIVERSITY FORECAST OF ATLANTIC HURRICANE ACTIVITY FROM AUGUST 18-31, 2017 We expect that the next two weeks will be characterized by above-average amounts (>130%) of activity relative to
ECMWF 10 th workshop on Meteorological Operational Systems
 ECMWF 10 th workshop on Meteorological Operational Systems 18th November 2005 Crown copyright 2004 Page 1 Monthly range prediction products: Post-processing methods and verification Bernd Becker, Richard
Communicating Hurricane Threats and Impacts on a National Scale. Daniel Brown Warning Coordination Meteorologist National Hurricane Center
 Communicating Hurricane Threats and Impacts on a National Scale Daniel Brown Warning Coordination Meteorologist National Hurricane Center New NWS Products to Help Communicate Potential Impacts New probabilistic
COLORADO STATE UNIVERSITY FORECAST OF ATLANTIC HURRICANE ACTIVITY FROM AUGUST 2 AUGUST 15, 2013
 COLORADO STATE UNIVERSITY FORECAST OF ATLANTIC HURRICANE ACTIVITY FROM AUGUST 2 AUGUST 15, 2013 We expect that the next two weeks will be characterized by below-average amounts (
Detective Miss Marple in Murder at the Gallop. 3rd verification workshop, ECMWF 2007, Göber
 m Detective Miss Marple in Murder at the Gallop Slide m Now, this is how we verify the forecasters at DWD: we watch them intensily and when they get it wrong, they'll get a bang over their head. OK, I'm
Probabilistic Hurricane Storm Surge A Local Perspective
 Probabilistic Hurricane Storm Surge A Local Perspective Florida Governor Hurricane Conference May 11-16 2014 2014 FLGHC TS 22 Pablo Santos Meteorologist In Charge NWS Miami/South Florida Forecast Office
AnuMS 2018 Atlantic Hurricane Season Forecast
 AnuMS 2018 Atlantic Hurricane Season Forecast Issued: April 10, 2018 by Dale C. S. Destin (follow @anumetservice) Director (Ag), Antigua and Barbuda Meteorological Service (ABMS) The *AnuMS (Antigua Met
Verifying Ensemble Forecasts Using A Neighborhood Approach
 Verifying Ensemble Forecasts Using A Neighborhood Approach Craig Schwartz NCAR/MMM schwartz@ucar.edu Thanks to: Jack Kain, Ming Xue, Steve Weiss Theory, Motivation, and Review Traditional Deterministic
Extracting probabilistic severe weather guidance from convection-allowing model forecasts. Ryan Sobash 4 December 2009 Convection/NWP Seminar Series
 Extracting probabilistic severe weather guidance from convection-allowing model forecasts Ryan Sobash 4 December 2009 Convection/NWP Seminar Series Identification of severe convection in high-resolution
Hurricane Matthew. National Weather Service Wilmington NC. Steven Pfaff, WCM.
 Hurricane Matthew Threat Assessment for northeast South Carolina & southeast North Carolina National Weather Service Wilmington NC 730 AM EDT Tuesday October 4, 2016 Steven Pfaff, WCM Steven.Pfaff@noaa.gov
The Nuts and Bolts of These Community Preparedness Recognition Programs
 The Nuts and Bolts of These Community Preparedness Recognition Programs Bill Sammler Warning Coordination Meteorologist NOAA s National Weather Service, Wakefield VA http://weather.gov/akq Why is StormReady
Enhancing Weather Information with Probability Forecasts. An Information Statement of the American Meteorological Society
 Enhancing Weather Information with Probability Forecasts An Information Statement of the American Meteorological Society (Adopted by AMS Council on 12 May 2008) Bull. Amer. Meteor. Soc., 89 Summary This
Miami-Dade County Overview
 Miami-Dade County Overview 2,000 square miles World s busiest cruise port 2.6 million residents Second busiest US airport for international travelers Gateway to the Caribbean and Latin America Natural
HURRICANE Information for the Teacher
 HURRICANE Information for the Teacher This hurricane simulation activity and STELLA model were adapted from materials developed by Jan Mons and Cathy Eaton of the Glynns Integration of Systems Thinking
statistical methods for tailoring seasonal climate forecasts Andrew W. Robertson, IRI
 statistical methods for tailoring seasonal climate forecasts Andrew W. Robertson, IRI tailored seasonal forecasts why do we make probabilistic forecasts? to reduce our uncertainty about the (unknown) future
Forecast Verification Analysis of Rainfall for Southern Districts of Tamil Nadu, India
 International Journal of Current Microbiology and Applied Sciences ISSN: 2319-7706 Volume 6 Number 5 (2017) pp. 299-306 Journal homepage: http://www.ijcmas.com Original Research Article https://doi.org/10.20546/ijcmas.2017.605.034
Coastal Emergency Risks Assessment - CERA Real-Time Storm Surge and Wave Visualization Tool
 Coastal Emergency Risks Assessment - CERA Real-Time Storm Surge and Wave Visualization Tool Introduction This document provides guidance for using the Coastal Emergency Risks Assessment (CERA) visualization
Agricultural Outlook Forum Presented: February 17, 2006 THE SCIENCE BEHIND THE ATLANTIC HURRICANES AND SEASONAL PREDICTIONS
 Agricultural Outlook Forum Presented: February 17, 2006 THE SCIENCE BEHIND THE ATLANTIC HURRICANES AND SEASONAL PREDICTIONS Gerald Bell Meteorologist, National Centers for Environmental Prediction NOAA,
GC Briefing. Weather Sentinel Hurricane Florence. Status at 5 PM EDT (21 UTC) Today (NHC) Discussion. September 13, 2018
 Today (NHC) Discussion. September 13, 2018") GC Briefing September 13, 2018 Weather Sentinel Hurricane Florence Tropical storm conditions have been reported for areas of North Carolina and will continue to spread inland to the west and south. Hurricane
GC Briefing September 13, 2018 Weather Sentinel Hurricane Florence Tropical storm conditions have been reported for areas of North Carolina and will continue to spread inland to the west and south. Hurricane
NEW SCHEME TO IMPROVE THE DETECTION OF RAINY CLOUDS IN PUERTO RICO
 NEW SCHEME TO IMPROVE THE DETECTION OF RAINY CLOUDS IN PUERTO RICO Joan Manuel Castro Sánchez Advisor Dr. Nazario Ramirez UPRM NOAA CREST PRYSIG 2016 October 7, 2016 Introduction A cloud rainfall event
Verification of WAQUA/DCSMv5 s operational water level probability forecasts
 Ministry of Infrastructure and Water Management Verification of WAQUA/DCSMv5 s operational water level probability forecasts N. Wagenaar KNMI Internal report IR-18-1 UTRECHT UNIVSERSITY DEPARTMENT OF
North Carolina State University Land Grant University founded in undergraduate fields of study 80 master's degree areas 51 doctoral degree
 NC State University North Carolina State University Land Grant University founded in 1887 89 undergraduate fields of study 80 master's degree areas 51 doctoral degree programs Enrollment is 33,819 students
KCC White Paper: The 100 Year Hurricane. Could it happen this year? Are insurers prepared? KAREN CLARK & COMPANY. June 2014
 KAREN CLARK & COMPANY KCC White Paper: The 100 Year Hurricane Could it happen this year? Are insurers prepared? June 2014 Copyright 2014 Karen Clark & Company The 100 Year Hurricane Page 1 2 COPLEY PLACE
Tropical Update. 5 PM EDT Sunday, September 10, 2017 Hurricane Irma, Hurricane Jose, Tropical Wave (60%)
") Tropical Update 5 PM EDT Sunday, September 10, 2017 Hurricane Irma, Hurricane Jose, Tropical Wave (60%) This update is intended for government and emergency response officials, and is provided for informational
Tropical Update 5 PM EDT Sunday, September 10, 2017 Hurricane Irma, Hurricane Jose, Tropical Wave (60%) This update is intended for government and emergency response officials, and is provided for informational
Weather Research Center
 Weather Research Center 3227 Audley Houston, Texas 77098 Phone: 713-529-3076 Fax: 713-528-3538 E-mail: wrc@wxresearch.org Press Release For Immediate Release November 29, 2005 For Information Contact:
PRMS WHITE PAPER 2014 NORTH ATLANTIC HURRICANE SEASON OUTLOOK. June RMS Event Response
 PRMS WHITE PAPER 2014 NORTH ATLANTIC HURRICANE SEASON OUTLOOK June 2014 - RMS Event Response 2014 SEASON OUTLOOK The 2013 North Atlantic hurricane season saw the fewest hurricanes in the Atlantic Basin
WELCOME TO THE 2018 RA-IV WORKSHOP ON HURRICANE FORECASTING AND WARNING
 WELCOME TO THE 2018 RA-IV WORKSHOP ON HURRICANE FORECASTING AND WARNING Richard J. Pasch and Daniel P. Brown Senior Hurricane Specialists National Hurricane Center ORIENTATION Use of PCs NHC Facility Workshop
FORECAST OF ATLANTIC SEASONAL HURRICANE ACTIVITY AND LANDFALL STRIKE PROBABILITY FOR 2015
 FORECAST OF ATLANTIC SEASONAL HURRICANE ACTIVITY AND LANDFALL STRIKE PROBABILITY FOR 2015 We continue to foresee a below-average 2015 Atlantic hurricane season. A moderate to strong El Niño is underway,
AnuMS 2018 Atlantic Hurricane Season Forecast
 AnuMS 2018 Atlantic Hurricane Season Forecast : June 11, 2018 by Dale C. S. Destin (follow @anumetservice) Director (Ag), Antigua and Barbuda Meteorological Service (ABMS) The *AnuMS (Antigua Met Service)
WSI Tropical MarketFirst
 Todd Crawford, Ph.D. Director of R&D for Energy and Risk Services William Ramstrom Tropical Meteorologist, WSI June 2008 Introduction WSI Corporation has recently developed WSI Tropical MarketFirst, a
Application and verification of ECMWF products: 2010
 Application and verification of ECMWF products: 2010 Hellenic National Meteorological Service (HNMS) F. Gofa, D. Tzeferi and T. Charantonis 1. Summary of major highlights In order to determine the quality
Colorado State University (CSU) Atlantic Hurricane Season Forecast
 Atlantic Hurricane Season Forecast") Colorado State University (CSU) Atlantic Hurricane Season Forecast Dr. Philip Klotzbach of Colorado State University (CSU) has issued his April forecast for the 2018 Atlantic Hurricane Season. The forecast
Colorado State University (CSU) Atlantic Hurricane Season Forecast Dr. Philip Klotzbach of Colorado State University (CSU) has issued his April forecast for the 2018 Atlantic Hurricane Season. The forecast
AnuMS 2018 Atlantic Hurricane Season Forecast
 AnuMS 2018 Atlantic Hurricane Season Forecast Issued: May 10, 2018 by Dale C. S. Destin (follow @anumetservice) Director (Ag), Antigua and Barbuda Meteorological Service (ABMS) The *AnuMS (Antigua Met
HURREVAC Webinar Series Day 1 Intro to HURREVAC and General Overview of the Program. National Hurricane Program Training Course
 HURREVAC Webinar Series Day 1 Intro to HURREVAC and General Overview of the Program 2017 HURREVAC Webinar Series 1. Intro to HURREVAC and General Overview of the Program (August 7 th or 14 th ) 2. Evacuation
Using Independent NCDC Gauges to Analyze Precipitation Values from the OneRain Corporation Algorithm and the National Weather Service Procedure
 Using Independent NCDC Gauges to Analyze Precipitation Values from the OneRain Corporation Algorithm and the National Weather Service Procedure Steven M. Martinaitis iti Henry E. Fuelberg John L. Sullivan