4A.1 RESULTS OF THE NATIONAL AVIATION WEATHER PROGRAM S 10-YEAR GOAL TO REDUCE WEATHER-RELATED ACCIDENTS BY 80 PERCENT
|
|
|
- Stella Fletcher
- 5 years ago
- Views:
Transcription
1 4A.1 RESULTS OF THE NATIONAL AVIATION WEATHER PROGRAM S 10-YEAR GOAL TO REDUCE WEATHER-RELATED ACCIDENTS BY 80 PERCENT Samuel P. Williamson, Judson E. Stailey*, and Mark J. Welshinger Office of the Federal Coordinator for Meteorological Services and Supporting Research (OFCM) Robert Katt Robert Katt and Associates, Inc ABSTRACT The White House Commission on Aviation Safety and Security in 1997 set a goal of reducing fatal aviation accidents by 80 percent in 10 years, and the federal meteorological community incorporated this goal into the National Aviation Weather Program (NAWP) with a focus on reducing weather-related accidents. In 1999, the National Aviation Weather Program Council (NAW/PC) released a report documenting 86 initiatives by the Federal agencies to reduce accidents and achieve this goal. The Office of the Federal Coordinator for Meteorological Services and Supporting Research (OFCM) recently completed an analysis of National Transportation Safety Board accident data for the 10-year period ( ) to ascertain whether the 10-year goal was met. While not meeting the 80% reduction goal, the weatherrelated accident rate decreased at a faster rate than the overall accident rate in most categories. Trend lines showed that general aviation experienced accident rate decreases of 34 and 43% for all weather-related and fatal weather-related accidents, respectively. The airline weather-related accident rate decreased by 24%, while the weather-related fatal accident rate remained effectively zero. A closer look at accident experience in certain types of weather showed that a disproportionate number of fatal general aviation accidents are associated with restricted visibility and ceiling hazards; most weather-related airline accidents were associated with turbulence and convection. The OFCM and the NAWP will continue to facilitate activities to sustain improvements in weather-related aviation accident rates. 1. INTRODUCTION 1.1 Origin of the 10-Year Initiative In 1995 the National Research Council documented a study of weather support to aviation with a final report, Aviation Weather Services A Call for Federal Leadership and Action (NRC 1995). In response to that challenge for improved aviation weather safety, the NAW/PC, one of several interagency program councils within the OFCM infrastructure, approved and published a National Aviation Weather Program Strategic Plan in April 1997 (OFCM 1997). At about the same time, the White House Commission on Aviation Safety and Security recommended government and industry set a national goal to reduce the rate of fatal aviation accidents by a factor of five (an 80 percent reduction) within 10 years. Subsequently, both the Federal Aviation Administration (FAA) and the National Aeronautics and Space Administration (NASA) adopted the 80 percent reduction goal in their strategic plans. In February 1999, the NAW/PC approved and released National Aviation Weather Initiatives (OFCM 1999), which implemented the 1997 Strategic Plan. In the Initiatives document, the NAW/PC cited the 80% fatal accident rate reduction challenge and acknowledged the responsibility of the aviation weather community to contribute to achieving that national goal. To track progress toward achieving the goal, it was assumed that the 10-year period would span 1997 through 2006, and the baseline for comparison would be the years leading up to Activities Corresponding author address: Judson E. Stailey, OFCM, 8455 Colesville Road, Suite 1500, Silver Spring, MD 20910; Judson.stailey@noaa.gov The Initiatives report documented recommendations for specific areas of improvement to be addressed by the Federal agencies and, by extension, academia and industry. The 86 initiatives cited were based on the following Strategic
2 Elements identified in the Strategic Plan or added in the Initiatives report: Improving the quality of weather information Enhancing the ability of decision makers to use that information Improving the capability of aircraft to fly safely and efficiently in all types of weather Forging institutional arrangements to facilitate improvements Directing and applying aviation weather research. The individual initiatives were tied to one or more of eight Service Areas, which described the weather challenges being addressed (e.g., ceiling and visibility, turbulence, convective hazards). The final initiatives were selected from a larger group of candidate initiatives and then ranked based on a cost/benefit analysis. To identify and monitor the efforts being made by the aviation weather community to improve support, OFCM gathered information on relevant programs and projects that were completed, underway, or planned. This work was documented in three status reports, including a baseline report (OFCM 2001), and two updates (OFCM 2003a and OFCM 2004). These reports also highlighted the initiatives that were not being addressed, an approach that ultimately expanded the scope of the programs and projects to reduce the number of unaddressed initiatives. In recognition of the importance of training to aviation weather safety, a survey of training programs and initiatives was conducted and published (OFCM, 2002). This report focused on training for recently-implemented and emerging programs related to aviation weather. When accident data covering the first five years of the 10-year initiative were made available from the National Transportation Safety Board (NTSB), the National Aviation Weather Program Mid-Course Assessment was published (OFCM 2003b). Overall, the weather-related accident data showed a significant trend downward, which suggested the possibility of approaching or achieving the 80% accident reduction rate goal in some categories of operation and/or service areas. When final data for the last year of the initiative (2006) became available from the NTSB, OFCM began an analysis of accident rate trends over the full 10 years. The basic statistical analysis has been completed, and a high-level look at the results of that analysis is presented here. 2. BACKGROUND 2.1 Stratification of Data by Type of Operation Different types of aviation operations are subject to different rules defined by parts of the Federal Aviation Regulations, which constitute Title 14 of the U.S. Code of Federal Regulations. Because of the different rules and nature of operations, the NTSB categorizes accident data according to these parts, which are defined as follows: Part 91. All aviation other than military or commercial. In addition to privately owned and operated single- and multiple-engine propeller craft often thought of as general aviation, it includes private company jets, rotorcraft, gliders, balloons, experimental aircraft, aerial application flying (e.g., agricultural aviation), and instructional flying. Part 121. Major passenger airlines and cargo carriers that fly large transportcategory aircraft in revenue service. Since March 1997, Part 121 also includes all passenger aircraft operated in scheduled revenue service with ten or more seats (most commuter airlines ). Part 135. Scheduled passenger service in aircraft with fewer than ten seats and nonscheduled operations (revenue-earning flights in which the departure time, departure location, and arrival location are negotiated) in aircraft with 20 or fewer seats, nonscheduled cargo flights with aircraft having a payload capacity of 7,500 pounds or less, and air taxi services. 2.2 Expansion of Analysis to Consider All Accidents

3 The goal of the 10-year initiative was articulated in terms of a reduction in the fatal accident rate. Once actual accident data were available, it became evident that considering only accidents that resulted in deaths would limit the sample size in the most common accident situations to the point where results could become suspect or, at least, difficult to generalize. Moreover, in other situations where there were even fewer cases, considering just the fatal accidents would render the results statistically unusable. To enhance the validity of the conclusions drawn from the data and to allow for analysis of a wider range of weather impact factors, rates for all accidents regardless of whether they resulted in fatalities were also calculated and analyzed. This approach proved to help illustrate the validity of the fatal accident rates, in that the time-series curves of the two rates (all accidents and fatal accidents) assumed the same shape in most cases. 2.3 Data Source. The NTSB performs an investigation of every aircraft accident occurring in the United States resulting in damage to the aircraft or property on the ground, or death or injury to people in the aircraft or on the ground. The depth of the investigation depends on the nature of the accident, but certain basic information is gathered on every accident. This information includes the type of operation (Part, as described earlier); whether or not the accident resulted in fatalities; and what, if any, weather elements were considered to be a factor in the accident. The results of these investigations are maintained in a data base. Each year NTSB queried the data base and provided tailored output to OFCM to support this analysis. In addition to the NTSB accident data, data on overall aviation activity used to normalize the accident data were obtained from FAA (see Normalization below). Categories. The data received from NTSB were already stratified by type of operation (Part). Information in the accident records was used to sort the accidents into four categories based on whether the accidents involved fatalities and whether weather elements were cited as factors in the accidents. The four categories are illustrated in Figure 1. It should be noted that Figure 1 does not represent the type of contingency table familiar to weather forecasters in that the information in the table is not exclusive (i.e., the All data includes the fatal and/or weather Figure 1. Accidents are categorized based on whether there were fatalities and whether weather was a factor. data). Most of the analysis for this paper and most of the results presented were based on the bottom row in the table or subsets of that data for specific weather impacts. In a few cases information from the middle row in the table is presented to highlight important aspects of the accident data. Normalization. Because of annual variations in aviation activity, it was necessary to normalize the accident data. Data describing annual aviation activity level were provided by FAA. For Part 121 (large commercial air carriers) FAA uses the number of departures as a reflection of commercial passenger risk (FAA 2001 [note this is FAA Strategic Plan 2001 Supplement]). To conform to this practice, this paper uses accidents per 100,000 departures as the rate statistic for Part 121. Estimates of annual departures were not available for Part 91 and some of Part 135, so this paper uses accidents per 100,000 flight hours as the rate statistic for those operational categories. The accident statistics for Part 91 were based on accident involved aircraft rather than accidents, so in rare cases where more than one general aviation aircraft were involved in an accident, that accident was included in the data more than once. The impact of this feature of the data was considered to be negligible. 2.4 Weather Hazard Categories The NTSB data included, where applicable, the weather factors associated with each accident. To gain further insight into weather impacts on aviation accidents, an effort was made to analyze
4 the accident statistics for specific types of weather. However, the NTSB process includes the selection from among 45 weather elements to be assigned as weather factors in accident reports. Investigating each weather element separately would have been overly cumbersome and involved statistically small populations in most Hazard Category Restricted visibility and ceiling Precipitation (nonicing) Icing conditions Turbulence and convection Temperature and lift En route and terminal winds Electrical hazards Airborne solids Weather Factors Obscuration Clouds Fog Haze/smoke Low ceiling Whiteout Below approach/landing mins Rain Drizzle/mist Snow Icing conditions Ice fog Freezing rain Carburetor icing conditions Thunderstorm Thunderstorm (outflow) Turbulence (thunderstorms) Turbulence, convection induced Microburst/dry Microburst/wet Updraft Downdraft Gusts Wind shear Dust devil/whirlwind Sudden wind shift Variable wind Mountain wave Turbulence Turbulence, clear air Turbulence in clouds Turbulence (terrain induced) Temperature inversion High density altitude Temperature, high Temperature, low Thermal lift No thermal lift Unfavorable wind Crosswind High wind Tail wind Lightning Static discharge Sand/dust storm Hail Figure 2. Hazard Categories and Associated Weather Factors. To simplify the analysis process and increase sample size, NTSB-assigned weather factors were grouped into weather hazard categories. cases. To alleviate these problems, the weather factors were grouped into eight categories as shown in Figure 2. Note that this logical grouping does not result in categories with similar populations the largest category (turbulence and convection hazards) includes 17 specific weather factors, while two of the categories contain only two factors. Even with this grouping there were categories containing too few accidents to derive meaningful statistics, so results are not presented for all categories. In particular, graphical results for Electrical and Airborne Solids Hazards for Parts 91 and 135 are not shown, and only Turbulence and Convection graphics are presented for Part 121. It should also be noted that the NTSB system allows investigators to assign more than one weather factor to an accident. Thus, accidents can be counted more than once in a category and/or counted in more than one category. In fact, for Part 91 the number of weather factors cited was about one-third greater that the number of weather-related accidents. As a result, the Part 91 accident rates in the three largest weather factor categories add up to more than the total weather-related accident rate. This artifact does not affect the validity of the conclusions drawn from the analysis. 3. RESULTS Quantifying accident reduction performance was approached in two ways. The first method simply compared the accident rates at the beginning and the end of the 10-year period, and did not address particular weather hazard categories. The second method involved taking a closer look at year-to-year trends in accident rates, and included consideration of accident rate reductions in the more common weather hazard categories. These two methods lent themselves to different analytical processes in terms of establishing baseline and final accident rates. As a consequence, slightly different accident rate reduction results are obtained from the two approaches. However, in almost all cases the results from the two approaches are qualitatively similar and representative of the data Year Accident Rate Reduction the Big Picture It was clear early in the analysis process that, while the accident rates had dropped significantly, the goal of reducing accident rates by 80

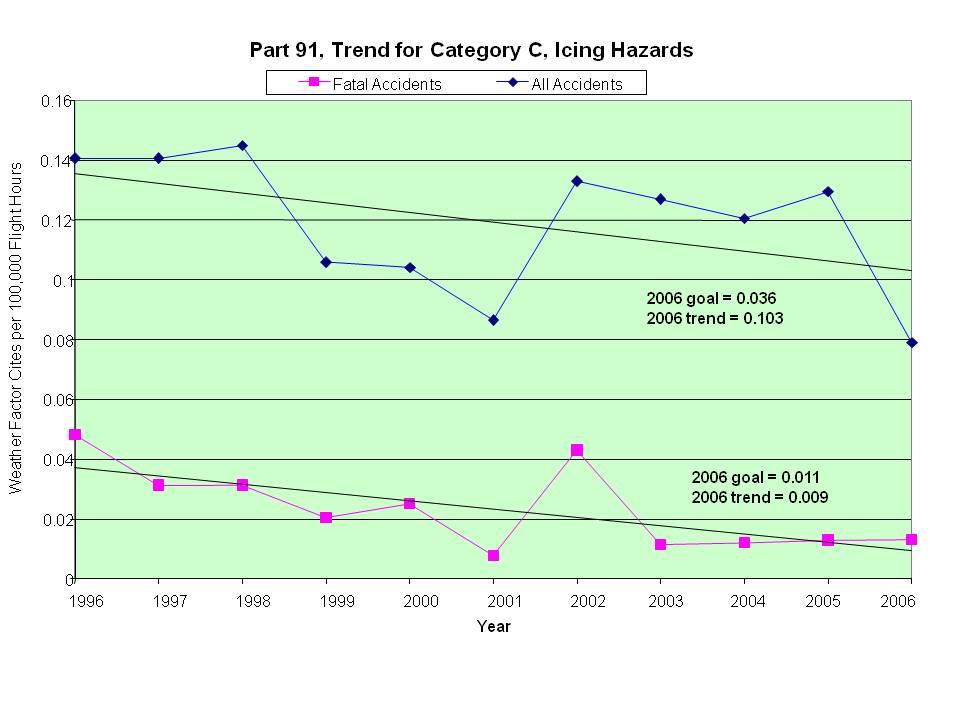
5 percent had not been achieved. In an effort to get a clearer picture of the progress made in the weather-related accident rates, a comparison was made between the overall accident rates and weather-related accident rates. This comparison was made for all accidents and fatal accidents, and included Part 91, 121, and 135 data. To reduce the effect of the year-to-year variability in the data, the mean of the three years preceding the 10-year period (1994 through 1996) was used as the baseline for calculating the accident rate reduction, and the mean of the last two years of period (2005 and 2006) was used as the final rate. Because there were no Part 121 weather-related fatal accidents during either the baseline or the final period, the Part 121 fatal accident rate reduction was not considered as part of this analysis. Figure 3 shows the results of this analysis. Table A-1 in Appendix A presents the data Part Accident Rate Reduction Weather Factor All Fatal Category Accidents Accidents All Accidents 17% 17% Weather-Related 33% 49% Accidents All Accidents 17% N/A Weather-Related 30% N/A Accidents All Accidents 7% 63% 135 Weather-Related 23% 37% Accidents Figure 3. Comparison of weather-related accident rate reduction with overall accident rate reduction the reduction in the weather-related accident rate was greater than the reduction in the overall rate in most cases. supporting this figure, and Table A-2 includes the resulting means on which the reduction percentages were based. In all but one category (Part 135 Fatal Accidents), the accident rate reduction was greater for weather-related accidents than for all accidents in most cases over twice as large. This difference would have been even greater had the weather-related accidents been removed for the all accidents statistics (creating a non-weather-related category) Year Accident Rate Trends for Weather-Related Accidents Figure 4. Time series of Part 91 accident rate for all weather-related accidents (top curve) and fatal weather-related accidents (bottom curve) in weather factor citations per 100,000 flight hours. To investigate year-to-year progress in meeting accident rate reduction goals, rates were plotted for each year and a least squares line was fit to the data. Curves were plotted separately for Parts 91, 121, and 135; both all weather-related and fatal weather related accident rates were plotted on the graphs. Results for Parts 91, 121, and 135 are shown in Figures 4, 5, and 6, respectively. The goals shown in text on the graphs represent an 80 percent reduction in the mean accident rates for 1994 through 1996 (the same baseline used in generating the reduction rates in Figure 3). The end result, however, is shown as a trend, which represents the least squares value for 2006, rather than the mean of the final two years. Table A-2 in Appendix A presents accident reduction results for weatherrelated accidents supporting Figures 4 through 6. Part 91. The Part 91 (General Aviation) accident experience exhibited in Figure 4 showed a fairly steady drop for the first five years, after which the rate rose for two years before starting another steady drop. It is interesting that the shapes of the two curves are so similar, suggesting that a certain percentage of the accidents naturally result in fatalities. However, this relationship was not evident in the data from Parts 121 and 135. Note for comparison purposes that there were between 1 and 2 accidents per 100,000 flight hours. Part 121. The Part 121 (Larger Commercial Carriers) accident rate experience shown in Figure 5 is considerably noisier than the Part 91 data. This is probably due to the smaller sam-

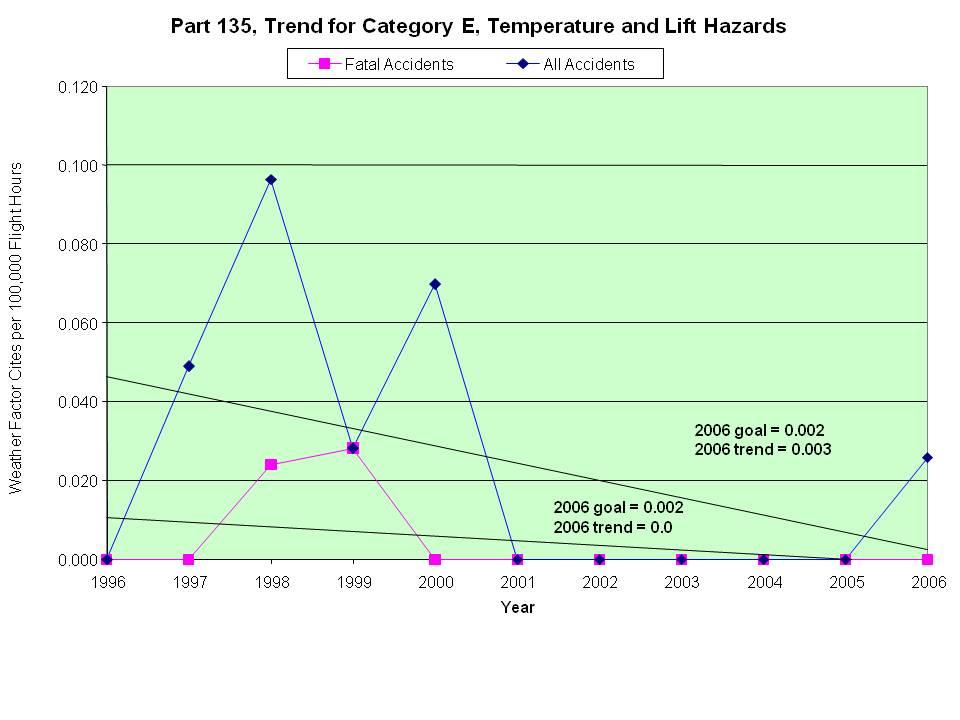
 and fatal weather-related accidents (bottom curve) in weather factor citations per 100,000 flight hours. Part 135. The Part 135 (Non-Scheduled and Smaller Scheduled Commercial Carriers) data in Figure 6 show rates of.")
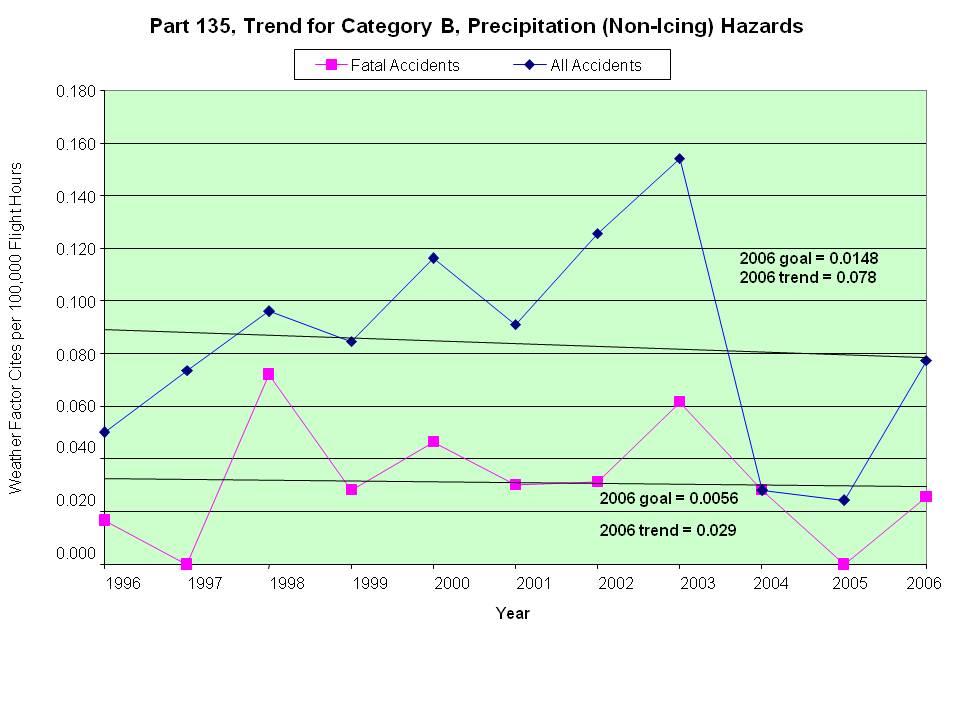
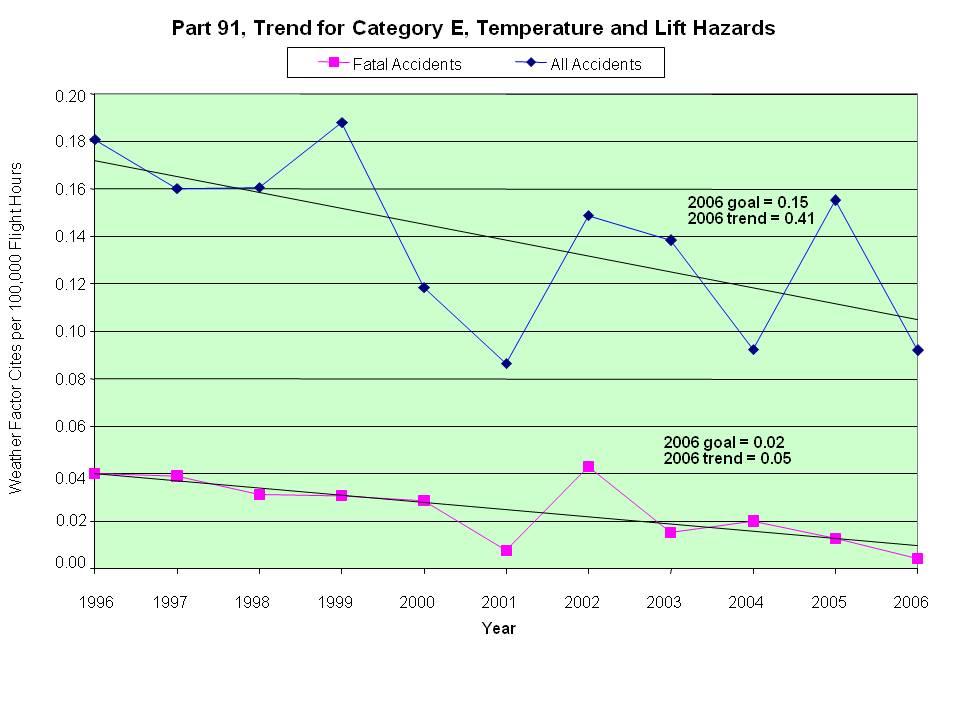
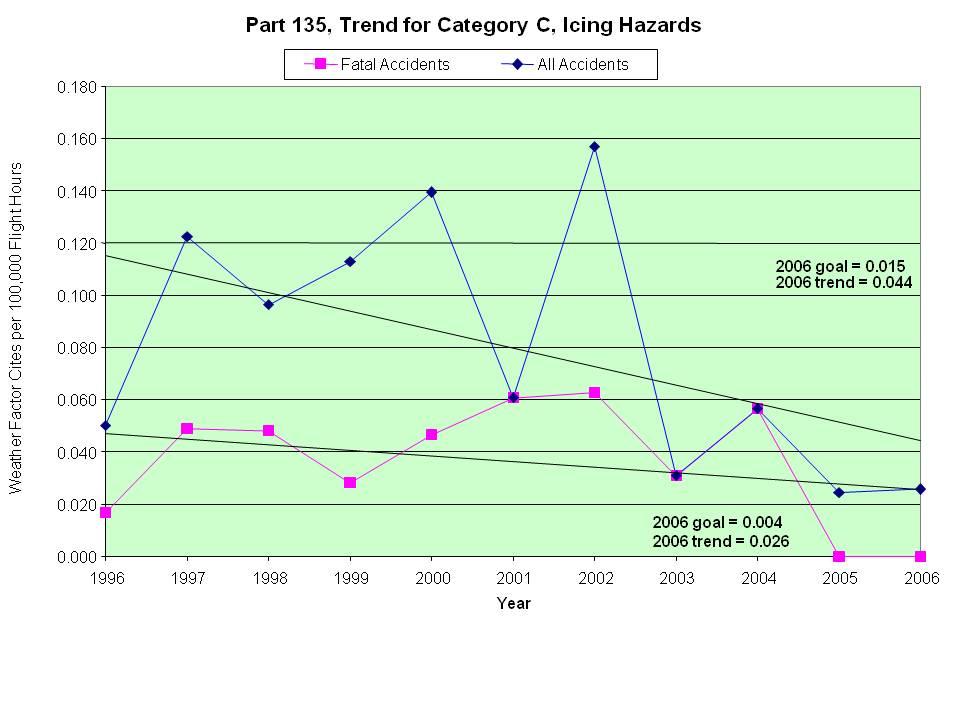
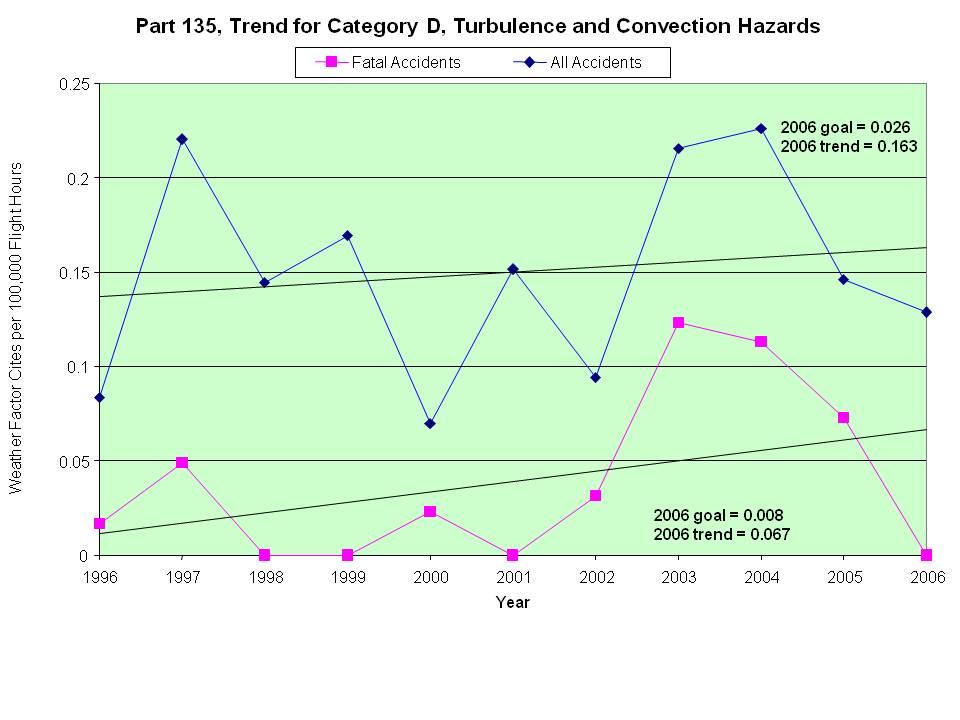
6 Figure 5. Time series of Part 121 accident rate for all weather-related accidents (top curve) and fatal weather-related accidents (bottom curve) in weather factor citations per 100,000 departures. ple size reflected in the significantly lower accident rates. In spite of the scatter in the data, however, a distinct downward trend is evident in the all weather-related accident rate curve. As mentioned earlier, there were insufficient weather-related fatal accidents to establish a trend an encouraging result in itself. Figure 6. Time series of Part 135 accident rate for all weather-related accidents (top curve) and fatal weather-related accidents (bottom curve) in weather factor citations per 100,000 flight hours. Part 135. The Part 135 (Non-Scheduled and Smaller Scheduled Commercial Carriers) data in Figure 6 show rates of.30 to.75 accidents per 100,000 flight hours, about a third of the Part 91 rates based on about one-sixth of the flight hours. This lower sample size may account for some of the year-to-year variability in the Part 135 data. In spite of its variability, however, the all weather-related accident rate shows a recognizable downward trend, as confirmed by the least squares line. The weather-related fatal accident rate, on the other hand, is the only category in which the least squares line shows an increasing accident rate. Recall, however, that the initial calculation of fatal accident rate reduction for this category (Figure 3) showed a significant decrease. This new, contrary result could be an artifact of the anomalously low value for the 1996 accident rate (compared to 1994, 1995, and 1997). On the other hand, the earlier result could reflect the sudden drop in the rate for the final two years of the period. In any case, the significant difference in results derived from two relatively straightforward treatments of the data suggests that conclusions should be based only on more careful analysis of the situation, which is beyond the scope of this paper Year Accident Rate Reduction by Weather Hazard During the 10-year period of the accident rate reduction initiative, over one hundred programs or projects were in progress or undertaken by Federal agencies or other partners (industry, academia, etc) to improve the effectiveness of weather support to aviation. Some were fairly broad, addressing, for example, the implementation of improved forecast models or the ability to get up-to-date weather information to the pilot in the cockpit. However, many of the programs addressed specific weather hazards. To gauge the effectiveness of these targeted initiatives, an analysis of the rates for accidents related to specific weather factors was conducted. The nature of the data used in this analysis was discussed above. Results of the analysis follow. Limitations. Consolidation of the 45 NTSB weather impact factors into 8 categories did not entirely eliminate the problem of small sample size. For Part 91, three of the categories accounted for about 81 percent of the weather factor citations, while two of the categories had less than 10 citations. This section focuses on results from the more populous weather factor categories with the more interesting and revealing results. The detailed data for all weather factors and hazard categories for Parts 91, 121, and 135 are presented in Tables A-3 through A-8 in Appendix A. Part 91 and 135 graphical results for the six more populous weather factor categories are presented in Appendix B. Note from Tables A-3 through A-8 that data broken out by weather factors were not available until In the absence of 1994 data, the goals shown in these tables and on the figures in Appendix B are
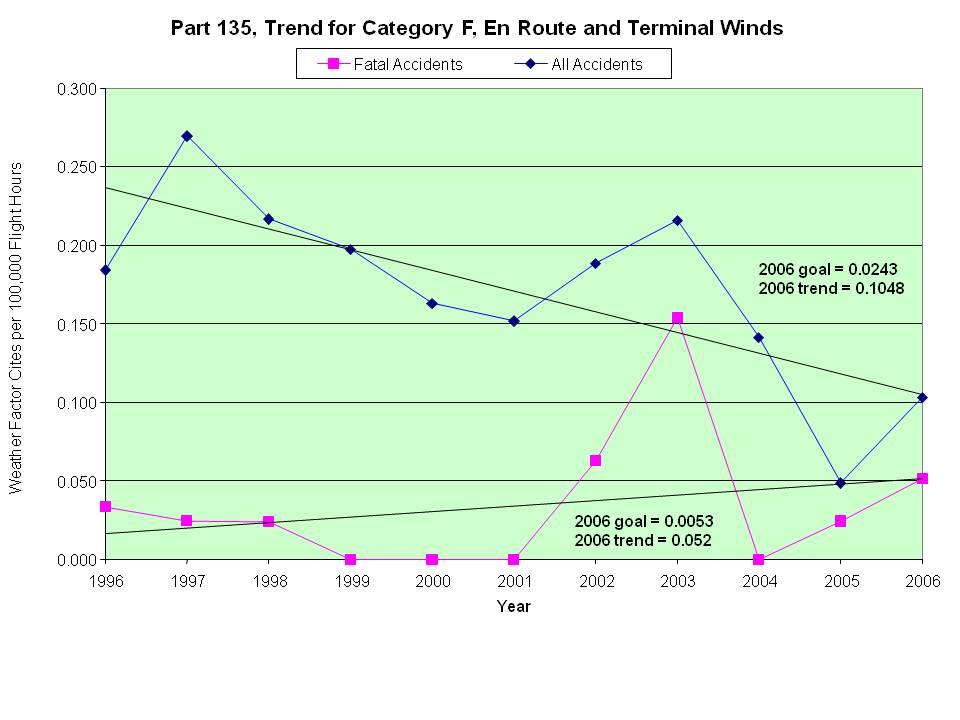
, turbulence and convection (b), and en route and terminal winds (c).")


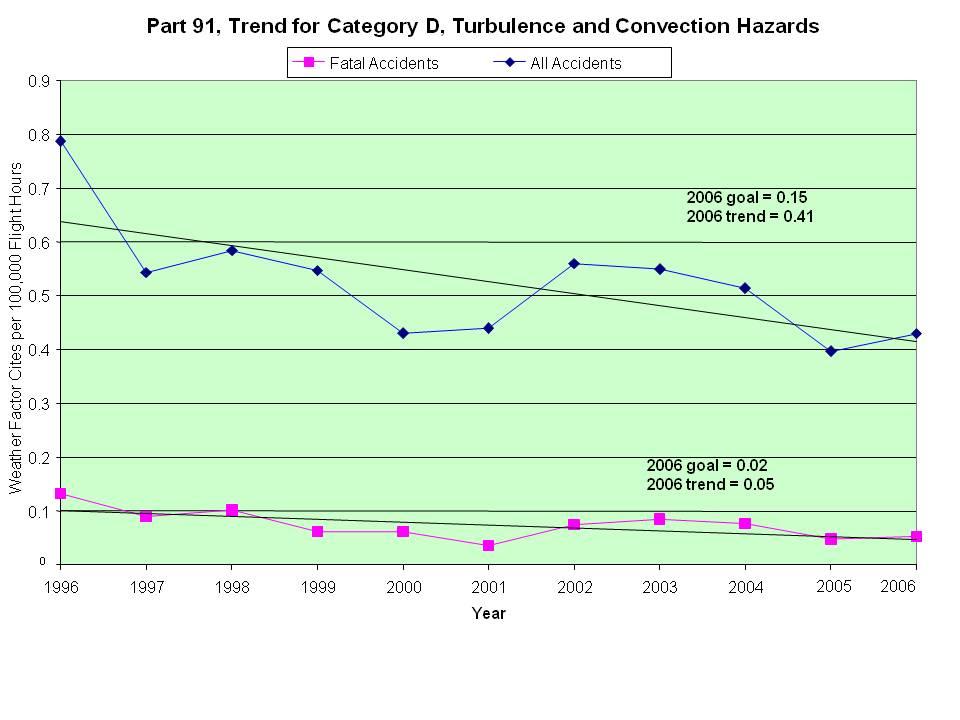
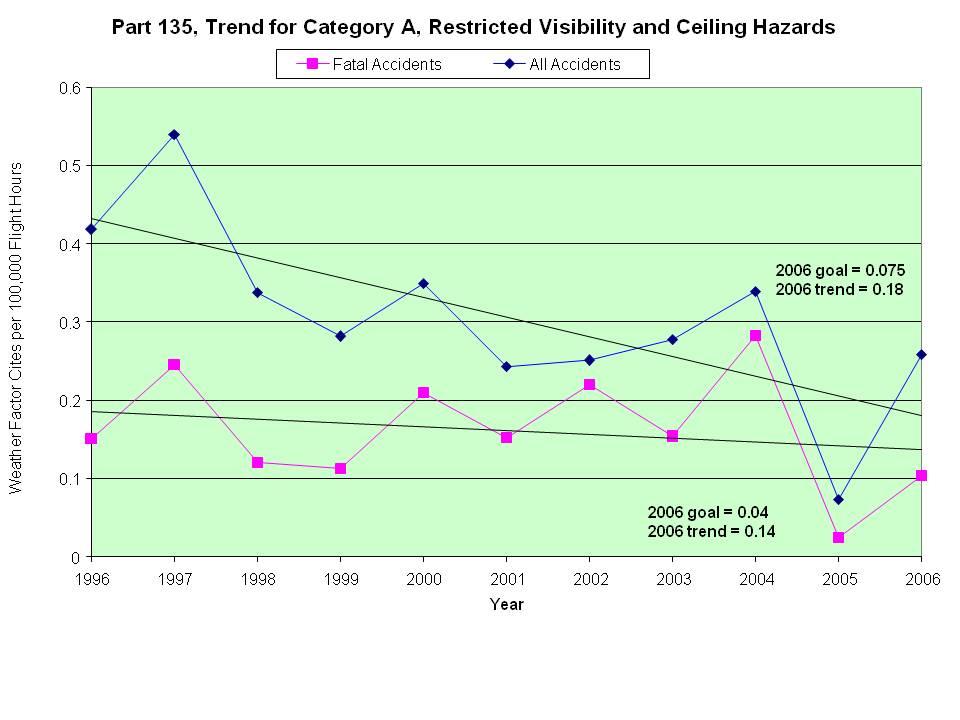
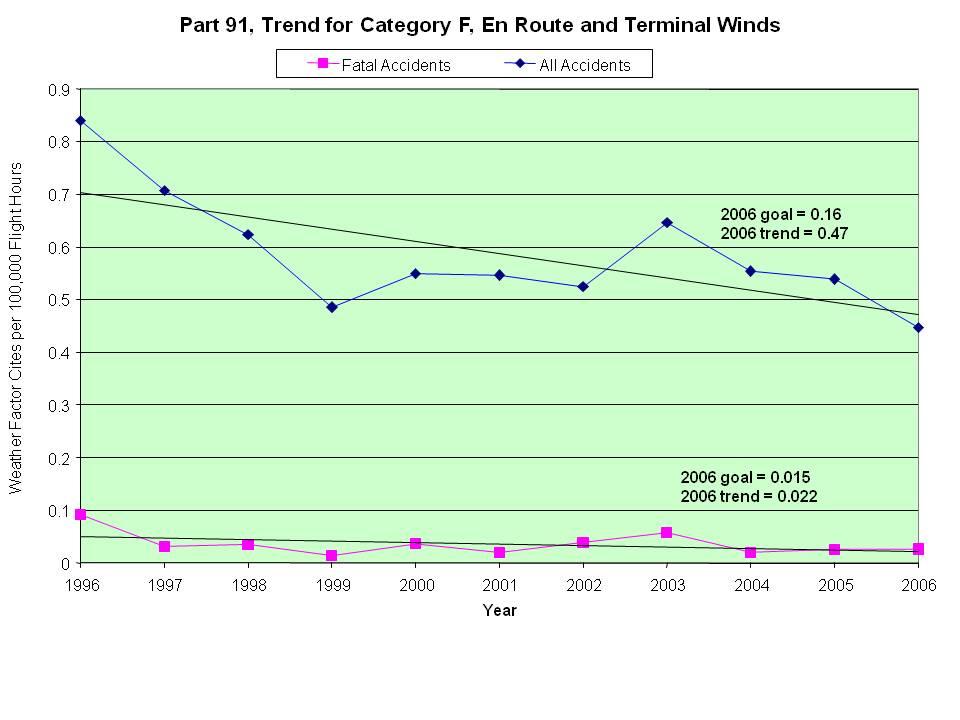
7 (a) (b) Part 91 Hazard Category 10-Year Trends. Part 91 results for three hazard categories are presented here. Figure 7 shows weather-related accident rate trends for restricted visibility and ceilings (a), turbulence and convection (b), and en route and terminal winds (c). Two features of these graphics are particularly noteworthy. First, all three curves take, to a greater or lesser degree, the shape of the curve for all weather accidents shown in Figure 4. They show an initial downward trend for several years followed by an increase and ending with a final drop. This suggests that one particular type of weather hazard was not responsible for the overall trend. The second noteworthy feature is the relationship between the all weather-related accident rates and the fatal weather-related accident rates the two curves on each chart. There is significant separation between the curves for turbulence and convection, and even greater separation for en route and terminal winds. Accidents related to these weather factors usually are not fatal. However, the fatal accident rate for restricted visibility and ceilings hazards is always at least 50 percent of the allaccident rate, and is 75 to 85 percent of that rate in some years. Clearly, programs that improve the ability of general aviation pilots and aircraft to deal with restricted visibility and ceilings have the greatest potential to save lives. Part 121 Turbulence and Convection Experience. Large commercial airlines (Part 121) have enjoyed a remarkable safety record during the previous 10 to 15 years. Overall accident rates have been low, and fatal accidents have become rare. For the most part, weatherrelated accidents are so rare that they defy (c) Figure 7(a). Time series of Part 91 accident rate for all reduced visibility and ceiling-related accidents (top curve) and fatal reduced visibility and ceiling-related accidents (bottom curve) in weather factor citations per 100,000 flight hours. Figures 7(b) and (c) are the same as 7(a) except for turbulence and convectionrelated accidents, and en route and terminal windrelated accidents, respectively. based on a two-year average of 1995 and 1996 data rather than the three-year average used in the earlier consideration of all weather hazard accident rates (Tables A-1 and A-2, and Figures 4, 5, and 6). Figure 8. Time series of Part 121 accident rate for all weather-related accidents (top curve) and turbulence and convection-related accidents (bottom curve) in weather factor citations per 100,000 departures.
8 meaningful statistical analysis. The exception to this rule is the impact of turbulence and convection on Part 121 aviation operations. Figure 8 illustrates this situation. The upper curve in this figure is the accident rate for all weather-related accidents (that is, all weather hazard categories combined), and the lower curve shows the rate for accidents in which factors in the turbulence and convection category were cited. At its lowest, the rate for accidents in which turbulence and convection were cited as an impact was 72 percent of the rate for all weather-related accidents, and in one year one or more impacts from the turbulence and convection category was cited in every weather-related accident. In the case of Part 121 operations, programs that address the impact of turbulence and convection show the greatest potential for reducing accidents. 4. SUMMARY AND FUTURE WORK 4.1 Summary Analysis of NTSB aviation accident data showed a downward trend in weather-related accidents and weather-related fatal accidents in most categories of operations in the 1997 to 2006 period. Although weather-related accident rates dropped significantly, the reduction did not meet the 80% goal. General aviation showed the greatest reduction, much of which occurred in the first five years. Most weather-related general aviation accidents were associated with turbulence and convection, ceiling and visibility, or en route and terminal winds; and accidents associated with ceiling and visibility were much more likely to result in fatalities than accidents in which other weather factors were cited. Most large airline weather-related accidents were associated with turbulence and convection. 4.2 Future Work OFCM plans to publish a formal report presenting these findings in the context of the NAWP. In addition to adding data for future years as they become available and updating the analysis as appropriate, a review of the plans and programs that were completed during the 10-year period and how they may have resulted in features of the weather-related accident trend will be conducted. REFERENCES NRC (National Research Council), 1995: Aviation Weather Services: A Call for Federal Leadership and Action, National Aviation Weather Services Committee, Aeronautics and Space Engineering Board, national Research Council, National Academy Press. OFCM (Office of the Federal Coordinator for Meteorological Services and Supporting Research), 1997: National Aviation Weather Program: Strategic Plan April 1997, prepared by the Joint Action Group for Aviation Weather for the National Aviation Weather Program Council. Washington, D.C. Available in PDF at text/nawp_fr.htm. OFCM, 1999: National Aviation Weather Initiatives, prepared by the Joint Action Group for Aviation Weather for the National Aviation Weather Program Council, Office of the Federal Coordinator for Meteorology, February Washington, D.C. Available in PDF at OFCM, 2001: National Aviation Weather Initiatives Final Baseline Tier 3/4 Report. April OFCM 2002: Aviation Weather Training: A Report for Emerging and Recently Implemented Aviation Weather Programs, Report No. FCM- R Available in PDF at aviation_training_report/index.html. OFCM 2003a: Aviation Weather Programs/ Projects (Tier 3/4/ Baseline Update), Report No. FCM-R , December Washington, D.C. OFCM 2003b: National Aviation Weather Program Mid-Course Assessment: Accident Reduction Trends Confirm Value of Coordinated R&D Programs, Report No. FCM-R , August Washington, D.C.: OFCM. Available in PDF at aviation_mid_course_review/pdf/nawa_entire.pdf OFCM 2004: Aviation Weather Programs/ Projects 2004 Update, Report No. FCM-R , December Washington, D.C. Available in PDF at tier3and4update/tier3and4report.htm
9 APPENDIX A NTSB ACCIDENT DATA AND FAA FLIGHT ACTIVITY ESTIMATES Table A-1. Accident and Flight Activity Data by NTSB Category of Service Part 91, General Aviation a Accident-Involved Aircraft Flight Hours Accident-Involved Aircraft per 100,000 Flight Hours Year All Wx All Fatal Wx Fatal All Wx All Fatal Wx Fatal , ,235, , ,906, , ,881, , ,591, , ,518, , ,246, , ,838, , ,431, , ,545, , ,998, , ,888, , ,168, , ,800, goal (proj.) Part 121, Larger Commercial Air Carriers Accidents Departures Accidents per 100,000 Departures Year All b Wx All Fatal b Wx Fatal All Wx All Fatal Wx Fatal ,238, ,457, ,228, ,318, ,979, ,308, ,468, ,954, ,508, ,433, ,023, ,130, ,410, goal (proj.) All accident statistics from NTSB. Flight-hour and departure estimates from FAA. a For Part 91 sector (general aviation), the data are for numbers of accident-involved aircraft, rather than numbers of accidents. b For 1994, includes one accident due to an illegal act. For 2001, includes 9/11/01 terrorist acts.
10 Table A-1. Accident and Flight Activity Data by NTSB Category of Service (Cont d) Part 135 (Scheduled and Nonscheduled) Accidents Flight Hours Accidents per 100,000 Flight Hours Wx Year All Wx All Fatal Wx Fatal All All Fatal Wx Fatal ,249, ,113, ,976, ,080, ,155, ,546, ,299, ,297, ,184, ,246, ,540, ,110, ,880, goal (proj.) Table A2. Accident Reduction Results by NTSB Category of Operation Baseline 2006 Goal 2006 actual Reduction Achieved (80% reduction) trend* 2-yr avg. trend* 2-yr avg. Part 91, General Aviation, accidents per 100,000 flight-hours All weather-related % 33% Fatal weatherrelated % 49% Part 121, Larger Commercial Carriers, accidents per 100,000 departures All weather-related % 30% Fatal weather-related N/A N/A Part 135, Commercial Nonscheduled & Smaller Scheduled, accidents per 100,000 flight-hours All weather-related % 23% Fatal weather-related % 37%
11 Table A-3a. Part 91 Weather Factor Trend Analysis, All Accidents Factor Citations, All Accidents Total A. Restricted Visibility and Ceiling Hazards Below Approach/Landing Minimums(1) Clouds (1) Fog (1) Haze/smoke (1) Low ceiling (1) Obscuration (1) Whiteout (1) Total hazard class citations Frequency per 100,000 flight-hours goal trend 0.21 B. Precipitation (Non-Icing) Hazards Rain (1) Snow (1) Drizzle/mist (1) Total hazard class citations Frequency per 100,000 flight-hours goal trend C. Icing Hazards Icing conditions (5) Ice Fog (5) Freezing rain (5) Carburetor Icing Conditions (9) Total hazard class citations Frequency per 100,000 flight-hours goal trend 0.103
12 Table A-3b. Part 91 Weather Factor Trend Analysis, All Accidents Factor Citations, All Accidents Total D. Turbulence and Convection Hazards Turbulence (thunderstorms) (2) Thunderstorm (2) Thunderstorm (outflow) (2) Microburst/dry (2) Microburst/wet (2) 1 1 Updraft (2) Downdraft (2) Gusts (6) Windshear (6) Dust devil/whirlwind (6) Variable wind (6) Sudden windshift (6) Mountain wave (7) Turbulence (7) Turbulence, clear air (CAT )(7) Turbulence in clouds (7) Turbulence (terrain induced) (7) Total hazard class citations Frequency per 100,000 flight-hours goal trend E. Temperature and Lift Hazards Temperature Inversion (3) 1 1 High density altitude (6) Temperature, high (6) Temperature, low (6) Thermal Lift (9) No thermal lift (9) Total hazard class citations Frequency per 100,000 flight-hours goal trend
13 Table A-3c. Part 91 Weather Factor Trend Analysis, All Accidents Factor Citations, All Accidents Total F. En Route and Terminal Winds Unfavorable wind (3) Crosswind (6) Tailwind (6) High wind (6) Total hazard class citations Frequency per 100,000 flight-hours goal trend Low Frequency Hazards G. Electrical Hazards Lightning (2) Static Discharge (9) 1 1 Total hazard class citations Frequency per 100,000 flight-hours goal trend H. Airborne Solids Hazards Sand/dust storm (1) 1 1 Hail (2) Total hazard class citations Frequency per 100,000 flight-hours goal trend I. Other Other Total hazard class citations Frequency per 100,000 flight-hours
14 Table A-4a. Part 91 Weather Factor Trend Analysis, Fatal Accidents Factor Citations, Fatal Accidents Total A. Restricted Visibility and Ceiling Hazards Below Approach/Landing Minimums(1) Clouds (1) Fog (1) Haze/smoke (1) Low ceiling (1) Obscuration (1) Whiteout (1) Total hazard class citations Frequency per 100,000 flight-hours goal trend 0.18 B. Precipitation (Non-Icing) Hazards Rain (1) Snow (1) Drizzle/mist (1) Total hazard class citations Frequency per 100,000 flight-hours goal trend C. Icing Hazards Icing conditions (5) Ice Fog (5) Freezing rain (5) Carburetor Icing Conditions (9) Total hazard class citations Frequency per 100,000 flight-hours goal trend 0.009
15 Table A-4b. Part 91 Weather Factor Trend Analysis, Fatal Accidents D. Turbulence and Convection Hazards Factor Citations, Fatal Accidents Total Turbulence (thunderstorms) (2) Thunderstorm (2) Thunderstorm (outflow) (2) Microburst/dry (2) Microburst/wet (2) 1 1 Updraft (2) 1 1 Downdraft (2) Gusts (6) Windshear (6) Dust devil/whirlwind (6) 1 1 Variable wind (6) Sudden windshift (6) Mountain wave (7) Turbulence (7) Turbulence, clear air (CAT )(7) Turbulence in clouds (7) Turbulence (terrain induced) (7) Total hazard class citations Frequency per 100,000 flight-hours goal trend E. Temperature and Lift Hazards Temperature Inversion (3) 0 High density altitude (6) Temperature, high (6) 1 1 Temperature, low (6) Thermal Lift (9) 0 No thermal lift (9) Total hazard class citations Frequency per 100,000 flight-hours goal trend 0.010
16 Table A-4c. Part 91 Weather Factor Trend Analysis, Fatal Accidents Factor Citations, Fatal Accidents Total F. En Route and Terminal Winds Unfavorable wind (3) Crosswind (6) Tailwind (6) High wind (6) Total hazard class citations Frequency per 100,000 flight-hours goal trend Low Frequency Hazards G. Electrical Hazards Lightning (2) Static Discharge (9) 1 1 Total hazard class citations Frequency per 100,000 flight-hours goal trend H. Airborne Solids Hazards Sand/dust storm (1) 1 1 Hail (2) Total hazard class citations Frequency per 100,000 flight-hours goal trend I. Other Other Total hazard class citations Frequency per 100,000 flight-hours
17 Table A-5a. Part 121 Weather Factor Trend Analysis, All Accidents Factor Citations, All Accidents Total All Factors Frequency per 100,000 departures goal projection A. Restricted Visibility and Ceiling Hazards Fog (1) Low ceiling (1) 1 1 Whiteout (1) 1 1 Total hazard class citations B. Precipitation (Non-Icing) Hazards Rain (1) Snow (1) Drizzle/mist (1) 1 1 Total hazard class citations C. Icing Hazards Icing conditions (5) 1 1 Total hazard class citations
18 Table A-5b. Part 121 Weather Factor Trend Analysis, All Accidents Factor Citations, All Accidents Total D. Turbulence and Convection Hazards Turbulence (thunderstorms) (2) Thunderstorm Turbulence, convection induced (2) Gusts (6) Windshear (6) Mountain wave (7) 1 1 Turbulence (7) Turbulence, clear air (CAT )(7) Turbulence, terrain induced 1 1 Turbulence in clouds (7) Total hazard class citations Frequency per 100,000 departures goal projection E. Temperature and Lift Hazards Temperature, high (6) Total hazard class citations F. En Route and Terminal Winds Unfavorable wind (3) High Wind 1 1 Crosswind (6) Total hazard class citations H. Airborne Solids Hazards Hail (2) 1 1 Total hazard class citations I. Other Total hazard class citations
19 Table A-6a. Part 121 Weather Factor Trend Analysis, Fatal Accidents Factor Citations, Fatal Accidents Total All Factors Frequency per 100,000 departures goal projection A. Restricted Visibility and Ceiling Hazards Fog (1) 0 Low ceiling (1) 0 Whiteout (1) 0 Total hazard class citations B. Precipitation (Non-Icing) Hazards Rain (1) 0 Snow (1) 0 Drizzle/mist (1) 0 Total hazard class citations C. Icing Hazards Icing conditions (5) 0 Total hazard class citations
20 Table A-6b. Part 121 Weather Factor Trend Analysis, Fatal Accidents Factor Citations, Fatal Accidents Total D. Turbulence and Convection Hazards Turbulence (thunderstorms) (2) 0 Thunderstorm 0 Turbulence, convection induced (2) 0 Gusts (6) 0 Windshear (6) 0 Mountain wave (7) 0 Turbulence (7) 0 Turbulence, clear air (CAT )(7) 1 1 Turbulence, terrain induced Turbulence in clouds (7) 0 Total hazard class citations Frequency per 100,000 departures goal projection E. Temperature and Lift Hazards Temperature, high (6) 1 1 Total hazard class citations F. En Route and Terminal Winds Unfavorable wind (3) 0 High Wind Crosswind (6) 0 Total hazard class citations H. Airborne Solids Hazards Hail (2) 0 Total hazard class citations I. Other Total hazard class citations
21 Table A-7a. Part 135 Weather Factor Trend Analysis, All Accidents A. Restricted Visibility and Ceiling Hazards Factor Citations, All Accidents Total Below Approach/Landing Minimums(1) Clouds (1) Fog (1) Low ceiling (1) Obscuration (1) Whiteout (1) Total hazard class citations Frequency per 100,000 flight-hours goal projection 0.18 B. Precipitation (Non-Icing) Hazards Rain (1) Snow (1) Drizzle/mist (1) Total hazard class citations Frequency per 100,000 flight-hours goal projection C. Icing Hazards Icing conditions (5) Freezing rain (5) Carburetor Icing Conditions (9) Total hazard class citations Frequency per 100,000 flight-hours goal projection goal projection 0.003
22 Table A-7b. Part 135 Weather Factor Trend Analysis, All Accidents Factor Citations, All Accidents Total D. Turbulence and Convection Hazards Turbulence (thunderstorms) (2) 1 1 Thunderstorm (2) Downdraft (2) Microburst/wet (2) 1 1 Gusts (6) Windshear Sudden windshift (6) 1 1 Variable wind (6) Turbulence (7) Turbulence (convective induced) (7) 1 1 Turbulence in clouds (7) 1 1 Mountain wave (7) 1 1 Turbulence (terrain induced) (7) Total hazard class citations Frequency per 100,000 flight-hours goal projection E. Temperature and Lift Hazards High density altitude (6) Temperature, low (6) 1 1 Total hazard class citations Frequency per 100,000 flight-hours goal projection 0.003
23 Table A-7c. Part 135 Weather Factor Trend Analysis, All Accidents Factor Citations, All Accidents Total F. En Route and Terminal Winds Unfavorable wind (3) Crosswind (6) High wind (6) Tailwind (6) Total hazard class citations Frequency per 100,000 flight-hours goal projection G. Electrical Hazards Lightning (2) 1 1 Total hazard class citations Frequency per 100,000 flight-hours goal projection 0.00 H. Airborne Solids Hazards Sand/dust storm (1) 1 1 Total hazard class citations Frequency per 100,000 flight-hours goal projection 0.01
24 Table A-8a. Part 135 Weather Factor Trend Analysis, Fatal Accidents Factor Citations, Fatal Accidents Total A. Restricted Visibility and Ceiling Hazards Below Approach/Landing Minimums(1) 1 1 Clouds (1) Fog (1) Low ceiling (1) Obscuration (1) Whiteout (1) Total hazard class citations Frequency per 100,000 flight-hours goal projection 0.14 B. Precipitation (Non-Icing) Hazards Rain (1) Snow (1) Drizzle/mist (1) Total hazard class citations Frequency per 100,000 flight-hours goal projection C. Icing Hazards Icing conditions (5) Freezing rain (5) 1 1 Carburetor Icing Conditions (9) 0 Total hazard class citations Frequency per 100,000 flight-hours goal projection 0.026
25 Table A-8b. Part 135 Weather Factor Trend Analysis, Fatal Accidents Factor Citations, Fatal Accidents Total D. Turbulence and Convection Hazards 0 Turbulence (thunderstorms) (2) 1 1 Thunderstorm (2) Downdraft (2) Microburst/wet (2) 1 1 Gusts (6) Windshear Sudden windshift (6) 0 Variable wind (6) 0 Turbulence (7) 0 Turbulence (convective induced) (7) 1 1 Turbulence in clouds (7) 1 1 Mountain wave (7) 1 1 Turbulence (terrain induced) (7) Total hazard class citations Frequency per 100,000 flight-hours goal projection E. Temperature and Lift Hazards High density altitude (6) Temperature, low (6) 1 1 Total hazard class citations Frequency per 100,000 flight-hours goal projection 0.000
26 Table A-8c. Part 135 Weather Factor Trend Analysis, Fatal Accidents Factor Citations, Fatal Accidents Total F. En Route and Terminal Winds Unfavorable wind (3) 1 1 Crosswind (6) High wind (6) Tailwind (6) Total hazard class citations Frequency per 100,000 flight-hours goal projection G. Electrical Hazards Lightning (2) 0 Total hazard class citations Frequency per 100,000 flight-hours goal projection H. Airborne Solids Hazards Sand/dust storm (1) 1 1 Total hazard class citations Frequency per 100,000 flight-hours goal projection 0.000


27 APPENDIX B GRAPHS OF WEATHER-RELATED ACCIDENT DATA SERIES BYWEATHER HAZARD CATEGORYWITHIN NTSB CATEGORY OF OPERATION
28
29
30
31
32
P1.1 THE NATIONAL AVIATION WEATHER PROGRAM: AN UPDATE ON IMPLEMENTATION
 P1.1 THE NATIONAL AVIATION WEATHER PROGRAM: AN UPDATE ON IMPLEMENTATION Thomas S. Fraim* 1, Mary M. Cairns 1, and Anthony R. Ramirez 2 1 NOAA/OFCM, Silver Spring, MD 2 Science and Technology Corporation,
Weather Information for Surface Transportation (WIST): Update on Weather Impacts and WIST Progress
: Update on Weather Impacts and WIST Progress") Weather Information for Surface Transportation (WIST): Update on Weather Impacts and WIST Progress Samuel P. Williamson Office of the Federal Coordinator for Meteorological Services and Supporting Research
Weather Information for Surface Transportation (WIST): Update on Weather Impacts and WIST Progress Samuel P. Williamson Office of the Federal Coordinator for Meteorological Services and Supporting Research
Montréal, 7 to 18 July 2014
 INTERNATIONAL CIVIL AVIATION ORGANIZATION WORLD METEOROLOGICAL ORGANIZATION MET/14-WP/34 28/5/14 Meteorology (MET) Divisional Meeting (2014) Commission for Aeronautical Meteorology Fifteenth Session Montréal,
Doppler Weather Radars and Weather Decision Support for DP Vessels
 Author s Name Name of the Paper Session DYNAMIC POSITIONING CONFERENCE October 14-15, 2014 RISK SESSION Doppler Weather Radars and By Michael D. Eilts and Mike Arellano Weather Decision Technologies, Inc.
NCAR UCAR. 50 th Anniversary Lecture
 NCAR & UCAR 50 th Anniversary Lecture Turbulence, Wind Shear, Toxin Attacks, and Other Things That Go Bump In the Night: Applied Research for Real-Life Problems Bill Mahoney National Center for Atmospheric
METEOROLOGY PANEL (METP) WORKING GROUP- METEOROLOGICAL OPERATION GROUP (MOG) FIRST MEETING
 WORKING GROUP- METEOROLOGICAL OPERATION GROUP (MOG) FIRST MEETING") 8 28/7/15 METEOROLOGY PANEL (METP) WORKING GROUP- METEOROLOGICAL OPERATION GROUP (MOG) FIRST MEETING Gatwick, United Kingdom, 08 to 11 September 2015 Agenda Item 3: Matters relating to SADIS 3.3: Operations
8 28/7/15 METEOROLOGY PANEL (METP) WORKING GROUP- METEOROLOGICAL OPERATION GROUP (MOG) FIRST MEETING Gatwick, United Kingdom, 08 to 11 September 2015 Agenda Item 3: Matters relating to SADIS 3.3: Operations
STUDY UNIT SEVENTEEN GRAPHICAL AIRMAN S METEOROLOGICAL ADVISORY (G-AIRMET)
") STUDY UNIT SEVENTEEN GRAPHICAL AIRMAN S METEOROLOGICAL ADVISORY (G-AIRMET) 341 (10 pages of outline) 17.1 Product Description....................................................... 341 17.2 Issuance...............................................................
STUDY UNIT SEVENTEEN GRAPHICAL AIRMAN S METEOROLOGICAL ADVISORY (G-AIRMET) 341 (10 pages of outline) 17.1 Product Description....................................................... 341 17.2 Issuance...............................................................
Advances in Weather Technology
 Advances in Weather Technology Dr. G. Brant Foote National Center for Atmospheric Research 16 May 2001 NCAR Research Results in Aviation Weather Built on the foundation of the nation s long-standing investment
RISK FACTORS FOR FATAL GENERAL AVIATION ACCIDENTS IN DEGRADED VISUAL CONDITIONS
 RISK FACTORS FOR FATAL GENERAL AVIATION ACCIDENTS IN DEGRADED VISUAL CONDITIONS Jana M. Price Loren S. Groff National Transportation Safety Board Washington, D.C. The prevalence of weather-related general
Accident Prevention Program
 Thunderstorm Accident Prevention Program Thunderstorms - Don't Flirt...Skirt'Em Pilot's Beware! Within the route you intend to fly may lie a summer hazard in wait for the unwary--the Thunderstorm. The
Paine Field Airport Existing and Future Environmental Assessment, Initiation of Commercial Service Noise Analysis
 Paine Field Airport Existing and Future Environmental Assessment, Initiation of Commercial Service Noise Analysis July 2012 Prepared by: BridgeNet International 3151 Airway Avenue Building I-2 Costa Mesa,
NextGen Update. Cecilia Miner May, 2017
 NextGen Update Cecilia Miner May, 2017 Agenda What s changed? NextGen Background FAA NextGen Weather Architecture NextGen Weather Processor Aviation Weather Display Common Support Services - Weather NWS
Airport Meteorology Analysis
 Airport Meteorology Analysis Alex Alshtein Kurt Etterer October 2014 Presented at ICAO Business Class 2014 ICAO, Montreal, Canada Approved for Public Release: 14-3466. Distribution Unlimited. October 2014
Deutscher Wetterdienst
 WakeNet3-Greenwake Workshop Wake Vortex & Wind Monitoring Sensors in all weather conditions DWD s new Remote Wind Sensing Equipment for an Integrated Terminal Weather System (ITWS) Frank Lehrnickel Project
Use of radar to detect weather
 2 April 2007 Welcome to the RAP Advisory Panel Meeting Use of radar to detect weather G. Brant Foote Brant Director Foote Rita Roberts Roelof Bruintjes Research Applications Program Radar principles Radio
Building a Weather-Ready Nation For Aviation
 Building a Weather-Ready Nation For Aviation Laura Furgione NOAA Deputy Assistant Administrator for Weather Services Friends and Partners in Aviation Weather July 22, 2014 Case for Change Average Year
Montréal, 7 to 18 July 2014
 INTERNATIONAL CIVIL AVIATION ORGANIZATION WORLD METEOROLOGICAL ORGANIZATION 6/5/14 Meteorology (MET) Divisional Meeting (2014) Commission for Aeronautical Meteorology Fifteenth Session Montréal, 7 to 18
AOPA. Mitigating Turbulence Impacts in Aviation Operations. General Aviation Perspective
 AOPA Mitigating Turbulence Impacts in Aviation Operations General Aviation Perspective Rune Duke Senior Director, Airspace & Air Traffic Services Aircraft Owners & Pilots Association AOPA Air Safety Institute
TOPICS: What are Thunderstorms? Ingredients Stages Types Lightning Downburst and Microburst
 THUNDERSTORMS TOPICS: What are Thunderstorms? Ingredients Stages Types Lightning Downburst and Microburst What are Thunderstorms? A storm produced by a cumulonimbus cloud that contains lightning and thunder
Smoother Rides Through Better Turbulence Forecasting
 Smoother Rides Through Better Turbulence Forecasting White Paper www.dtn.com / 1.800.610.0777 Copyright 2017 DTN DTN has devoted years of research with some of the top scientists in the aviation weather
AWOS Level Descriptions
 AWOS Level Descriptions AWOS System Configurations. The AWOS is a modular system utilizing a central processor which may receive input from several sensors. Eight standard groups of sensors are defined
Implementation Guidance of Aeronautical Meteorological Observer Competency Standards
 Implementation Guidance of Aeronautical Meteorological Observer Competency Standards The following guidance is supplementary to the AMP competency Standards endorsed by Cg-16 in Geneva in May 2011. Please
FAA Weather Research Plans
 FAA Weather Research Plans Presented to: Friends /Partners in Aviation Weather Vision Forum By: Ray Moy FAA Aviation Weather Office Date: Aviation Weather Research Program (AWRP) Purpose: Applied Research
Calculates CAT and MWT diagnostics. Paired down choice of diagnostics (reduce diagnostic redundancy) Statically weighted for all forecast hours
 Statically weighted for all forecast hours") 1 Major Upgrades All diagnostics mapped to Eddy Dissipation Rate ADDS now displays EDR values CAT diagnostic extended down to 1000 feet MSL & forecast hours 15 and 18 New Mountain Wave diagnostic CAT diagnostics
1 Major Upgrades All diagnostics mapped to Eddy Dissipation Rate ADDS now displays EDR values CAT diagnostic extended down to 1000 feet MSL & forecast hours 15 and 18 New Mountain Wave diagnostic CAT diagnostics
Verification and performance measures of Meteorological Services to Air Traffic Management (MSTA)
") Verification and performance measures of Meteorological Services to Air Traffic Management (MSTA) Background Information on the accuracy, reliability and relevance of products is provided in terms of verification
Verification and performance measures of Meteorological Services to Air Traffic Management (MSTA) Background Information on the accuracy, reliability and relevance of products is provided in terms of verification
Transparency: Redoubt ash cloud
 Module 1 Investigation 3 Transparency: Redoubt ash cloud Aerial view of Redoubt Volcano during a continuous, low-level eruption of steam and ash December 18, 1989 Source: photo by W. White, USGS, http://www.avo.alaska.edu/avo3/volc/redou/photo.htm
Translating Meteorological Observations into Air Traffic Impacts in Singapore Flight Information Region (FIR)
") Translating Meteorological Observations into Air Traffic Impacts in Singapore Flight Information Region (FIR) Michael Robinson The MITRE Corporation Approved for Public Release; Distribution Unlimited.
Translating Meteorological Observations into Air Traffic Impacts in Singapore Flight Information Region (FIR) Michael Robinson The MITRE Corporation Approved for Public Release; Distribution Unlimited.
SATELLITE SIGNATURES ASSOCIATED WITH SIGNIFICANT CONVECTIVELY-INDUCED TURBULENCE EVENTS
 SATELLITE SIGNATURES ASSOCIATED WITH SIGNIFICANT CONVECTIVELY-INDUCED TURBULENCE EVENTS Kristopher Bedka 1, Wayne Feltz 1, John Mecikalski 2, Robert Sharman 3, Annelise Lenz 1, and Jordan Gerth 1 1 Cooperative
Weather Technology in the Cockpit (WTIC) Shortfall Analysis of Weather Information in Remote Airspace Friends and Partners of Aviation Weather Summer
 Shortfall Analysis of Weather Information in Remote Airspace Friends and Partners of Aviation Weather Summer") Weather Technology in the Cockpit (WTIC) Shortfall Analysis of Weather Information in Remote Airspace Friends and Partners of Aviation Weather Summer Meeting Tim Myers Metron Aviation August 26, 2015 2
Weather Technology in the Cockpit (WTIC) Shortfall Analysis of Weather Information in Remote Airspace Friends and Partners of Aviation Weather Summer Meeting Tim Myers Metron Aviation August 26, 2015 2
An Initial Assessment of a Clear Air Turbulence Forecasting Product. Ankita Nagirimadugu. Thomas Jefferson High School for Science and Technology
 An Initial Assessment of a Clear Air Turbulence Forecasting Product Ankita Nagirimadugu Thomas Jefferson High School for Science and Technology Alexandria, VA Abstract Clear air turbulence, also known
Insert Title Here Presented by: Steve Abelman Manager of Weather Technology, American Airlines
 Insert Title Here Presented by: Steve Abelman Manager of Weather Technology, American Airlines September 5, 2018 I Really Can t Figure Out a Good Title for this Turbulence Workshop Presentation Presented
Strengthening the CDM triad: A view from the cockpit
 Strengthening the CDM triad: A view from the cockpit Captain Rocky Stone Chief Technical Pilot United Airlines Friends and Partners in Aviation Weather October 21, 2010 NextGen weather concept Current
Recap of the NTSB PIREP Forum: Optimizing Safety Benefits for Pilots, ATC, and Meteorologists. Paul Suffern NTSB Meteorologist
 Recap of the NTSB PIREP Forum: Optimizing Safety Benefits for Pilots, ATC, and Meteorologists Paul Suffern NTSB Meteorologist 1 2 Wx Accident Trend 3 Preflight Planning TAF KRDU 162340Z 1700/1724 28003KT
Network Severe Weather Programme
 Network Severe Weather Programme David White Network Severe Weather programme Severe Weather is an EVENT with associated Uncertainty which requires Managing to protect the ATC environment & the integrity
FLYSAFE meteorological hazard nowcasting driven by the needs of the pilot
 FLYSAFE meteorological hazard nowcasting driven by the needs of the pilot R. W. Lunnon, Met Office, Exeter, EX1 3PB, United Kingdom., Thomas Hauf, Thomas Gerz, and Patrick Josse. 1. Introduction The FLYSAFE
Weather Analysis and Forecasting
 Weather Analysis and Forecasting An Information Statement of the American Meteorological Society (Adopted by AMS Council on 25 March 2015) Bull. Amer. Meteor. Soc., 88 This Information Statement describes
P4.4 DISTANCE LEARNING TRAINING FOR AVIATION FORECASTERS: THE IMPACT OF WEATHER ON AIR TRAFFIC MANAGEMENT
 P4.4 DISTANCE LEARNING TRAINING FOR AVIATION FORECASTERS: THE IMPACT OF WEATHER ON AIR TRAFFIC MANAGEMENT Daniel K. Cobb 1, T. Dulong 2, and V. C. Johnson 2 1 NOAA/NWS 2 UCAR/COMET, Boulder CO 1. INTRODUCTION
10. Severe Local Storms (Thunderstorms)
") 10. Severe Local Storms (Thunderstorms) Hail. Can be larger than softball (10 cm in diameter) Smaller damage ratios, but over large areas In USA causes more than $1 billion crop and property damage each
10. Severe Local Storms (Thunderstorms) Hail. Can be larger than softball (10 cm in diameter) Smaller damage ratios, but over large areas In USA causes more than $1 billion crop and property damage each
The Ice Crystal Weather Threat to Engines
 Jeanne Mason Boeing Commercial Airplanes The Ice Crystal Weather Threat to Engines BOEING is a trademark of Boeing Management Company. Filename.ppt 1 Agenda Introduction Recognition of engine power-loss
Trend
 Fact Sheet Safety Safety Trends Accidents are gathered using multiple sources and validated and classified by the Accident Classification Technical Group (ACTG). The technical group is comprised of industry
J11.3 Aviation service enhancements across the National Weather Service Central Region
 J11.3 Aviation service enhancements across the National Weather Service Central Region Brian P. Walawender * National Weather Service Central Region HQ, Kansas City, MO Jennifer A. Zeltwanger National
Section 7: Hazard Avoidance
 7.1 In-Flight Hazard Awareness Section 7: Hazard Avoidance As technology improves, pilots have more and more real-time information within reach in all phases of flight. Terrain proximity, real-time weather
Quantifying Wx Benefits
 Quantifying Wx Benefits Refresher on how weather was justified. Lessons learned. Incorporating airline industry needs and benchmarks to validate business cases? Nicholas Stoer, Consultant, Retired FAA
Dr. Ananthakrishna Sarma, Senior Scientist, SAIC, 1710 SAIC Dr., McLean, VA 22102
 Dr. Ananthakrishna Sarma, Senior Scientist, SAIC, 1710 SAIC Dr., McLean, VA 22102 Presented at the Airships to the Arctic Conference of the Van Horne Institute 5-6 December 2011 Introduction Weather hazards
Weather Information for Road Managers
 Weather Information for Road Managers by Paul A. Pisano, Lynette C. Goodwin and Andrew D. Stern How Does Weather Affect Roads? The complex interactions between weather and roads have major affects on traffic
DYNAMICS ACT-AM-1. Students will identify the climate and seasonal changes of the earth s atmosphere.
 PROGRAM CONCENTRATION: CAREER PATHWAY: COURSE TITLE: Architecture, Construction, Communications & Transportation Flight Operations Aviation Meteorology Atmospheric dynamics and concepts are addressed to
Guidance on Aeronautical Meteorological Observer Competency Standards
 Guidance on Aeronautical Meteorological Observer Competency Standards The following guidance is supplementary to the AMP competency Standards endorsed by Cg-16 in Geneva in May 2011. Format of the Descriptions
New Meteorological Services Supporting ATM
 New Meteorological Services Supporting ATM Meteorological Services in the Terminal Area (MSTA)...providing MET services to support a move from Air Traffic Control (ATC) to more integrated and collaborative
Answer Key. Page 1 of 5
 Answer Key Name: Score: [1] When telephoning a weather briefing facility for preflight weather information, pilots should state A. whether they intend to fly VFR only. B. the full name and address of the
Measuring In-cloud Turbulence: The NEXRAD Turbulence Detection Algorithm
 Measuring In-cloud Turbulence: The NEXRAD Turbulence Detection Algorithm John K. Williams,, Greg Meymaris,, Jason Craig, Gary Blackburn, Wiebke Deierling,, and Frank McDonough AMS 15 th Conference on Aviation,
An Application of the Improved Models for Risk Assessment of Runway Excursion in Korea
 , pp.86-92 http://dx.doi.org/10.14257/astl.2016.138.20 An Application of the Improved Models for Risk Assessment of Runway Excursion in Korea Seuing-Beom Hong 1, Tukhtaev Dilshod 1, DoHyun Kim 1, 1 1 Department
Reprint 797. Development of a Thunderstorm. P.W. Li
 Reprint 797 Development of a Thunderstorm Nowcasting System in Support of Air Traffic Management P.W. Li AMS Aviation, Range, Aerospace Meteorology Special Symposium on Weather-Air Traffic Management Integration,
HAZARD DESCRIPTION... 1 LOCATION... 1 EXTENT... 1 HISTORICAL OCCURRENCES...
 WINTER STORM HAZARD DESCRIPTION... 1 LOCATION... 1 EXTENT... 1 HISTORICAL OCCURRENCES... 3 SIGNIFICANT PAST EVENTS... 4 PROBABILITY OF FUTURE EVENTS... 5 VULNERABILITY AND IMPACT... 5 Hazard Description
Complete Weather Intelligence for Public Safety from DTN
 Complete Weather Intelligence for Public Safety from DTN September 2017 White Paper www.dtn.com / 1.800.610.0777 From flooding to tornados to severe winter storms, the threats to public safety from weather-related
Federal Aviation Administration
 High Ice Water Content Research International Collaboration and Field Campaign Presented to: FPAW By: Tom Bond Date: Statement of Need Over the past 10+ years, it has been recognized that jet engine powerloss
UNITED STATES OF AMERICA NATIONAL TRANSPORTATION SAFETY BOARD WASHINGTON, D.C.
 SERVED: June 12, 1998 NTSB Order No. EA-4667 UNITED STATES OF AMERICA NATIONAL TRANSPORTATION SAFETY BOARD WASHINGTON, D.C. Adopted by the NATIONAL TRANSPORTATION SAFETY BOARD at its office in Washington,
Weather in the Connected Cockpit
 Weather in the Connected Cockpit What if the Cockpit is on the Ground? The Weather Story for UAS Friends and Partners of Aviation Weather November 2, 2016 Chris Brinton brinton@mosaicatm.com Outline Mosaic
TERMS OF REFERENCE Special Committee (SC) 230 Airborne Weather Detection Systems Revision 5
 230 Airborne Weather Detection Systems Revision 5") TERMS OF REFERENCE Special Committee (SC) 230 Airborne Weather Detection Systems Revision 5 REQUESTORS: Organization FAA Associate Administrator for Aviation Safety Person Ms. Peggy Gilligan SC LEADERSHIP:
TERMS OF REFERENCE Special Committee (SC) 230 Airborne Weather Detection Systems Revision 5 REQUESTORS: Organization FAA Associate Administrator for Aviation Safety Person Ms. Peggy Gilligan SC LEADERSHIP:
ADL110B ADL120 ADL130 ADL140 How to use radar and strike images. Version
 ADL110B ADL120 ADL130 ADL140 How to use radar and strike images Version 1.00 22.08.2016 How to use radar and strike images 1 / 12 Revision 1.00-22.08.2016 WARNING: Like any information of the ADL in flight
Weather Considerations for UAS Integration
 Weather Considerations for UAS Integration Scot Campbell 8 December 2016 Sponsor: Steve Abelman, ANG-C6 DISTRIBUTION STATEMENT A. Approved for public release: distribution unlimited. Legal Notices This
CAS & CAeM Aviation Research and Demonstration Project Paris-CDG airport
 World Meteorological Organization Working together in weather, climate and water WMO CAS & CAeM Aviation Research and Demonstration Project Paris-CDG airport WMO www.wmo.int Paris-CDG airport Mid-latitude
Flight Dispatcher Aviation Meteorology Required Knowledge
 Flight Dispatcher Aviation Meteorology Required Knowledge 3.1 THE EARTH'S ATMOSPHERE 1 Properties 2 Vertical Structure 3 ICAO Standard Atmosphere 3.2 ATMOSPHERIC PRESSURE 1 Pressure Measurements 2 Station
P474 SYDNEY AIRPORT WIND SHEAR ENCOUNTER - 15 APRIL 2007
 P474 SYDNEY AIRPORT WIND SHEAR ENCOUNTER - 15 APRIL 2007 Rodney Potts* 1, Barry Hanstrum 2 and Peter Dunda 2 1. CAWCR, Bureau of Meteorology, Melbourne, VIC, Australia 2. Bureau of Meteorology, Sydney,
Strengthening the CDM triad: A view from the cockpit
 Strengthening the CDM triad: A view from the cockpit Captain Rocky Stone Chief Technical Pilot United Airlines Friends and Partners in Aviation Weather July 21, 2010 NextGen Weather Concept Current NextGen
Deputy Director for Science NCAR Aviation Applications Program
 Icing: Ad Astra Per Aspera Marcia K. Politovich Deputy Director for Science NCAR Aviation Applications Program For ATC Workshop, Washington, DC 18 November 2014 NATIONAL CENTER FOR ATMOSPHERIC RESEARCH
The Montague Doppler Radar, An Overview
 ISSUE PAPER SERIES The Montague Doppler Radar, An Overview June 2018 NEW YORK STATE TUG HILL COMMISSION DULLES STATE OFFICE BUILDING 317 WASHINGTON STREET WATERTOWN, NY 13601 (315) 785-2380 WWW.TUGHILL.ORG
THUNDERSTORM OCCURENCE AND ASSOCIATED FLIGHT HAZARDS IN THE SOUTHERN PART OF ROMANIA
 SCIENTIFIC RESEARCH AND EDUCATION IN THE AIR FORCE-AFASES 2016 THUNDERSTORM OCCURENCE AND ASSOCIATED FLIGHT HAZARDS IN THE SOUTHERN PART OF ROMANIA Carmen STEFAN Romanian Aviation Academy, Bucharest, Romania
AMDAR Global Status, Benefits and Development Plans*
 AMDAR Global Status, Benefits and Development Plans* WMO CBS ET Aircraft Based Observations Bryce Ford * Adapted from Presentation at WMO Congress XVII, June 2015 by WMO CBS President, reviewed by WMO
Economic and Social Council
 United Nations Economic and Social Council Distr.: General 18 July 2016 Original: English Committee of Experts on Global Geospatial Information Management Sixth session New York, 3-5 August 2016 Item 2
7.1 The Schneider Electric Numerical Turbulence Forecast Verification using In-situ EDR observations from Operational Commercial Aircraft
 7.1 The Schneider Electric Numerical Turbulence Forecast Verification using In-situ EDR observations from Operational Commercial Aircraft Daniel W. Lennartson Schneider Electric Minneapolis, MN John Thivierge
Tornado Hazard Risk Analysis: A Report for Rutherford County Emergency Management Agency
 Tornado Hazard Risk Analysis: A Report for Rutherford County Emergency Management Agency by Middle Tennessee State University Faculty Lisa Bloomer, Curtis Church, James Henry, Ahmad Khansari, Tom Nolan,
3.1 NEXTGEN WEATHER REQUIREMENTS
 3.1 NEXTGEN WEATHER REQUIREMENTS Cheryl G. Souders FAA Air Traffic Organization, NextGen and Operations Planning, Washington, DC Steve Abelman NOAA National Weather Service, Silver Spring, Maryland Cecilia
Complementary Use of Airborne Wx Radar & Datalink Graphical Wx
 Complementary Use of Airborne Wx Radar & Datalink Graphical Wx What if to What next? Cheri Haynes XCELAR Friends/Partners in Aviation Weather Forum October 31, 2012 What if to What next? Today there are
Weather Technology in the Cockpit (WTIC) Program Program Update. Friends/Partners of Aviation Weather (FPAW) November 2, 2016
 Program Program Update. Friends/Partners of Aviation Weather (FPAW) November 2, 2016") Weather Technology in the Cockpit (WTIC) Program Program Update Friends/Partners of Aviation Weather (FPAW) November 2, 2016 Presented by Gary Pokodner, WTIC Program Manager Phone: 202.267.2786 Email:
Weather Technology in the Cockpit (WTIC) Program Program Update Friends/Partners of Aviation Weather (FPAW) November 2, 2016 Presented by Gary Pokodner, WTIC Program Manager Phone: 202.267.2786 Email:
Real-Time defenses. FlightOPS
 Real-Time defenses By Wayne Rosenkrans Integrating data from terminal Doppler weather radar and anemometer-based wind shear alerting systems during the past years has further reduced, but not eliminated,
Global Response of Clear-Air Turbulence to Climate Change. Professor Paul D. Williams University of Reading, UK
 Global Response of Clear-Air Turbulence to Climate Change Professor Paul D. Williams University of Reading, UK Climate change impacts on aviation Rising sea levels and storm surges threaten coastal airports
NUMUG POSITION PAPER What is a Qualified Meteorologist?
 ANSI-ANS-3.11-2005(R2010), Determining Meteorological Information at Nuclear Facilities, and other nuclear industry guidance documents expect certain tasks associated with the atmospheric sciences to be
WSI Pilotbrief Optima - for ipad
 WSI Pilotbrief Optima - for ipad Anticipate, Visualize & Avoid Hazardous Weather In A Whole New Way The Weather Company, an IBM Business, delivers an ipad-based version of WSI Pilotbrief Optima. This ipad
FAA-NWS Aviation Weather Requirements Working Group (ARWG)
") FAA-NWS Aviation Weather Requirements Working Group (ARWG) Friends and Partners in Aviation Weather October 23, 2013 Airplanes have changed. Lockheed Constellation Airbus A380 Aviation weather products
FAA-NWS Aviation Weather Requirements Working Group (ARWG) Friends and Partners in Aviation Weather October 23, 2013 Airplanes have changed. Lockheed Constellation Airbus A380 Aviation weather products
1.1 ATM-WEATHER INTEGRATION AND TRANSLATION MODEL. Steve Bradford, David J. Pace Federal Aviation Administration, Washington, DC
 1.1 ATM-WEATHER INTEGRATION AND TRANSLATION MODEL Steve Bradford, David J. Pace Federal Aviation Administration, Washington, DC Matt Fronzak *, Mark Huberdeau, Claudia McKnight, Gene Wilhelm The MITRE
Traffic and Weather. Soaring Safety Foundation. Tom Johnson CFIG
 Traffic and Weather Soaring Safety Foundation Tom Johnson CFIG Weather Contents Weather Gathering Sources Weather Acquisition Enroute Weather Analysis Weather Hazards Weather in the Landing Pattern Basic
NOAA Surface Weather Program
 NOAA Surface Weather Program Maintenance Decision Support System Stakeholder Meeting #9 Jim O Sullivan NOAA Surface Weather Program Manager NWS Office of Climate, Water, and Weather Services September
Mechanical Turbulence Wind forms eddies as it blows around hanger, stands of trees or other obstructions
 Turbulence Low-level Turbulence below 15,000 feet consists of Mechanical Turbulence Convective Turbulence Frontal Turbulence Wake Turbulence Mechanical Turbulence Wind forms eddies as it blows around hanger,
Into the storm: Using drones to track twisters
 Into the storm: Using drones to track twisters By Los Angeles Times, adapted by Newsela staff on 06.16.13 Word Count 881 Amelia Wilson, Nathan Woody and Alyssa Avery prepare their aircraft for flight at
Director, Operations Services, Met-Ed
 Director, Operations Services, Met-Ed Pennsylvania House Republican Policy Committee Hearing on Storm Response Tobyhanna Township Municipal Building Pocono Pines, Pa. August 9, 2018 Planning and Forecast
WMO/ICAO AMF Competencies
 WMO/ICAO AMF Competencies Workshop on Aeronautical Competencies and SIGMETs August 26 st, 2015 Karine Dumas Meteorological Service of Canada Montreal Competency Hierarchy Top-level Competencies WMO 49
Thunderstorm. Thunderstorms result from the rapid upward movement of warm, moist air.
 Severe Weather Thunderstorm A thunderstorm (aka an electrical storm, a lightning storm, or a thundershower) is a type of storm characterized by the presence of lightning and its acoustic effect, thunder.
Traffic Flow Management (TFM) Weather Rerouting Decision Support. Stephen Zobell, Celesta Ball, and Joseph Sherry MITRE/CAASD, McLean, Virginia
 Weather Rerouting Decision Support. Stephen Zobell, Celesta Ball, and Joseph Sherry MITRE/CAASD, McLean, Virginia") Traffic Flow Management (TFM) Weather Rerouting Decision Support Stephen Zobell, Celesta Ball, and Joseph Sherry MITRE/CAASD, McLean, Virginia Stephen Zobell, Celesta Ball, and Joseph Sherry are Technical
Traffic Flow Management (TFM) Weather Rerouting Decision Support Stephen Zobell, Celesta Ball, and Joseph Sherry MITRE/CAASD, McLean, Virginia Stephen Zobell, Celesta Ball, and Joseph Sherry are Technical
Weather Needs for UAS Operations
 Minneapolis - Denver - Washington, D.C. Weather Needs for UAS Operations Brian Haynes - President November 2016 1 Sensurion Background: 10-year company history UAS Weather Needs Sensurion Perspective Extensive
Meteorology. Review Extreme Weather a. cold front. b. warm front. What type of weather is associated with a:
 Meteorology 5.08 Extreme Weather References: FTGU pages 132, 144, 145, 148-155 Air Command Weather Manual Chapters 9 and 15 Review What type of weather is associated with a: a. cold front b. warm front
WWRP Implementation Plan Reporting AvRDP
 WWRP Implementation Plan Reporting AvRDP Please send you report to Paolo Ruti (pruti@wmo.int) and Sarah Jones (sarah.jones@dwd.de). High Impact Weather and its socio economic effects in the context of
Guidance to Instructors on Subject Delivery PILOT NAVIGATION. This is a suggested programme for the delivery of this subject.
 Programme of learning: Guidance to Instructors on Subject Delivery This is a suggested programme for the delivery of this subject. The main headings are the Learning Outcomes (LO1, LO2, etc), with sub
An illustration of the practical use in aviation of operational real-time geostationary satellite data
 An illustration of the practical use in aviation of operational real-time geostationary satellite data Jos de Laat # and Jan-Fokke Meirink Royal Netherlands Meteorological Institute operational use of
The Climate of Pontotoc County
 The Climate of Pontotoc County Pontotoc County is part of the Crosstimbers. This region is a transition region from the Central Great Plains to the more irregular terrain of southeast Oklahoma. Average
Water Vapor Sensing System, Version Two (WVSS-II)
") Water Vapor Sensing System, Version Two (WVSS-II) June 28, 2012 1.0 WVSS-II, Water Vapor Sensing System, Version Two This paper briefly describes the Water Vapor Sensing System version two, WVSS-II, how
Water Vapor Sensing System, Version Two (WVSS-II) June 28, 2012 1.0 WVSS-II, Water Vapor Sensing System, Version Two This paper briefly describes the Water Vapor Sensing System version two, WVSS-II, how
Published by the Hong Kong Observatory, Hong Kong Special Administrative Region Government.
 Windshear and Turbulence in Hong Kong - information for pilots Published by the Hong Kong Observatory, Hong Kong Special Administrative Region Government. 1st edition 2002 2nd edition 2005 Copyright reserved
NEEA Refresh aka 3D Nation Requirements and Benefits Study. Allyson Jason, Carol Ostergren, Xan Fredericks and Lou Driber November 9, 2017
 + NEEA Refresh aka 3D Nation Requirements and Benefits Study Allyson Jason, Carol Ostergren, Xan Fredericks and Lou Driber November 9, 2017 + 2 Study Context Background The National Enhanced Elevation
WEATHER THEORY. Weather Theory Page 100 Aviation Seminars. Measurement Of Temperature, Pressure And Moisture. Stability (Cont)
") Weather Theory Page 100 WEATHER THEORY Measurement Of Temperature, Pressure And Moisture The primary cause of all changes in the earth s weather is variation of solar energy received by the Earth s regions..
Weather Theory Page 100 WEATHER THEORY Measurement Of Temperature, Pressure And Moisture The primary cause of all changes in the earth s weather is variation of solar energy received by the Earth s regions..
Effect of Environmental Factors on Free-Flow Speed
 Effect of Environmental Factors on Free-Flow Speed MICHAEL KYTE ZAHER KHATIB University of Idaho, USA PATRICK SHANNON Boise State University, USA FRED KITCHENER Meyer Mohaddes Associates, USA ABSTRACT
Village Weather, Snow, Ice, Breakup, Flooding, Fire sites
 Village Weather, Snow, Ice, Breakup, Flooding, Fire sites What is the weather like now in Villages?... 1 BREAKUP:... 2 Flooding... 3 Fires... 5 Weather Predictability, Weather and Ice Advisories and How