Research Article Impacts of a Saline Lake and Its Salinity on Local Precipitation
|
|
|
- Victor Melvin Knight
- 5 years ago
- Views:
Transcription
1 Advances in Meteorology Volume 15, Article ID , 11 pages Research Article Impacts of a Saline Lake and Its Salinity on Local Precipitation Lijuan Wen 1, 1 Key Laboratory of Land Surface Process and Climate Change in Cold and Arid Regions, Cold and Arid Regions Environmental and Engineering Research Institute, Chinese Academy of Sciences, Lanzhou 73, China Laboratory of Arid Climatic Changing and Reducing Disaster of Gansu Province, Cold and Arid Regions Environmental and Engineering Research Institute, Chinese Academy of Sciences, Lanzhou 73, China Correspondence should be addressed to Lijuan Wen; gamevictory@gmail.com Received 18 July 14; Accepted 15 September 14 Academic Editor: Sultan Al-Yahyai Copyright 15 Lijuan Wen. This is an open access article distributed under the Creative Commons Attribution License, which permits unrestricted use, distribution, and reproduction in any medium, provided the original work is properly cited. In the study, the weather research and forecasting model coupled with the community land model (WRF-CLM) is used to investigate impacts of the GSL and its salinity from October 1 to April. A salinity parameterization scheme is incorporated into the lake scheme of CLM. The WRF-CLM model with the salinity parameterization scheme can better simulate temperature and precipitation compared to that without considering the salinity effects. The improvement of simulation is especially significant under cold weather condition. The precipitation caused by the GSL effect is always positive over the downwind area of the GSL during the study period. Increased precipitation is largely attributed to the warm lake surface temperature and high latent heat flux over the GSL, which are favorable for the development of strong convective activity and horizontal wind and moisture convergence. Such kind of GSLinduced forcing is the primary mechanism for the downstream GSL effect precipitation. The GSL effect precipitation is largely contributed by fresh water effect when the temperature is close to or higher than C. However, with lower temperature, the salinity effect becomes dominant for the GSL effect precipitation. 1. Introduction The Great Salt Lake (GSL) of Utah has significant impacts on weather, climate, and hydrologic cycles at local scale. For example, in October 1984, a snowstorm intensified by the lake effectproducednearly7cmdeepofsnowfallwithintwodays [1], causing a million dollars of property damage. Another snowstorminfebruary1998resultedinarecord19cmof snowfall in Salt Lake City while a significant portion of that snowfall was caused by lake effect of the GSL []. Based on visual identification of 8 snowfall cases from March 1971 to May 1988, Carpenter [1] developed three criteria to identify the GSL effect on snowstorms: the existence of postcoldfrontal northwesterly flows at 7 hpa, a temperature difference larger than 17 C between the lake surface and 7 hpa (i.e., approximately the dry-adiabatic lapse rate), and (c) the absence of capping stable layers or inversions below 7 hpa. Steenburgh et al. [3] analyzed 34 lake-effect events that occurred from September 1994 to May 1998 based on radar imageries. They found that the structure of lake-effect precipitation events demonstrates a solitary wind-parallel band,whichdevelopsalongornearthemajoraxisofthe GSL, accompanied by strong convective processes near the southern shoreline of the GSL. During the periods of all these 34 events, the lake surface was always warmer than the surrounding land areas with a temperature difference greater than 6 C; this indicates a strong potential for the development of land-breeze circulation and low-level convergence over thegsl.thegsleffectisdistinctwhenthetemperature difference between the lake surface and 7 hpa exceeds 16 C andstormsaffectedbythegslaremostactivefrommidnight to early morning. Numerical investigations [, 4] haverevealedthatthe GSL is capable of inducing thermally driven circulations and precipitation with banded structures, similar to those observed over the Great Lakes [5 8]. Sensitivity studies have illustrated that moisture fluxes from the lake surface are necessary for the development of snowfall bands [4]. In addition, Onton and Steenburgh [4] pointed out that the latent heat release within the precipitation bands intensifies in response to the interactions between the local low pressure system and convergence over the lake, while the contrast in
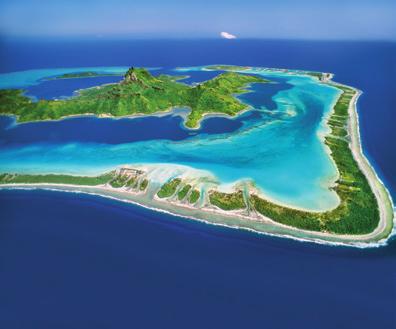
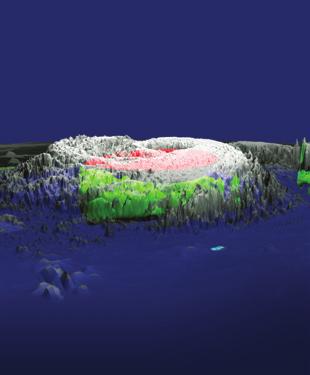
2 Advances in Meteorology the surface roughness length between the GSL and shoreline surfaces plays an insignificant role in the formation of precipitation bands. A noteworthy difference between the GSL and other large fresh water lakes is its high salinity, which reached as high as 3% [9] that is, approximately eight times saltier than the ocean ( 3.5%).TheroleoftheGSLsalinityinlocal climate systems has been studied, with a focus on the salinity effect on surface evaporation [1, ]. The salinity in the GSL (at Gunnison Bay) was found to reduce the saturated vapor pressure by % 4% at the water surface [1]. The salt content in the GSL can decrease the moisture fluxes and result in a 17% reduction of snowfall compared to a freshwater body [4]. In their study, the salinity was parameterized to reduce thewaterfluxtransporttotheatmosphereby1%.however, such a reduction rate is not constant, as it varies with the surface temperature and near-surface pressure. Except for its impact on surface evaporation, salinity can also cause changes in the heat capacity, the thermal conductivity, the freezing point, and the density of GSL water [11]. All these effects have not yet been considered in most of the studies of thegsleffectonlocalclimate. In the present study, the weather research and forecasting model version 3. (WRF) that is coupled with the community land model version 3.5 (CLM) [1] isusedtostudythe impacts of the GSL and its salinity on local precipitation. A salinity parameterization scheme is adopted in the sophisticated physically based 1-layer lake scheme in CLM. The study focuses on the period from October 1 to April, when most of the GSL effect events happen [3, 13]. The paper is organized as follows. Section provides basic information about the GSL and its salinity, introduces the observation data used in this study, and describes the lake scheme modification that incorporates salinity parameterizations. The model settings in the coupled WRF-CLM model are also introduced in this section. Section 3 evaluates the model performance using observed temperature and precipitation and investigates the characteristics and mechanism of impacts of the GSL and its salinity on the event of lake effect precipitation. Discussion and conclusions are given in Section 4.. The Great Salt Lake, Observational Data, and Model Configuration.1. The GSL and Its Salinity. The GSL is a terminal lake and thus its salinity variation is largely controlled by the amount of precipitation, evaporation, and inflow. The GSL is divided into the southern (Gilbert Bay) and northern (Gunnison Bay) parts by the east-west solid-fill railroad causeway, which limits water mixing in the GSL (Figure 1). The southern part ofthelakereceivesmostoftheinflowandthusbecomesless saltythanthenorthernpart.theunitedstatesgeological Survey (USGS) measures salinity periodically at intervals of to 4 weeks. Based on the measurements over the last 1 years, the GSL salinity varies around 14.1% in the Gilbert Bay whileitfluctuatesaround7.1%inthegunnisonbay.thegsl is known for its shallowness with an average depth of 5 m. Measurements [14] of salinity at the depth of. m are very 38 N 115 W 113 W 111 W Figure 1: Terrain height (m) (blue shade) of the GSL area, GSL, and observation stations (red circle filled: Garfield; black left triangle filled: Gunnison island; black right triangle filled: Hat island). similar to that at the depth of 3 m, implying that the salinity distribution within the vertical water column is homogenous probably due to water mixing. Therefore, the salinity is set to be 14.1% for the Gilbert Bay and 7.1% for Gunnison Bay for the entire water column in this study... Observed Temperature and Precipitation. The near surface air temperature (NSAT) and lake temperature (LT) measured at Hat (41.1 N, 11.6 E) and Gunnison (41.3 N, 11.9 E) islands (Figure 1) are used for the evaluation of model performance; these station data are obtained from the MesoWest Project [15]. The simulation over the GSL is also evaluated using the lake surface skin temperature (LSST) data retrieved from the Moderate Resolution Imaging Spectroradiometer (MODIS) 8-day surface temperature composite with.5 latitude/longitude resolution. The simulated precipitation is evaluated using parameterelevation regressions on independent slopes model (PRISM) precipitation data (PRISM Climate Group, Oregon State University, andtheobserved precipitation at Garfield (4.7 N, 11. E) meteorological station (Utah Climate Center, (Figure 1), which is located in the vicinity of the GSL..3. The WRF-CLM Model. The model used in the study is the WRF-CLM model [1]. The WRF model is one of the most widely used and advanced regional atmospheric models [16]. The coupled CLM model [17] is a land model, in which the land surface consists of five primary subgrid land cover types (glacier, lake, wetland, urban, and vegetated) in each grid cell. In the CLM model, lake processes and lake-atmosphere interactions are dynamically simulated using a 1D mass and energybalancelakeschemewith1lakewaterlayers[18]. This lake scheme is developed based on the previous studies [18 4]. Lake surface fluxes are treated as nonvegetated surfaces in the CLM model and used to calculate the lake surface temperature. With the surface net energy flux as the top (m)
3 Advances in Meteorology 3 boundary, thermal mixing between the lake layers is mainly under the control of wind-driven eddies, convection, and molecular diffusion [1, 4]. The lake temperature of each layer is calculated by the Crank-Nicholson thermal diffusion solution..4. Salinity Parameterizations in the Model. To parameterize salinity effects in the model, the following equations [5, 6] areusedinthelakeschemeofthemodel: C psw = s. (1) The equation is based on the original model setting and the discussion given by Sun et al. [7], where C psw is the specific heat capacity of saline water (kj/kg/k) and s represents the salinity (%). Thermal conductivity of saline water λ sw is calculated using the following equation: λ sw =λ fw (1..s +.1s ), () which is derived from the study of Ozbek and Phillips [8]; the fresh water thermal conductivity, λ fw,issettobe.6 W/m K as in the coupled WRF-CLM model. The freezing point (T f, C) of saline water in the study is described by the equation obtained from the National Snow and Ice Data Center (NSIDC) ( seaice/characteristics/brine salinity.html) T f =.8 ( s ). (3).5 Salt in ice will be continuously rejected out over the time. The melting point of ice in a saline solution should be similar with that of sea ice in ocean. The time of freezing, the location in ice, and the solid fraction are dependent on the brine salinity [9]. The calculation is quite complicated. In reality, the GSL never completely freezes due to the high salinity. Hence, the difference between freezing point of the GSL and melting point of ice in the GSL is not considered. Based on the study of Low [3], the ratio of the saturated vapor pressure over the saline water to that over the fresh water is a=exp { [ 1s +.77]}. (4) (1 s)/58.44 The observed density of the GSL water is given as a constant by the USGS ( We did not consider its effect in the salinity parameterization in this study..5. Model Domain and Configuration. The model domain is centered at (41. N, 11.5 W) with a horizontal grid spacing of 1 km, covering an area of 1 km 1 km. There are 31 levels in the vertical with the model top at 1 hpa. The initial and lateral boundary conditions are derived from the North American Regional Reanalysis (NARR) data with 3 km 3 km high resolution [31], which is updated every 3 hours. The model integration covers the period from 3 September 1 to 3 April. The first month is regarded as spin-up time and the results are discarded. The important physical parameterization schemes used in this study include the Morrison double-moment microphysics scheme [3], the Dudhia radiation scheme [33], the Kain-Fritsch cumulus scheme [34], the rapid radiative transfer model (RRTM) scheme [35], CLM3.5 [17], and the Yonsei University (YSU) boundary layer scheme [36]. In the present study, the lake depth is set to 5 m in the coupled WRF-CLM model, corresponding to the average depth of the GSL. The lake scheme coupled with the WRF- CLM has ten layers, designated at.5,.15,.3,.6,.9, 1.4,,.7, 3.5, and 4.5 m below the lake surface [, 3]. Mass and energybalanceequationsarecalculatedovertheselayers. Three numerical experiments have been performed using WRF-CLM. Details of each single experiment are given below: (i) SL experiment: the developed WRF-CLM model including the salinity effects is employed to perform the simulation. The model setting is as previously shown; (ii) FL experiment: it is similar to the SL experiment, but salinity effects are not considered; (iii) NL experiment: it is similar to the SL and FL experiments, but the GSL surface is replaced by nearby land use cover (barren or sparsely vegetated). 3. Results 3.1. Evaluation of the Simulations. The results for the Hat Island and Gunnison Island are quite similar. Hence, only the figures for the Hat Island are shown (Figure ) inthe following analysis. The simulated daily average NSAT and LSST at Hat Island from the FL and SL experiments are compared well with observations except in the end of January. For the cold event on January 3,, the observed daily NSAT is 8.1 C. The simulated NSAT in FL experiment is 17 C that is significantly underestimated, whereas it is relatively consistent with the observed NSAT in the SL experiment. The simulated LT variation in the SL results agrees well with the variation of the observed LT while the results in the FL simulation are unrealistically smooth and cannot reflect the fluctuation of LT. The root mean square error (RMSE) between the simulations and observations (Table 1, which includes Gunnison Island) indicates that the SL experiment, which considers the salinity effects, yields better simulations over and in the GSL with no bigger RMSE than the FL experiments. The SL experiment can well reproduce the spatial pattern of total precipitation shown in the PRISM, except that the precipitation is overestimated in mountain area (Figure 3). The simulated precipitation distribution in the FL experiment (figure not shown) is similar to that in the SL experiment. To further evaluate the model performance in precipitation simulation in the vicinity of the lake, the accumulated precipitation difference between the observation and the simulation at the Garfield station (Figure 4) is shown. Obviously, the SL
4 4 Advances in Meteorology Table 1: RMSE ( C) between simulated and the observed temperature at Hat and Gunnison islands. Experiments NSAT LSST LT Hat Gunnison Hat Gunnison Hat Gunnison FL SL NSAT ( C) Oct. 1 Dec. Feb. Apr. LSST ( C) Oct. 1 Dec. Feb. Apr. Obs SL FL Obs SL FL 3 LT ( C) 1 1 Oct. 1 Dec. Feb. Apr. Obs SL FL (c) Figure : Observed and simulated temperature in FL and SL experiments. PRISM 1 SL W 113 W 111 W 115 W 113 W 111 W Figure 3: PRISM precipitation and simulated precipitation in SL experiment from October 1 to April.
5 Advances in Meteorology Oct. 1 Accumulated precipitation difference SL-Obs FL-Obs Dec. Feb. Apr. Figure 4: Accumulated daily precipitation difference between SL (FL) and observations at Garfield station from October 1 to April. experiment gives better simulation compared to the FL. The WRF-CLM that considers the salinity effects can realistically simulate the precipitation distribution over the lake area and improve the precipitation simulation in the vicinity of the GSL. 3.. The GSL Effect on Precipitation. The precipitation difference between results of the NL and SL experiments is induced completely by the GSL effect, termed as P GSL hereafter. It couldbefurtherdividedintotheprecipitationcausedbyfresh water effect (represented by the difference between the FL and NL experiments) and precipitation caused by salinity effect (represented by the difference between the SL and FL experiments), termed as P FW and P S, respectively, hereafter. The total P GSL and P S from October 1 to April are shown in Figure 5. Apparently the GSL effect increases precipitation by about 3.% over its downwind area (denoted by the red square in Figure 5, left bottom corner 4. N, 11.8 W, and right top corner 41.1 N, W) from October 1 to April. The center of the largest accumulated GSL effect precipitation is located at the southern border of the GSL, where the simulated precipitation increases by 65.6 mm, which accounts for 18.3% of the total precipitation simulated in the NL experiment. Apparently the GSL effect increases precipitation during the entire study period (Figure6, showing monthly P GSL, P FW,andP S averaged over the masked red square in Figure 5), while the increase shows a bimodal pattern with the maximum increase occurring at November and April, respectively. The bimodal pattern is consistent with the previous findings [37]. The total P FW from October 1 to April (Figure not shown) has a similar spatial pattern and magnitudes to that of the P GSL (Figure 5). The P FW is dominant in the P GSL,with large increase in precipitation occurring from October to December 1 and from March to April (Figure 6). The P S (Figure 5)isnegativeoverthelakeandpositive in the downwind area from October 1 to April. The magnitude of precipitation change and the influenced area caused by salinity effect are very small compared to that caused by the GSL effect (Figure 5) andthefresh water effect. However salinity effect becomes significant from December to March and dominates the GSL effect on precipitation from January to February when the fresh water effectonprecipitationisweakandoppositetothatofthe GSL effect (Figure 6). The salinity effect is not favorable for increase in precipitation over the downwind area of the lake at October, November, and April. The LSST in the FL experiment is a good indicator to illustrate what is the dominant factor in each GSL precipitation event (Figure 6). When the LSST in the FL is below C,thesalinityeffectbecomesthemajorinfluentialfactorfor the GSL effect and increases precipitation; in contrast, when the LSST is above C in the FL simulation, the fresh water effect dominates the GSL effect and increases precipitation (Figure 6) GSL Effect Precipitation Events. To fully understand the characteristics of the GSL effect on precipitation, two events with positive and negative LSST, respectively, in the FL experiment are chosen for further analysis in this section (Figure 7, showing the simulated LSST, 7 hpa temperature (T7), latent heat flux (LH) averaged over the lake and land surface temperature (LST) averaged over the land area inside the red box shown in Figure 5) The GSL Effect Precipitation Event with Positive LSST in the FL Experiment. For the precipitation event on 3 November 1 (hereafter the first event), the daily averaged LSSTandLSToverthelandareassurroundingthelakebelow 15 m terrain height are higher than C(Figure 7) inall three experiments (i.e., the NL, FL, and SL experiments). In the event the P GSL (Figure 8) islargelyconcentrated over downstream area of the lake and land. The increase in precipitation at the central area of precipitation is more than mm. The simulated daily mean LSST over the lake in the SL experiment is warmer than the temperature in NL (Figure9), and the area averaged temperature was 7.9 and 5.5 C(Figure 7), respectively, in SL and NL. The simulated 7hPatemperatureoverthelakeisalmostthesameinthe SL and NL experiments with a value of about 8.8 C (Figures 7 and 9). The temperature difference between the lake surface and the 7 hpa increases from 14.3 CintheNL simulation to 16.7 CintheSLduetotheGSLeffect.Such a difference of 16.7 Calmostmeetsoneofthecriteriafor the occurrence of GSL effect precipitation; that is, the temperature difference between lake surface and 7 hpa should be greater than 17 C[1] or16 C[3]. Meanwhile, the vertical profiles of equivalent potential temperatures in the SL and NL experiments indicate that the atmosphere is quite unstable (Figure 1), which favors the development of precipitation process. The area averaged LST in the downwind area is about 1.6 C (Figure 7), which is almost the same in the three experiments. The averaged LSST is 7.9 and 5.5 C, respectively, in SL and NL (Figure 7). The surface temperature difference between the lake and surrounding land areas in the SL simulation is 6.3 C, while that between the two areas in NL
6 6 Advances in Meteorology 114 W 113 W 11 W W 113 W 11 W Figure 5: Simulated precipitation differences between SL and NL experiments and between SL and FL experiments from October 1 to April Precipitation (%) 6 4. Oct. 1 Dec. Fresh water effect Salinity effect GSL effect Feb. Apr LSST ( C) Fresh water effect Salinity effect Figure 6: Averaged over (in) the red square in Figure 5 and the simulated monthly precipitation ( caused by GSL effect, fresh water effect, and salinity effect, resp.) and the percentage of changed simulated daily precipitation (caused by fresh water effect and salinity effect, resp.) with the daily LSST in FL. Temperature ( C) LSST LST T7 LH NL-first SL-first FL-first NL-second SL-second FL-second 1 1 Figure 7: Simulated LSST, T7, LH averaged over lake and LST averaged over land in the red square in Figure 5 in the first and second GSL precipitation event in SL, FL, and NL experiments. Latent heat (w/m ) simulation is only 3.9 C. Thus, the simulation in SL experiment meets another criterion for the happening of GSL effect precipitation; that is, the temperature difference between the lake surface and land surface should be larger than 6 C[3]. Obviously, the GSL effect leads to increase in the lake-land temperature difference and thus favors the occurrence of the P GSL. The higher LSST in the SL simulation induces a stronger convection over the lake than that in the NL (Figures 9(c) and 1). The convection can reach up to about 15 m in the SL experiment (Figure 1). With the influence of wind, the convectivecentermovestodownwindareasofthelakeand stagnates at the border of the lake (Figure 9(c)). Comparing the results between the SL and NL simulations, it is clear that the convection is further intensified in the SL due to (1) dynamic effects of a stronger surface wind convergence that can be attributed to positive LSST difference and negative LST difference over downwind areas of the lake between
7 .5 Advances in Meteorology m/s Figure 8: Simulated precipitation difference (,, shade) between SL and NL and between FL and NL, simulated wind filed (, barb) in SL experiment and simulated LH (, contour) between SL and NL in the first GSL precipitation event ( C) ( C) m/s m/s (g/kg) (g/kg).8.8 (c) (d) Figure 9: Simulated surface horizontal wind difference and difference of surface skin temperature, simulated horizontal wind difference and temperature difference over 7 hpa, simulated vertical wind difference over 8 hpa and simulated humidity difference near surface (c), and simulated vertical wind difference and humidity difference over 7 hpa (d) between SL and NL experiments in the first GSL precipitation event. the SL and NL simulations (Figure 9)and()thedivergent wind difference at 7 hpa that is induced by the 7 hpa air temperature difference over the lake and its downwind area between SL and NL (Figure 9). Compared to the NL simulation, the larger convergent surface wind coming from surrounded surface with high terrain height in the SL simulation may have some cooling effect (Figure 9), leading to lower land temperature in the downwind area of the lake and further intensifying the surface convergence and subsequently the convection (Figure 9).
8 8 Advances in Meteorology Height (m) SL-first NL-first FL-first Equivalent potential temperature ( C) SL-second NL-second FL-second Figure 1: Vertical equivalent potential temperatures of SL, FL, and NL experiments at the grid point with max precipitation caused by the GSL (black dot in Figures 8 and 11) overlakeinthetwo events. The daily averaged LSST in the SL simulation is 7.9 C. The LSST of the unfrozen lake is.4 C higher than that in the NL simulation (Figure 7), which results in more evaporation in the SL than in the NL experiment. As a result, the humidity ofsurfaceairoverthelakeandthehumidityinthedownwind area of the lake at 7 hpa are both higher in the SL result than that in the NL; the simulated daily averaged LH over the lake is 184 w/m in the SL experiment, while it is only 48 w/m in the NL. High LH provides more energy for the development of convection and thus intensifies the GSL effect precipitation event, as is shown in the SL results. The above analysis clearly indicates that the increased precipitation induced by the GSL is resulted from the warmer LSST and larger LH over the GSL than in the surrounding land areas, which induce an intensified horizontal convergence (between the lake and land) and a stronger convection (between the warm lake surface and the top cold atmosphere). The intensified horizontal convergence and stronger convection bring more moisture and heat for the development of the rainfall event, which explains the difference in precipitation between SL and NL results. The situations in the FL experiment are similar to that intheslexceptthatthesimulatedlsstisalittlebitlower while LH is higher in the FL than in the SL results (Figure 7). The P FW isalmostthesameasthegsleffectprecipitation (Figure 8). Note that the P S (Figure not shown) in the event is quite small and can actually be neglected. The significant leading role of the fresh water effect and the dynamic mechanisms of the warmer LSST and higher LH to intensify precipitation are common in the GSL effect precipitation event when the simulated LSST in the FL results is above C. Another good example can be found in the precipitation event in 5 November 1, which demonstrates quite similar features to the event discussed above and is not discussed repeatedly here The GSL Effect Precipitation Event with Negative LSST in the FL. The second event on 8-9 January occurred when the weather became cold. The LST is below C (Figure 7) in all experiments over the land areas below 15 m terrain height surrounding the lake. The lake is frozen in the FL simulation, but it is still unfrozen in the SL simulation due to the drooping freezing point caused by the dissolved salt in lake water. Influenced by the wind direction, the P GSL of this event is still concentrated over the downstream area, but the center shifts to the northwest of the lake (Figure 11). Almost all the P GSL canbeattributedtothesalinityeffect(figure 11) instead of the fresh water lake effect (Figure not show); the latter is the dominant factor in the first precipitation event. Area averaged T7 over the lake is about 15.9 C, which is the same in all experiments as in the first event (Figure 7). The simulated area averaged LSST (.1 C) is 4.8 C warmer in the SL simulation than that ( 4.7 C) in the NL (Figure 1), while simulated area averaged LSST in the FL ( 8.5 C) is 3.8 C lower than that in the NL result (Figure1). The difference between the averaged LSST andaveragedt7intheslsimulationreachesupto16 C, which is the minimum observed climatological lake 7 hpa temperature difference during the GSL effect snowstorms [3] in winter. While in the FL result, the difference is only 7.4 C, which is less than half of that in the SL experiment. Due to the relatively small vertical temperature difference in the FL result, no updraft difference between the FL and NL and no instability in FL are found in the second event (Figures 1 and 1(d)). The updraft difference between SL and NL simulations (Figure 1(c)) did exist in the second event. But, mainly because of the cold temperature of the event, the unstable convection in SL and NL and the updraft difference (Figures 1 and 1(c)) is relatively weak compared to that in the first event. Surface-atmosphere heat and moisture exchanges would be limited by the appearance of ice cover [38]. The air passing the lake in the FL experiment cannot become moister as in the SL and as in the first event (Figures 1(c)-1(d)). The simulated LH over the lake in the FL experiment reduces to 14 w/m with the ice lake surface, which is lower than the simulated LH (1 w/m ) over the lake in the SL experiment and even lower than the land surface LH of 4 w/m in the NL result (Figure 7). Also owing to the cold temperature, the LH difference between the SL and NL simulations for the event is less than that in the first event. In addition, the area averaged lake-land temperature difference is 5. C in the SL experiment (Figure 7). In contrast, the lake was about 3. C colder than the surrounding land area in the FL experiment, which is opposite to the observed climatological regular pattern that the lake land difference is always positive for the GSL effect snowstorms in winter []. It is thus induced that the land-breeze circulation and associated low-level convergence over the lake might be favorable for the formation of the GSL effect precipitation, and which could be the case in the SL experiment but not in theflwhenthelsstisbelow C. Itisconcludedthatincoldperiodwhenthelowlevel temperature is lower than C, the high salinity in the GSL water makes the lake ice free, leading to higher evaporation and more water vapor entering and humidifying the air. As a result, the instability of the atmosphere increases. Combined with the formation of lake-land breeze and low
9 Advances in Meteorology m/s Figure 11: Simulated precipitation difference (,, shade) between SL and NL and between SL and FL, simulated wind filed (, barb) in SL experiment and simulated LH (, contour) between SL and NL (, contour with black line) and between FL and NL (, contour with blue line) in the second GSL precipitation event ( C) ( C) m/s m/s (g/kg).1.4 (g/kg) (c) (d) Figure 1: Simulated surface horizontal wind difference and difference of surface skin temperature (, ) between SL and NL and between FL and NL, and simulated vertical wind difference over 8 hpa and simulated humidity difference near surface ((c), (d)) between SL and NL (c) and between FL and NL (d) in the second GSL precipitation event. level convergence over the lake, the unstable atmosphere stratification will promote the development of precipitation process and produce more precipitation. However, in the FL experiment, the frozen lake would suppress the lake effect precipitation. The similar situation is also found in the 14 January event, in which the salinity effect plays a dominant role in the GSL effect precipitation. 4. Discussion and Conclusions In this study, the regional atmospheric model WRF-CLM that includes salinity parameterizations (i.e., heat capacity, thermal conductivity, freezing point, and saturated vapor pressure) in the lake scheme is used to study impacts of the GSL and its salinity effects on local precipitation. Modeling
10 1 Advances in Meteorology results show that incorporation of the salinity effects can significantly improve temperature simulation over and in the lakeandprecipitationsimulationinthedownwindareaof the lake, especially under cold weather and climate condition. Salinity effect on freezing point and saturated vapor pressure is more crucial than the thermal conductivity and the specific heat capacity [6]. Freezing point has the significant effect in the cold time when the fresh water lake will freeze and the feedback can be quickly reflected. Other salinity effects have the slow response depending on lake characteristics. The effect of thermal conductivity is the least. The GSL effect precipitation is largely concentrated at thedownwindareaofthegsl.thegslcouldincrease precipitation averaged over its downwind area from October 1 to April by 3.%, and the largest increase of 65.6mmcanbeupto18.3%atthecenteroftheGSLeffect precipitation. The P GSL is always positive in the study period, mainly due to the warmer LSST and higher LH in the SL results than that in the NL results. The warm LSST and high LH are favorable for strong convective motion and intensify horizontal wind and moisture convergence. The stronghorizontalconvergenceisaneffectivedynamicforcing for the development of precipitation process. The GSL effect is mainly dominated by fresh water effect when the LSST is above C in the FL experiment. When the LSST is below C in the FL experiment but the GSL is still unfrozen with dropping freezing point in the SL, fresh water effect would prohibit the development of precipitation process, whereas the salinity effect becomes the dominant factor for the P GSL. However, note that the GSL effect precipitation is mainly induced by salinity effect in cold weather condition that is relatively weak compared to that induced by fresh water effect. This is mainly because the LSST temperature is often low with less LH in cold weather condition and convection is often weak. The salinity effect to increase precipitation can be found all the time when the precipitation happens under the influence of large scale forcing and when the fresh lake water freezes. Due to the fact that actual air temperature in winter over the GSL is around C during the study period of this paper,thelaketemperaturedifferencecausedbythesalinity effect is generally not that distinct. Similarly, P S simulated by the SL experiment is not very big. Even so, the modified lake scheme that includes parameterizations of the salinity effect still demonstrates prominent skills to improve the simulation of temperature and precipitation, especially under cold weather condition. Conflict of Interests The author declares that there is no conflict of interests regarding the publication of this paper. Acknowledgments The study is supported by the Strategic Priority Research Program (B) of the Chinese Academy of Sciences (Grant no. XDB333), the National Natural Science Foundation of China (Grant nos , , and ), and the Visiting Scholars Program of the Public School Study Abroad Project of Chinese Academy of Sciences (8, no. 136). The author thanks Dr. Jiming Jin and Simon Wang of Utah State University who helped to improve the paper. The gratitude will be expressed to Earth Science Service & Consulting for the English editing. Appreciations will be giventothencar,nasa,climatecenterofutahstate University, USGS, and MesoWest for providing data and models online. The author also acknowledges the support for using the computing resources at Supercomputing Center of Cold and Arid Regions Environment and Engineering Research Institute, Chinese Academy of Sciences. References [1] D. M. Carpenter, The lake effect of the Great Salt Lake: overview and forecast problems, Weather & Forecasting,vol.8, no., pp , [] W. J. Steenburgh and D. J. Onton, Multiscale analysis of the 7 December 1998 Great Salt Lake-effect snowstorm, Monthly Weather Review,vol.19,no.6,pp ,1. [3] W.J.Steenburgh,S.F.Halvorson,andD.J.Onton, Climatology of lake-effect snowstorms of the Great Salt Lake, Monthly Weather Review,vol.18,no.3,pp.79 77,. [4] D.J.OntonandW.J.Steenburgh, Diagnosticandsensitivity studies of the 7 December 1998 Great Salt Lake-effect snowstorm, Monthly Weather Review, vol. 19, no. 6, pp , 1. [5]M.R.HjelmfeltandR.R.BrahamJr., Numericalsimulation of the airflow over Lake Michigan for a major lake-effect snow event, Monthly Weather Review, vol. 111, no. 1, pp. 5 19, [6] D. A. R. Kristovich, Mean circulations of boundary-layer rolls in lake-effect snow storms, Boundary-Layer Meteorology, vol. 63,no.3,pp ,1993. [7]A.Q.LiuandG.W.K.Moore, Lake-effectsnowstormsover southern Ontario, Canada, and their associated synoptic-scale environment, Monthly Weather Review, vol. 13, no. 11, pp , 4. [8] N. Laird, R. Sobash, and N. Hodas, Climatological conditions of lake-effect precipitation events associated with the New York state Finger Lakes, Applied Meteorology and Climatology,vol.49,no.5,pp.15 16,1. [9] T. D. Brock, Salinity and the ecology of Dunaliella from Great Salt Lake, General Microbiology, vol.89,no.,pp. 85 9, [1] D. R. Dickson, J. H. Yepson, and J. V. Hales, Saturated vapor pressures over Great Salt Lake brine, Geophysical Research,vol.7,pp.5 53,1965. [11] Unesco, Algorithms for Computation of Fundamental Properties of Seawater, 1983, 598/5983eb.pdf. [1] Z. M. Subin, W. J. Riley, J. Jin, D. S. Christianson, M. S. Torn, and L. M. Kueppers, Ecosystem feedbacks to climate change in california:development,testing,andanalysisusingacoupled regional atmosphere and land surface model (WRF3-CLM3.5), Earth Interactions,vol.15,no.15,pp.1 38,11. [13] E.T.CrosmanandJ.D.Horel, MODIS-derivedsurfacetemperature of the Great Salt Lake, Remote Sensing of Environment, vol. 113, no. 1, pp , 9.
11 Advances in Meteorology 11 [14] X. Diaz, W. P. Johnson, and D. L. Naftz, Selenium mass balance in the Great Salt Lake, Utah, Science of the Total Environment, vol.47,no.7,pp ,9. [15] J. Horel, M. Splitt, L. Dunn et al., MesoWest: cooperative mesonets in the western United States, Bulletin of the American Meteorological Society,vol.83,no.,pp.11 5,. [16] W. C. Skamarock and J. B. Klemp, A time-split nonhydrostatic atmospheric model for weather research and forecasting applications, Computational Physics, vol.7,no.7,pp , 8. [17] K. W. Oleson, G.-Y. Niu, Z.-L. Yang et al., Improvements to the community land model and their impact on the hydrological cycle, Geophysical Research G: Biogeosciences, vol. 113, no.1,articleidg11,8. [18] K.W.Oleson,Y.Dai,G.Bonanetal.,Technical Description of the Community Land Model, 4, clm/distribution//clm3./index.html. [19] G. B. Bonan, Sensitivity of a GCM simulation to inclusion of inland water surfaces, Climate,vol.8,no.11,pp , [] B. Henderson-Sellers, New formulation of eddy diffusion thermocline models, Applied Mathematical Modelling, vol. 9, no. 6, pp , [1] S. W. Hostetler and P. J. Bartlein, Simulation of lake evaporation with application to modeling lake level variations of Harney- Malheur Lake, Oregon, Water Resources Research, vol. 6, no. 1, pp , 199. [] S. W. Hostetler, G. T. Bates, and F. Giorgi, Interactive coupling of a lake thermal model with a regional climate model, Journal of Geophysical Research, vol. 98, no. 3, pp , [3] S.W.Hostetler,F.Giorgi,G.T.Bates,andP.J.Bartlein, Lakeatmosphere feedbacks associated with paleolakes Bonneville and Lahontan, Science,vol.63,no.5147,pp ,1994. [4] X. Zeng, M. Shajkh, Y. Dai, R. E. Dickinson, and R. Myneni, Coupling of the common land model to the NCAR community climate model, Climate,vol.15,no.14,pp ,. [5] L. Wen and J. Jin, Modeling of the impacts of the Great Salt Lake salinity on local climate with the Weather Research and Forecasting model, in Proceedings of the 11th WRF Users Workshop, Boulder, Colo, USA, 1. [6] L. Wen, Salinity parameterization and its impact on temperature simulation over and in a hypersaline lake, in Proceedings of the 6th China-Korea-Japan Joint Conference on Meteorology, Nanjiang, China, 13. [7] H. Sun, R. Feistel, M. Koch, and A. Markoe, New equations for density, entropy, heat capacity, and potential temperature of a saline thermal fluid, Deep-Sea Research I: Oceanographic Research Papers, vol. 55, no. 1, pp , 8. [8] H. Ozbek and S. L. Phillips, Thermal conductivity of aqueous sodium chloride solutions from to 33 C, Chemical & Engineering Data, vol. 5, no. 3, pp , 198. [9] D. Notz and M. Grae Worster, In situ measurements of the evolution of young sea ice, Geophysical Research C: Oceans, vol. 113, no. 3, Article ID C31, 8. [3] R. D. H. Low, A generalized equation for the solution effect in droplet growth, Atmospheric Sciences,vol.6,pp , [31] F. Mesinger, G. DiMego, E. Kalnay et al., North American regional reanalysis, Bulletin of the American Meteorological Society,vol.87,no.3,pp ,6. [3] H. Morrison, J. A. Curry, and V. I. Khvorostyanov, A new double-moment microphysics parameterization for application in cloud and climate models, part I: description, the Atmospheric Sciences,vol.6,no.6,pp ,5. [33] J. Dudhia, Numerical study of convection observed during the Winter Monsoon Experiment using a mesoscale two dimensional model, the Atmospheric Sciences, vol. 46, no., pp , [34] J. S. Kain, The Kain-Fritsch convective parameterization: an update, Applied Meteorology, vol. 43, no. 1, pp , 4. [35] E.J.Mlawer,S.J.Taubman,P.D.Brown,M.J.Iacono,andS.A. Clough, Radiative transfer for inhomogeneous atmospheres: RRTM, a validated correlated-k model for the longwave, Geophysical Research D: Atmospheres,vol.1,no.14, pp , [36] Y. Noh, W. G. Cheon, S. Y. Hong, and S. Raasch, Improvement of the K-profile model for the planetary boundary layer based on large eddy simulation data, Boundary-Layer Meteorology, vol. 17, no., pp , 3. [37] T.I.Alcott,W.J.Steenburgh,andN.F.Laird, GreatSaltLakeeffect precipitation: observed frequency, characteristics, and associated environmental factors, Weather and Forecasting, vol. 7, no. 4, pp , 1. [38] T. A. Niziol, W. R. Snyder, and J. S. Waldstreicher, Winter weather forecasting throughout the eastern United States. Part IV: lake effect snow, Weather & Forecasting,vol.1,no.1,pp , 1995.


12 International Ecology Geochemistry Mining The Scientific World Journal Scientifica Earthquakes Paleontology Journal Petroleum Engineering Submit your manuscripts at Geophysics International Advances in Mineralogy Geological Research Advances in Geology Climatology International Advances in Meteorology International Atmospheric Sciences International Oceanography Oceanography Applied & Environmental Soil Science Computational Environmental Sciences
Simulations of Lake Processes within a Regional Climate Model
 Simulations of Lake Processes within a Regional Climate Model Jiming Jin Departments of Watershed Sciences and Plants, Soils, and Climate Utah State University, Logan, Utah Utah State University 850 Faculty
Simulation studies for Lake Taihu effect on local meteorological environment. Ren Xia
 Simulation studies for Lake Taihu effect on local meteorological environment Ren Xia 2017.05.12 1 Outline Background Experimental design Result and discussion Next work Background Taihu Lake is the largest
PERFORMANCE OF THE WRF-ARW IN THE COMPLEX TERRAIN OF SALT LAKE CITY
 P2.17 PERFORMANCE OF THE WRF-ARW IN THE COMPLEX TERRAIN OF SALT LAKE CITY Jeffrey E. Passner U.S. Army Research Laboratory White Sands Missile Range, New Mexico 1. INTRODUCTION The Army Research Laboratory
A New Ocean Mixed-Layer Model Coupled into WRF
 ATMOSPHERIC AND OCEANIC SCIENCE LETTERS, 2012, VOL. 5, NO. 3, 170 175 A New Ocean Mixed-Layer Model Coupled into WRF WANG Zi-Qian 1,2 and DUAN An-Min 1 1 The State Key Laboratory of Numerical Modeling
INVESTIGATION FOR A POSSIBLE INFLUENCE OF IOANNINA AND METSOVO LAKES (EPIRUS, NW GREECE), ON PRECIPITATION, DURING THE WARM PERIOD OF THE YEAR
, ON PRECIPITATION, DURING THE WARM PERIOD OF THE YEAR") Proceedings of the 13 th International Conference of Environmental Science and Technology Athens, Greece, 5-7 September 2013 INVESTIGATION FOR A POSSIBLE INFLUENCE OF IOANNINA AND METSOVO LAKES (EPIRUS,
Proceedings of the 13 th International Conference of Environmental Science and Technology Athens, Greece, 5-7 September 2013 INVESTIGATION FOR A POSSIBLE INFLUENCE OF IOANNINA AND METSOVO LAKES (EPIRUS,
Bugs in JRA-55 snow depth analysis
 14 December 2015 Climate Prediction Division, Japan Meteorological Agency Bugs in JRA-55 snow depth analysis Bugs were recently found in the snow depth analysis (i.e., the snow depth data generation process)
Improved rainfall and cloud-radiation interaction with Betts-Miller-Janjic cumulus scheme in the tropics
 Improved rainfall and cloud-radiation interaction with Betts-Miller-Janjic cumulus scheme in the tropics Tieh-Yong KOH 1 and Ricardo M. FONSECA 2 1 Singapore University of Social Sciences, Singapore 2
Water Balance in the Murray-Darling Basin and the recent drought as modelled with WRF
 18 th World IMACS / MODSIM Congress, Cairns, Australia 13-17 July 2009 http://mssanz.org.au/modsim09 Water Balance in the Murray-Darling Basin and the recent drought as modelled with WRF Evans, J.P. Climate
High Resolution Modeling of Multi-scale Cloud and Precipitation Systems Using a Cloud-Resolving Model
 Chapter 1 Atmospheric and Oceanic Simulation High Resolution Modeling of Multi-scale Cloud and Precipitation Systems Using a Cloud-Resolving Model Project Representative Kazuhisa Tsuboki Author Kazuhisa
An improvement of the SBU-YLIN microphysics scheme in squall line simulation
 1 An improvement of the SBU-YLIN microphysics scheme in squall line simulation Qifeng QIAN* 1, and Yanluan Lin 1 ABSTRACT The default SBU-YLIN scheme in Weather Research and Forecasting Model (WRF) is
( ) = 1005 J kg 1 K 1 ;
 = 1005 J kg 1 K 1 ;") Problem Set 3 1. A parcel of water is added to the ocean surface that is denser (heavier) than any of the waters in the ocean. Suppose the parcel sinks to the ocean bottom; estimate the change in temperature
Problem Set 3 1. A parcel of water is added to the ocean surface that is denser (heavier) than any of the waters in the ocean. Suppose the parcel sinks to the ocean bottom; estimate the change in temperature
CHAPTER 8 NUMERICAL SIMULATIONS OF THE ITCZ OVER THE INDIAN OCEAN AND INDONESIA DURING A NORMAL YEAR AND DURING AN ENSO YEAR
 CHAPTER 8 NUMERICAL SIMULATIONS OF THE ITCZ OVER THE INDIAN OCEAN AND INDONESIA DURING A NORMAL YEAR AND DURING AN ENSO YEAR In this chapter, comparisons between the model-produced and analyzed streamlines,
Evaluation of High-Resolution WRF Model Simulations of Surface Wind over the West Coast of India
 ATMOSPHERIC AND OCEANIC SCIENCE LETTERS, 2014, VOL. 7, NO. 5, 458 463 Evaluation of High-Resolution WRF Model Simulations of Surface Wind over the West Coast of India S. VISHNU and P. A. FRANCIS Indian
Diagnostic and Sensitivity Studies of the 7 December 1998 Great Salt Lake Effect Snowstorm
 1318 MONTHLY WEATHER REVIEW Diagnostic and Sensitivity Studies of the 7 December 1998 Great Salt Lake Effect Snowstorm DARYL J. ONTON AND W. JAMES STEENBURGH NOAA Cooperative Institute for Regional Prediction,
Meteorology. Circle the letter that corresponds to the correct answer
 Chapter 3 Worksheet 1 Meteorology Name: Circle the letter that corresponds to the correct answer 1) If the maximum temperature for a particular day is 26 C and the minimum temperature is 14 C, the daily
Precipitation Structure and Processes of Typhoon Nari (2001): A Modeling Propsective
: A Modeling Propsective") Precipitation Structure and Processes of Typhoon Nari (2001): A Modeling Propsective Ming-Jen Yang Institute of Hydrological Sciences, National Central University 1. Introduction Typhoon Nari (2001) struck
Precipitation Structure and Processes of Typhoon Nari (2001): A Modeling Propsective Ming-Jen Yang Institute of Hydrological Sciences, National Central University 1. Introduction Typhoon Nari (2001) struck
Mesoscale modeling of lake effect snow over Lake Engineering Erie sensitivity to convection, microphysics and. water temperature
 Open Sciences Author(s) 2010. This work is distributed under the Creative Commons Attribution 3.0 License. Advances in Science & Research Open Access Proceedings Drinking Water Mesoscale modeling of lake
A Quick Report on a Dynamical Downscaling Simulation over China Using the Nested Model
 ATMOSPHERIC AND OCEANIC SCIENCE LETTERS, 2010, VOL. 3, NO. 6, 325 329 A Quick Report on a Dynamical Downscaling Simulation over China Using the Nested Model YU En-Tao 1,2,3, WANG Hui-Jun 1,2, and SUN Jian-Qi
Impact of vegetation cover estimates on regional climate forecasts
 Impact of vegetation cover estimates on regional climate forecasts Phillip Stauffer*, William Capehart*, Christopher Wright**, Geoffery Henebry** *Institute of Atmospheric Sciences, South Dakota School
Sensitivity of precipitation forecasts to cumulus parameterizations in Catalonia (NE Spain)
") Sensitivity of precipitation forecasts to cumulus parameterizations in Catalonia (NE Spain) Jordi Mercader (1), Bernat Codina (1), Abdelmalik Sairouni (2), Jordi Cunillera (2) (1) Dept. of Astronomy and
Sensitivity of precipitation forecasts to cumulus parameterizations in Catalonia (NE Spain) Jordi Mercader (1), Bernat Codina (1), Abdelmalik Sairouni (2), Jordi Cunillera (2) (1) Dept. of Astronomy and
FREEZING- RAIN IN THE GREAT LAKES
 About this Work GLISA participated in a winter climate adaptation project focused on Chicago, IL (http://glisaclimate.org/project/indicator-suite-and-winter-adaptation-measures-for-thechicago-climate-action-plan).
Modeling Study of Atmospheric Boundary Layer Characteristics in Industrial City by the Example of Chelyabinsk
 Modeling Study of Atmospheric Boundary Layer Characteristics in Industrial City by the Example of Chelyabinsk 1. Introduction Lenskaya Olga Yu.*, Sanjar M. Abdullaev* *South Ural State University Urbanization
Ocean and Climate I.
 Ocean and Climate I http://www.gerhardriessbeck.de/ Physical Characteristics of the Ocean Surface area: 3.61 10 14 m 2 Mean depth: 3.7 km Ocean volume: 3.2 10 17 m 3 Mean density: 1.035 10 3 kg/m 3 Ocean
Dust Storm: An Extreme Climate Event in China
 Dust Storm: An Extreme Climate Event in China ZHENG Guoguang China Meteorological Administration Beijing, China, 100081 zgg@cma.gov.cn CONTENTS 1. Climatology of dust storms in China 2. Long-term variation
NOTES AND CORRESPONDENCE. Seasonal Variation of the Diurnal Cycle of Rainfall in Southern Contiguous China
 6036 J O U R N A L O F C L I M A T E VOLUME 21 NOTES AND CORRESPONDENCE Seasonal Variation of the Diurnal Cycle of Rainfall in Southern Contiguous China JIAN LI LaSW, Chinese Academy of Meteorological
Assessment of Snow Cover Vulnerability over the Qinghai-Tibetan Plateau
 ADVANCES IN CLIMATE CHANGE RESEARCH 2(2): 93 100, 2011 www.climatechange.cn DOI: 10.3724/SP.J.1248.2011.00093 ARTICLE Assessment of Snow Cover Vulnerability over the Qinghai-Tibetan Plateau Lijuan Ma 1,
Lake-Effect Research At SUNY Oswego And How We Use it to Prepare Others
 Lake-Effect Research At SUNY Oswego And How We Use it to Prepare Others Presented by: Matthew Seymour, Nicholas Rodick, and Dr. Scott Steiger SUNY Os we go Image: Nicholas Rodick What is Lake -effect Snow?
UNIT 12: THE HYDROLOGIC CYCLE
 UNIT 12: THE HYDROLOGIC CYCLE After Unit 12 you should be able to: o Effectively use the charts Average Chemical Composition of Earth s Crust, Hydrosphere and Troposphere, Selected Properties of Earth
Crux of AGW s Flawed Science (Wrong water-vapor feedback and missing ocean influence)
") 1 Crux of AGW s Flawed Science (Wrong water-vapor feedback and missing ocean influence) William M. Gray Professor Emeritus Colorado State University There are many flaws in the global climate models. But
1 Crux of AGW s Flawed Science (Wrong water-vapor feedback and missing ocean influence) William M. Gray Professor Emeritus Colorado State University There are many flaws in the global climate models. But
Thermodynamics of Atmospheres and Oceans
 Thermodynamics of Atmospheres and Oceans Judith A. Curry and Peter J. Webster PROGRAM IN ATMOSPHERIC AND OCEANIC SCIENCES DEPARTMENT OF AEROSPACE ENGINEERING UNIVERSITY OF COLORADO BOULDER, COLORADO USA
Kalimantan realistically (Figs. 8.23a-d). Also, the wind speeds of the westerly
. Also, the wind speeds of the westerly") suppressed rainfall rate (maximum vertical velocity) around 17 LST (Figs. 8.21a-b). These results are in agreement with previous studies (e. g., Emanuel and Raymond 1994). The diurnal variation of maximum
suppressed rainfall rate (maximum vertical velocity) around 17 LST (Figs. 8.21a-b). These results are in agreement with previous studies (e. g., Emanuel and Raymond 1994). The diurnal variation of maximum
Research Article Direct Evidence of Reduction of Cloud Water after Spreading Diatomite Particles in Stratus Clouds in Beijing, China
 Meteorology Volume 2010, Article ID 412024, 4 pages doi:10.1155/2010/412024 Research Article Direct Evidence of Reduction of Cloud Water after Spreading Diatomite Particles in Stratus Clouds in Beijing,
L.O Students will learn about factors that influences the environment
 Name L.O Students will learn about factors that influences the environment Date 1. At the present time, glaciers occur mostly in areas of A) high latitude or high altitude B) low latitude or low altitude
Weather and Climate Summary and Forecast Winter
 Weather and Climate Summary and Forecast Winter 2016-17 Gregory V. Jones Southern Oregon University February 7, 2017 What a difference from last year at this time. Temperatures in January and February
ICRC-CORDEX Sessions A: Benefits of Downscaling Session A1: Added value of downscaling Stockholm, Sweden, 18 May 2016
 ICRC-CORDEX Sessions A: Benefits of Downscaling Session A1: Added value of downscaling Stockholm, Sweden, 18 May 2016 Challenges in the quest for added value of climate dynamical downscaling: Evidence
The Fifth-Generation NCAR / Penn State Mesoscale Model (MM5) Mark Decker Feiqin Xie ATMO 595E November 23, 2004 Department of Atmospheric Science
 Mark Decker Feiqin Xie ATMO 595E November 23, 2004 Department of Atmospheric Science") The Fifth-Generation NCAR / Penn State Mesoscale Model (MM5) Mark Decker Feiqin Xie ATMO 595E November 23, 2004 Department of Atmospheric Science Outline Basic Dynamical Equations Numerical Methods Initialization
The Fifth-Generation NCAR / Penn State Mesoscale Model (MM5) Mark Decker Feiqin Xie ATMO 595E November 23, 2004 Department of Atmospheric Science Outline Basic Dynamical Equations Numerical Methods Initialization
The Pennsylvania Observer
 The Pennsylvania Observer January 5, 2009 December 2008 Pennsylvania Weather Recap The final month of 2008 was much wetter than average and a bit colder than normal. In spite of this combination, most
Climate Change or Climate Variability?
 Climate Change or Climate Variability? Key Concepts: Greenhouse Gas Climate Climate change Climate variability Climate zones Precipitation Temperature Water cycle Weather WHAT YOU WILL LEARN 1. You will
5.0 WHAT IS THE FUTURE ( ) WEATHER EXPECTED TO BE?
 WEATHER EXPECTED TO BE?") 5.0 WHAT IS THE FUTURE (2040-2049) WEATHER EXPECTED TO BE? This chapter presents some illustrative results for one station, Pearson Airport, extracted from the hour-by-hour simulations of the future period
5.0 WHAT IS THE FUTURE (2040-2049) WEATHER EXPECTED TO BE? This chapter presents some illustrative results for one station, Pearson Airport, extracted from the hour-by-hour simulations of the future period
Effects of sub-grid variability of precipitation and canopy water storage on climate model simulations of water cycle in Europe
 Adv. Geosci., 17, 49 53, 2008 Author(s) 2008. This work is distributed under the Creative Commons Attribution 3.0 License. Advances in Geosciences Effects of sub-grid variability of precipitation and canopy
Development and Validation of Polar WRF
 Polar Meteorology Group, Byrd Polar Research Center, The Ohio State University, Columbus, Ohio Development and Validation of Polar WRF David H. Bromwich 1,2, Keith M. Hines 1, and Le-Sheng Bai 1 1 Polar
Atmospheric Processes
 Atmospheric Processes Atmospheric prognostic variables Wind Temperature Humidity Cloud Water/Ice Atmospheric processes Mixing Radiation Condensation/ Evaporation Precipitation Surface exchanges Friction
Lecture 7: The Monash Simple Climate
 Climate of the Ocean Lecture 7: The Monash Simple Climate Model Dr. Claudia Frauen Leibniz Institute for Baltic Sea Research Warnemünde (IOW) claudia.frauen@io-warnemuende.de Outline: Motivation The GREB
NIDIS Intermountain West Regional Drought Early Warning System February 7, 2017
 NIDIS Drought and Water Assessment NIDIS Intermountain West Regional Drought Early Warning System February 7, 2017 Precipitation The images above use daily precipitation statistics from NWS COOP, CoCoRaHS,
A Snow-Ratio Equation and Its Application to Numerical Snowfall Prediction
 644 W E A T H E R A N D F O R E C A S T I N G VOLUME 23 A Snow-Ratio Equation and Its Application to Numerical Snowfall Prediction KUN-YOUNG BYUN, JUN YANG,* AND TAE-YOUNG LEE Laboratory for Atmospheric
IAP Dynamical Seasonal Prediction System and its applications
 WCRP Workshop on Seasonal Prediction 4-7 June 2007, Barcelona, Spain IAP Dynamical Seasonal Prediction System and its applications Zhaohui LIN Zhou Guangqing Chen Hong Qin Zhengkun Zeng Qingcun Institute
A Study of Convective Initiation Failure on 22 Oct 2004
 A Study of Convective Initiation Failure on 22 Oct 2004 Jennifer M. Laflin Philip N. Schumacher NWS Sioux Falls, SD August 6 th, 2011 Introduction Forecasting challenge: strong forcing for ascent and large
The WRF Microphysics and a Snow Event in Chicago
 2.49 The WRF Microphysics and a Snow Event in Chicago William Wilson* NOAA/NWS/WFO Chicago 1. Introduction Mesoscale meteorological models are increasingly being used in NWS forecast offices. One important
11B.1 INFLUENCE OF DIABATIC POTENTIAL VORTICITY ANOMALIES UPON WARM CONVEYOR BELT FLOW. PART I: FEBRUARY 2003
 INFLUENCE OF DIABATIC POTENTIAL VORTICITY ANOMALIES UPON WARM CONVEYOR BELT FLOW. PART I: 14-15 FEBRUARY 2003 Philip N. Schumacher, NOAA/NWS, Sioux Falls, SD Joshua M. Boustead, NOAA/NWS, Valley, NE Martin
AIR MASSES. Large bodies of air. SOURCE REGIONS areas where air masses originate
 Large bodies of air AIR MASSES SOURCE REGIONS areas where air masses originate Uniform in composition Light surface winds Dominated by high surface pressure The longer the air mass remains over a region,
Numerical Experiments of Tropical Cyclone Seasonality over the Western North Pacific
 Numerical Experiments of Tropical Cyclone Seasonality over the Western North Pacific Dong-Kyou Lee School of Earth and Environmental Sciences Seoul National University, Korea Contributors: Suk-Jin Choi,
Introduction to climate modeling. ECOLMAS Course 1-4 April 2008
 Introduction to climate modeling ECOLMAS Course 1-4 April 2008 Course description Goal: To equipe you with a comfortable basic knowledge in the trade of climate modeling Course web site: http://www.geo.unibremen.de/~apau/ecolmas_modeling2
The Effect of Sea Spray on Tropical Cyclone Intensity
 The Effect of Sea Spray on Tropical Cyclone Intensity Jeffrey S. Gall, Young Kwon, and William Frank The Pennsylvania State University University Park, Pennsylvania 16802 1. Introduction Under high-wind
Incorporation of 3D Shortwave Radiative Effects within the Weather Research and Forecasting Model
 Incorporation of 3D Shortwave Radiative Effects within the Weather Research and Forecasting Model W. O Hirok and P. Ricchiazzi Institute for Computational Earth System Science University of California
Land Surface: Snow Emanuel Dutra
 Land Surface: Snow Emanuel Dutra emanuel.dutra@ecmwf.int Slide 1 Parameterizations training course 2015, Land-surface: Snow ECMWF Outline Snow in the climate system, an overview: Observations; Modeling;
The North Atlantic Oscillation: Climatic Significance and Environmental Impact
 1 The North Atlantic Oscillation: Climatic Significance and Environmental Impact James W. Hurrell National Center for Atmospheric Research Climate and Global Dynamics Division, Climate Analysis Section
New Zealand Climate Update No 223, January 2018 Current climate December 2017
 New Zealand Climate Update No 223, January 2018 Current climate December 2017 December 2017 was characterised by higher than normal sea level pressure over New Zealand and the surrounding seas. This pressure
Modeling Study of Atmospheric Boundary Layer Characteristics in Industrial City by the Example of Chelyabinsk
 Modeling Study of Atmospheric Boundary Layer Characteristics in Industrial City by the Example of Chelyabinsk Lenskaya Olga Yu.*, Sanjar M. Abdullaev South Ural State University, Chelyabinsk, *ecolcsu@gmail.com
Regional Climate Simulations with WRF Model
 WDS'3 Proceedings of Contributed Papers, Part III, 8 84, 23. ISBN 978-8-737852-8 MATFYZPRESS Regional Climate Simulations with WRF Model J. Karlický Charles University in Prague, Faculty of Mathematics
WATER VAPOR FLUXES OVER EQUATORIAL CENTRAL AFRICA
 WATER VAPOR FLUXES OVER EQUATORIAL CENTRAL AFRICA INTRODUCTION A good understanding of the causes of climate variability depend, to the large extend, on the precise knowledge of the functioning of the
Impacts of the April 2013 Mean trough over central North America
 Impacts of the April 2013 Mean trough over central North America By Richard H. Grumm National Weather Service State College, PA Abstract: The mean 500 hpa flow over North America featured a trough over
ESCI 344 Tropical Meteorology Lesson 7 Temperature, Clouds, and Rain
 ESCI 344 Tropical Meteorology Lesson 7 Temperature, Clouds, and Rain References: Forecaster s Guide to Tropical Meteorology (updated), Ramage Tropical Climatology, McGregor and Nieuwolt Climate and Weather
The Dynamic Earth Section 3. Chapter 3 The Dynamic Earth Section 3: The Hydrosphere and Biosphere DAY 1
 Chapter 3 The Dynamic Earth Section 3: The Hydrosphere and Biosphere DAY 1 The Hydrosphere The hydrosphere includes all of the water on or near the Earth s surface. This includes water in the oceans, lakes,
APPENDIX B PHYSICAL BASELINE STUDY: NORTHEAST BAFFIN BAY 1
 APPENDIX B PHYSICAL BASELINE STUDY: NORTHEAST BAFFIN BAY 1 1 By David B. Fissel, Mar Martínez de Saavedra Álvarez, and Randy C. Kerr, ASL Environmental Sciences Inc. (Feb. 2012) West Greenland Seismic
Monthly Long Range Weather Commentary Issued: APRIL 18, 2017 Steven A. Root, CCM, Chief Analytics Officer, Sr. VP,
 Monthly Long Range Weather Commentary Issued: APRIL 18, 2017 Steven A. Root, CCM, Chief Analytics Officer, Sr. VP, sroot@weatherbank.com MARCH 2017 Climate Highlights The Month in Review The average contiguous
ABSTRACT 3 RADIAL VELOCITY ASSIMILATION IN BJRUC 3.1 ASSIMILATION STRATEGY OF RADIAL
 REAL-TIME RADAR RADIAL VELOCITY ASSIMILATION EXPERIMENTS IN A PRE-OPERATIONAL FRAMEWORK IN NORTH CHINA Min Chen 1 Ming-xuan Chen 1 Shui-yong Fan 1 Hong-li Wang 2 Jenny Sun 2 1 Institute of Urban Meteorology,
CLIMATE. UNIT TWO March 2019
 CLIMATE UNIT TWO March 2019 OUTCOME 9.2.1Demonstrate an understanding of the basic features of Canada s landscape and climate. identify and locate major climatic regions of Canada explain the characteristics
1. Base your answer to the following question on the weather map below, which shows a weather system that is affecting part of the United States.
 1. Base your answer to the following question on the weather map below, which shows a weather system that is affecting part of the United States. Which sequence of events forms the clouds associated with
Definitions Weather and Climate Climates of NYS Weather Climate 2012 Characteristics of Climate Regions of NYS NYS s Climates 1.
 Definitions Climates of NYS Prof. Anthony Grande 2012 Weather and Climate Weather the state of the atmosphere at one point in time. The elements of weather are temperature, t air pressure, wind and moisture.
The Arctic Energy Budget
 The Arctic Energy Budget The global heat engine [courtesy Kevin Trenberth, NCAR]. Differential solar heating between low and high latitudes gives rise to a circulation of the atmosphere and ocean that
Polar Meteorology Group, Byrd Polar Research Center, The Ohio State University, Columbus, Ohio
 JP2.14 ON ADAPTING A NEXT-GENERATION MESOSCALE MODEL FOR THE POLAR REGIONS* Keith M. Hines 1 and David H. Bromwich 1,2 1 Polar Meteorology Group, Byrd Polar Research Center, The Ohio State University,
Science 1206 Chapter 1 - Inquiring about Weather
 Science 1206 Chapter 1 - Inquiring about Weather 1.1 - The Atmosphere: Energy Transfer and Properties (pp. 10-25) Weather and the Atmosphere weather the physical conditions of the atmosphere at a specific
Collision and Coalescence 3/3/2010. ATS 351 Lab 7 Precipitation. Droplet Growth by Collision and Coalescence. March 7, 2006
 ATS 351 Lab 7 Precipitation March 7, 2006 Droplet Growth by Collision and Coalescence Growth by condensation alone takes too long ( 15 C -) Occurs in clouds with tops warmer than 5 F Greater the speed
High initial time sensitivity of medium range forecasting observed for a stratospheric sudden warming
 GEOPHYSICAL RESEARCH LETTERS, VOL. 37,, doi:10.1029/2010gl044119, 2010 High initial time sensitivity of medium range forecasting observed for a stratospheric sudden warming Yuhji Kuroda 1 Received 27 May
Forecasting Lake-Effect Precipitation in the Great Lakes region using NASA Enhanced Satellite Data
 Forecasting Lake-Effect Precipitation in the Great Lakes region using NASA Enhanced Satellite Data Michelle Cipullo 1, Andrew Molthan 2, Jackie Shafer 2, Gary Jedlovec 2, and Jonathan Case 3 1 North Carolina
Study of Hydrometeorology in a Hard Rock Terrain, Kadirischist Belt Area, Anantapur District, Andhra Pradesh
 Open Journal of Geology, 2012, 2, 294-300 http://dx.doi.org/10.4236/ojg.2012.24028 Published Online October 2012 (http://www.scirp.org/journal/ojg) Study of Hydrometeorology in a Hard Rock Terrain, Kadirischist
The increase of snowfall in Northeast China after the mid 1980s
 Article Atmospheric Science doi: 10.1007/s11434-012-5508-1 The increase of snowfall in Northeast China after the mid 1980s WANG HuiJun 1,2* & HE ShengPing 1,2,3 1 Nansen-Zhu International Research Center,
Chiang Rai Province CC Threat overview AAS1109 Mekong ARCC
 Chiang Rai Province CC Threat overview AAS1109 Mekong ARCC This threat overview relies on projections of future climate change in the Mekong Basin for the period 2045-2069 compared to a baseline of 1980-2005.
Impact of different cumulus parameterizations on the numerical simulation of rain over southern China
 Impact of different cumulus parameterizations on the numerical simulation of rain over southern China P.W. Chan * Hong Kong Observatory, Hong Kong, China 1. INTRODUCTION Convective rain occurs over southern
CHAPTER IV THE RELATIONSHIP BETWEEN OCEANOGRAPHY AND METEOROLOGY
 CHAPTER IV THE RELATIONSHIP BETWEEN OCEANOGRAPHY AND METEOROLOGY THE relationship between oceanography and meteorology is of an order different from that between it and geology or biology, because meteorologic
The weather in Iceland 2012
 The Icelandic Meteorological Office Climate summary 2012 published 9.1.2013 The weather in Iceland 2012 Climate summary Sunset in Reykjavík 24th April 2012 at 21:42. View towards west from the balcony
High resolution rainfall projections for the Greater Sydney Region
 20th International Congress on Modelling and Simulation, Adelaide, Australia, 1 6 December 2013 www.mssanz.org.au/modsim2013 High resolution rainfall projections for the Greater Sydney Region F. Ji a,
ABSTRACT 2 DATA 1 INTRODUCTION
 16B.7 MODEL STUDY OF INTERMEDIATE-SCALE TROPICAL INERTIA GRAVITY WAVES AND COMPARISON TO TWP-ICE CAM- PAIGN OBSERVATIONS. S. Evan 1, M. J. Alexander 2 and J. Dudhia 3. 1 University of Colorado, Boulder,
Analysis of meteorological measurements made over three rainy seasons in Sinazongwe District, Zambia.
 Analysis of meteorological measurements made over three rainy seasons in Sinazongwe District, Zambia. 1 Hiromitsu Kanno, 2 Hiroyuki Shimono, 3 Takeshi Sakurai, and 4 Taro Yamauchi 1 National Agricultural
Verification of the Seasonal Forecast for the 2005/06 Winter
 Verification of the Seasonal Forecast for the 2005/06 Winter Shingo Yamada Tokyo Climate Center Japan Meteorological Agency 2006/11/02 7 th Joint Meeting on EAWM Contents 1. Verification of the Seasonal
Severe Freezing Rain in Slovenia
 Severe Freezing Rain in Slovenia Janez Markosek, Environmental Agency, Slovenia Introduction At the end of January and at the beginning of February 2014, severe and long-lasting freezing rain affected
Climates of NYS. Definitions. Climate Regions of NYS. Storm Tracks. Climate Controls 10/13/2011. Characteristics of NYS s Climates
 Definitions Climates of NYS Prof. Anthony Grande 2011 Weather and Climate Weather the state of the atmosphere at one point in time. The elements of weather are temperature, air pressure, wind and moisture.
Large-Eddy Simulations of Tropical Convective Systems, the Boundary Layer, and Upper Ocean Coupling
 DISTRIBUTION STATEMENT A. Approved for public release; distribution is unlimited. Large-Eddy Simulations of Tropical Convective Systems, the Boundary Layer, and Upper Ocean Coupling Eric D. Skyllingstad
General Circulation. Nili Harnik DEES, Lamont-Doherty Earth Observatory
 General Circulation Nili Harnik DEES, Lamont-Doherty Earth Observatory nili@ldeo.columbia.edu Latitudinal Radiation Imbalance The annual mean, averaged around latitude circles, of the balance between the
Coastal Antarctic polynyas: A coupled process requiring high model resolution in the ocean and atmosphere
 Coastal Antarctic polynyas: A coupled process requiring high model resolution in the ocean and atmosphere Mike Dinniman and John Klinck Center for Coastal Physical Oceanography Old Dominion University
An intercomparison model study of Lake Valkea-Kotinen (in a framework of LakeMIP)
") Third Workshop on Parameterization of Lakes in Numerical Weather Prediction and Climate Modelling Finnish Meteorological Insitute, Helsinki, September 18-20 2012 An intercomparison model study of Lake
Third Workshop on Parameterization of Lakes in Numerical Weather Prediction and Climate Modelling Finnish Meteorological Insitute, Helsinki, September 18-20 2012 An intercomparison model study of Lake
JOURNAL OF INTERNATIONAL ACADEMIC RESEARCH FOR MULTIDISCIPLINARY Impact Factor 1.393, ISSN: , Volume 2, Issue 4, May 2014
 Impact Factor 1.393, ISSN: 3583, Volume, Issue 4, May 14 A STUDY OF INVERSIONS AND ISOTHERMALS OF AIR POLLUTION DISPERSION DR.V.LAKSHMANARAO DR. K. SAI LAKSHMI P. SATISH Assistant Professor(c), Dept. of
A New Method for Representing Mixed-phase Particle Fall Speeds in Bulk Microphysics Parameterizations
 November Journal of the 2008 Meteorological Society of Japan, Vol. J. 86A, DUDHIA pp. 33 44, et al. 2008 33 A New Method for Representing Mixed-phase Particle Fall Speeds in Bulk Microphysics Parameterizations
Projected change in the East Asian summer monsoon from dynamical downscaling
 Copyright KIOST, ALL RIGHTS RESERVED. Projected change in the East Asian summer monsoon from dynamical downscaling : Moisture budget analysis Chun-Yong Jung 1,2, Chan Joo Jang 1*, Ho-Jeong Shin 1 and Hyung-Jin
The Influence of the Great Lakes on Snowfall Patterns in the Southern Appalachians
 62 nd EASTERN SNOW CONFERENCE Waterloo, ON, Canada 2005 The Influence of the Great Lakes on Snowfall Patterns in the Southern Appalachians BAKER PERRY 1,2 AND CHARLES E. KONRAD 2 ABSTRACT Low-level moisture
Enabling Multi-Scale Simulations in WRF Through Vertical Grid Nesting
 2 1 S T S Y M P O S I U M O N B O U N D A R Y L A Y E R S A N D T U R B U L E N C E Enabling Multi-Scale Simulations in WRF Through Vertical Grid Nesting DAVID J. WIERSEMA University of California, Berkeley
Climatology of Surface Wind Speeds Using a Regional Climate Model
 Climatology of Surface Wind Speeds Using a Regional Climate Model THERESA K. ANDERSEN Iowa State University Mentors: Eugene S. Takle 1 and Jimmy Correia, Jr. 1 1 Iowa State University ABSTRACT Long-term
J8.4 TRENDS OF U.S. SNOWFALL AND SNOW COVER IN A WARMING WORLD,
 J8.4 TRENDS OF U.S. SNOWFALL AND SNOW COVER IN A WARMING WORLD, 1948-2008 Richard R. Heim Jr. * NOAA National Climatic Data Center, Asheville, North Carolina 1. Introduction The Intergovernmental Panel
An Introduction to Coupled Models of the Atmosphere Ocean System
 An Introduction to Coupled Models of the Atmosphere Ocean System Jonathon S. Wright jswright@tsinghua.edu.cn Atmosphere Ocean Coupling 1. Important to climate on a wide range of time scales Diurnal to
Torben Königk Rossby Centre/ SMHI
 Fundamentals of Climate Modelling Torben Königk Rossby Centre/ SMHI Outline Introduction Why do we need models? Basic processes Radiation Atmospheric/Oceanic circulation Model basics Resolution Parameterizations