Hands-on Training on Weather Radar QC
|
|
|
- Delilah Robertson
- 5 years ago
- Views:
Transcription


1 Hands-on Training on Weather Radar QC 7-8th February 2018 Junji HOTTA Office of Observation Systems Operation Observation Department
2 Weather radar Guide map of the workshop Basics and operation of weather radars Day 1: 1 Hardware Install Calibration Maintenance Day 1-2: 2 Advanced techniques Solid-state transmitter Day 1-2: 2 Observation Obs. scheduling Quality control Sites composite Day 2-4: 4,5 Advanced techniques Doppler velocity Accurate obs. using dual-pol Application QPE&QPF Advanced techniques Detecting mesocyclone Day 4: 7 Products derived from dual-pol obs. Day 4: 7 Weather summary Day 4: 7 Day 5: 9 Regional radar network Capacity development Data exchange Regional cooperation Day 9: 12
3 Hands-on Training on Weather Radar QC Introduction of JMA Operational system (15min.) Quality control algorithms Characteristics of non-precipitation echo (10min.) JMA methods of Pseudo CAPPI process (15min.) Statistical approach for QC (10min.) Hands on training (90min.) Adjustment of elevation angle composite table Making PCAPPI and Statistical data Verification of the results


4 JMA s Weather Radar Network Radar raingauge C-band Radar observes reflected echo (precipitation drops) and Doppler Velocity. Precipitation, Wind Every 5 min. Satellite Fukuoka Doppler Radars (20) Radar Coverage Area Matsue Hiroshima Tanegashima Fukui Murotomisaki Sapporo Akita Hakodate Niigata Sendai Nagano Tokyo Nagoya. Osaka Shizuoka Kushiro Okinawa Ishigakijima Naze Domestic Core Network (TCP/IP) Tokyo Radar Operation Center (HQ, Tokyo) Backup System (Osaka)
5 JMA radar specifications Frequency 5300~5370 MHz (C-band ) TX type Peak Power Klystron 250 kw Pulse Width 2.5 μs 1.0 μs Pulse Repetition Frequency (PRF) Antenna Diameter Maximum Range 330 Hz 600/480 Hz 940/752 Hz 4 m (Beam Width < 1.2 ) Rainfall intensity : 400 km Doppler velocity : 250 km


")


6 Nationwide Radar Composite Maps C-band Radars JMA C-Band : 20 MLIT C-Band: 26 C-band Radar echo data (JMA, MLIT) are collected to the center system and integrated into a nationwide echo intensity composite map( every 5 minutes ) MLIT: Ministry of Land, Infrastructure, Transport and Tourism for Monitoring / Nowcasting Quantitative Precipitation Estimation / Forecast (QPE/QPF) etc.
 Center (Tokyo) 1 st Unit")


7 Radar network system Radome Antenna Unit Backup Center (Osaka) Center (Tokyo) 1 st Unit Waveguide 3 rd Unit Antenna Transmitter Controller & Receiver Signal Processor & Data Processor Communication Line JMA network 2 nd Unit Remote Control Monitor Unit Control and and Monitor Units Radar Observatory Monitor Unit Local Met. Office Headquarters (Central operation center)


8 Automated QC on radar systems Data Flow Radar sites Raw data Reflectivity Velocity Center System Raw data Composite map Meso-cyclone detection Another Products Forecasting Product Systems QPE QPF QC methods Side lobe Removal Selective MTI MTI map processing Interference Removal Sweep correlation 2nd-trip Echo Removal etc Making products QC on the PCAPPI process QC at every product Quality Control for radar composite
9 Basic concept of scanning schedule Precipitation Low PRF, long pulse (330 Hz, 2.6 micro sec.) Velocity long distance Mainly precipitation Dual High PRF, short pulse (940/752 Hz, 600/480 Hz, 1.1 micro sec.) Short distance Velocity range is large
10 Observation Scan Sequence Example of Tokyo radar 10-minute volume scanning 400km-range Low-PRF obs. (330Hz, 2.6μs) km-range Low-PRF obs. (330Hz, 2.6μs) km-range High-PRF obs. (940/752Hz, 1.1μs) 250km-range (*1) High-PRF obs. (940/752Hz, 1.1μs) 250km-range Middle-PRF obs. (600/480Hz, 1.1μs) 150km-range High-PRF obs. (940/752Hz, 1.1μs) 150km-range High-PRF obs. (940/752Hz, 1.1μs) 250km-range Middle-PRF obs. (600/480Hz, 1.1μs) 250km-range (*1) High-PRF obs. (940/752Hz, 1.1μs) 10 (*1) Range Unfolding
11 Observation Scan Sequence Example of Tokyo radar 10-minute volume scanning 400km-range Low-PRF obs. (330Hz, 2.6μs) km-range Low-PRF obs. (330Hz, 2.6μs) km-range High-PRF obs. (940/752Hz, 1.1μs) 250km-range (*1) High-PRF obs. (940/752Hz, 1.1μs) 250km-range Middle-PRF obs. (600/480Hz, 1.1μs) 150km-range High-PRF obs. (940/752Hz, 1.1μs) 150km-range High-PRF obs. (940/752Hz, 1.1μs) 250km-range Middle-PRF obs. (600/480Hz, 1.1μs) 250km-range (*1) High-PRF obs. (940/752Hz, 1.1μs) 11 (*1) Range Unfolding

 Data Format")
12 Primary Data Data Type Unit Coordinates Mesh Size Area Number of Mesh Each radar Echo intensity Doppler Velocity dbz Polar 250 m x 0.7 deg m/s Polar 250 m x 0.7 deg 400 km radius 250 km or 150 km radius Data Size (one mesh) Data Format Period 8,192,000 1 byte GRIB2 10 min 512,000 or 307,200 1 byte GRIB2 10 min
13 CAPPI CAPPI stands for Constant Altitude Plan Position Indicator. A horizontal cross-section display of a variable at a specified altitude. Height Elevation 4 Elevation 3 Elevation 2 Horizontal cross-section Adopted elevation for CAPPI CAPPI Elevation 1 Distance from the radar
14 Pseudo CAPPI The no data regions as seen in the CAPPI (close to and away from the radar with reference to the selected altitude) are filled with the data from the highest and the lowest elevations, respectively, in another form of CAPPI, called Pseudo CAPPI. As horizontal cross-section Adopted elevation for PCAPPI Height PCAPPI Elevation 4 Elevation 3 Elevation 2 Avoid clutter, no data region no data regions Elevation 1 (shadowed) Distance from the radar

15 Pseudo CAPPI Topography and suitable observation elevation depend on the place of radar sites. Every radar requires this setting for every direction. This setting for JMA methods of PCAPPI is called elevation angle composite table. As horizontal cross-section Adopted elevation for PCAPPI Height PCAPPI Elevation 4 Elevation 3 Elevation 2 Avoid clutter, no data region no data regions Elevation 1 (shadowed) Distance from radar
 Data Format 250,000 1 byte Radar IO Period 5 min 250,000 1 byte GRIB2 10")
16 Pseudo CAPPI 15 layers CAPPI Data Type Unit Coordinates Mesh Size Area Number of Mesh Each radar Pseudo CAPPI mm/hr xy 1 x 1 km 500 x 500 km CAPPI dbz xy 1 x 1 km 500 x 500 km Data Size (one mesh) Data Format 250,000 1 byte Radar IO Period 5 min 250,000 1 byte GRIB2 10 min


 Quality")


17 Nationwide Radar Composite Precipitation Intensity Composite processing Low-altitude reflectivity of each radar Z-R Conversion (Z=200R 1.6 ) Quality control Radar-raingauge processing Calibration factor of each radar Calibration Combining (*maximum) * Intercompare before calibration All radar echo data are collected to the center system, and nationwide composite map is made. 17 Nationwide radar echo composite data
18 Hands-on Training on Weather Radar QC Introduction of JMA Operational system Quality control algorithms Characteristics of non-precipitation echo JMA methods of Pseudo CAPPI process Statistical approach for QC Hands on training Adjustment of elevation angle composite table Making PCAPPI and Statistical data Verification of the results
19 Ground clutter Echoes due to non-precipitation targets are known as clutter. Clutter can be the result of a variety of targets, including buildings, hills, mountains, aircraft and chaff. * WMO GUIDE TO METEOROLOGICAL INSTRUMENTS AND METHODS OF OBSERVATION WMO-No. 8 (2008 edition, Updated in 2010) Part Ⅱ chapter 9 radar measurements

 With the passage of a")


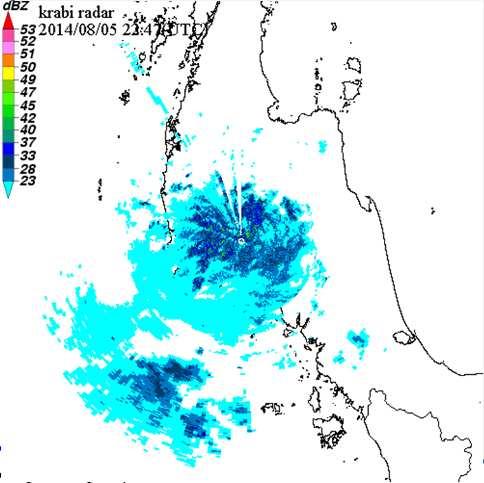
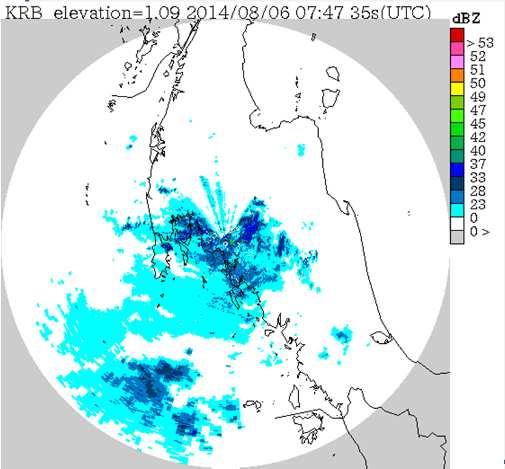
20 Example of remaining ground clutters 2012/APR/03 Rapidly developed extratropical cyclone Animation m Height (Above Sea Level) With the passage of a low pressure system, storms occurred across the country. In such cases, ground clutters may not be completely removed. Careful monitoring is required because they do not indicate actual precipitation. Niigata radar Precipitation Fukui radar Vertical crosssection Reflectivity 0.4deg Bangkok, Reflectivity Thailand, deg February 2018
21 Sea Clutter Sea clutter is observed caused by sea wave or sea spray. Because of sea wave motion, suppression by MTI does not work well. For the elimination of usual sea clutters, the radar scans with high elevation angle are employed to produce the PCAPPI.

22 2011/08/04 Typhoon MUIFA (1011) Calm day Sea clutter Okinawa radar Reflectivity factor 0.1deg Reflectivity factor 0.1deg Reflectivity factor 0.2deg Reflectivity factor 0.6deg In windy situations, the sea spray may be observed at low elevation angles.

23 Anomalous propagation The variation of refractive index in the air refracts the radar beam below. This kind of refraction is known as the anomalous propagation. The anomalous propagation produces some false echoes, in most cases as sea clutter. 23 An example of non precipitation echo due to anomalous propagation
24 AP case of JMA radar Jun/2/2014 Because of inversion layer Observed by Murotomisaki radar Precipitation Precipitation Murotomisaki radar

25 Echo at upper altitudes - upper-air echoes - echo! Upper-air echo no echo! The radar echo is sometimes observed only at upper altitudes. In this case, the liquid drop is completely vaporized during its falling, so precipitation don t reaches the ground.
 and cross")
26 CAPPI image at an altitude of 6 km(left) and cross section(right)

27 Various Types of Electromagnetic Noises Sun noise Interference The sun generates noise The interference comes from artefactual electromagnetic sources.

28 Examples of interference Echo Intensity Echo Top Interference from another radar Interference from moving body
29 Importance of Case Accumulation It is important to accumulate cases of anomalous echo. It will be very useful for QC. The materials should include Meteorological information such as Weather charts Various observations (AWS, sonde, satellite, radar ) Case Accumulation Improvement plan
30 Hands-on Training on Weather Radar QC Introduction of JMA Operational system Quality control algorithms Characteristics of non-precipitation echo JMA methods of Pseudo CAPPI process Statistical approach for QC Hands on training Adjustment of elevation angle composite table Making PCAPPI and Statistical data Verification of the results
31 JMA way of Pseudo CAPPI PPI at the elevation -0.1 degree JMA way of Pseudo CAPPI JMA methods of Pseudo CAPPI (PCAPPI); height is about 2 km by using several PPIs at low elevation angles. This data can remove sea clutters and also ground clutters.
32 Elevation angle composite table Elevation angle composite table is parameters for making Quality Controlled CAPPI data Selecting an optimal elevation angle located near 2 km altitude in each place Avoiding an effect of ground clutter Cross sectional view of radar beam <Elevation> (1) 0.0deg (2) 0.3deg (3) 0.7deg (4) 1.1deg (5) 1.7deg (6) 2.5deg 2 km
33 Data processing flow for PCAPPI Radar data in grib2 (r, θ) by elevation angle Creation EIL QC process QC parameters Elevation angle composite table sitelowmake.ini Compositing PPIs at several elevation angles Coordinate transformation Isolated echo removal Noise cut Clutter map Minimum rain rate Called EIL Echo Intensity at the Lowest level JMA methods of PCAPPI in (X, Y) Compositing XY data of all sites Nationwide echo intensity composite map
34 Parameters Ex.) [47695] elangles=3.8,2,1.0,0.3,1.7,1.1,0.7,0.3,0.0,25.0,17.9,1 2.9,9.3,6.7,3.8,2.0,1.0,0.3,4.8,3.5,2.5,1.7,1.1,0.7,0.3, 0.0 use_angle_10a=0,0,0,0,0,0,0,0,0,0,0,0,0,0,0,0,0,0,0,0,1,1,1,1,1,1 code=a5 ename=tokyo offx=20 offy=20 n0=51.1 noise_cut=704 rain_cut=33 iso_window=5 iso_count=5 smooth_r=100 smooth_t=10 clut1_file=clut "aa "_00_1 clut1_type=3 clut1_wx=3 clut1_wy=3 clut1_count=0 clut2_file= clut2_type=3 clut2_wx=0 clut2_wy=0 clut1_count=0 B=200 sitelowmake.ini beta=1.6

35 Smoothing around border of composite table Elevation 1 is 77 meshes 30dBZ Elevation 2 is 154 meshes 50dBZ Elevation 3 is 210 meshes 35dBZ Smoothing around border of elevation angles to avoid discontinuity at connection in elevation angle composite process. The smoothing areas is 10km around border. We count the number of meshes every angle, and use them as weight for the averaging intensities. The left figure shows an example. Smoothed intensity = 77*10^(30/10) + 154*10^(50/10) + 210*10^(35/10) 441 = Logarithmic value, 10 * log =45.63 ( dbz )
 : azimuth for smoothing (deg*10) The weights are calculated : 100 km in range direction : 10 degree")
36 Test WMO/ASEAN Training Workshop on Weather Radar Data Quality and Standardization Smoothing Without smoothing After smoothing: 1 After smoothing: 2 smooth_r=100 smooth_t=10 The weights are calculated : 10 km in range direction : 1 degree in azimuth direction : range for smoothing (km*10) : azimuth for smoothing (deg*10) The weights are calculated : 100 km in range direction : 10 degree in azimuth direction
37 WMO/ASEAN Training Workshop on Weather Radar Data Quality and Standardization Transformation from Polar coordinates to X-Y coordinates Primary data (PPI in polar coordinate (R, θ, φ)) are transformed to X-Y coordinates(x, Y, φ) with a spatial resolution of 1km, and an area of 500km 500km square X-Y coordinates. The nearest bin in polar coordinate is applied for each mesh in X-Y coordinate. This can reduce data size of huge primary data and make them be easier to use. X-Y coordinates(0,0) θ R XY Processing region (500km x 500km) XY data center Radar station X-Y coordinates(499,499)
38 Isolated echo removal Removing the isolated echoes caused by ground clutter, ships and aircrafts. In the 5 5 meshes, the number of meshes of which intensity is larger than zero is counted except of the target center mesh. If the number is below a threshold, the intensity of the mesh is set to zero. If not, it will remain. Number of meshes in the area is four. Ex.) Threshold =5 The reflectivity will be set to zero. Number of meshes in the area is five. The reflectivity will remain. iso_window=5 : number of meshes on a side of considering area iso_count=5 : threshold
39 Noise cut In this process, echo intensities below a threshold are set to zero, i.e, No Echo. This threshold depends on each radar. noise_cut=704 : threshold (dbz*100)
40 Clutter map Clutter map is used when process like MTI could not eliminated clutter. A clutter map has thresholds to delete echoes or values from the observed echo intensities. Nr = Ns + 10 * log( 1 10 ^ ( ( Ng Ns ) / 10 ) ) always case dbz less echo case case case Ng:clutter map value(dbz) Ns:reflectivity before subtraction(dbz) Nr:reflectivity after subtraction(dbz) cut decrease dbz cut decrease clut1_file=clut "aa " _00_1 clut1_type=3 clut1_wx=3 clut1_wy=3 clut1_count=0
 We")

 Quantitative Precipitation Estimate")
41 Example of the impact of clutter map processing on QPE data 1-month accumulated QPE data for May 2006 (before applying clutter map) We applied clutter map to meshes which shows extremely high value compared to the surrounding meshes decreased. Clutter map as of June 2006 (red meshes) 1-month accumulated QPE data for May 2007 (after applying clutter map) Quantitative Precipitation Estimate (QPE) : Radar/rain-gauge analyzed precipitation
42 Minimum rain-rate Minimum rain-rate is a process for cutting low level value after clutter map process. If the Nr is below a minimum rain-rate, the Nr is set to zero (No Echo) Nr:reflectivity after subtraction(dbz) rain_cut=33 (mm/h*100) : threshold
43 Features of each algorithm Algorithm Type Advantage Disadvantage Elevation angle composite table Selected angle Area:(r,theta) Sea clutter Ground clutter Noise cut Minimum rain-rate Low level cut Area : all Low level noise Low level echo Clutter map Level cut(set) Area : mesh Ground clutter (enable to remove by MTI) Remove precipitation echo (Labor for setting)
44 Summary of EIL process EIL process contains many quality control methods. In order to create Cartesian data with good quality (less clutter and less noise), we need to set various parameters adequately. Removing non-precipitation echo has a possibility also removing precipitation echo.
45 Hands-on Training on Weather Radar QC Introduction of JMA Operational system Quality control algorithms Characteristics of non-precipitation echo JMA methods of Pseudo CAPPI process Statistical approach for QC Hands on training Adjustment of elevation angle composite table Making PCAPPI and Statistical data Verification of the results
46 Statistical approach for QC Statistical method is effective way to understand the quality of radar data. JMA uses the statistics for quality control. Appearance count Summation Make every sites, angles and lowest.(monthly)

47 Appearance Count Count over 1mm/h precipitation intensity calculated from dbz, B, and beta. The appearance clarifies : continuous weak echoes

48 Summation Sum up precipitation from radar data. Appearance count can t detect clutter or high intensity echo, but summation can detect these things. That would be clear using summation data. The summation of precipitation from clutter affects QPE.
49 Target Every elevation s observation To understand the characteristics of observation at each elevation. EIL (Echo Intensity at the Lowest Level) To understand the characteristics of products. - Shadowed area - Observable area - Low quality area
50 Each Data(observation time) Statistical Data Every angle Lowest
51 In Statistical program Use average instead of Summation Equivalent ( with using data count) Summation Average Data count
52 How to detect clutter Various type of clutter exists but Advantages Average Merely but strong Appearance Weak but continuous Appearance = 1 Average = 35 0 time suspicious 2 1 Type of Clutter caught merely but strong Precipitation case is not so suspicious Appearance = 6 Average = time Appearance = 6 Average = 1 Type of Clutter caught weak but continuous time suspicious
 0.")

53 Summation Test of MUROTOMISAKI Radar May deg is operation. (observational product) 0.6 deg test decrease the clutter. 1.2 deg test also decrease the clutter,but decrease real precipitation echo. Operation 0.2deg 1.2deg 0.6deg
54 Summary of Quality control Anomalous echo is too intense echoes compared with the actual precipitation area. Such as, Ground clutter Sea clutter Anomalous propagation etc. Complete elimination is impossible by automatic processing System operators must check such echoes Case accumulation contributes to QC Thank you for your attention!!
55 Hands-on Training on Weather Radar QC Introduction of JMA Operational system Quality control algorithm Characteristics of non-precipitation echo JMA methods of Pseudo CAPPI process Statistical approach for QC Hands on training Adjustment of elevation angle composite table Making PCAPPI and Statistical data Verification of the results


56 JMA methods of Pseudo CAPPI PPI at the elevation -0.1 degree JMA methods of Pseudo CAPPI JMA methods of Pseudo CAPPI (PCAPPI); height is about 2 km by using several PPIs at low elevation angles. This data can remove sea clutters and also ground clutters.
 0.0deg (2) 0.3deg (3) 0.7deg (4) 1.1deg (5) 1.7deg (6) 2.")
57 Elevation angle composite table Elevation angle composite table is parameters for making Quality Controlled CAPPI data Selecting an optimal elevation angle located near 2 km altitude in each place Reducing effect of ground clutter Cross sectional view of radar beam <Elevation> (1) 0.0deg (2) 0.3deg (3) 0.7deg (4) 1.1deg (5) 1.7deg (6) 2.5deg 2 km
58 Targets of Hands-on training To experience benefits of JMA s Pseudo CAPPI process - By adjusting elevation angle composite table To realize importance of statistical data - By verifying statistical data This practice will give answers to questions below; - How PCAPPI process can improve data quality? - How we find out a better way of QC with statistical data?
 Statistical PCAPPI data Appearance Count Summarized data Shadowed area Adjusting Composite table Noisy")
59 Technical cooperation with TMD (Tokyo, Nov 2014) Adjustment of Composite Tables Composite table (2014 Aug, Phisanulok radar site) Statistical PCAPPI data Appearance Count Summarized data Shadowed area Adjusting Composite table Noisy area
60 Data processing flow for PCAPPI Radar data in grib2 (r, θ) by elevation angle Creation EIL QC process QC parameters Elevation angle composite table sitelowmake.ini Compositing PPIs at several elevation angles Coordinate transformation Isolated echo removal Noise cut Clutter map Minimum rain rate Called EIL Echo Intensity at the Lowest level JMA methods of PCAPPI in (X, Y) Compositing XY data of all sites Nationwide echo intensity composite map
61 radar-library.jar Executable binary Written in java and Compressed in jar (Java ARchive) Contains decoding, encoding, data processing, coordinate transforming, and data viewing programs. Runnable in command for every purpose We use windows batch files today for simplicity. More information about this program is in...

62 Radar data and parameter file Butterworth site RAW data (IRIS format) Data period : 1 day (17 Dec, 2014) Elevation angles for PPI : 0.0, 0.7, 1.5, 2.5 [Butterworth] elangles=0.0,0.7,1.5,2.5 use_angle=1,1,1,1 code=bw ename=butterworth offx=0 offy=0 n0=54.3 noise_cut=6 rain_cut=3 iso_window=5 iso_count=5 smooth_r=41 smooth_t=3... sitelowmake.ini
63 Composite table(csv file) Composite table shows angles used in each area. agbutterworth.csv(simple CAPPI) 360, 0, 2.5, 60, 1.5, 85, 0.7, 150, 0, 300 Azimuth(deg), Distance(km), Angle (deg) simple CSV(Comma-Separated Values) this file means... for azimuth (for all around), use 2.5 angle PPI data for 0-60 km, use 1.5 angle PPI data for km, use 0.7 angle PPI data for km, use 0.0 angle PPI data for km
64 Preparation: Operation check Adjust composite table Make PCAPPI Make statistic Verification At first, We do operation check of these batch files. Please call JMA staff if you re in trouble.

65 1.MakeTablepng.bat java -cp radar-library.jar PCAPPITableToPNG./tbl/agButterworth.csv classname MakeTablepng.bat agbutterworth.csv PCAPPITableToPNG agbutterworth.csv.png agbutterworth.csvbh.png
 Angle Beam")
66 Composite table: Simple CAPPI(2km) Angle Beam Height
67 2.MakePCAPPI.bat for %%i in (./RawData/BW*) do ( java -cp radar-library.jar JMAPCappiMain -envfile=./sitelowmake.ini -tbldir=./tbl -destdir=./pcappi/. -clutdir=./clut./rawdata/%%i -gz ) for %%i in (./pcappi/*) do ( java -cp radar-library.jar PCAPPIView./pcappi/%%i -dest=./pcappiview/. -colorpallet=./cp/dbz_color.txt ) MakePCAPPI.bat RawData parameter files PCAPPI JMAPCappiMain (dummy files) PCAPPIView Png files


68 PCAPPI data Filename Details of the format is in...
69 3.Statistics_pcappi.bat java -cp radar-library.jar StatisticsMain -ini=statistics.json -name=pcappi -start= end= java -cp radar-library.jar StatisticsView./statistics/pcappi Statistics_pcappi.bat PCAPPI Statistics(csv) parameter file StatisticsMain StatisticsView "filename":"./pcappi/rcap.*'yyyymmddhhmmss'n302n.gz", "sek": "10", "calculation": "DBZtoRAIN", "outdir":"./statistics/pcappi/. } Png files
70 Statistics: Simple CAPPI(2km) noisy area shadowed area Appearance Average
71 Flow of the practice Adjust composite table Make PCAPPI Make statistic Verification Let`s adjust composite table to avoid obstacle. Radar Beam Visibility map and Cross Section Chart are useful.
72 Radar Beam Visibility Map and Cross Section Chart In this case(azimuth= 0.0 deg, 0.0deg means due north), we should not use 0.0 degree angle data because the beam is blocked. Map Cross section Color: altitude warm is low cold is high Gray: sea Black: ranges of radar beam visibility at heights of 1 km, 2km from inside deg Black: radar beams for each elevation angles Red: beams for cappi(2km), land surface ignored Blue: limitation of radar beam visibility Brown: land surface
73 How to avoid obstacles Check the beam blockage with cross section chart - Beams below the limitation line(blue line) are blocked by land surface. - We should not use the angle which beam is blocked. Edit composite table (agbutterworth.csv) - Adopt the higher angle instead of the angle which beam is blocked. Edited composite table will give us more better PCAPPI data. Let s try with me.
74 Check the beam blockage 2km 1.5km 1km 0.5km We focus on south eastern part.
75 azimuth = 100 deg azimuth = 110 deg deg 0.0deg azimuth = 120 deg In degree azimuth, We should not use 0.0deg? angle PPI data.
76 Exercise 1 Azimuth(deg), Distance(km), Angle (deg) Fill in the blanks and complete composite table. If you finished, then copy this file to upper folder, and overwrite the old table.

77 Edited composite table agbutterworth.csv(modified) 100, 0, 2.5, 60, 1.5, 85, 0.7, 150, 0, , 0, 2.5, 60, 1.5, , 0, 2.5, 60, 1.5, 85, 0.7, 150, 0, 300 Azimuth(deg), Distance(km), Angle (deg) Edit agbutterworth.csv and execute MakeTablepng.bat, then you can check your table by png file. In this case, I added lines to stop using 0.7 and 0.0 angle data for azimuth.

78 Check the beam blockage 2km 1.5km 1km 0.5km Next, We focus on south western part.

79 Exercise 2
80 azimuth = 230 deg azimuth = = deg deg deg 0.0deg azimuth = 250 deg azimuth = 260 deg deg 0.0deg
 Angle Beam")
81 Composite table(considered obstacle) Angle Beam Height
82 Flow of the practice Adjust composite table Make PCAPPI Make statistics Verification Let s make PCAPPI by new composite table.
83 Flow of the practice Adjust composite table Make PCAPPI Make statistics Verification Next, To make statistical data, Execute Statistics_pcappi again.
84 Flow of the practice Adjust composite table Make PCAPPI Make statistics Verification Verify the result of statistics from remade PCAPPI. It is important to verify the adjusted data. Because, there might be a case in which the adjusted affect might have low quality data.
85 Statistics: PCAPPI (considered obstacle) Appearance Average

86 Statistics: Simple CAPPI (2km) noisy area shadowed area Appearance Average
87 Statistics: PCAPPI (considered obstacle) Appearance Average

88 Mirror image Mirror image θb Building (mirror) Reflectivity Doppler velocity radar True weather echo 88
 Appearance")
89 Raw Data Statistics(0.0deg) Appearance Average
 Appearance")
90 Raw Data Statistics(0.7deg) Appearance Average
 Appearance")
91 Raw Data Statistics(1.5deg) Appearance Average
 Appearance")
92 Raw Data Statistics(2.5deg) Appearance Average
93 Next Challenge: Avoid mirror-image Adjust composite table Make PCAPPI Make statistics Verification Statistical data revealed that PCAPPI is partly contaminated by mirror-image. To remove mirror-image, let s adjust composite table again.

94 Exercise 3
 Angle Beam")
95 Composite table: PCAPPI (avoid mirror-image) Angle Beam Height
 Appearance")
96 Statistics: PCAPPI(avoid mirror-image) Appearance Average

97 Before Composite table Result Statistical PCAPPI data Appearance Count Average After


98 17 DEC :00UTC National composite map Quality of composite map depends on quality of each radar s EIL.


99 International Radar Composite Imagery 26 JAN :00UTC

100 With Satellite Image
101 Summary In order to create Cartesian data with good quality (less clutter and less noise), we need various processes. However, it is impossible to completely eliminate anomalous echoes by automatic processing. Radar data quality control should be done through whole radar systems. Accumulation and careful investigation of radar data will improve QC results. Thank you for your attention!!
Hands-on Exercise Quantitative Precipitation Estimation
 Hands-on Exercise Quantitative Precipitation Estimation 8 February 2018 Takanori SAKANASHI Asia Pacific Severe Weather Center, Forecast Division, Forecast Department Purpose of this hands-on training To
scale Observational Systems in Japan Meteorological Agency
 Meso scale scale Observational Systems in Japan Meteorological Agency WWRP Working Group on Mesoscale Weather Forecasting Research March 17, 2008 JMA Headquarters, Tokyo Kenji AKAEDA Observations Division,
WIND PROFILER NETWORK OF JAPAN METEOROLOGICAL AGENCY
 WIND PROFILER NETWORK OF JAPAN METEOROLOGICAL AGENCY Masahito Ishihara Japan Meteorological Agency CIMO Expert Team on Remote Sensing Upper-Air Technology and Techniques 14-17 March, 2005 Geneva, Switzerland
Recent Improvement of Integrated Observation Systems in JMA
 Recent Improvement of Integrated Observation Systems in JMA Mr Osamu Suzuki and Mr Yoshihiko Tahara Japan Meteorological Agency 1-3-4 Otemachi, Chiyoda-ku, Tokyo 100-8122, Japan Tel: +81-3-3212-8341, Fax:
Upper Air Observations
 Upper Air Observations by Japan Meteorological lagency Kenji Akaeda Japan Meteorological Agency JMA s mascot HARERUN Weather Observations by Japan Meteorological Agency Surface Observation Rd Radar Observation
Fundamentals of Radar Display. Atmospheric Instrumentation
 Fundamentals of Radar Display Outline Fundamentals of Radar Display Scanning Strategies Basic Geometric Varieties WSR-88D Volume Coverage Patterns Classic Radar Displays and Signatures Precipitation Non-weather
and hydrological applications
 Overview of QPE/QPF techniques and hydrological applications Siriluk Chumchean Department of Civil Engineering Mahanakorn University of Technology Typhoon Committee Roving Seminar 2011, Malaysia (20-23
Assessment of QPE results from 4 kw X-band Local Area Weather Radar (LAWR) evaluated with S-band radar data
 evaluated with S-band radar data") Assessment of QPE results from 4 kw X-band Local Area Weather Radar (LAWR) evaluated with S-band radar data Lisbeth Pedersen 1+3, Isztar. Zawadzki 2, Niels Einar Jensen 1 and Henrik Madsen 3, (1) DHI,
Assessment of QPE results from 4 kw X-band Local Area Weather Radar (LAWR) evaluated with S-band radar data Lisbeth Pedersen 1+3, Isztar. Zawadzki 2, Niels Einar Jensen 1 and Henrik Madsen 3, (1) DHI,
OPERA: Operational Programme for the Exchange of Weather Radar Information
 OPERA: Operational Programme for the Exchange of Weather Radar Information ALADIN-HIRLAM workshop, Toulouse Maud Martet 26-28 April 2016 OPERA: An EUMETNET Project EUMETNET: EIG of 31 European National
Quality control of weather radar data by using dual-polarization
 WMO/ASEAN Training Workshop on Weather Radar Data Quality and Standardization Quality control of weather radar data by using dual-polarization 7 February 2018 Hiroshi Yamauchi Observation Department Japan
Precipitation estimate of a heavy rain event using a C-band solid-state polarimetric radar
 Precipitation estimate of a heavy rain event using a C-band solid-state polarimetric radar Hiroshi Yamauchi 1, Ahoro Adachi 1, Osamu Suzuki 2, Takahisa Kobayashi 3 1 Meteorological Research Institute,
Recent progress in radar-based rainfall observations over Belgium. PLURISK Final Symposium Brussels, 4 October 2017
 Recent progress in radar-based rainfall observations over Belgium Laurent Delobbe Royal Meteorological Institute of Belgium with contributions from Lesley De Cruz, Loris Foresti, Edouard Goudenhoofdt,
Figure 1: Tephigram for radiosonde launched from Bath at 1100 UTC on 15 June 2005 (IOP 1). The CAPE and CIN are shaded dark and light gray,
. The CAPE and CIN are shaded dark and light gray,") Figure 1: Tephigram for radiosonde launched from Bath at 1100 UTC on 1 June 200 (IOP 1). The CAPE and CIN are shaded dark and light gray, respectively; the thin solid line partially bounding these areas
Figure 1: Tephigram for radiosonde launched from Bath at 1100 UTC on 1 June 200 (IOP 1). The CAPE and CIN are shaded dark and light gray, respectively; the thin solid line partially bounding these areas
Lab 6 Radar Imagery Interpretation
 Lab 6 Radar Imagery Interpretation Background Weather radar (radio detection and ranging) is another very useful remote sensing tool used in meteorological forecasting. Microwave radar was developed in
Lecture 15: Doppler Dilemma, Range and Velocity Folding, and Interpreting Doppler velocity patterns
 MET 4410 Remote Sensing: Radar and Satellite Meteorology MET 5412 Remote Sensing in Meteorology Lecture 15: Doppler Dilemma, Range and Velocity Folding, and Interpreting Doppler velocity patterns Doppler
2D Wind Field Estimation with Higher Spatial Resolution Using Dual Compact X-Band Weather Radars
 2D Wind Field Estimation with Higher Spatial Resolution Using Dual Compact X-Band Weather Radars 95th AMS Annual Meeting, Phoenix, Arizona By FURUNO ELECTRIC CO.,LTD January 5th, 2015 Contents 1. Introduction
Assimilation of Doppler radar observations for high-resolution numerical weather prediction
 Assimilation of Doppler radar observations for high-resolution numerical weather prediction Susan Rennie, Peter Steinle, Mark Curtis, Yi Xiao, Alan Seed Introduction Numerical Weather Prediction (NWP)
BLACK SEA AND MIDDLE EAST FLASH FLOOD GUIDANCE SYSTEM
 Republic of Turkey Ministry of Forestry and Water Works General Directorate of Turkish Meteorological Service BLACK SEA AND MIDDLE EAST FLASH FLOOD GUIDANCE SYSTEM Needs Floods occur mostly as flash floods
The Impact of Observational data on Numerical Weather Prediction. Hirokatsu Onoda Numerical Prediction Division, JMA
 The Impact of Observational data on Numerical Weather Prediction Hirokatsu Onoda Numerical Prediction Division, JMA Outline Data Analysis system of JMA in Global Spectral Model (GSM) and Meso-Scale Model
Analysis of Radar Rainfall Estimation Accuracy using Hybrid Surface Rainfall (HSR) Technique
 Technique") Analysis of Radar Rainfall Estimation Accuracy using Hybrid Surface Rainfall (HSR) Technique Hye-Sook Park 1, Min-Ho Lee 1, Mi-Kyung Suk 1, Jae-Won Lee 1 1 Korea Meteorological Administration, Weather
Analysis of Radar Rainfall Estimation Accuracy using Hybrid Surface Rainfall (HSR) Technique Hye-Sook Park 1, Min-Ho Lee 1, Mi-Kyung Suk 1, Jae-Won Lee 1 1 Korea Meteorological Administration, Weather
The Development of Guidance for Forecast of. Maximum Precipitation Amount
 The Development of Guidance for Forecast of Maximum Precipitation Amount Satoshi Ebihara Numerical Prediction Division, JMA 1. Introduction Since 198, the Japan Meteorological Agency (JMA) has developed
1. Introduction. 2. The data. P13.15 The effect of a wet radome on dualpol data quality
 P3.5 The effect of a wet radome on dualpol data quality Michael Frech Deutscher Wetterdienst Hohenpeissenberg Meteorological Observatory, Germany. Introduction Operational radar systems typically are equipped
Improvement of quantitative precipitation estimates in Belgium
 Improvement of quantitative precipitation estimates in Belgium L. Delobbe, E. Goudenhoofdt, and B. Mohymont Royal Meteorological Institute of Belgium 1. Introduction In this paper we describe the recent
REQUIREMENTS FOR WEATHER RADAR DATA. Review of the current and likely future hydrological requirements for Weather Radar data
 WORLD METEOROLOGICAL ORGANIZATION COMMISSION FOR BASIC SYSTEMS OPEN PROGRAMME AREA GROUP ON INTEGRATED OBSERVING SYSTEMS WORKSHOP ON RADAR DATA EXCHANGE EXETER, UK, 24-26 APRIL 2013 CBS/OPAG-IOS/WxR_EXCHANGE/2.3
Meteorology 311. RADAR Fall 2016
 Meteorology 311 RADAR Fall 2016 What is it? RADAR RAdio Detection And Ranging Transmits electromagnetic pulses toward target. Tranmission rate is around 100 s pulses per second (318-1304 Hz). Short silent
P5.4 WSR-88D REFLECTIVITY QUALITY CONTROL USING HORIZONTAL AND VERTICAL REFLECTIVITY STRUCTURE
 P5.4 WSR-88D REFLECTIVITY QUALITY CONTROL USING HORIZONTAL AND VERTICAL REFLECTIVITY STRUCTURE Jian Zhang 1, Shunxin Wang 1, and Beth Clarke 1 1 Cooperative Institute for Mesoscale Meteorological Studies,
Final Report. COMET Partner's Project. University of Texas at San Antonio
 Final Report COMET Partner's Project University: Name of University Researcher Preparing Report: University of Texas at San Antonio Dr. Hongjie Xie National Weather Service Office: Name of National Weather
Development of Radar Composite Map in Typhoon Region
 Typhoon Committee Technical Conference (TC50 TECO) on "Embracing new technologies and knowledge to meet the challenges in the new era of tropical cyclone forecasting" In conjunction with the 50th Session
P4.10. Kenichi Kusunoki 1 * and Wataru Mashiko 1 1. Meteorological Research Institute, Japan
 P4. DOPPLER RADAR INVESTIGATIONS OF THE INNER CORE OF TYPHOON SONGDA (24) Polygonal / elliptical eyewalls, eye contraction, and small-scale spiral bands. Kenichi Kusunoki * and Wataru Mashiko Meteorological
Introduction. Suita. Kobe. Okinawa. Tsukuba. Tokyo? in in in in 2017 See Poster #16 2. in 2015
 1 Introduction We developed the X band Phased Array Weather Radar (PAWR) to watch and predict severe weather disasters caused by localized heavy rainfalls or tornadoes. The PAWR measures 3 dimentional
Progress in Operational Quantitative Precipitation Estimation in the Czech Republic
 Progress in Operational Quantitative Precipitation Estimation in the Czech Republic Petr Novák 1 and Hana Kyznarová 1 1 Czech Hydrometeorological Institute,Na Sabatce 17, 143 06 Praha, Czech Republic (Dated:
NOTES AND CORRESPONDENCE. Relationship between Orographic Enhancement of Rainfall Rate and Movement Speed of Radar Echoes: Case Study of Typhoon 0709
 Journal of the Meteorological Society of Japan, Vol. 88, No. 6, pp. 931--936, 2010. 931 DOI:10.2151/jmsj.2010-605 NOTES AND CORRESPONDENCE Relationship between Orographic Enhancement of Rainfall Rate and
Data Short description Parameters to be used for analysis SYNOP. Surface observations by ships, oil rigs and moored buoys
 3.2 Observational Data 3.2.1 Data used in the analysis Data Short description Parameters to be used for analysis SYNOP Surface observations at fixed stations over land P,, T, Rh SHIP BUOY TEMP PILOT Aircraft
Japanese Programs on Space and Water Applications
 Japanese Programs on Space and Water Applications Tamotsu IGARASHI Remote Sensing Technology Center of Japan June 2006 COPUOS 2006 Vienna International Centre Water-related hazards/disasters may occur
Automated Meteorological Data Acquisition System (AMeDAS) in Japan and field experiments to determine the effects of its observation environment
 in Japan and field experiments to determine the effects of its observation environment") Automated Meteorological Data Acquisition System (AMeDAS) in Japan and field experiments to determine the effects of its observation environment Hideyuki Yato 1, Yukihiro Nomura 1, Kenshi Umehara 2, Akiko
Automated Meteorological Data Acquisition System (AMeDAS) in Japan and field experiments to determine the effects of its observation environment Hideyuki Yato 1, Yukihiro Nomura 1, Kenshi Umehara 2, Akiko
Hazard assessment based on radar-based rainfall nowcasts at European scale The HAREN project
 Hazard assessment based on radar-based rainfall nowcasts at European scale The HAREN project Marc Berenguer, Daniel Sempere-Torres 3 OPERA radar mosaic OPERA radar mosaic: 213919 133 Precipitation observations
Convective Structures in Clear-Air Echoes seen by a Weather Radar
 Convective Structures in Clear-Air Echoes seen by a Weather Radar Martin Hagen Deutsches Zentrum für Luft- und Raumfahrt Oberpfaffenhofen, Germany Weather Radar Weather radar are normally used to locate
The Montague Doppler Radar, An Overview
 ISSUE PAPER SERIES The Montague Doppler Radar, An Overview June 2018 NEW YORK STATE TUG HILL COMMISSION DULLES STATE OFFICE BUILDING 317 WASHINGTON STREET WATERTOWN, NY 13601 (315) 785-2380 WWW.TUGHILL.ORG
Remote Sensing in Meteorology: Satellites and Radar. AT 351 Lab 10 April 2, Remote Sensing
 Remote Sensing in Meteorology: Satellites and Radar AT 351 Lab 10 April 2, 2008 Remote Sensing Remote sensing is gathering information about something without being in physical contact with it typically
COUNTRY REPORT. Jakarta. July, th National Directorate of Meteorology and Geophysics of Timor-Leste (DNMG)
") The Southeastern Asia-Oceania Flash Flood COUNTRY REPORT Jakarta. July, 10-12 th 2017 National Directorate of Meteorology and Geophysics of Timor-Leste (DNMG) Carla Feritas and Crisostimo Lobato Democratic
The Southeastern Asia-Oceania Flash Flood COUNTRY REPORT Jakarta. July, 10-12 th 2017 National Directorate of Meteorology and Geophysics of Timor-Leste (DNMG) Carla Feritas and Crisostimo Lobato Democratic
ERAD Challenges for precipitation estimation in mountainous regions. Proceedings of ERAD (2002): c Copernicus GmbH 2002
: c Copernicus GmbH 2002") Proceedings of ERAD (2002): 250 254 c Copernicus GmbH 2002 ERAD 2002 Challenges for precipitation estimation in mountainous regions U. Gjertsen and J. I. Dahl Norwegian Meteorological Institute, Research
Proceedings of ERAD (2002): 250 254 c Copernicus GmbH 2002 ERAD 2002 Challenges for precipitation estimation in mountainous regions U. Gjertsen and J. I. Dahl Norwegian Meteorological Institute, Research
EVALUATION OF SATELLITE-DERIVED HIGH RESOLUTION RAINFALL ESTIMATES OVER EASTERN SÃO PAULO AND PARANÁ,, BRAZIL
 EVALUATION OF SATELLITE-DERIVED HIGH RESOLUTION RAINFALL ESTIMATES OVER EASTERN SÃO PAULO AND PARANÁ,, BRAZIL Augusto J. Pereira Filho 1 Phillip Arkin 2 Joe Turk 3 John E. Janowiak 4 Cesar Beneti 5 Leonardo
Long term analysis of convective storm tracks based on C-band radar reflectivity measurements
 Long term analysis of convective storm tracks based on C-band radar reflectivity measurements Edouard Goudenhoofdt, Maarten Reyniers and Laurent Delobbe Royal Meteorological Institute of Belgium, 1180
Ecography. Supplementary material
 Ecography ECOG-04028 Dokter, A. M., Desmet, P., Spaaks, J. H., van Hoey, S., Veen, L., Verlinden, L., Nilsson, C., Haase, G., Leijnse, H., Farnsworth, A., Bouten, W. and Shamoun-Baranes, J. 2019. biorad:
Probabilistic Quantitative Precipitation Forecasts for Tropical Cyclone Rainfall
 Probabilistic Quantitative Precipitation Forecasts for Tropical Cyclone Rainfall WOO WANG CHUN HONG KONG OBSERVATORY IWTCLP-III, JEJU 10, DEC 2014 Scales of Atmospheric Systems Advection-Based Nowcasting
Instituto de Pesquisas Meteorológicas - IPMet Universidade Estadual Paulista - Unesp
 IPMET WEB GIS APPLICATION FOR SEVERE WEATHER ALERT AND DECISION SUPPORT Jaqueline Murakami Kokitsu Instituto de Pesquisas Meteorológicas - IPMet Universidade Estadual Paulista - Unesp IPMet/Unesp Meteorological
Global and Regional OSEs at JMA
 Global and Regional OSEs at JMA Yoshiaki SATO and colleagues Japan Meteorological Agency / Numerical Prediction Division 1 JMA NWP SYSTEM Global OSEs Contents AMSU A over coast, MHS over land, (related
The Radar Quality Control and Quantitative Precipitation Estimation Intercomparison Project. RQQI (pronounced Rickey)
") The Radar Quality Control and Quantitative Precipitation Estimation Intercomparison Project RQQI (pronounced Rickey) Paul Joe and Alan Seed Environment Canada Centre for Australian Weather and Climate
The Radar Quality Control and Quantitative Precipitation Estimation Intercomparison Project RQQI (pronounced Rickey) Paul Joe and Alan Seed Environment Canada Centre for Australian Weather and Climate
Real time Quality Control of Phased Array Weather Radar Data Observed Every 30 Seconds
 Real time Quality Control of Phased Array Weather Radar Data Observed Every 30 Seconds Shinsuke Satoh, Fusako Isoda, Tetsuya Sano, Hiroshi Hanado (NICT), Tomoo Ushio (Tokyo Metropolitan Univ.), Shigenori
REPORTS OF CHAIRS. Report of the Chair ET-ORS. (Submitted by Li Bai on Behalf of CIMO Expert Team on Operational Remote-Sensing)
") WORLD METEOROLOGICAL ORGANIZATION CBS/ET-SBRSO-2 & CIMO/ET-ORS- 1/Doc.2.2 JOINT MEETING OF (14.Xl.2011) CBS EXPERT TEAM ON SURFACE-BASED REMOTELY- SENSED OBSERVATIONS (Second Session) AND ITEM : 2.2 CIMO
WORLD METEOROLOGICAL ORGANIZATION CBS/ET-SBRSO-2 & CIMO/ET-ORS- 1/Doc.2.2 JOINT MEETING OF (14.Xl.2011) CBS EXPERT TEAM ON SURFACE-BASED REMOTELY- SENSED OBSERVATIONS (Second Session) AND ITEM : 2.2 CIMO
Non-negative K DP Estimation by Monotone Increasing Φ DP Assumption below Melting Layer
 on-negative K DP Estimation by Monotone Increasing Φ DP Assumption below Melting Layer Takeshi Maesaka 1, Koyuru Iwanami 1 and Masayuki Maki 1 1 ational Research Institute for Earth Science and Disaster
*Corresponding author address: Charles Barrere, Weather Decision Technologies, 1818 W Lindsey St, Norman, OK
 P13R.11 Hydrometeorological Decision Support System for the Lower Colorado River Authority *Charles A. Barrere, Jr. 1, Michael D. Eilts 1, and Beth Clarke 2 1 Weather Decision Technologies, Inc. Norman,
On the use of radar rainfall estimates and nowcasts in an operational heavy rainfall warning service
 On the use of radar rainfall estimates and nowcasts in an operational heavy rainfall warning service Alan Seed, Ross Bunn, Aurora Bell Bureau of Meteorology Australia The Centre for Australian Weather
P4.11 SINGLE-DOPPLER RADAR WIND-FIELD RETRIEVAL EXPERIMENT ON A QUALIFIED VELOCITY-AZIMUTH PROCESSING TECHNIQUE
 P4.11 SINGLE-DOPPLER RADAR WIND-FIELD RETRIEVAL EXPERIMENT ON A QUALIFIED VELOCITY-AZIMUTH PROCESSING TECHNIQUE Yongmei Zhou and Roland Stull University of British Columbia, Vancouver, BC, Canada Robert
Orbit and Transmit Characteristics of the CloudSat Cloud Profiling Radar (CPR) JPL Document No. D-29695
 JPL Document No. D-29695") Orbit and Transmit Characteristics of the CloudSat Cloud Profiling Radar (CPR) JPL Document No. D-29695 Jet Propulsion Laboratory California Institute of Technology Pasadena, CA 91109 26 July 2004 Revised
Orbit and Transmit Characteristics of the CloudSat Cloud Profiling Radar (CPR) JPL Document No. D-29695 Jet Propulsion Laboratory California Institute of Technology Pasadena, CA 91109 26 July 2004 Revised
CONTENT 2. ORGANIZATION 3. SERVICES. instruments. (3)Activities of RIC Tsukuba
Activities of RIC Tsukuba") 1 CONTENT 1. INTRODUCTION 2. ORGANIZATION 3. SERVICES (1)Quality assurance of meteorological instruments (2)Research and development (3)Activities of RIC Tsukuba 2 Meteorological Instruments Center (MIC)
1 CONTENT 1. INTRODUCTION 2. ORGANIZATION 3. SERVICES (1)Quality assurance of meteorological instruments (2)Research and development (3)Activities of RIC Tsukuba 2 Meteorological Instruments Center (MIC)
Analyzing the impact of wind turbines on operational weather radar products
 Analyzing the impact of wind turbines on operational weather radar products Günther Haase 1, Daniel Johnson 1 and Kjell-Åke Eriksson 2 1 Swedish Meteorological and Hydrological Institute, S-60176 Norrköping,
Weather Radar and A3 Introduction
 Weather Radar and A3 Introduction The term RADAR is an acronym formed from the term Radio Detection and Ranging. Nikola Tesla (of electric car fame) suggested in 1900 that moving targets should be observable
Improvements in the Upper-Air Observation Systems in Japan
 Improvements in the Upper-Air Observation Systems in Japan Masahito Ishihara, Masanori Chiba, Yasushi Izumikawa, Nobuyuki Kinoshita, and Naoki Tsukamoto Japan Meteorological Agency, 1-3-4 Otemachi, Chiyoda-ku,
Climate & Earth System Science. Introduction to Meteorology & Climate. Chapter 05 SOME OBSERVING INSTRUMENTS. Instrument Enclosure.
 Climate & Earth System Science Introduction to Meteorology & Climate MAPH 10050 Peter Lynch Peter Lynch Meteorology & Climate Centre School of Mathematical Sciences University College Dublin Meteorology
AN OBSERVING SYSTEM EXPERIMENT OF MTSAT RAPID SCAN AMV USING JMA MESO-SCALE OPERATIONAL NWP SYSTEM
 AN OBSERVING SYSTEM EXPERIMENT OF MTSAT RAPID SCAN AMV USING JMA MESO-SCALE OPERATIONAL NWP SYSTEM Koji Yamashita Japan Meteorological Agency / Numerical Prediction Division 1-3-4, Otemachi, Chiyoda-ku,
Dual-pol Radar Measurements of Hurricane Irma and Comparison of Radar QPE to Rain Gauge Data
 Dual-pol Radar Measurements of Hurricane Irma and Comparison of Radar QPE to Rain Gauge Data Qing Cao and Michael Knight Enterprise Electronic Corporation (EEC) Enterprise, Alabama, USA Email: qingcao@eecweathertech.com
Development of Spaceborne Dualfrequency. and Its Role for the Global Precipitation Measurement
 Development of Spaceborne Dualfrequency Precipitation Radar and Its Role for the Global Precipitation Measurement Shinsuke Satoh (1), Riko Oki (1), Nobuhiro Takahashi (2), and Toshio Iguchi (2) (1) National
APPENDIX 2 OVERVIEW OF THE GLOBAL PRECIPITATION MEASUREMENT (GPM) AND THE TROPICAL RAINFALL MEASURING MISSION (TRMM) 2-1
 AND THE TROPICAL RAINFALL MEASURING MISSION (TRMM) 2-1") APPENDIX 2 OVERVIEW OF THE GLOBAL PRECIPITATION MEASUREMENT (GPM) AND THE TROPICAL RAINFALL MEASURING MISSION (TRMM) 2-1 1. Introduction Precipitation is one of most important environmental parameters.
APPENDIX 2 OVERVIEW OF THE GLOBAL PRECIPITATION MEASUREMENT (GPM) AND THE TROPICAL RAINFALL MEASURING MISSION (TRMM) 2-1 1. Introduction Precipitation is one of most important environmental parameters.
Akira Ito & Staffs of seasonal forecast sector
 Exercise : Producing site-specific guidance using domestic data Akira Ito & Staffs of seasonal forecast sector Climate Prediction Division Japan Meteorological Agency TCC Training Seminar on One-month
Development of JMA storm surge model
 2 nd JCOMM Scientific and Technical Symposium on Storm Surges 8-13 November 2015, Key West, Florida, USA Development of JMA storm surge model Hiroshi HASEGAWA (h_hasegawa@met.kishou.go.jp) Office of Marine
Polarimetric Weather Radar by Selex ES Turn-key solutions and recent developments
 Polarimetric Weather Radar by Selex ES Turn-key solutions and recent developments R. Hannesen Radar workshop 2015 19+20 November 2015 Monash University, Melbourne ORGANISATION Company profile Recent technical
PAGASA s Expectations of New-generation Satellites for Hazard Monitoring
 Country Report Philippines PAGASA s Expectations of New-generation Satellites for Hazard Monitoring VICENTE P. PALCON, JR. (Assistant Weather Services Chief) Weather Division- PAGASA DOST Email: vppalconjr@pagasa.dost.gov.ph
687 Observation of winter lightning in the Shonai area railroad weather project: preliminary results
 687 Observation of winter lightning in the Shonai area railroad weather project: preliminary results Masahide Nishihashi 1*, Kenichi Shimose 1, Kenichi Kusunoki 2, Syugo Hayashi 2, Kotaro Bessho 3, Shnsuke
Objectives of CPEA Project
 Observation System for Equatorial Convective Activities at Koto Tabang, Sumatra Coupling Processes in the Equatorial Atmosphere: CPEA T. Kozu*1, T. Shimomai*1, Y. Fujiyoshi*3, Y. Shibagaki*4, H. Hashiguchi*5,
The Hydrologic Cycle: How Do River Forecast Centers Measure the Parts?
 The Hydrologic Cycle: How Do River Forecast Centers Measure the Parts? Greg Story Meteorologist National Weather Service Fort Worth, TX Overview n Introduction What is the mission of an RFC? n The Hydrologic
SUMMARY REPORT Technical meeting on a regional weather radar network for Southeast Asia
 SUMMARY REPORT Technical meeting on a regional weather radar network for Southeast Asia (Tokyo, Japan, 22 26 October 2018) The technical meeting on a regional weather radar network for Southeast Asia was
Mode-S EHS data usage in the meteorological domain:
 Mode-S EHS data usage in the meteorological domain: derivation of Wind and Temperature observations; and assimilation of these observations in a numerical weather prediction model. Jan Sondij, MBA Senior
A new mesoscale NWP system for Australia
 A new mesoscale NWP system for Australia www.cawcr.gov.au Peter Steinle on behalf of : Earth System Modelling (ESM) and Weather&Environmental Prediction (WEP) Research Programs, CAWCR Data Assimilation
Errors in surface rainfall rates retrieved from radar due to wind-drift
 ATMOSPHERIC SCIENCE LETTERS Atmos. Sci. Let. 6: 71 77 (2) Published online in Wiley InterScience (www.interscience.wiley.com). DOI:.2/asl.96 Errors in surface rainfall rates retrieved from radar due to
Observation Based Products Technical Report No. 13
 Observation Based Products Technical Report No. 13 Improving precipitation estimates from weather radar using quality control and correction techniques by D L Harrison, S J Driscoll & M Kitchen October
Radars, Hydrology and Uncertainty
 Radars, Hydrology and Uncertainty Francesca Cecinati University of Bristol, Department of Civil Engineering francesca.cecinati@bristol.ac.uk Supervisor: Miguel A. Rico-Ramirez Research objectives Study
(Preliminary) Observations of Tropical Storm Fay Dustin W Phillips Kevin Knupp, & Tim Coleman. 34th Conference on Radar Meteorology October 8, 2009
 Observations of Tropical Storm Fay Dustin W Phillips Kevin Knupp, & Tim Coleman. 34th Conference on Radar Meteorology October 8, 2009") (Preliminary) Observations of Tropical Storm Fay Dustin W Phillips Kevin Knupp, & Tim Coleman 34th Conference on Radar Meteorology October 8, 2009 Outline I. Research Equipment MIPS, MAX, KJAX (WSR-88D)
(Preliminary) Observations of Tropical Storm Fay Dustin W Phillips Kevin Knupp, & Tim Coleman 34th Conference on Radar Meteorology October 8, 2009 Outline I. Research Equipment MIPS, MAX, KJAX (WSR-88D)
an experiment to assess the hydrological value of a portable X-band radar
 ERAD 12 - THE SEVENTH EUROPEAN CONFERENCE ON RADAR IN METEOROLOGY AND HYDROLOGY RAINSCANNER@Barcelona: an experiment to assess the hydrological value of a portable X-band radar Marc Berenguer1, Shinju
Strategic Radar Enhancement Project (SREP) Forecast Demonstration Project (FDP) The future is here and now
 Forecast Demonstration Project (FDP) The future is here and now") Strategic Radar Enhancement Project (SREP) Forecast Demonstration Project (FDP) The future is here and now Michael Berechree National Manager Aviation Weather Services Australian Bureau of Meteorology
Strategic Radar Enhancement Project (SREP) Forecast Demonstration Project (FDP) The future is here and now Michael Berechree National Manager Aviation Weather Services Australian Bureau of Meteorology
Aviation Hazards: Thunderstorms and Deep Convection
 Aviation Hazards: Thunderstorms and Deep Convection TREND Diagnosis of thunderstorm hazards using imagery Contents Satellite imagery Visible, infrared, water vapour Basic cloud identification Identifying
Real time mitigation of ground clutter
 Real time mitigation of ground clutter John C. Hubbert, Mike Dixon and Scott Ellis National Center for Atmospheric Research, Boulder CO 1. Introduction The identification and mitigation of anomalous propagation
ADL110B ADL120 ADL130 ADL140 How to use radar and strike images. Version
 ADL110B ADL120 ADL130 ADL140 How to use radar and strike images Version 1.00 22.08.2016 How to use radar and strike images 1 / 12 Revision 1.00-22.08.2016 WARNING: Like any information of the ADL in flight
Solar Radiophysics with HF Radar
 Solar Radiophysics with HF Radar Workshop on Solar Radiophysics With the Frequency Agile Solar Radiotelescope (FASR) 23-25 May 2002 Green Bank, WV Paul Rodriguez Information Technology Division Naval Research
National Report on Weather Forecasting Service
 MINISTRY OF WATER RESOURCES AND METEOROLOGY DEPARTMENT OF METEOROLOGY, CAMBODIA National Report on Weather Forecasting Service Tokyo, 11-15 March 2014 Department of Meteorology, Cambodia Presentation Outline
Vaisala Weather Radar.
 Vaisala Weather Radar. You will see more. Your next weather radar. We chose the new Vaisala radar as we believe it s the best on the market. The new Vaisala radars and software tools are warmly welcomed
Tonga Country Report
 Tonga Country Report Tonga Meteorological Services Ph. (676)35355 email: metstaff@met.gov.to Joint Meeting of RA II WIGOS Project and RA V TT-SU Jakarta, Indonesia / 11 October 2018 BMKG Headquarter Outline
Swedish Meteorological and Hydrological Institute
 Swedish Meteorological and Hydrological Institute Norrköping, Sweden 1. Summary of highlights HIRLAM at SMHI is run on a CRAY T3E with 272 PEs at the National Supercomputer Centre (NSC) organised together
QPE and QPF in the Bureau of Meteorology
 QPE and QPF in the Bureau of Meteorology Current and future real-time rainfall products Carlos Velasco (BoM) Alan Seed (BoM) and Luigi Renzullo (CSIRO) OzEWEX 2016, 14-15 December 2016, Canberra Why do
Measuring In-cloud Turbulence: The NEXRAD Turbulence Detection Algorithm
 Measuring In-cloud Turbulence: The NEXRAD Turbulence Detection Algorithm John K. Williams,, Greg Meymaris,, Jason Craig, Gary Blackburn, Wiebke Deierling,, and Frank McDonough AMS 15 th Conference on Aviation,
Quality Assurance and Quality Control
 Quality Assurance and Quality Control of Surface Observations in JMA Japan Meteorological Agency Hakaru MIZUNO "Guide to Meteorological Instruments and Methods of Observation", WMO-No.8, 7th ed., 2008.
Benefits of the new-generation Himawari-8 geostationary satellite for the Asia-Pacific region. Toshihiko HASHIDA Japan Meteorological Agency (JMA)
") Benefits of the new-generation Himawari-8 geostationary satellite for the Asia-Pacific region Toshihiko HASHIDA Japan Meteorological Agency (JMA) Side Event Ensuring User Readiness to New-Generation Meteorological
Benefits of the new-generation Himawari-8 geostationary satellite for the Asia-Pacific region Toshihiko HASHIDA Japan Meteorological Agency (JMA) Side Event Ensuring User Readiness to New-Generation Meteorological
TWO CASES OF HEAVY RAIN ON THE MEDITERRANEAN SIDE OF THE ALPS IN MAP. Robert Houze 1 and Socorro Medina University of Washington
 1.1 TWO CASES OF HEAVY RAIN ON THE MEDITERRANEAN SIDE OF THE ALPS IN MAP Robert Houze 1 and Socorro Medina University of Washington Matthias Steiner Princeton University 1. INTRODUCTION The Mesoscale Alpine
Radar precipitation measurement in the Alps big improvements triggered by MAP
 Radar precipitation measurement in the Alps big improvements triggered by MAP Urs Germann, Gianmario Galli, Marco Boscacci MeteoSwiss, Locarno-Monti MeteoSwiss radar Monte Lema, 1625m Can we measure precipitation
P4.2 TOWARDS THE ASSIMILATION OF RADAR REFLECTIVITIES: IMPROVING THE OBSERVATION OPERATOR BY APPLYING BEAM BLOCKAGE INFORMATION
 P4.2 TOWARDS THE ASSIMILATION OF RADAR REFLECTIVITIES: IMPROVING THE OBSERVATION OPERATOR BY APPLYING BEAM BLOCKAGE INFORMATION Günther Haase (1), Joan Bech (2), Eric Wattrelot (3), Uta Gjertsen (4) and
CLIMATE CHANGE ADAPTATION BY MEANS OF PUBLIC PRIVATE PARTNERSHIP TO ESTABLISH EARLY WARNING SYSTEM
 CLIMATE CHANGE ADAPTATION BY MEANS OF PUBLIC PRIVATE PARTNERSHIP TO ESTABLISH EARLY WARNING SYSTEM By: Dr Mamadou Lamine BAH, National Director Direction Nationale de la Meteorologie (DNM), Guinea President,
ERAD Wind-field observations with the operational Doppler radar network in Germany. Proceedings of ERAD (2002): c Copernicus GmbH 2002
: c Copernicus GmbH 2002") Proceedings of ERAD (2002): 195 199 c Copernicus GmbH 2002 ERAD 2002 Wind-field observations with the operational Doppler radar network in Germany M. Hagen 1, K. Friedrich 1, and J. Seltmann 2 1 Institut
Proceedings of ERAD (2002): 195 199 c Copernicus GmbH 2002 ERAD 2002 Wind-field observations with the operational Doppler radar network in Germany M. Hagen 1, K. Friedrich 1, and J. Seltmann 2 1 Institut
Quality assurance for sensors at the Deutscher Wetterdienst (DWD)
") Quality assurance for sensors at the Deutscher Wetterdienst (DWD) Quality assurance / maintenance / calibration Holger Dörschel, Dr Tilman Holfelder WMO International Conference on Automatic Weather Stations
Quality assurance for sensors at the Deutscher Wetterdienst (DWD) Quality assurance / maintenance / calibration Holger Dörschel, Dr Tilman Holfelder WMO International Conference on Automatic Weather Stations
Weather radar rainfall for hydrological hazard risk management
 Weather radar rainfall for hydrological hazard risk management Dawei Han 韩大卫 Department of Civil Engineering University of Bristol, UK Hydrological hazards related to rainfall Floods Droughts Debris flows
WORLD METEOROLOGICAL ORGANIZATION THE WMO TABLE DRIVEN CODES: THE 21 ST CENTURY UNIVERSAL OBSERVATION CODES
 WORLD METEOROLOGICAL ORGANIZATION THE WMO TABLE DRIVEN CODES: THE 21 ST CENTURY UNIVERSAL OBSERVATION CODES 1 THE WMO TABLE DRIVEN CODES: THE 21 ST CODES CENTURY UNIVERSAL OBSERVATION ABSTRACT The table