no. 6/2010 Climate Long-term climate trends of Finnmarksvidda, Northern-Norway
|
|
|
- Branden Morrison
- 6 years ago
- Views:
Transcription

1 no. 6/2010 Climate Long-term climate trends of Finnmarksvidda, Northern-Norway Dagrun Vikhamar-Schuler, Inger Hanssen-Bauer and Eirik Førland
 Dagrun Vikhamar-Schuler, Inger Hanssen-Bauer and Eirik Førland Norwegian Meteorological Institute Classication 3 Free Restricted ISSN e-issn Client(s) The IPY project EALAT-RESEARCH")
2 report Title Date Long-term climate trends of Finnmarksvidda, Northern-Norway. March 26, 2010 Section Report no. Climate no. 6/2010 Author(s) Dagrun Vikhamar-Schuler, Inger Hanssen-Bauer and Eirik Førland Norwegian Meteorological Institute Classication 3 Free Restricted ISSN e-issn Client(s) The IPY project EALAT-RESEARCH ( Reindeer Herders Vulnerability Network Study: Reindeer pastoralism in a changing climate and the NorClim project. The projects are funded by The Research Council of Norway and The Nordic Council of Ministers (EALAT). Client's reference Grant no /S30 Abstract In this study long-term trends of temperature, precipitation and snow at ve stations on Finnmarksvidda (Kautokeino, Karasjok, Sihccajavri, Cuovddatmohkki and Suolovuopmi) and two coastal stations (Tromsø and Nordreisa) were examined. Several climate parameters were chosen for analysis: annual and seasonal temperature, annual and seasonal precipitation sum, maximum snow depth, snow season duration, rain-on-snow events, black frost days and cold periods. Comparison of the meteorological stations shows considerable climatic dierence between the continental stations and the coastal stations. For the individual stations there are considerably more dierences in decadal variability for precipitation than for temperature, and even more for snow. Keywords Snow, temperature, precipitation, Finnmark, Northern Norway Disciplinary signature Responsible signature Inger Hanssen-Bauer Eirik J. Førland Postal address P.O Box 43 Blindern N-0313 OSLO Norway Oce Niels Henrik Abels vei 40 Telephone Telefax met.inst@met.no Internet: met.no Bank account Swift code DNBANOKK
3 Contents 1 Introduction 4 2 Dataset and analysis Meteorological stations at Finnmarksvidda Time-series analysis Mean temperature Annual precipitation sum Maximum snow depth Snow season duration Rain-on-snow events Black frost days Cold season and degree days Growing season and degree days Results and discussion Meteorological stations Tromsø Nordreisa Suolovuopmi Kautokeino Sihccajavri Karasjok Cuovddatmohkki Comparison of the climate at the meteorological stations Annual and seasonal temperature Annual and seasonal precipitation Snow depth and snow season Cold season and degree days Growing season and degree days Summary and conclusions 39 Acknowledgements 40 References 41 3
4 1 Introduction This report has been written as part of the IPY project EALAT ( Work Package 1: Identification of local climate conditions important for reindeer herding and development of basic climate scenarios. The main goal of the entire EALAT project is to assess the vulnerability of reindeer herding in Finnmark and Yamal (Russia) to effects of climate change. This report contributes to reach the main goal by describing the historical climate in Finnmark the last 100 years, from the coast to the inland areas. We present historical climate data from Finnmarksvidda (five selected meteorological stations) and from two coastal meteorological stations. Long-term trends of temperature, precipitation and snow are studied. Additionally, some meteorological parameters (indices) have been computed that are sensitive to the reindeers access to food through the snow (the sami word guohtun ). The climate conditions affect the reindeer herding in many ways, but we have chosen to limit our study to indices affecting the food access through the snow. Examples of such indices are rain-on-snow events followed by freezing temperatures possibly creating hard ice layers. Ice layers are negative for the reindeer since they prevent the animals to reach the food below the snow. On the other hand, loose snow structures (depth hoar crystals) increase the accessibility of food below the snow pack. Depth hoar forms preferentially in cold, continental type climate. Therefore, we also examined a cold period indice based on degree days for temperatures below -15 C. 2 Dataset and analysis This section gives an overview of the meteorological dataset used in the analysis in this report. Furthermore, it contains a description of how the various climate parameters were computed. 2.1 Meteorological stations at Finnmarksvidda In this report we have analysed data from seven weather stations (Figure 1). These stations are spatially distributed over the Finnmarksvidda study area (continental climate), except for the Tromsø and Nordreisa stations which are located close to the coast (marine climate). Meta data for each station is given in Tables 1 and 2. The observation period for each station varies widely. It is also important to notice that although observations have been carried out, not all data are available in digital formats. Some of the data are only available in analogue archives. There are a few gaps in the time-series, specifically during the period of the second world war ( ). Inhomogeneities of the measurement series may be caused by relocation of the meteorological stations or by environmental changes (e.g. new houses, trees). Four of the stations (Nordreisa, Kautokeino, Karasjok and Suolovuopmi) have been moved during the observation period (see Table 1). In this analysis we have merged these series. No corrections for possible homogeneity errors have been made (Nordli, 1997). Temperature data from Karasjok have previously been studied and found to be of high quality (pers. comm. Øyvind Nordli, met.no). The Kautokeino station, however, has been moved from the valley bottom to the valley side, and the winter temperature is probably higher than at the former location (see the graph of the Kautokeino winter temperature after 1970 in Figure 12). This is in accordance with the estimated climatology for the two localities, as the difference between the mean monthly temperatures at these stations is 0.2 C or less in the period May through November, while the former site systematically is 0.2 to 0.5 C colder for December and January through April (Aune, 1993). Inhomogeneity studies of temperature, snow or precipitation from the Suolovuopmi and Nordreisa stations have not yet been carried out. An overview of the mean monthly temperature and precipitation for the normal period for all stations are presented in the Figure 2. The average summer temperatures are rather similar at all stations ( C in July), while in winter, the inland stations are typically about 10 C colder than the coastal station Tromsø. Also for precipitation, the maximum differences between inland and coast are found during winter. In July, all stations show average precipitation sums between 60 and 80 mm. At the inland station, this represents the annual maximum, while minimum precipitation is measured in winter 4
.")

5 and early spring. Along the coast, on the other hand, the precipitation is typically increasing from the summer values to a maximum in the autumn, while the minimum is found during spring. On an annual basis, and especially during winter, inland Finnmark is of the coldest and also driest areas in the Nordic countries (Tveito et al., 1997, 2000). As indices for snow conditions, we have studied the observations of snow depth and snow cover. Snow depth is measured as the total depth of both the old and new snow on the ground. Snow cover is the areal extent of snow-covered ground. The snow cover observation is a subjective measure (see Table 3.) Figure 1: Location of the seven selected meteorological stations located at Finnmarksvidda and on the coast. Figure 2: Mean monthly temperature and precipitation for the normal period
6 Station number Station name Elevation Observation (met.no) m a.s.l. period Tromsø Nordreisa Nordreisa Øyang Suolovuopmi Suolovuopmi-Lulit Kautokeino Kautokeino II Sihccajavri Karasjok Karasjok-Markannjarga Cuovddatmohkki Table 1: Meta data for the meteorological stations. Station number Station name Precipitation Temperature Snow Tromsø Nordreisa Nordreisa Øyang Suolovuopmi Suolovuopmi-Lulit Kautokeino Kautokeino II Sihccajavri Karasjok Karasjok-Markannjarga Cuovddatmohkki Table 2: Periods when data are available in digital format, specied for each station. 6
7 Snow cover code Description 0 No snow 1 Minor parts of the ground covered with snow 2 Equal areas with and without snow 3 Major parts of the ground covered with snow 4 Ground fully covered by snow Table 3: Snow cover codes observed at the met.no precipitation stations. 2.2 Time-series analysis In this Section we describe how the different climate parameters were computed. Trends in the dataset are studied by applying a 10 year gauss filter and linear trend analysis. Results from the analysis are presented in Chapter Mean temperature The mean annual temperature is computed from the mean monthly temperatures of a calendar year. Decadal-scale variability is illustrated in the figures by computing the deviation from the mean temperature during the normal period ( ) (example in Figures 2). Seasonal mean temperature has also been computed according to standard season definitions. Autumn consists of the months September, October and November. Winter consists of the months December, January and February, spring consists of the months March, April and May, while summer consists of the months June, July and August Annual precipitation sum The annual precipitation sum is the sum of monthly precipitation during a calendar year. Decadal-scale variability is studied by computing the deviation from the mean annual precipitation sum during the normal period ( ) (example in Figure 2). To examine seasonal variations, this parameter has also been computed for autumn, winter, spring and summer Maximum snow depth Maximum snow depth (cm) was computed for every winter season from daily snow observations. A winter season is defined to follow the hydrological year (from 1 September to 31 August) Snow season duration We here define the snow season duration as the period during a hydrological year with permanent snow cover. For this purpose we first had to compute the start and the end of this season (Dyrrdal and Vikhamar- Schuler, 2009). The snow season start is here defined as the first day in autumn with 10 consecutive days with snow cover code equal to 4 (see Table 3). The end of the snow season is defined as the first day in spring after the last period of 5 consecutive days with snow cover code equal or greater than 2. Furthermore, the snow season duration was computed as the number of days between the first and the last day. These days constitute the period of the hydrological year with permanent snow cover, and thereby excludes short periods with snow fall followed by melt episodes Rain-on-snow events Rain-on-snow events are typically mild weather events leading to rain falling on an existing snow cover. The consequences of such an event is often extensive snow melt and densification of the snow pack. If the event is followed by a period with very cold weather, strong ice layers can be created in the snow 7
8 pack. Such ice layers are known to act as a barrier to ungulate grazing, and in severe cases may lead to starvation for reindeer. In our analysis we define a rain-on-snow event as a day when the precipitation falls as rain (more than one mm) on a snow-covered ground (more than five cm snow depth). If the air temperature is above 1 C the precipitation is assumed to fall as rain Black frost days Black frost days are cold snow-free days, i.e. periods with snow-free ground and air temperatures below zero degrees. We have counted the number of black frost days for each hydrological year (1 September-31 August). Periods with black frost during autumn is favourable to avoid generation of ice layers between the snow cover and the ground. If the weather is mild and the ground is wet before the first snow fall, ice layers may form. The risk is highest if the mild weather period is followed by cold weather situations (freezing temperatures) Cold season and degree days We have studied degree days as a measure of how cold it has been and how long it has been cold. We have counted the number of days with temperatures below -15 C for each hydrological year (1 September-31 August). Additionally, we have computed the cumulated degree days. This is the sum of average daily degrees for days with temperatures below -15. We computed degree days for hydrological years and not for calendar years. To avoid misinterpretation of trends introduced by missing data, we excluded years with more than 15 days with missing data. Loose snow structures (depth hoar crystals) are favourable for accessing the food below the snow pack. Depth hoar crystals form preferentially in cold, continental type climate. The higher the temperature gradient between the snow surface and the ground surface is, the more efficient the formation of depth hoar crystals is. This gradient depends on the snow surface temperature, the ground surface temperature and the snow depth. Hence, long periods with cold weather favours the generation of depth hoar crystals, and are therefore favourable for the reindeers access to food through the snow Growing season and degree days Growing degree days are a measurement of the growth and development of plants during the growing season. Development does not occur at this time unless the temperature is above a minimum threshold value (base temperature). The base temperature varies for different organisms, but is often set to +5. Growing degree days is not of importance for reindeer winter pastures, but is included to show some historical climatic aspects of the summer pastures. We have counted the number of days with temperatures abowe +5 C for each calendar year (1 January-31 December). Additionally, we have computed the cumulated growing degree days. This is the sum of average daily degrees for days with temperatures abowe +5 C. 8
9 3 Results and discussion This Section contains figures of the climate parameters computed for the stations Tromsø, Nordreisa, Suolovuopmi, Kautokeino, Sihccajavri, Karasjok and Cuovddatmohkki. The climate parameters are: 1. Mean temperature (annual and seasonal values) 2. Mean precipitation sum (annual and seasonal values) 3. Maximum snow depth (annual) 4. Snow season duration (including first and last day of snow season) 5. Rain-on-snow events 6. Black frost (Cold, snow-free periods) 7. Cold season and degree days 8. Growing season and degree days 3.1 Meteorological stations Tromsø Results for Tromsø meteorological station are shown in Figures 3-5. This station is located close to the coast and therefore represents marine climate conditions Nordreisa Results for Nordreisa meteorological station are shown in Figures 6-8. This station is located close to the coast and therefore represents marine climate conditions Suolovuopmi Results for Suolovuopmi meteorological station are shown in Figures Kautokeino Results for Kautokeino meteorological station are shown in Figures Sihccajavri Results for Sihccajavri meteorological station are shown in Figures Karasjok Results for Karasjok meteorological station are shown in Figures Cuovddatmohkki Results for Cuovddatmohkki meteorological station are shown in Figures
10 Figure 3: Tromsø meteorological station: Temperature and precipitation. 10
11 Figure 4: Tromsø meteorological station: Snow. 11

12 Figure 5: Tromsø meteorological station. 12
13 Figure 6: Nordreisa meteorological station: Temperature and precipitation. 13
14 Figure 7: Nordreisa meteorological station: Snow. 14
15 Figure 8: Nordreisa meteorological station. 15
16 Figure 9: Nordreisa meteorological station: Temperature and precipitation. 16
17 Figure 10: Nordreisa meteorological station: Snow. 17
18 Figure 11: Nordreisa meteorological station. 18
19 Figure 12: Kautokeino meteorological station: Temperature and precipitation. 19
20 Figure 13: Kautokeino meteorological station: Snow. 20
21 Figure 14: Kautokeino meteorological station. 21
22 Figure 15: Sihccajavri meteorological station: Temperature and precipitation. 22
23 Figure 16: Sihccajavri meteorological station: Snow. 23

24 Figure 17: Sihccajavri meteorological station. 24
25 Figure 18: Karasjok meteorological station: Temperature and precipitation. 25
26 Figure 19: Karasjok meteorological station: Snow. 26

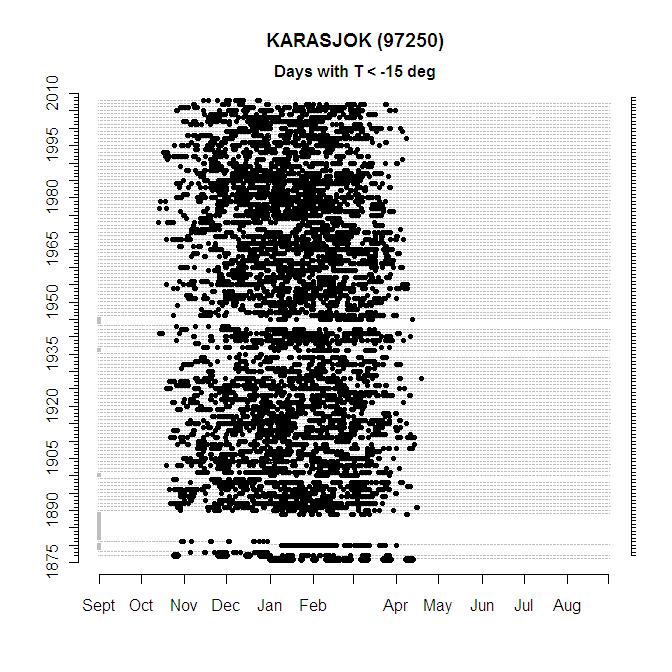
27 Figure 20: Karasjok meteorological station. 27
28 Figure 21: Cuovddatmohkki meteorological station: Temperature and precipitation. 28
29 Figure 22: Cuovddatmohkki meteorological station: Snow. 29
30 Figure 23: Cuovddatmohkki meteorological station. 30
31 3.2 Comparison of the climate at the meteorological stations Annual and seasonal temperature As few of the present series are 100 years long, long-term linear trends have not been listed here. According to Hanssen-Bauer (2005), however, Tromsø and Nordreisa are situated in a region ( temperature region 4 ) where there is a statistically significant linear trend in annual mean temperature of about 1 C per 100 years. The other stations belong to another region ( temperature region 5 ) where the linear trend is only half of this, and not statistically significant. A typical feature in both these regions is, however, that the decadal scale variability is large compared to the long-term trends. The large decadal scale variability is clearly illustrated by Figure 24. Both annual and seasonal temperatures show similar variability on the decadal scale for the three meteorological stations: Karasjok, Kautokeino and Sihccajavri. Considerably higher temperatures are measures at the Tromsø and Nordreisa stations (limited observation period) in all seasons except summer, due to their coastal location. Cuovddatmohkki and Suolovuopmi are missing long series of temperature data. The trends for the mean annual temperature can be divided in the same four periods as described in Førland et al. (2000), Hanssen-Bauer (2005) and Hanssen-Bauer et al. (2009): 1. A cold period with small trends during the early 20th century. 2. A culminating warm period in the 1930s often referred to as the early 20th century warming. 3. A period with cooling from the 1930s to the 1960s. 4. A recent warming from the 1960s to present. For Finnmarksvidda this is shiftet to the 1980 s. The mean autumn, winter and summer temperatures generally show the same trends during these four periods as the mean annual temperature. However, the mean spring temperature shows overall positive trends for all four periods. These increasing spring temperatures have been observed several places in Norway and Svalbard (pers. comm. Øyvind Nordli). Overall, the temperature curves of both coastal and continental stations are highly correlated (Table 4). Tromsø Nordreisa Kautokeino Karasjok Sihccajavri Tromsø 1 Nordreisa Kautokeino Karasjok Sihccajavri Table 4: Correlation matrix of mean annual temperature in Tromsø, Nordreisa, Kautokeino, Karasjok and Sihccajavri. Hanssen-Bauer and Førland (2000) indicate that a considerable part of the decadal scale temperature variability from about 1940 to 1995 may be explained by variation in atmospheric circulation. 31
32 Figure 24: Temperature: Comparison of all stations. 10 year Gauss lter. 32
33 3.2.2 Annual and seasonal precipitation Overall, the annual precipitation curves show increasing precipitation for all meteorological stations since approx (Cuovddatmohkki has a limited precipitation serie) (Figure 25). This is in accordance with Hanssen-Bauer (2005), who concludes that precipitation regions 11 (including Tromsø and Nordreisa) and 12 (including innland areas in Finnmark) experienced highly significant linear trends in annual precipitation during the 20th century (almost 20% increase in 100 years). Superimposen on the longterm trends, there is considerable decadal variability. Periods with low annual precipitation have occurred around 1915, and Seasonal precipitation is also shown in the Figure 25. It is illustrated that the summer precipitation has increased since approx Some interesting differences are observed for coastal stations (maritime climate) and inland stations (continental climate). The coastal stations Tromsø and Nordreisa receive significantly more precipitation, annually, and for all seasons except summer, than the five continental stations Sihccajavri, Suolovuopmi, Kautokeino, Karasjok and Cuovddatmohkki. Since approx both coastal stations received increasing precipitation during the winter season. For this region there are considerably more differences in decadal variability between the individual stations for precipitation than for temperature (see Table 5 for correlation coefficients). This is expected since precipitation often varies more locally than temperature. Hanssen-Bauer and Førland (2000) indicate that a considerable part of the decadal scale precipitation variability may be explained by variation in atmospheric circulation. Tromsø Nordreisa Kautokeino Sihccajavri Suolovuopmi Karasjok Tromsø 1 Nordreisa Kautokeino Sihccajavri Suolovuopmi Karasjok Table 5: Correlation matrix of annual precipitation sum in Tromsø, Nordreisa, Kautokeino, Karasjok Suolovuopmi and Sihccajavri. 33
34 Figure 25: Precipitation: Comparison of all stations. 10 year Gauss lter. 34
35 3.2.3 Snow depth and snow season Based on data from the two longest series of measurements from Suolovuopmi and Nordreisa, the trends in snow season duration can be divided in three main periods (Figure 26): 1. Decreasing snow season duration from 1900 to 1940 s. The start of the snow season was shifted almost one month later. Note that this was mainly a period with marked increase in autumn temperatures, which may explain the reduction in snow season. 2. Increasing snow season duration from 1950 s until the Note that both negative temperature trends in autumn and generally positive precipitation trends may have contributed to this. 3. Variable snow season duration from about There was a maximum around 1995 and reduction thereafter. Precipitation mainly increased in this period, however autumn temperatures remained relatively low until around 1995, thereafter they have increased. For maximum snow depth (Figure 26) there are considerable differences between the Suolovuopmi, Nordreisa and Karasjok stations during the first part of the 20th century. From 1960 s until the annual maximum snow depth increased, with a following decrease during the most recent decade. Overall, the correlation coefficients are higher between the different stations for snow season duration than for snow depth. Generally, there are some uncertainties connected to snow depth measurements carried out for long time series. Finnmarksvidda is an area with rough climate, mostly located above the tree line. Stations may be exposed to strong winds that distributes the snow unevenly around the station. Topography and buildings affect the wind speed and wind direction and thereby the snow distribution. Snowdrift creates snow dunes and snow free areas. The snow depth will be affected by the snowdrift around the station. These factors makes the snow depth measurements more uncertain than e.g. the temperature measurements. Therefore the correlation of snow observations of the different stations are expected to be lower than the correlation of temperature observations. Tromsø Nordreisa Suolovuopmi Kautokeino Karasjok Sihccajavri Tromsø 1 Nordreisa Suolovuopmi Kautokeino Karasjok Sihccajavri Table 6: Correlation matrix of snow season duration in Tromsø, Nordreisa, Kautokeino, Karasjok, Suolovuopmi and Sihccajavri. Tromsø Nordreisa Kautokeino Sihccajavri Suolovuopmi Karasjok Tromsø 1 Nordreisa Kautokeino Sihccajavri Suolovuopmi Karasjok Table 7: Correlation matrix of maximum annual snow depth in Tromsø, Nordreisa, Kautokeino, Karasjok, Suolovuopmi and Sihccajavri. 35
36 Figure 26: Snow season and maximum snow depth: Comparison of all stations. 10 year Gauss lter. 36
37 3.2.4 Cold season and degree days In contrast to the coastal stations Tromsø and Nordreisa, the five meteorological stations located at Finnmarksvidda (Suolovuopmi, Kautokeino, Sihccajavri, Karasjok, Cuovddatmohkki) have a considerable number of days with daily mean temperatures below -15 (Figure 27). Long periods with cold weather favours the generation of depth hoar crystals in the snow pack (loose snow structure), and is therefore favourable for the reindeers access to food through the snow. Changes in the length of these cold periods affect the snow pack and thereby the reindeers food access. To better understand these processes, more studies are needed on changes in snow pack properties with air temperatures and effects on the reindeers food access. Figure 27 shows that there is no clear positive or negative trend in degree days or cold season over the last 100 years. However, the graphs reveal that since 1970 both the shortest and the longest cold periods have occurred during the last 100 years: : Longest cold period. around 1990: Shortest cold period. Figure 27: Cold season and degree days: Comparison of all stations. 10 year Gauss lter. Nordreisa Kautokeino Sihccajavri Suolovuopmi Karasjok Nordreisa 1 Kautokeino Sihccajavri Suolovuopmi Karasjok Table 8: Correlation matrix of cold season (number of days) in Nordreisa, Kautokeino, Karasjok, Suolovuopmi and Sihccajavri. 37
38 Nordreisa Kautokeino Sihccajavri Suolovuopmi Karasjok Nordreisa 1 Kautokeino Sihccajavri Suolovuopmi Karasjok Table 9: Correlation matrix of degree days in Nordreisa, Kautokeino, Karasjok, Suolovuopmi and Sihccajavri Growing season and degree days Since 1965 the growing season is gradually prolonged in the Finnmark area (see the Karasjok and Tromsø series in the Figure 28). A prolongued growing season increases the plant production during summer, and therefore is positive for the summer pastures of the reindeer. Figure 28: Growing season and degree days: Comparison of all stations. 10 year Gauss lter. 38
39 4 Summary and conclusions This report presents long-term climate trends from five meteorological stations at Finnmarksvidda (Kautokeino, Karasjok, Sihccajavri, Cuovddatmohkki and Suolovuopmi) in addition to two coastal stations (Tromsø and Nordreisa). Long-term trends on air temperature, precipitation, snow season, cold season and growing season are described. Temperature The three continental stations (Karasjok, Kautokeino and Sihccajavri) show similar trends for annual and seasonal temperatures (summer, autumn and winter). These trends have previously been described in Førland et al. (2000), Hanssen-Bauer (2005) and Hanssen-Bauer et al. (2009): 1. A cold period with small trends during the early 20th century. 2. A culminating warm period in the 1930s often referred to as the early 20th century warming. 3. A period with cooling from the 1930s to the 1960s. 4. A recent warming from the 1960s to present (1980 s for Finnmarksvidda). Hanssen-Bauer and Førland (2000) indicate that a considerable part of the decadal scale temperature variability from about 1940 to 1995 may be explained by variation in atmospheric circulation. An interesting phenomena is also the positive trends for the spring temperatures over the last 100 years. Precipitation The annual precipitation curves show some overall positive trends for all six meteorological stations since approx For the individual stations there is considerably more differences in decadal variability for precipitation than for temperature, and even more for snow. Hanssen-Bauer and Førland (2000) indicate that a considerable part of the decadal scale precipitation variability may be explained by variation in atmospheric circulation. Snow Data from the two longest series (Suolovuopmi and Nordreisa) show that the trends in snow season duration can be divided in three main periods: 1. Decreasing snow season duration from 1900 to 1940 s. The start of the snow season was shifted almost one month later. Note that this was mainly a period with marked increase in autumn temperatures, which may explain the reduction in snow season. 2. Increasing snow season duration from 1950 s until the Note that both negative temperature trends in autumn and generally positive precipitation trends may have contributed to this. 3. Variable snow season duration from about There was a maximum around 1995 and reduction thereafter. Precipitation mainly increased in this period, however autumn temperatures remained relatively low until around 1995, thereafter they have increased. Uncertainties are connected to long-term snow depth measurements. The measurements will be affected by the snowdrift, topography and buildings around the station. These factors make the snow depth measurements more uncertain than e.g. the temperature measurements. Therefore the correlation of snow observations between the different stations are lower than the correlation of temperature observations. 39
40 Cold season There is no clear positive or negative trend in the length of the cold season (number of days with temperatures below -15 ) over the last 100 years. However, the graphs reveal that since 1970 both the shortest and the longest cold periods have occurred during the last 100 years: : Longest cold periods. around 1990: Shortest cold period. Growing season Since 1965 the growing season is gradually prolonged in the Finnmark area. This increases the plant production and is therefore positive for the reindeer s summer pasture. Acknowledgements This work is supported finanicially by The Research Council of Norway, project IPY (International Polar Year) EALAT-RESEARCH: Reindeer Herders Vulnerability Network Study: Reindeer pastoralism in a changing climate (grant number /S30) and by The Nordic Council of Ministers. The EALAT project is coordinated by The Sami University College, 9520 Kautokeino and The International Centre for Reindeer Husbandry 9520 Kautokeino. Parts of this work has also been funded by The Research Council of Norway s project NorClim. We wish to thank Professor Svein Disch-Mathiesen at the Saami University College in Kautokeino and project coordinator of the EALAT project for many fruitful discussions concerning this work. 40
41 References Aune, B. (1993). Temperaturnormaler. Normalperiode (Norwegian and English text). met.no report no. 2, Meteorological Institute, Oslo, Norway. Dyrrdal, A. V. and Vikhamar-Schuler, D. (2009). Analysis of long-term snow series at selected stations in Norway. met.no report no. 5, Meteorological Institute, Oslo, Norway. Førland, E., Roald, L. A., Tveito, O. E., and Hanssen-Bauer, I. (2000). Past and future variations in climate and runoff in Norway. met.no report no. 19, Meteorological Institute, Oslo, Norway. Hanssen-Bauer, I. (2005). Regional temperature and precipitation series for Norway: Analyses of timeseries updated to met.no report no. 15, Meteorological Institute, Oslo, Norway. Hanssen-Bauer, I., Drange, H., Førland, E. J., Roald, L. A., Børsheim, K. Y., Hisdal, H., Lawrence, D., Nesje, A., Sandven, S., Sorteberg, A., Sundby, S., Vasskog, K., and Ådlandsvik, B. (2009). Klima i Norge Bakgrunnsmateriale til NOU Klimatilpassing., Norsk klimasenter, Oslo, Norway. Hanssen-Bauer, I. and Førland, E. J. (2000). Temperature and precipitation variations in Norway and their links to atmospheric circulation. International Journal of Climatology, 20(14): Nordli, O. (1997). Homogenity tests of Norwegian temperature series (In norwegian). met.no report no. 29, Meteorological Institute, Oslo, Norway. Tveito, O. E., Førland, E. J., Dahlström, B., Elomaa, E., Frich, P., Hanssen-Bauer, I., Jónsson, T., Madsen, H., Perälä, J., Rissanen, P., and Vedin, H. (1997). Nordic precipitation maps. met.no report no. 22, Meteorological Institute, Oslo, Norway. Tveito, O. E., Førland, E. J., Heino, R., Hanssen-Bauer, I., Alexandersson, H., Dahlström, B., Drebs, A., Kern-Hansen, C., Jónsson, T., Vaarby Laursen, E., and Westman, Y. (2000). Nordic temperature maps. met.no report no. 9, Meteorological Institute, Oslo, Norway. 41
Analysis of past snow conditions in Norway - Time periods , and
 no. 10/2010 Climate Analysis of past snow conditions in Norway - Time periods 1931-60, 1961-90 and 1979-2008 Anita Verpe Dyrrdal report Title Analysis of past snow conditions in Norway - Time periods
PHONE Growing degree-days Present conditions and scenario for the period
 met.no - REPORT NORWEGIAN METEOROLOGICAL INSTITUTE BOX 43 BLINDERN, N - 0313 OSLO, NORWAY ISSN 0805-9918 REPORT NO. 02/02 KLIMA PHONE +47 22 96 30 00 TITLE: DATE 05.07.2002 Growing degree-days Present
Annex I to Target Area Assessments
 Baltic Challenges and Chances for local and regional development generated by Climate Change Annex I to Target Area Assessments Climate Change Support Material (Climate Change Scenarios) SWEDEN September
Gridded observation data for Climate Services
 Gridded observation data for Climate Services Ole Einar Tveito, Inger Hanssen Bauer, Eirik J. Førland and Cristian Lussana Norwegian Meteorological Institute Norwegian annual temperatures Norwegian annual
Climate Dataset: Aitik Closure Project. November 28 th & 29 th, 2018
 1 Climate Dataset: Aitik Closure Project November 28 th & 29 th, 2018 Climate Dataset: Aitik Closure Project 2 Early in the Closure Project, consensus was reached to assemble a long-term daily climate
November 2018 Weather Summary West Central Research and Outreach Center Morris, MN
 November 2018 Weather Summary Lower than normal temperatures occurred for the second month. The mean temperature for November was 22.7 F, which is 7.2 F below the average of 29.9 F (1886-2017). This November
The importance of long-term Arctic weather station data for setting the research stage for climate change studies
 The importance of long-term Arctic weather station data for setting the research stage for climate change studies Taneil Uttal NOAA/Earth Systems Research Laboratory Boulder, Colorado Things to get out
Long-term trends in temperature, precipitation and snow conditions in Northern Russia
 no. 9/2010 Climate Long-term trends in temperature, precipitation and snow conditions in Northern Russia Pavel N. Svyashchennikov and Eirik J. Førland 25563 25551 24688 24382 24671 24959 21921 24143 24343
A summary of the weather year based on data from the Zumwalt weather station
 ZUMWALT PRAIRIE WEATHER 2016 A summary of the weather year based on data from the Zumwalt weather station Figure 1. An unusual summer storm on July 10, 2016 brought the second-largest precipitation day
Champaign-Urbana 2000 Annual Weather Summary
 Champaign-Urbana 2000 Annual Weather Summary ILLINOIS STATE WATER SURVEY 2204 Griffith Dr. Champaign, IL 61820 wxobsrvr@sws.uiuc.edu Maria Peters, Weather Observer January: January started on a mild note,
Great Lakes Update. Volume 188: 2012 Annual Summary
 Great Lakes Update Volume 188: 2012 Annual Summary Background The U.S. Army Corps of Engineers (USACE) tracks the water levels of each of the Great Lakes. This report highlights hydrologic conditions of
Colorado State University, Fort Collins, CO Weather Station Monthly Summary Report
 Colorado State University, Fort Collins, CO Weather Station Monthly Summary Report Month: December Year: 2017 Temperature: Mean T max was 47.2 F which is 4.4 above the 1981-2010 normal for the month. This
September 2018 Weather Summary West Central Research and Outreach Center Morris, MN
 September 2018 Weather Summary The mean temperature for September was 60.6 F, which is 1.5 F above the average of 59.1 F (1886-2017). The high temperature for the month was 94 F on September 16 th. The
APPENDIX 6.5-B Knight Piésold Kitsault Mine Climate Change Assessment Letter KITSAULT MINE PROJECT ENVIRONMENTAL ASSESSMENT APPENDICES
 ENVIRONMENTAL ASSESSMENT APPENDICES APPENDIX 6.5-B Knight Piésold Kitsault Mine Climate Change Assessment Letter VE51988 Appendices File No.:VA11-343/9-A.1 Cont. No.:VA11-175 Suite 14-75 West Pender Street
DROUGHT MONITORING BULLETIN
 DROUGHT MONITORING BULLETIN 24 th November 2014 Hot Spot Standardized Precipitation Index for time period from November 2013 to April 2014 was, due to the lack of precipitation for months, in major part
The weather in Iceland 2012
 The Icelandic Meteorological Office Climate summary 2012 published 9.1.2013 The weather in Iceland 2012 Climate summary Sunset in Reykjavík 24th April 2012 at 21:42. View towards west from the balcony
Changing Hydrology under a Changing Climate for a Coastal Plain Watershed
 Changing Hydrology under a Changing Climate for a Coastal Plain Watershed David Bosch USDA-ARS, Tifton, GA Jeff Arnold ARS Temple, TX and Peter Allen Baylor University, TX SEWRU Objectives 1. Project changes
Use of Ultrasonic Wind sensors in Norway
 Use of Ultrasonic Wind sensors in Norway Hildegunn D. Nygaard and Mareile Wolff Norwegian Meteorological Institute, Observation Department P.O. Box 43 Blindern, NO 0313 OSLO, Norway Phone: +47 22 96 30
Name of research institute or organization: Federal Office of Meteorology and Climatology MeteoSwiss
 Name of research institute or organization: Federal Office of Meteorology and Climatology MeteoSwiss Title of project: The weather in 2016 Report by: Stephan Bader, Climate Division MeteoSwiss English
Champaign-Urbana 2001 Annual Weather Summary
 Champaign-Urbana 2001 Annual Weather Summary ILLINOIS STATE WATER SURVEY 2204 Griffith Dr. Champaign, IL 61820 wxobsrvr@sws.uiuc.edu Maria Peters, Weather Observer January: After a cold and snowy December,
Name of research institute or organization: Federal Office of Meteorology and Climatology MeteoSwiss
 Name of research institute or organization: Federal Office of Meteorology and Climatology MeteoSwiss Title of project: The weather in 2017 Report by: Stephan Bader, Climate Division MeteoSwiss English
Application and verification of ECMWF products in Norway 2008
 Application and verification of ECMWF products in Norway 2008 The Norwegian Meteorological Institute 1. Summary of major highlights The ECMWF products are widely used by forecasters to make forecasts for
Colorado State University, Fort Collins, CO Weather Station Monthly Summary Report
 Colorado State University, Fort Collins, CO Weather Station Monthly Summary Report Month: December Year: 2016 Temperature: Mean T max was 39.7 F which is 3.1 below the 1981-2010 normal for the month. This
Average Weather For Coeur d'alene, Idaho, USA
 Average Weather For Coeur d'alene, Idaho, USA Information courtesy of weatherspark.com Location This report describes the typical weather at the Coeur d'alene Air Terminal (Coeur d'alene, Idaho, United
Chapter 3 Section 3 World Climate Regions In-Depth Resources: Unit 1
 Guided Reading A. Determining Cause and Effect Use the organizer below to show the two most important causes of climate. 1. 2. Climate B. Making Comparisons Use the chart below to compare the different
A simple station-based empirical model for local snow conditions
 no. 3/2009 Climate A simple station-based empirical model for local snow conditions Herman Farbrot and Inger Hanssen-Bauer 7 report Title A simple station-based empirical model for local snow conditions
LOCAL CLIMATOLOGICAL DATA FOR FREEPORT ILLINOIS
 Climatological Summary: LOCAL CLIMATOLOGICAL DATA FOR FREEPORT ILLINOIS 1905-1990 Freeport (Stephenson County) has a temperate continental climate, dominated by maritime tropical air from the Gulf of Mexico
Spatial interpolation of sunshine duration in Slovenia
 Meteorol. Appl. 13, 375 384 (2006) Spatial interpolation of sunshine duration in Slovenia doi:10.1017/s1350482706002362 Mojca Dolinar Environmental Agency of the Republic of Slovenia, Meteorological Office,
Mozambique. General Climate. UNDP Climate Change Country Profiles. C. McSweeney 1, M. New 1,2 and G. Lizcano 1
 UNDP Climate Change Country Profiles Mozambique C. McSweeney 1, M. New 1,2 and G. Lizcano 1 1. School of Geography and Environment, University of Oxford. 2.Tyndall Centre for Climate Change Research http://country-profiles.geog.ox.ac.uk
The weather in Iceland 2014
 Icelandic Meteorological Office Climate summary 2014 published 22.3.2015 The weather in Iceland 2014 Climate summary Rainbow by Elliðaey - one of the Westman islands off the south coast - 14 July 2014.
Energy Systems, Structures and Processes Essential Standard: Analyze patterns of global climate change over time Learning Objective: Differentiate
 Energy Systems, Structures and Processes Essential Standard: Analyze patterns of global climate change over time Learning Objective: Differentiate between weather and climate Global Climate Focus Question
National Meteorological Library and Archive
 National Meteorological Library and Archive Fact sheet No. 4 Climate of the United Kingdom Causes of the weather in the United Kingdom The United Kingdom lies in the latitude of predominately westerly
Climate change in Croatia: observations and modeling
 Climate change in Croatia: observations and modeling Lidija Srnec Meteorological and Hydrological Service Zagreb, CROATIA Selected chapters: Observed climate changes in Croatia (Ksenija Cindrić, Marjana
J8.4 TRENDS OF U.S. SNOWFALL AND SNOW COVER IN A WARMING WORLD,
 J8.4 TRENDS OF U.S. SNOWFALL AND SNOW COVER IN A WARMING WORLD, 1948-2008 Richard R. Heim Jr. * NOAA National Climatic Data Center, Asheville, North Carolina 1. Introduction The Intergovernmental Panel
NIWA Outlook: October - December 2015
 October December 2015 Issued: 1 October 2015 Hold mouse over links and press ctrl + left click to jump to the information you require: Overview Regional predictions for the next three months: Northland,
Great Lakes Update. Volume 199: 2017 Annual Summary. Background
 Great Lakes Update Volume 199: 2017 Annual Summary Background The U.S. Army Corps of Engineers (USACE) tracks and forecasts the water levels of each of the Great Lakes. This report is primarily focused
Local Ctimatotogical Data Summary White Hall, Illinois
 SWS Miscellaneous Publication 98-5 STATE OF ILLINOIS DEPARTMENT OF ENERGY AND NATURAL RESOURCES Local Ctimatotogical Data Summary White Hall, Illinois 1901-1990 by Audrey A. Bryan and Wayne Armstrong Illinois
Changes in Frequency of Extreme Wind Events in the Arctic
 Changes in Frequency of Extreme Wind Events in the Arctic John E. Walsh Department of Atmospheric Sciences University of Illinois 105 S. Gregory Avenue Urbana, IL 61801 phone: (217) 333-7521 fax: (217)
Climate briefing. Wellington region, May Alex Pezza and Mike Thompson Environmental Science Department
 Climate briefing Wellington region, May 2016 Alex Pezza and Mike Thompson Environmental Science Department For more information, contact the Greater Wellington Regional Council: Wellington PO Box 11646
Natural Disasters and Storms in Philadelphia. What is a storm? When cold, dry air meets warm, moist (wet) air, there is a storm.
 air, there is a storm.") Natural Disasters and Storms in Philadelphia 1. What is a natural disaster? 2. Does Philadelphia have many natural disasters? o Nature (noun) everything in the world not made No. Philadelphia does not
Natural Disasters and Storms in Philadelphia 1. What is a natural disaster? 2. Does Philadelphia have many natural disasters? o Nature (noun) everything in the world not made No. Philadelphia does not
Weather Conditions during the 1992 Growing Season
 Weather Conditions during the 1992 Growing Season Item Type text; Article Authors Brown, P.; Russell, B. Publisher College of Agriculture, University of Arizona (Tucson, AZ) Journal Cotton: A College of
2015: A YEAR IN REVIEW F.S. ANSLOW
 2015: A YEAR IN REVIEW F.S. ANSLOW 1 INTRODUCTION Recently, three of the major centres for global climate monitoring determined with high confidence that 2015 was the warmest year on record, globally.
Chapter 1 Climate in 2016
 Chapter 1 Climate in 2016 1.1 Global climate summary Extremely high temperatures were frequently observed in many regions of the world, and in particular continued for most of the year in various places
Detection of temperature inhomogeneities using observations of snow and rain. Gregor Vertačnik
 Detection of temperature inhomogeneities using observations of snow and rain Gregor Vertačnik Zagreb, 19 November 17 Introduction Quality of climate data homogenisation depends on network density and metadata
Serial No. N4470 NAFO SCR Doc. 01/83 SCIENTIFIC COUNCIL MEETING SEPTEMBER 2001
 NOT TO BE CITED WITHOUT PRIOR REFERENCE TO THE AUTHOR(S) Northwest Atlantic Fisheries Organization Serial No. N7 NAFO SCR Doc. /8 SCIENTIFIC COUNCIL MEETING SEPTEMBER Sea-surface Temperature and Water
MODELLING FROST RISK IN APPLE TREE, IRAN. Mohammad Rahimi
 WMO Regional Seminar on strategic Capacity Development of National Meteorological and Hydrological Services in RA II (Opportunity and Challenges in 21th century) Tashkent, Uzbekistan, 3-4 December 2008
Probability distributions of monthly-to-annual mean temperature and precipitation in a changing climate
 Probability distributions of monthly-to-annual mean temperature and precipitation in a changing climate Jouni Räisänen Department of Physics, University of Helsinki Climate probability distribution of
THE SIGNIFICANCE OF AIR TEMPERATURE OSCILLATIONS IN THE LAST DECADE IN SPLIT - CROATIA
 Croatian Operational Research Review (CRORR), Vol., 11 THE SIGNIFICANCE OF AIR TEMPERATURE OSCILLATIONS IN THE LAST DECADE IN SPLIT - CROATIA Abstract Elza Jurun University of Split/Faculty of Economics
LAB J - WORLD CLIMATE ZONES
 Introduction LAB J - WORLD CLIMATE ZONES The objective of this lab is to familiarize the student with the various climates around the world and the climate controls that influence these climates. Students
Assessment of Snow Cover Vulnerability over the Qinghai-Tibetan Plateau
 ADVANCES IN CLIMATE CHANGE RESEARCH 2(2): 93 100, 2011 www.climatechange.cn DOI: 10.3724/SP.J.1248.2011.00093 ARTICLE Assessment of Snow Cover Vulnerability over the Qinghai-Tibetan Plateau Lijuan Ma 1,
Climatic Conditions Around Greenland 1995
 NAFO Sci. Coun. Studies, 27: 39 47 Climatic Conditions Around Greenland 1995 M. Stein Institut fur Seefischerei, Palmaille 9 D-22767 Hamburg, Federal Republic of Germany Abstract The annual review of variability
Local Climate Change Impacts for Central Illinois
 Local Climate Change Impacts for Central Illinois Molly Woloszyn Extension Climatologist Midwestern Regional Climate Center & Illinois-Indiana Sea Grant Urbana Sustainability Advisory Commission February
GeoExtreme. Geohazards, Climate Change and Extreme Weather Events
 GeoExtreme Geohazards, Climate Change and Extreme Weather Events Overview What is GeoExtreme? Involved processes What influences slide activity? Consequences for society? Ongoing work Conclusion What is
The Global Scope of Climate. The Global Scope of Climate. Keys to Climate. Chapter 8
 The Global Scope of Climate Chapter 8 The Global Scope of Climate In its most general sense, climate is the average weather of a region, but except where conditions change very little during the course
What is Climate? Understanding and predicting climatic changes are the basic goals of climatology.
 What is Climate? Understanding and predicting climatic changes are the basic goals of climatology. Climatology is the study of Earth s climate and the factors that affect past, present, and future climatic
Foralps 2nd conference. Assessment of Lombardy's climate in the last century: data analysis, methodologies and indices
 Alessia Marchetti, Angela Sulis Assessment of Lombardy's climate in the last century: data Contents The dataset The daily indices analysis Some preliminary monthly data indices analysis Some key points
Meteorology. Circle the letter that corresponds to the correct answer
 Chapter 3 Worksheet 1 Meteorology Name: Circle the letter that corresponds to the correct answer 1) If the maximum temperature for a particular day is 26 C and the minimum temperature is 14 C, the daily
Past and future climate development in Longyearbyen, Svalbard
 Past and future climate development in Longyearbyen, Svalbard Eirik J. Førland 1,2 and Ketil Isaksen 1 1). Norwegian Meteorological Institute 2). Norwegian Centre for Climate Services Svalbard Science
Will a warmer world change Queensland s rainfall?
 Will a warmer world change Queensland s rainfall? Nicholas P. Klingaman National Centre for Atmospheric Science-Climate Walker Institute for Climate System Research University of Reading The Walker-QCCCE
The Norwegian Centre for Climate Services - NCCS
 The Norwegian Centre for Climate Services - NCCS Extremes Products - Dissemination Eirik J. Førland, Norwegian Meteorological Institute, Oslo, Norway Impact assessment consultation workshop, Budapest,
Observed Climate Variability and Change: Evidence and Issues Related to Uncertainty
 Observed Climate Variability and Change: Evidence and Issues Related to Uncertainty David R. Easterling National Climatic Data Center Asheville, North Carolina Overview Some examples of observed climate
Use of a multilayer snow model to assess grazing conditions for reindeer
 214 Annals of Glaciology 54(62) 2013 doi:10.3189/2013aog62a306 Use of a multilayer snow model to assess grazing conditions for reindeer D. VIKHAMAR-SCHULER, 1 I. HANSSEN-BAUER, 1;2 T.V. SCHULER, 3 S.D.
Adjustment of dynamically downscaled temperature and precipitation data in Norway
 RegClim: Regional Climate Development Under Global Warming Adjustment of dynamically downscaled temperature and precipitation data in Norway Report 20/02 T. E. Skaugen, I. Hanssen-Bauer and E. J. Førland
Presentation of met.no s experience and expertise related to high resolution reanalysis
 Presentation of met.no s experience and expertise related to high resolution reanalysis Oyvind Saetra, Ole Einar Tveito, Harald Schyberg and Lars Anders Breivik Norwegian Meteorological Institute Daily
C Y P A D A P T. M. Petrakis C. Giannakopoulos G. Lemesios.
 Development of a national strategy for adaptation to climate change adverse impacts in Cyprus C Y P A D A P T National Observatory of Athens, Institute for Environmental Research and Sustainable Development
Advancements and validation of the global CryoClim snow cover extent product
 www.nr.no Advancements and validation of the global CryoClim snow cover extent product Rune Solberg1, Øystein Rudjord1, Arnt-Børre Salberg1 and Mari Anne Killie2 1) Norwegian Computing Center (NR), P.O.
Gridding of precipitation and air temperature observations in Belgium. Michel Journée Royal Meteorological Institute of Belgium (RMI)
") Gridding of precipitation and air temperature observations in Belgium Michel Journée Royal Meteorological Institute of Belgium (RMI) Gridding of meteorological data A variety of hydrologic, ecological,
Gridding of precipitation and air temperature observations in Belgium Michel Journée Royal Meteorological Institute of Belgium (RMI) Gridding of meteorological data A variety of hydrologic, ecological,
Global Climate Change and the Implications for Oklahoma. Gary McManus Associate State Climatologist Oklahoma Climatological Survey
 Global Climate Change and the Implications for Oklahoma Gary McManus Associate State Climatologist Oklahoma Climatological Survey OCS LEGISLATIVE MANDATES Conduct and report on studies of climate and weather
Weather & Climate of Virginia
 Weather & Climate of Virginia Robert E. Davis Professor of Climatology Dept. of Environmental Sciences University of Virginia Email: red3u@virginia.edu Rivanna Master Naturalists March 14, 2017 Arctic
Drought Monitoring in Mainland Portugal
 Drought Monitoring in Mainland Portugal 1. Accumulated precipitation since 1st October 2014 (Hydrological Year) The accumulated precipitation amount since 1 October 2014 until the end of April 2015 (Figure
Colorado State University, Fort Collins, CO Weather Station Monthly Summary Report
 Colorado State University, Fort Collins, CO Weather Station Monthly Summary Report Month: January Year: 2019 Temperature: Mean T max was 47.2 F which is 3.0 above the 1981-2010 normal for the month. This
UPPLEMENT A COMPARISON OF THE EARLY TWENTY-FIRST CENTURY DROUGHT IN THE UNITED STATES TO THE 1930S AND 1950S DROUGHT EPISODES
 UPPLEMENT A COMPARISON OF THE EARLY TWENTY-FIRST CENTURY DROUGHT IN THE UNITED STATES TO THE 1930S AND 1950S DROUGHT EPISODES Richard R. Heim Jr. This document is a supplement to A Comparison of the Early
Champaign-Urbana 1998 Annual Weather Summary
 Champaign-Urbana 1998 Annual Weather Summary ILLINOIS STATE WATER SURVEY Audrey Bryan, Weather Observer 2204 Griffith Dr. Champaign, IL 61820 wxobsrvr@sparc.sws.uiuc.edu The development of the El Nìno
Human Dimensions in the Arctic Tundra under Changing Climate Conditions
 Human Dimensions in the Arctic Tundra under Changing Climate Conditions Nancy. G. Maynard, Ph.D. NASA Goddard Space Flight Center Inger Marie Gaup Eira Sami University College Svein D. Mathiesen, Ph.D.
POSTER PRESENTATION: Comparison of manual precipitation observations with automatic observations in Oslo and Utsira
 POSTER PRESENTATION: Comparison of manual precipitation observations with automatic observations in Oslo and Utsira Utsira: An island at the western coast of Norway. Annual precipitation: 1165 mm Oslo
Great Lakes Update. Volume 191: 2014 January through June Summary. Vol. 191 Great Lakes Update August 2014
 Great Lakes Update Volume 191: 2014 January through June Summary The U.S. Army Corps of Engineers (USACE) monitors the water levels of each of the Great Lakes. This report provides a summary of the Great
No. 8/2018 ISSN Meteorology. METreport. StrålInn. Evaluation of Predicted Shortwave Radiation Åsmund Bakketun, Jørn Kristiansen
 METreport No. 8/2018 ISSN 2387-4201 Meteorology StrålInn Evaluation of Predicted Shortwave Radiation Åsmund Bakketun, Jørn Kristiansen METreport Title Date StrålInn August 27, 2018 Section Report no. Senter
Analysis of Relative Humidity in Iraq for the Period
 International Journal of Scientific and Research Publications, Volume 5, Issue 5, May 2015 1 Analysis of Relative Humidity in Iraq for the Period 1951-2010 Abdulwahab H. Alobaidi Department of Electronics,
Investigation IV: Seasonal Precipitation and Seasonal Surface Runoff in the US
 Investigation IV: Seasonal Precipitation and Seasonal Surface Runoff in the US Purpose Students will consider the seasonality of precipitation and surface runoff and think about how the time of year can
SEASONAL VARIABILITY AND PERSISTENCE IN TEMPERATURE SCENARIOS FOR ICELAND
 SEASONAL VARIABILITY AND PERSISTENCE IN TEMPERATURE SCENARIOS FOR ICELAND Haraldur Ólafsson 1,2 and Ólafur Rögnvaldsson 2,3 1 University of Iceland, Reykjavík, Iceland 2 Bergen School of Meteorology, Geophysical
Sierra Weather and Climate Update
 Sierra Weather and Climate Update 2014-15 Kelly Redmond Western Regional Climate Center Desert Research Institute Reno Nevada Yosemite Hydroclimate Workshop Yosemite Valley, 2015 October 8-9 Percent of
Great Lakes Update. Volume 194: 2015 Annual Summary
 Great Lakes Update Volume 194: 2015 Annual Summary Background The U.S. Army Corps of Engineers (USACE) tracks and forecasts the water levels of each of the Great Lakes. This report summarizes the hydrologic
Plan for operational nowcasting system implementation in Pulkovo airport (St. Petersburg, Russia)
") Plan for operational nowcasting system implementation in Pulkovo airport (St. Petersburg, Russia) Pulkovo airport (St. Petersburg, Russia) is one of the biggest airports in the Russian Federation (150
Plan for operational nowcasting system implementation in Pulkovo airport (St. Petersburg, Russia) Pulkovo airport (St. Petersburg, Russia) is one of the biggest airports in the Russian Federation (150
CLIMATE. UNIT TWO March 2019
 CLIMATE UNIT TWO March 2019 OUTCOME 9.2.1Demonstrate an understanding of the basic features of Canada s landscape and climate. identify and locate major climatic regions of Canada explain the characteristics
THE RISKS ASSOCIATED TO THE HOARFROST PHENOMENON IN THE WEST PLAIN
 THE RISKS ASSOCIATED TO THE HOARFROST PHENOMENON IN THE WEST PLAIN V.D.MIRCOV 1., Mioara ȘIȘU 2, Carmen MOISA 2, Antoanela COZMA 1 1 BUASMV King Michael I of Romania from Timisoara Calea Aradului Street,
Water balance studies in two catchments on Spitsbergen, Svalbard
 120 Northern Research Basins Water Balance (Proceedings of a workshop held at Victoria, Canada, March 2004). IAHS Publ. 290, 2004 Water balance studies in two catchments on Spitsbergen, Svalbard ÀNUND
Operational MRCC Tools Useful and Usable by the National Weather Service
 Operational MRCC Tools Useful and Usable by the National Weather Service Vegetation Impact Program (VIP): Frost / Freeze Project Beth Hall Accumulated Winter Season Severity Index (AWSSI) Steve Hilberg
Lab Activity: Climate Variables
 Name: Date: Period: Water and Climate The Physical Setting: Earth Science Lab Activity: Climate Variables INTRODUCTION:! The state of the atmosphere continually changes over time in response to the uneven
CLIMATE CHANGE IMPACTS ON ICE REGIME OF THE RIVERS IN MONGOLIA
 Ice in the Environment: Proceedings of the 16th IAHR International Symposium on Ice Dunedin, New Zealand, 2nd 6th December 2002 International Association of Hydraulic Engineering and Research CLIMATE CHANGE
Enabling Climate Information Services for Europe
 Enabling Climate Information Services for Europe Report DELIVERABLE 6.5 Report on past and future stream flow estimates coupled to dam flow evaluation and hydropower production potential Activity: Activity
2012 Growing Season. Niagara Report. Wayne Heinen
 2012 Growing Season Niagara Report Wayne Heinen Overview The 2012 growing season was a phenomenal one for grapes. Vines entered bud break in good shape following a mild winter. The spring of 2012 was similar
CLIMATOLOGICAL REPORT 2002
 Range Cattle Research and Education Center Research Report RC-2003-1 February 2003 CLIMATOLOGICAL REPORT 2002 Range Cattle Research and Education Center R. S. Kalmbacher Professor, IFAS, Range Cattle Research
An Update on Snowpack Projections for Alaska: Chugach Results. Jeremy Littell, USGS Alaska Climate Science Center
 An Update on Snowpack Projections for Alaska: Chugach Results Jeremy Littell, USGS Alaska Climate Science Center Why snow? That depends. Photo: F. Kovalcheck. h0p://www.fs.usda.gov/detail/chugach/about-
National Meteorological Library and Archive
 National Meteorological Library and Archive Fact sheet No. 4 Climate of the United Kingdom Causes of the weather in the United Kingdom The United Kingdom lies in the latitude of predominately westerly
Weather and Climate Summary and Forecast November 2017 Report
 Weather and Climate Summary and Forecast November 2017 Report Gregory V. Jones Linfield College November 7, 2017 Summary: October was relatively cool and wet north, while warm and very dry south. Dry conditions
Which Earth latitude receives the greatest intensity of insolation when Earth is at the position shown in the diagram? A) 0 B) 23 N C) 55 N D) 90 N
 0 B) 23 N C) 55 N D) 90 N") 1. In which list are the forms of electromagnetic energy arranged in order from longest to shortest wavelengths? A) gamma rays, x-rays, ultraviolet rays, visible light B) radio waves, infrared rays, visible
1. In which list are the forms of electromagnetic energy arranged in order from longest to shortest wavelengths? A) gamma rays, x-rays, ultraviolet rays, visible light B) radio waves, infrared rays, visible
Malawi. General Climate. UNDP Climate Change Country Profiles. C. McSweeney 1, M. New 1,2 and G. Lizcano 1
 UNDP Climate Change Country Profiles Malawi C. McSweeney 1, M. New 1,2 and G. Lizcano 1 1. School of Geography and Environment, University of Oxford. 2. Tyndall Centre for Climate Change Research http://country-profiles.geog.ox.ac.uk
Supplementary figures
 Supplementary material Supplementary figures Figure 1: Observed vs. modelled precipitation for Umeå during the period 1860 1950 http://www.demographic-research.org 1 Åström et al.: Impact of weather variability
ANALYSIS OF CLIMATIC DATA FOR THE CHATEAU, MT RUAPHEHU ( ), IN RELATION TO CLIMATIC CHANGE
, IN RELATION TO CLIMATIC CHANGE") Weather and Climate (1991) 11: 15-26 15 ANALYSIS OF CLIMATIC DATA FOR THE CHATEAU, MT RUAPHEHU (1930-1988), IN RELATION TO CLIMATIC CHANGE Frances West and Terry Healy Department of Earth Sciences, University
Weather and Climate (1991) 11: 15-26 15 ANALYSIS OF CLIMATIC DATA FOR THE CHATEAU, MT RUAPHEHU (1930-1988), IN RELATION TO CLIMATIC CHANGE Frances West and Terry Healy Department of Earth Sciences, University
ARCTIC COASTAL CLIMATIC IMPACT ON DESIGN CONSTRUCTION AND OPERATION OF THE HAMMERFEST LNG PLANT
 ARCTIC COASTAL CLIMATIC IMPACT ON DESIGN CONSTRUCTION AND OPERATION OF THE HAMMERFEST LNG PLANT M. A. Drage 1 and Truls Mølmann 2 1 University of Bergen, Bergen, Norway 2 Barlindhaug Consult AS, Tromsø,