Atmosphere and climate change WP 6
|
|
|
- Simon Anthony
- 5 years ago
- Views:
Transcription
1 Atmosphere and climate change WP 6 T6.1. To study climate changes in the early instrumental period, NCU T6.2. To establish a homogenized West Spitsbergen (Hornsund and Isfjord Radio) air temperature time series 1934-present, met.no, NCU T6.3. To study the north-south air temperature gradient on the Western Svalbard, met.no T6.4. Study the recent temperature anomalies on western Spitsbergen and its relation to circulation (e.g. strong mild southerlies, frequency of lows, periods of sustained along-shelf winds etc), sea ice, sea temperatures and ocean heat transport, met.no T6.5. To recognize radiation and heat budget changes, NCU T6.6. To describe topoclimate data from different Hornsund regions based on historical sources and collected data, NCU
2 Rajmund Przybylak 1, Przemysław Wyszyński 1, Øyvind Nordli 2 & Tomasz Strzyżewski 1 1 Nicolaus Copernicus University, Toruń, Poland, 2 Norwegian Meteorological Institute, Oslo, Norway
3


4 AWAKE & AWAKE-2 data recovery projects Plenty of logbooks collected in NCU from the archives in Oslo, Tromsø and Stockholm Period Over 120 ships (e.g. yachts, schooners etc.), over 220 logbooks Meteorological data: atmospheric pressure, wind direction and force, air temperature, SST, weather phenomena and state of the sea Many descriptive records, e.g. ice conditions
5 AWAKE & AWAKE-2 data recovery projects Catalogue of the collected logbooks and other sources

6 ICOADS vs. NCU catalogue Deck Description Start End Rpts K 702 Norwegian Logbook Collection Diaz & Woodruff 1999


7 Marine component Two types of logbooks

8 Marine component Some statistics
 As at 22-11-2013")
9 Marine component Spatial coverage of data So far digitized: 23 yachts, 64 cruises, 9314 points (28.2% of collected material) As at
 Statistics of the collected data for the years 1871 1910 in the analysed area (monthly resolution); the square marks the selected time frame.")
10 (a) Statistics of the collected data for all logbooks in the analysed area; the square marks the selected time frame. (b) Statistics of the collected data for the years in the analysed area (monthly resolution); the square marks the selected time frame. (c) Mean daily positions (dots) of Norwegian ships in the waters surrounding Svalbard in the analysed period ( , May September). The research area lies between N and 6 30 E and was divided into grid boxes (black lines) with a resolution of 4 latitude and 12 longitude (SW, SE, NE and NW). International Journal of Climatology 28 OCT 2015 DOI: /joc

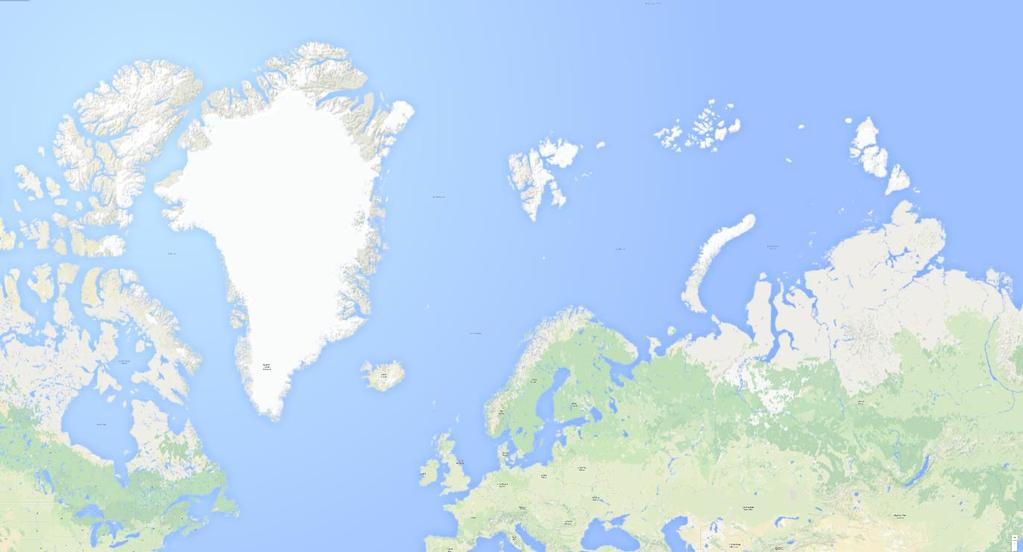
11 Mean ice extent (lines) and positions of ships (dots) in the Svalbard area during May to September To make the picture clearer, the ice edge extent in the particular months was shown only for the years for which the meteorological measurements were collected in this study. The same colour indicates ice edge and vessel positions for a given year. Source of data: historical ice edge extent according to ACSYS, 2003; present average sea ice extent was taken from the National Snow & Ice Data Center: ftp://sidads.colorado.edu/datasets/noaa/g02135/shapefiles/
12 Number of vessels (dashed bars) and marine air temperature series (white bars) in 10-year periods in the Svalbard area from 1871 to International Journal of Climatology 28 OCT 2015 DOI: /joc
13 Courses of air temperature ( C) based on daily means from ships (dots) in the historical period ( ) and daily means ( ) for land stations (solid lines) for the sub regions at Svalbard during each month from May to September. Thresholds of 90 and 10 percentiles (dotted lines) were calculated on the basis of daily means from the present period. Note that for the NE region, the 79 N and 24 E grid point of the ERA Interim reanalysis dataset was used, due to the lack of a meteorological station in this area. Every daily mean air temperature (T) available for a given month was adjusted to the time of the middle of that month (T adj ) according to the formula: T adj = T + a r (D m D) where: T adj adjusted air temperature for the D day, T mean air temperature of the particular day of the month, a r trend of daily mean air temperature D the date of mean daily air temperature available in the particular month, D m the mid date in the month being 16 for May, July and August (which have 31 days) and 15.5 for June and September (which have 30 days). International Journal of Climatology 28 OCT 2015 DOI: /joc
14 Adjustment factor, a r ( C/day), for each Svalbard sub-region (SW South-Western, SE South-Eastern, NW North-Western, NE North-Eastern) given for months from May to September. Month SW SE NW NE May June July August September


15 Land component Temporal distribution of the air temperature observations on Svalbard used in the study from 1865 to meteorological sites, 26 air temperature series Kapp Lee station For more details about metadata of the stations see: Nordli et al. 2014, Polar Research, 33, Przybylak & Dzierżawski 2004, Problemy Klimatologii Polarnej 14. Wyszyński & Przybylak 2014, Polar Research, 33 (in press)
. Ny-Ålesund Sveagruva Hornsund adjustment to different location Przybylak et al. 2014 International Journal of Climatology 14 FEB 2014 DOI: 10.1002/joc.")
16 Land component Comparison with present climatology ( ) Mean seasonal and annual air temperature ( C) at sea level in Svalbard (September 2010 to August 2011). Ny-Ålesund Sveagruva Hornsund adjustment to different location Przybylak et al International Journal of Climatology 14 FEB 2014 DOI: /joc.3937

17 Location of historical (dots) and modern (squares) land meteorological stations and campaign measurement sites in (Przybylak et al., 2014, triangles) on Svalbard. Shaded areas indicate split sub-regions; N, Northern; C, Central; E, Eastern; S, Southern. Differences in air temperature (Td) between historical and contemporary ( ) periods were calculated using the following formula: T d = T h (T m + c) where: T h monthly mean air temperature from a historical site, T m long-term monthly mean air temperature from the nearest modern station, c spatial correction for different locations of historical and modern measurements sites calculated based on spatial diversity of air temperature on Svalbard presented by Przybylak et al. (2014). The spatial correction c was calculated using the following formula: c = T h1 T m1 where: T h1 monthly mean air temperature in the location of historical site in the period of T m1 monthly mean air temperature in modern station in the period of The modern values of air temperature obtained in this way for historical sites were compared with those from the period International Journal of Climatology 28 OCT 2015 DOI: /joc
18 Temporal distribution of the air temperature observations from meteorological land stations (a), and ships (b), used in the study of the Svalbard archipelago and its surrounding seas from 1865 to Key to the lower panel: The black lines indicate data taken from the Arctic Norwegian Logbook Data: at CISL RDA ( dataset 539.1), and the blue lines indicate data from the Nicolaus Copernicus University database. Numbers describe names of ships: 1 Amanda, 2 Anna, 3 Bela, 4 Calibri, 5 Capella, 6 Diana, 7 Elida, 8 Elina, 9 Farm, 10 Foenix, 11 Fora den Blinde, 12 Freja, 13 Gjøa, 14 Gottfried, 15 Greenland, 16 Gurim, 17 Harald Haarfagre, 18 Hekla, 19 Hoidfisken, 20 Hvalfiskpynt, 21 Hvidfisken, 22 Isbjørnen, 23 Jasai, 24 Johan Hagerup, 25 Laura, 26 Magdalena, 27 Maria, 28 Minerva, 29 No name 1, 30 No name 2, 31 No name 8, 32 Nordland, 33 Ost Spitsbergen, 34 Polarstjernen, 35 Rivalen, 36 Roald, 37 Samson, 38 Tromsø, 39 Vega, 40 Victoria, 41 Viking, 42 Yjra. Note that for Fig. 1B. data only for May September in the period are shown. International Journal of Climatology 28 OCT 2015 DOI: /joc
19
20 Monthly and seasonal means of air temperature in Svalbard in the period and their differences between the historical and contemporary period ( ). Calculations are based on land stations. Italics indicate negative values. Region Northern Central Eastern Southern Svalbard Northern Central Eastern Southern Svalbard S O N D J F M A M J J A SON DJF MAM JJA SEP-AUG Air temperature means (ºC) -0,5-11,6-11,1-13,2-9,2-22,7-22,3-17,4-9,0 0,0 2,9 2,5-7,7-15,0-16,2 1,8-9,3 0,1-6,0-11,4-15,0-15,4-19,5-17,4-13,6-4,8 2,3 5,5 4,2-5,8-16,6-12,0 4,0-7,6-1,7-8,9-13,2-20,5-18,6-21,0-18,3-12,0-4,9 1,3 3,0 0,8-7,9-20,1-11,7 1,7-9,5 0,6-2,1-7,3-8,4-11,4-13,7-10,7-9,2-2,1 1,9 4,8 2,8-2,9-11,2-7,3 3,1-4,6-0,4-7,2-10,7-14,3-13,7-19,2-17,2-13,1-5,2 1,4 4,0 2,6-6,1-15,7-11,8 2,6-7,7 Differences of air temperature (ºC) 0,5-5,9-1,3 1,6 6,1-7,4-6,0-4,5-3,9 0,6 0,0-0,3-2,3 0,1-4,8 0,1-1,7-0,1-1,1-4,2-4,3-2,9-6,8-4,6-4,0-1,5 0,7 0,9 0,1-1,8-4,7-3,4 0,6-2,3-3,0-6,0-5,7-8,4-4,3-6,0-5,9-0,5-0,7 1,2-0,6-2,4-4,9-6,2-2,3-0,6-3,5-1,6-1,6-4,0-1,8-3,5-4,4-3,8-3,8-0,9 0,3 1,1-1,7-2,4-3,2-2,8-0,1-2,1-1,1-3,7-3,8-3,2-1,2-6,1-5,1-3,2-1,7 0,7 0,3-1,1-2,9-3,5-3,3 0,0-2,4 Key: Stations from the Northern, Central, Eastern and Southern regions were compared with the following modern stations: Ny-Ålesund, Svalbard Lufthavn, Sveagruva and Hornsund or Bjørnøya, respectively.
21 Annual courses of air temperature ( C): in historical times (thin solid lines); average 10- year means (thick solid line), and 1-year mean (dashed line) in sub-regions of Svalbard. Note that for the historical stations Akseløya , Svartangen and Sørkappøya , the annual courses were averaged based on a few 1-year long overwinterings; for more details, see Figure 2(a) or Table S1. International Journal of Climatology 28 OCT 2015 DOI: /joc
22 Air temperature differences ( C) between monthly values from the historical and present ( ) periods for selected sub regions in Svalbard. Standard deviations (±2 SD, shaded lines) have been calculated on the basis of the present period. Bars with anomalies for particular stations are placed chronologically in each month. Note that for the historical stations Akseløya , Svartangen and Sørkappøya , monthly differences were averaged based on a few 1 year long overwintering expeditions; for more details, see Figure 2(a) or Table S1. International Journal of Climatology 28 OCT 2015 DOI: /joc
23 Air temperature differences in various regions of the Arctic between the historical and standard normal period ( ). Italics indicate negative values. Region SON DJF MAM JJA Annu al Central Svalbard (this paper) SW Greenland (Vinther et al., 2006) Resolute region (Przybylak and Vízi, 2005) Atlantic Arctic (Przybylak et al., 2010) Whole Arctic (Przybylak et al., 2010)

24 Mean monthly air temperature ( C) based on land stations (dots) and marine expeditions (grid boxes) in Svalbard and its surrounding seas, from May to September in the entire analysed period of , and its sub periods and , as well as the differences between them. White patterned grid boxes indicate areas with a lack of data. International Journal of Climatology 28 OCT 2015 DOI: /joc

25 Mean monthly differences of air temperature ( C) between measurements taken from logbooks and the 20CR reanalysis (upper panel, for ) and the ERA 20C reanalysis (lower panel, for ) in the seas surrounding Svalbard. White patterned grid boxes indicate areas with a lack of data. Statistically significant differences at the p 0.05 level are shown by a grid label with squares. International Journal of Climatology 28 OCT 2015 DOI: /joc
, ERA 20C (middle panel) and 20CR (lower panel).")
26 Mean monthly differences of air temperature ( C) between historical ( ) and contemporary ( ) times. Dots indicate differences between historical land sites and present land stations. Grid boxes indicate differences between historical logbooks and present reanalysis: ERA Interim (upper panel), ERA 20C (middle panel) and 20CR (lower panel). White patterned grid boxes indicate areas with a lack of data. Statistically significant differences at the p 0.05 level are shown by a grid label with squares. International Journal of Climatology 28 OCT 2015 DOI: /joc
: reconstruction based on areally averaged data used in this study (black with squares) with a 95% confidence interval (dotted); Archangelsk (crosses); Vardø (stars); SW Greenland (Vinther")
27 Air temperature variability in the Svalbard area (74 82 N and 6 30 E) in the period May September , with comparison to other datasets (a) and present climatology (b). Panel (A): reconstruction based on areally averaged data used in this study (black with squares) with a 95% confidence interval (dotted); Archangelsk (crosses); Vardø (stars); SW Greenland (Vinther et al., 2006, pluses); 20CR (Compo et al., 2011, circles); Arctic N (Polyakov et al., 2003, **updated, rhombuses); HadCRUT4 (Morice et al., 2012, dashes); and ERA 20C (triangles). Panel (B): air temperature anomalies based on data used in this study (black with squares) with a 95% confidence interval (black dotted) with respect to the reference period based on ERA Interim reanalysis; short term means of the anomalies (horizontal black long dashed); ±3SDs of the mean ERA Interim (Dee et al.,2011, horizontal short dashed); 3SDs of the mean observational as an average of Ny Ålesund, Svalbard Lufthavn, Hornsund, Bjørnøya and Hopen (horizontal medium dashed). Note that data were not available for all regions in all years (NW, NE, SW and SE), therefore mean daily anomalies for the entire area were calculated in the following way: the daily mean for each location in the given region was subtracted from the mean air temperature for taken from ERA Interim for the same region. In the next step, all obtained daily anomalies were averaged for the entire area and for each year separately. International Journal of Climatology 28 OCT 2015 DOI: /joc
28 Air temperature trends (ºC/10 years) in the Svalbard archipelago in on the basis of daily data from logbooks. Values in bold indicates significance on the p 0.05 level. Month SW SE NW NE May June July August September Key: SW South-Western, SE South-Eastern, NW North-Western, NE North-Eastern regions divided according to 18ºE meridian and 78ºN parallel
29 LAND DATA Both annual cycles and spatial distribution of air temperature in the Svalbard region in the historical time were roughly similar to those of the present, described recently by Przybylak et al. (2014). It was also found that air temperature in the Central region represents average thermal conditions for the entire Svalbard archipelago for all seasons (except summer) and for the year quite well. The inter-annual air temperature variability of the monthly means is, as today, markedly greater in winter than in summer.
30 LAND DATA Analysis reveals that in , Svalbard was markedly colder than today (by about 3 C) in all seasons, except summer when the air temperature was similar in both periods. However, the majority of mean monthly air temperatures in historical times still lie within two SDs from the modern, mean. This means that values of air temperature in historical times lie within range of contemporary air temperature variability. Seasonal patterns of air temperature changes in the Svalbard archipelago between the historical and standard normal ( ) periods show a generally good correspondence with analogical changes calculated not only for the Atlantic region but also for some other Arctic regions (e.g. SE Greenland, Canadian Arctic, the Barents and Kara seas), as well as also for the entire Arctic. All these sources concluded that annual air temperature in historical times was generally colder than the standard normal period ( ) by about C. When we took as the reference period the new normal period ( ), the difference increases to about C.
31 MARINE DATA As with the land data, the spatial distribution of air temperature over the seas surrounding the Svalbard archipelago is similar to the present day, i.e. the highest/lowest air temperatures occur in the southern/northern and western/eastern grid boxes. This pattern is particularly clear in May and September, while in summer the change of air temperature with latitude is small in the western regions. Reanalyses are usually too cold in comparison with observations, except some southern grid boxes in the case of 20CR. In particular, large differences (2 5 C) have been found in northern regions. More or less similar results of historical minus present-day air temperature differences were obtained for ERA-Interim and 20CR. Southern regions in all months reveal colder conditions in than today (up to about 4 C in the SE region, particularly in May and September). However, the northern regions (NE and in particular NW) were warmer than present-day conditions (reaching a maximum of 3 4 C in the NW region in some months), except for the NE region in August for ERA-Interim.

.")


32 MARINE DATA Historical minus present-day differences between air temperatures measured on land show good correspondence with marine data, in particular in southern regions. Our reconstruction shows good correspondence in many sub-periods with air temperatures presented for SW Greenland (see, e.g. the beginning of the series or ). But in the latest 15-year period ( ), the reconstruction corresponds better with air temperature from Archangelsk, Vardø and with gridded data from HadCRUT4 than with air temperature from SW Greenland. May September average air temperature for the entire period was slightly colder in Svalbard (by 0.4 C) than today. The majority (about 90%) of these mean air temperatures lie within range of ±3SD from its contemporary long-term mean air temperature.
33 Rajmund Przybylak 1, Przemysław Wyszyński 1, Øyvind Nordli 2 & Tomasz Strzyżewski 1 1 Nicolaus Copernicus University, Toruń, Poland, 2 Norwegian Meteorological Institute, Oslo, Norway
34 ADDITIONAL SLIDES
, ERA-20C (middle panel) and 20CR (lower panel) in Svalbard and its surrounding seas, during May to September")
35 Mean monthly air temperature (ºC) based on land stations (dots) and reanalyses (grid boxes): ERA-Interim (upper panel), ERA-20C (middle panel) and 20CR (lower panel) in Svalbard and its surrounding seas, during May to September

36 Number of reconstructed monthly means of air temperature (ºC) in each grid box in the seas surrounding Svalbard in and its sub-periods and
, ERA-20C (middle panel) and 20CR (lower panel).")
37 Mean monthly differences of air temperature (ºC) between historical ( ) and contemporary five warmest months, selected from Grid boxes indicate differences between historical logbooks and the present reanalysis: ERA-Interim (upper panel), ERA-20C (middle panel) and 20CR (lower panel). White patterned grid boxes indicate areas with a lack of data.
The Arctic Energy Budget
 The Arctic Energy Budget The global heat engine [courtesy Kevin Trenberth, NCAR]. Differential solar heating between low and high latitudes gives rise to a circulation of the atmosphere and ocean that
Past and future climate development in Longyearbyen, Svalbard
 Past and future climate development in Longyearbyen, Svalbard Eirik J. Førland 1,2 and Ketil Isaksen 1 1). Norwegian Meteorological Institute 2). Norwegian Centre for Climate Services Svalbard Science
The importance of long-term Arctic weather station data for setting the research stage for climate change studies
 The importance of long-term Arctic weather station data for setting the research stage for climate change studies Taneil Uttal NOAA/Earth Systems Research Laboratory Boulder, Colorado Things to get out
Robust Arctic sea-ice influence on the frequent Eurasian cold winters in past decades
 SUPPLEMENTARY INFORMATION DOI: 10.1038/NGEO2277 Robust Arctic sea-ice influence on the frequent Eurasian cold winters in past decades Masato Mori 1*, Masahiro Watanabe 1, Hideo Shiogama 2, Jun Inoue 3,
Impact of Eurasian spring snow decrement on East Asian summer precipitation
 Impact of Eurasian spring snow decrement on East Asian summer precipitation Renhe Zhang 1,2 Ruonan Zhang 2 Zhiyan Zuo 2 1 Institute of Atmospheric Sciences, Fudan University 2 Chinese Academy of Meteorological
Air temperature in Novaya Zemlya Archipelago and Vaygach Island from 1832 to 1920 in the light of early instrumental data
 INTERNATIONAL JOURNAL OF CLIMATOLOGY Int. J. Climatol. 37: 3491 38 (217) Published online 28 November 216 in Wiley Online Library (wileyonlinelibrary.com) DOI:.2/joc.4934 Air temperature in Novaya Zemlya
ENSO Cycle: Recent Evolution, Current Status and Predictions. Update prepared by Climate Prediction Center / NCEP 5 August 2013
 ENSO Cycle: Recent Evolution, Current Status and Predictions Update prepared by Climate Prediction Center / NCEP 5 August 2013 Outline Overview Recent Evolution and Current Conditions Oceanic Niño Index
Correction to Evaluation of the simulation of the annual cycle of Arctic and Antarctic sea ice coverages by 11 major global climate models
 JOURNAL OF GEOPHYSICAL RESEARCH, VOL. 111,, doi:10.1029/2006jc003949, 2006 Correction to Evaluation of the simulation of the annual cycle of Arctic and Antarctic sea ice coverages by 11 major global climate
ENSO Cycle: Recent Evolution, Current Status and Predictions. Update prepared by Climate Prediction Center / NCEP 25 February 2013
 ENSO Cycle: Recent Evolution, Current Status and Predictions Update prepared by Climate Prediction Center / NCEP 25 February 2013 Outline Overview Recent Evolution and Current Conditions Oceanic Niño Index
ENSO Cycle: Recent Evolution, Current Status and Predictions. Update prepared by Climate Prediction Center / NCEP 24 September 2012
 ENSO Cycle: Recent Evolution, Current Status and Predictions Update prepared by Climate Prediction Center / NCEP 24 September 2012 Outline Overview Recent Evolution and Current Conditions Oceanic Niño
Figure ES1 demonstrates that along the sledging
 UPPLEMENT AN EXCEPTIONAL SUMMER DURING THE SOUTH POLE RACE OF 1911/12 Ryan L. Fogt, Megan E. Jones, Susan Solomon, Julie M. Jones, and Chad A. Goergens This document is a supplement to An Exceptional Summer
SUPPLEMENTARY INFORMATION
 doi:10.1038/nature12310 We present here two additional Tables (Table SI-1, 2) and eight further Figures (Figures SI-1 to SI-8) to provide extra background information to the main figures of the paper.
Extreme, transient Moisture Transport in the high-latitude North Atlantic sector and Impacts on Sea-ice concentration:
 AR conference, June 26, 2018 Extreme, transient Moisture Transport in the high-latitude North Atlantic sector and Impacts on Sea-ice concentration: associated Dynamics, including Weather Regimes & RWB
ENSO Cycle: Recent Evolution, Current Status and Predictions. Update prepared by Climate Prediction Center / NCEP 23 April 2012
 ENSO Cycle: Recent Evolution, Current Status and Predictions Update prepared by Climate Prediction Center / NCEP 23 April 2012 Outline Overview Recent Evolution and Current Conditions Oceanic Niño Index
Mozambique. General Climate. UNDP Climate Change Country Profiles. C. McSweeney 1, M. New 1,2 and G. Lizcano 1
 UNDP Climate Change Country Profiles Mozambique C. McSweeney 1, M. New 1,2 and G. Lizcano 1 1. School of Geography and Environment, University of Oxford. 2.Tyndall Centre for Climate Change Research http://country-profiles.geog.ox.ac.uk
ENSO Cycle: Recent Evolution, Current Status and Predictions. Update prepared by Climate Prediction Center / NCEP 11 November 2013
 ENSO Cycle: Recent Evolution, Current Status and Predictions Update prepared by Climate Prediction Center / NCEP 11 November 2013 Outline Overview Recent Evolution and Current Conditions Oceanic Niño Index
Modeling the Arctic Climate System
 Modeling the Arctic Climate System General model types Single-column models: Processes in a single column Land Surface Models (LSMs): Interactions between the land surface, atmosphere and underlying surface
Regional Sea Ice Outlook for Greenland Sea and Barents Sea - based on data until the end of May 2013
 Regional Sea Ice Outlook for Greenland Sea and Barents Sea - based on data until the end of May 2013 Sebastian Gerland 1*, Max König 1, Angelika H.H. Renner 1, Gunnar Spreen 1, Nick Hughes 2, and Olga
ENSO Cycle: Recent Evolution, Current Status and Predictions. Update prepared by Climate Prediction Center / NCEP 15 July 2013
 ENSO Cycle: Recent Evolution, Current Status and Predictions Update prepared by Climate Prediction Center / NCEP 15 July 2013 Outline Overview Recent Evolution and Current Conditions Oceanic Niño Index
WATER VAPOR FLUXES OVER EQUATORIAL CENTRAL AFRICA
 WATER VAPOR FLUXES OVER EQUATORIAL CENTRAL AFRICA INTRODUCTION A good understanding of the causes of climate variability depend, to the large extend, on the precise knowledge of the functioning of the
Seasonal forecasting activities at ECMWF
 Seasonal forecasting activities at ECMWF An upgraded ECMWF seasonal forecast system: Tim Stockdale, Stephanie Johnson, Magdalena Balmaseda, and Laura Ferranti Progress with C3S: Anca Brookshaw ECMWF June
Relationship between atmospheric circulation indices and climate variability in Estonia
 BOREAL ENVIRONMENT RESEARCH 7: 463 469 ISSN 1239-695 Helsinki 23 December 22 22 Relationship between atmospheric circulation indices and climate variability in Estonia Oliver Tomingas Department of Geography,
No pause in the increase of hot temperature extremes
 SUPPLEMENTARY INFORMATION DOI: 10.1038/NCLIMATE2145 No pause in the increase of hot temperature extremes Sonia I. Seneviratne 1, Markus G. Donat 2,3, Brigitte Mueller 4,1, and Lisa V. Alexander 2,3 1 Institute
Characterization of the Present-Day Arctic Atmosphere in CCSM4
 Characterization of the Present-Day Arctic Atmosphere in CCSM4 Gijs de Boer 1, Bill Chapman 2, Jennifer Kay 3, Brian Medeiros 3, Matthew Shupe 4, Steve Vavrus, and John Walsh 6 (1) (2) (3) (4) ESRL ()
Predictability and prediction of the North Atlantic Oscillation
 Predictability and prediction of the North Atlantic Oscillation Hai Lin Meteorological Research Division, Environment Canada Acknowledgements: Gilbert Brunet, Jacques Derome ECMWF Seminar 2010 September
Fig P3. *1mm/day = 31mm accumulation in May = 92mm accumulation in May Jul
 Met Office 3 month Outlook Period: May July 2014 Issue date: 24.04.14 Fig P1 3 month UK outlook for precipitation in the context of the observed annual cycle The forecast presented here is for May and
Probability distributions of monthly-to-annual mean temperature and precipitation in a changing climate
 Probability distributions of monthly-to-annual mean temperature and precipitation in a changing climate Jouni Räisänen Department of Physics, University of Helsinki Climate probability distribution of
CHAPTER 1: INTRODUCTION
 CHAPTER 1: INTRODUCTION There is now unequivocal evidence from direct observations of a warming of the climate system (IPCC, 2007). Despite remaining uncertainties, it is now clear that the upward trend
The western Colombia low-level jet and its simulation by CMIP5 models
 The western Colombia low-level jet and its simulation by CMIP5 models Juan P. Sierra, Jhoana Agudelo, Paola A. Arias and Sara C. Vieira Grupo de Ingeniería y Gestión Amiental (GIGA), Escuela Ambiental,
Forecasting Polar Lows. Gunnar Noer The Norwegian Meteorological Institute in Tromsø
 Forecasting Polar Lows Gunnar Noer The Norwegian Meteorological Institute in Tromsø Longyearbyen Hopen Bear Island Jan Mayen Tromsø Gunnar Noer Senior forecaster / developer for polar meteorology The Norwegian
Climate Variables for Energy: WP2
 Climate Variables for Energy: WP2 Phil Jones CRU, UEA, Norwich, UK Within ECEM, WP2 provides climate data for numerous variables to feed into WP3, where ESCIIs will be used to produce energy-relevant series
APPENDIX B PHYSICAL BASELINE STUDY: NORTHEAST BAFFIN BAY 1
 APPENDIX B PHYSICAL BASELINE STUDY: NORTHEAST BAFFIN BAY 1 1 By David B. Fissel, Mar Martínez de Saavedra Álvarez, and Randy C. Kerr, ASL Environmental Sciences Inc. (Feb. 2012) West Greenland Seismic
Seasonal Climate Watch April to August 2018
 Seasonal Climate Watch April to August 2018 Date issued: Mar 23, 2018 1. Overview The El Niño-Southern Oscillation (ENSO) is expected to weaken from a moderate La Niña phase to a neutral phase through
The Climatology of Clouds using surface observations. S.G. Warren and C.J. Hahn Encyclopedia of Atmospheric Sciences.
 The Climatology of Clouds using surface observations S.G. Warren and C.J. Hahn Encyclopedia of Atmospheric Sciences Gill-Ran Jeong Cloud Climatology The time-averaged geographical distribution of cloud
Seasonal Climate Watch June to October 2018
 Seasonal Climate Watch June to October 2018 Date issued: May 28, 2018 1. Overview The El Niño-Southern Oscillation (ENSO) has now moved into the neutral phase and is expected to rise towards an El Niño
Seasonal Climate Watch July to November 2018
 Seasonal Climate Watch July to November 2018 Date issued: Jun 25, 2018 1. Overview The El Niño-Southern Oscillation (ENSO) is now in a neutral phase and is expected to rise towards an El Niño phase through
SUPPLEMENTARY INFORMATION
 SUPPLEMENTARY INFORMATION DOI: 10.1038/NGEO1639 Importance of density-compensated temperature change for deep North Atlantic Ocean heat uptake C. Mauritzen 1,2, A. Melsom 1, R. T. Sutton 3 1 Norwegian
ENSO: Recent Evolution, Current Status and Predictions. Update prepared by: Climate Prediction Center / NCEP 30 October 2017
 ENSO: Recent Evolution, Current Status and Predictions Update prepared by: Climate Prediction Center / NCEP 30 October 2017 Outline Summary Recent Evolution and Current Conditions Oceanic Niño Index (ONI)
High-Resolution MPAS Simulations for Analysis of Climate Change Effects on Weather Extremes
 High-Resolution MPAS Simulations for Analysis of Climate Change Effects on Weather Extremes ALLISON MICHAELIS, GARY LACKMANN, & WALT ROBINSON Department of Marine, Earth, and Atmospheric Sciences, North
St Lucia. General Climate. Recent Climate Trends. UNDP Climate Change Country Profiles. Temperature. Precipitation
 UNDP Climate Change Country Profiles St Lucia C. McSweeney 1, M. New 1,2 and G. Lizcano 1 1. School of Geography and Environment, University of Oxford. 2. Tyndall Centre for Climate Change Research http://country-profiles.geog.ox.ac.uk
Malawi. General Climate. UNDP Climate Change Country Profiles. C. McSweeney 1, M. New 1,2 and G. Lizcano 1
 UNDP Climate Change Country Profiles Malawi C. McSweeney 1, M. New 1,2 and G. Lizcano 1 1. School of Geography and Environment, University of Oxford. 2. Tyndall Centre for Climate Change Research http://country-profiles.geog.ox.ac.uk
Primary Factors Contributing to Japan's Extremely Hot Summer of 2010
 temperature anomalies by its standard deviation for JJA 2010 Primary Factors Contributing to Japan's Extremely Hot Summer of 2010 Nobuyuki Kayaba Climate Prediction Division,Japan Meteorological Agancy
Human influence on terrestrial precipitation trends revealed by dynamical
 1 2 3 Supplemental Information for Human influence on terrestrial precipitation trends revealed by dynamical adjustment 4 Ruixia Guo 1,2, Clara Deser 1,*, Laurent Terray 3 and Flavio Lehner 1 5 6 7 1 Climate
The ECMWF coupled data assimilation system
 The ECMWF coupled data assimilation system Patrick Laloyaux Acknowledgments: Magdalena Balmaseda, Kristian Mogensen, Peter Janssen, Dick Dee August 21, 214 Patrick Laloyaux (ECMWF) CERA August 21, 214
Introduction. Observed Local Trends. Temperature Rainfall Tropical Cyclones. Projections for the Philippines. Temperature Rainfall
 PAGASA-DOST ntroduction Observed Local Trends Temperature Rainfall Tropical Cyclones Projections for the Philippines Temperature Rainfall Climate Change ssue ncreased use of fossil fuel Global Warming
Comparison of Global Mean Temperature Series
 ADVANCES IN CLIMATE CHANGE RESEARCH 2(4): 187 192, 2011 www.climatechange.cn DOI: 10.3724/SP.J.1248.2011.00187 REVIEW Comparison of Global Mean Temperature Series Xinyu Wen 1,2, Guoli Tang 3, Shaowu Wang
S e a s o n a l F o r e c a s t i n g f o r t h e E u r o p e a n e n e r g y s e c t o r
 S e a s o n a l F o r e c a s t i n g f o r t h e E u r o p e a n e n e r g y s e c t o r C3S European Climatic Energy Mixes (ECEM) Webinar 18 th Oct 2017 Philip Bett, Met Office Hadley Centre S e a s
Will a warmer world change Queensland s rainfall?
 Will a warmer world change Queensland s rainfall? Nicholas P. Klingaman National Centre for Atmospheric Science-Climate Walker Institute for Climate System Research University of Reading The Walker-QCCCE
ENSO Outlook by JMA. Hiroyuki Sugimoto. El Niño Monitoring and Prediction Group Climate Prediction Division Japan Meteorological Agency
 ENSO Outlook by JMA Hiroyuki Sugimoto El Niño Monitoring and Prediction Group Climate Prediction Division Outline 1. ENSO impacts on the climate 2. Current Conditions 3. Prediction by JMA/MRI-CGCM 4. Summary
Cuba. General Climate. Recent Climate Trends. UNDP Climate Change Country Profiles. Temperature. C. McSweeney 1, M. New 1,2 and G.
 UNDP Climate Change Country Profiles Cuba C. McSweeney 1, M. New 1,2 and G. Lizcano 1 1. School of Geography and Environment, University of Oxford. 2. Tyndall Centre for Climate Change Research http://country-profiles.geog.ox.ac.uk
From short range forecasts to climate change projections of extreme events in the Baltic Sea region
 Great Baltic Sea flood, November 13, 1872 Farm houses in Niendorf (near Lübeck) being torn away. Privately owned, Fam. Muuß, Hotel Friedrichsruh. Sea level 3.50 m above normal. From short range forecasts
Inter-comparison of Historical Sea Surface Temperature Datasets
 Inter-comparison of Historical Sea Surface Temperature Datasets Sayaka Yasunaka 1, Kimio Hanawa 2 1 Center for Climate System Research, University of Tokyo, Japan 2 Graduate School of Science, Tohoku University,
Second Session of the Pan-Arctic Regional Climate Outlook Forum (PARCOF-2), virtual forum, October 2018
, virtual forum, October 2018") Second Session of the Pan-Arctic Regional Climate Outlook Forum (PARCOF-2), virtual forum, October 2018 Consensus Statement for the Arctic Winter 2018-2019 Season Outlook Climate change in the Arctic is
Second Session of the Pan-Arctic Regional Climate Outlook Forum (PARCOF-2), virtual forum, October 2018 Consensus Statement for the Arctic Winter 2018-2019 Season Outlook Climate change in the Arctic is
Seasonal Climate Outlook for South Asia (June to September) Issued in May 2014
 Issued in May 2014") Ministry of Earth Sciences Earth System Science Organization India Meteorological Department WMO Regional Climate Centre (Demonstration Phase) Pune, India Seasonal Climate Outlook for South Asia (June
Ministry of Earth Sciences Earth System Science Organization India Meteorological Department WMO Regional Climate Centre (Demonstration Phase) Pune, India Seasonal Climate Outlook for South Asia (June
North Pacific Climate Overview N. Bond (UW/JISAO), J. Overland (NOAA/PMEL) Contact: Last updated: September 2008
, J. Overland (NOAA/PMEL) Contact: Last updated: September 2008") North Pacific Climate Overview N. Bond (UW/JISAO), J. Overland (NOAA/PMEL) Contact: Nicholas.Bond@noaa.gov Last updated: September 2008 Summary. The North Pacific atmosphere-ocean system from fall 2007
North Pacific Climate Overview N. Bond (UW/JISAO), J. Overland (NOAA/PMEL) Contact: Nicholas.Bond@noaa.gov Last updated: September 2008 Summary. The North Pacific atmosphere-ocean system from fall 2007
ALASKA REGION CLIMATE OUTLOOK BRIEFING. November 17, 2017 Rick Thoman National Weather Service Alaska Region
 ALASKA REGION CLIMATE OUTLOOK BRIEFING November 17, 2017 Rick Thoman National Weather Service Alaska Region Today Feature of the month: More climate models! Climate Forecast Basics Climate System Review
Twenty-five winters of unexpected Eurasian cooling unlikely due to Arctic sea-ice loss
 SUPPLEMENTARY INFORMATION DOI: 10.1038/NGEO2820 Twenty-five winters of unexpected Eurasian cooling unlikely due to Arctic sea-ice loss Kelly E. McCusker 1,2, John C. Fyfe 2 & Michael Sigmond 2 1 School
Changes in Frequency of Extreme Wind Events in the Arctic
 Changes in Frequency of Extreme Wind Events in the Arctic John E. Walsh Department of Atmospheric Sciences University of Illinois 105 S. Gregory Avenue Urbana, IL 61801 phone: (217) 333-7521 fax: (217)
High-latitude influence on mid-latitude weather and climate
 High-latitude influence on mid-latitude weather and climate Thomas Jung, Marta Anna Kasper, Tido Semmler, Soumia Serrar and Lukrecia Stulic Alfred Wegener Institute, Helmholtz Centre for Polar and Marine
ENSO: Recent Evolution, Current Status and Predictions. Update prepared by: Climate Prediction Center / NCEP 9 November 2015
 ENSO: Recent Evolution, Current Status and Predictions Update prepared by: Climate Prediction Center / NCEP 9 November 2015 Outline Summary Recent Evolution and Current Conditions Oceanic Niño Index (ONI)
ANNUAL CLIMATE REPORT 2016 SRI LANKA
 ANNUAL CLIMATE REPORT 2016 SRI LANKA Foundation for Environment, Climate and Technology C/o Mahaweli Authority of Sri Lanka, Digana Village, Rajawella, Kandy, KY 20180, Sri Lanka Citation Lokuhetti, R.,
Winter Forecast for GPC Tokyo. Shotaro TANAKA Tokyo Climate Center (TCC) Japan Meteorological Agency (JMA)
 Japan Meteorological Agency (JMA)") Winter Forecast for 2013 2014 GPC Tokyo Shotaro TANAKA Tokyo Climate Center (TCC) Japan Meteorological Agency (JMA) NEACOF 5, October 29 November 1, 2013 1 Outline 1. Numerical prediction 2. Interannual
Winter Forecast for 2013 2014 GPC Tokyo Shotaro TANAKA Tokyo Climate Center (TCC) Japan Meteorological Agency (JMA) NEACOF 5, October 29 November 1, 2013 1 Outline 1. Numerical prediction 2. Interannual
Grenada. General Climate. Recent Climate Trends. UNDP Climate Change Country Profiles. Temperature. Precipitation
 UNDP Climate Change Country Profiles C. McSweeney 1, M. New 1,2 and G. Lizcano 1 1. School of Geography and Environment, University of Oxford. 2. Tyndall Centre for Climate Change Research http://country-profiles.geog.ox.ac.uk
The Hydrologic Cycle
 The Hydrologic Cycle Monthly precipitation for the central Arctic Ocean based on data from the Russian North Pole manned camps with daily bias adjustments. Raw precipitation totals are shown along with
General Circulation. Nili Harnik DEES, Lamont-Doherty Earth Observatory
 General Circulation Nili Harnik DEES, Lamont-Doherty Earth Observatory nili@ldeo.columbia.edu Latitudinal Radiation Imbalance The annual mean, averaged around latitude circles, of the balance between the
PYROGEOGRAPHY OF THE IBERIAN PENINSULA
 PYROGEOGRAPHY OF THE IBERIAN PENINSULA Teresa J. Calado (1), Carlos C. DaCamara (1), Sílvia A. Nunes (1), Sofia L. Ermida (1) and Isabel F. Trigo (1,2) (1) Instituto Dom Luiz, Universidade de Lisboa, Lisboa,
The Northern Hemisphere Sea ice Trends: Regional Features and the Late 1990s Change. Renguang Wu
 The Northern Hemisphere Sea ice Trends: Regional Features and the Late 1990s Change Renguang Wu Institute of Atmospheric Physics, Chinese Academy of Sciences, Beijing World Conference on Climate Change
Nonlinear atmospheric response to Arctic sea-ice loss under different sea ice scenarios
 Nonlinear atmospheric response to Arctic sea-ice loss under different sea ice scenarios Hans Chen, Fuqing Zhang and Richard Alley Advanced Data Assimilation and Predictability Techniques The Pennsylvania
Antigua and Barbuda. General Climate. Recent Climate Trends. UNDP Climate Change Country Profiles. Temperature
 UNDP Climate Change Country Profiles Antigua and Barbuda C. McSweeney 1, M. New 1,2 and G. Lizcano 1 1. School of Geography and Environment, University of Oxford. 2. Tyndall Centre for Climate Change Research
John Steffen and Mark A. Bourassa
 John Steffen and Mark A. Bourassa Funding by NASA Climate Data Records and NASA Ocean Vector Winds Science Team Florida State University Changes in surface winds due to SST gradients are poorly modeled
SEASONAL AND ANNUAL TRENDS OF AUSTRALIAN MINIMUM/MAXIMUM DAILY TEMPERATURES DURING
 SEASONAL AND ANNUAL TRENDS OF AUSTRALIAN MINIMUM/MAXIMUM DAILY TEMPERATURES DURING 1856-2014 W. A. van Wijngaarden* and A. Mouraviev Physics Department, York University, Toronto, Ontario, Canada 1. INTRODUCTION
Extreme Weather and Climate Change: the big picture Alan K. Betts Atmospheric Research Pittsford, VT NESC, Saratoga, NY
 Extreme Weather and Climate Change: the big picture Alan K. Betts Atmospheric Research Pittsford, VT http://alanbetts.com NESC, Saratoga, NY March 10, 2018 Increases in Extreme Weather Last decade: lack
Observed Climate Variability and Change: Evidence and Issues Related to Uncertainty
 Observed Climate Variability and Change: Evidence and Issues Related to Uncertainty David R. Easterling National Climatic Data Center Asheville, North Carolina Overview Some examples of observed climate
Energy Systems, Structures and Processes Essential Standard: Analyze patterns of global climate change over time Learning Objective: Differentiate
 Energy Systems, Structures and Processes Essential Standard: Analyze patterns of global climate change over time Learning Objective: Differentiate between weather and climate Global Climate Focus Question
SUPPLEMENTARY INFORMATION
 SUPPLEMENTARY INFORMATION DOI: 10.1038/NCLIMATE1840 RECENT MULTIDECADAL STRENGTHENING OF THE WALKER CIRCULATION ACROSS THE TROPICAL PACIFIC (1) Supplementary_Figures.pdf Adobe document 1.5MB SI Guide Supplementary
How might extratropical storms change in the future? Len Shaffrey National Centre for Atmospheric Science University of Reading
 How might extratropical storms change in the future? Len Shaffrey National Centre for Atmospheric Science University of Reading Extratropical storms Extratropical storms Strong winds, extreme waves, storm
Zambia. General Climate. Recent Climate Trends. UNDP Climate Change Country Profiles. Temperature. C. McSweeney 1, M. New 1,2 and G.
 UNDP Climate Change Country Profiles Zambia C. McSweeney 1, M. New 1,2 and G. Lizcano 1 1. School of Geography and Environment, University of Oxford. 2. Tyndall Centre for Climate Change Research http://country-profiles.geog.ox.ac.uk
Impacts of Climate Change on Autumn North Atlantic Wave Climate
 Impacts of Climate Change on Autumn North Atlantic Wave Climate Will Perrie, Lanli Guo, Zhenxia Long, Bash Toulany Fisheries and Oceans Canada, Bedford Institute of Oceanography, Dartmouth, NS Abstract
SUPPLEMENTARY INFORMATION
 SUPPLEMENTARY INFORMATION DOI: 1.138/NCLIMATE1884 SPRINGTIME ATMOSPHERIC ENERGY TRANSPORT AND THE CONTROL OF ARCTIC SUMMER SEA-ICE EXTENT Supplementary discussion In the main text it is argued that positive
NOAA 2015 Updated Atlantic Hurricane Season Outlook
 NOAA 2015 Updated Atlantic Hurricane Season Outlook Dr. Gerry Bell Lead Seasonal Forecaster Climate Prediction Center/ NOAA/ NWS Collaboration With National Hurricane Center/ NOAA/ NWS Hurricane Research
Trends in Climate Teleconnections and Effects on the Midwest
 Trends in Climate Teleconnections and Effects on the Midwest Don Wuebbles Zachary Zobel Department of Atmospheric Sciences University of Illinois, Urbana November 11, 2015 Date Name of Meeting 1 Arctic
Annex I to Target Area Assessments
 Baltic Challenges and Chances for local and regional development generated by Climate Change Annex I to Target Area Assessments Climate Change Support Material (Climate Change Scenarios) SWEDEN September
Supplementary appendix
 Supplementary appendix This appendix formed part of the original submission and has been peer reviewed. We post it as supplied by the authors. Supplement to: Lowe R, Stewart-Ibarra AM, Petrova D, et al.
The 2009 Hurricane Season Overview
 The 2009 Hurricane Season Overview Jae-Kyung Schemm Gerry Bell Climate Prediction Center NOAA/ NWS/ NCEP 1 Overview outline 1. Current status for the Atlantic, Eastern Pacific and Western Pacific basins
First-Order Draft Chapter 3 IPCC WG1 Fourth Assessment Report
 0 Figure... Estimates of linear trends in significant wave height (cm decade - ) for the regions along the major ship routes for the global ocean for the period 0 00. Trends are shown only for the locations
Supplemental Materials
 Supplemental Materials Figure S-1. Locations of the ozonesonde stations used in the TOST product for the period 2008-2012. Figure S-2. Map of the seven regions: Eastern USA, Eastern China, Atlantic, Indonesia,
ROBUST ASSESSMENT OF THE EXPANSION AND RETREAT OF MEDITERRANEAN CLIMATE IN THE 21 st CENTURY.
 ROBUST ASSESSMENT OF THE EXPANSION AND RETREAT OF MEDITERRANEAN CLIMATE IN THE 21 st CENTURY. Andrea Alessandri, Matteo De Felice, Ning Zeng, Annarita Mariotti, Yutong Pan, Annalisa Cherchi, June-Yi Lee,
Cruise Report R/V Oceania, AREX 2007
 Powstańców Warszawy 55, PL - 81-712 Sopot, P.O. Box 68 March 15, 2008 Cruise Report R/V Oceania, AREX 2007 Ship: R/V Oceania Cruise: AREX 2007 Dates: 19.06.2007 05.08.2007 Port Calls: Gdansk (Poland) Longyearbyen
particular regional weather extremes
 SUPPLEMENTARY INFORMATION DOI: 1.138/NCLIMATE2271 Amplified mid-latitude planetary waves favour particular regional weather extremes particular regional weather extremes James A Screen and Ian Simmonds
Arctic Climate Change. Glen Lesins Department of Physics and Atmospheric Science Dalhousie University Create Summer School, Alliston, July 2013
 Arctic Climate Change Glen Lesins Department of Physics and Atmospheric Science Dalhousie University Create Summer School, Alliston, July 2013 When was this published? Observational Evidence for Arctic
Which Earth latitude receives the greatest intensity of insolation when Earth is at the position shown in the diagram? A) 0 B) 23 N C) 55 N D) 90 N
 0 B) 23 N C) 55 N D) 90 N") 1. In which list are the forms of electromagnetic energy arranged in order from longest to shortest wavelengths? A) gamma rays, x-rays, ultraviolet rays, visible light B) radio waves, infrared rays, visible
1. In which list are the forms of electromagnetic energy arranged in order from longest to shortest wavelengths? A) gamma rays, x-rays, ultraviolet rays, visible light B) radio waves, infrared rays, visible
ENSO Cycle: Recent Evolution, Current Status and Predictions. Update prepared by Climate Prediction Center / NCEP July 26, 2004
 ENSO Cycle: Recent Evolution, Current Status and Predictions Update prepared by Climate Prediction Center / NCEP July 26, 2004 Outline Overview Recent Evolution and Current Conditions Oceanic NiZo Index
How well do we know the climatological characteristics of the North Atlantic jet stream? Isla Simpson, CAS, CDG, NCAR
 How well do we know the climatological characteristics of the North Atlantic jet stream? Isla Simpson, CAS, CDG, NCAR A common bias among GCMs is that the Atlantic jet is too zonal One particular contour
Persistent shift of the Arctic polar vortex towards the Eurasian continent in recent decades
 SUPPLEMENTARY INFORMATION DOI: 10.1038/NCLIMATE3136 Persistent shift of the Arctic polar vortex towards the Eurasian continent in recent decades Jiankai Zhang 1, Wenshou Tian 1 *, Martyn P. Chipperfield
What is Climate? Understanding and predicting climatic changes are the basic goals of climatology.
 What is Climate? Understanding and predicting climatic changes are the basic goals of climatology. Climatology is the study of Earth s climate and the factors that affect past, present, and future climatic
Predicting climate extreme events in a user-driven context
 www.bsc.es Oslo, 6 October 2015 Predicting climate extreme events in a user-driven context Francisco J. Doblas-Reyes BSC Earth Sciences Department BSC Earth Sciences Department What Environmental forecasting
ENSO effects on mean temperature in Turkey
 Hydrology Days 007 ENSO effects on mean temperature in Turkey Ali hsan Martı Selcuk University, Civil Engineering Department, Hydraulic Division, 4035, Campus, Konya, Turkey Ercan Kahya 1 Istanbul Technical
North Pacific Climate Overview N. Bond (UW/JISAO), J. Overland (NOAA/PMEL) Contact: Last updated: August 2009
, J. Overland (NOAA/PMEL) Contact: Last updated: August 2009") North Pacific Climate Overview N. Bond (UW/JISAO), J. Overland (NOAA/PMEL) Contact: Nicholas.Bond@noaa.gov Last updated: August 2009 Summary. The North Pacific atmosphere-ocean system from fall 2008 through
North Pacific Climate Overview N. Bond (UW/JISAO), J. Overland (NOAA/PMEL) Contact: Nicholas.Bond@noaa.gov Last updated: August 2009 Summary. The North Pacific atmosphere-ocean system from fall 2008 through
Suriname. General Climate. Recent Climate Trends. UNDP Climate Change Country Profiles. Temperature. C. McSweeney 1, M. New 1,2 and G.
 UNDP Climate Change Country Profiles Suriname C. McSweeney 1, M. New 1,2 and G. Lizcano 1 1. School of Geography and Environment, University of Oxford. 2. Tyndall Centre for Climate Change Research http://country-profiles.geog.ox.ac.uk
Sierra Weather and Climate Update
 Sierra Weather and Climate Update 2014-15 Kelly Redmond Western Regional Climate Center Desert Research Institute Reno Nevada Yosemite Hydroclimate Workshop Yosemite Valley, 2015 October 8-9 Percent of