SUPPLEMENTARY MATERIAL
|
|
|
- Allison Johnston
- 5 years ago
- Views:
Transcription
1 SUPPLEMENTARY MATERIAL Impacts of Air-Sea Interactions on Regional Air Quality Predictions Using a Coupled Atmosphere-Ocean Model in Southeastern U.S. Jian He, Ruoying He, and Yang Zhang * Department of Marine, Earth, and Atmospheric Sciences, North Carolina State University, Raleigh, NC, U.S.A. Impacts of Cumulus Parameterizations Table 1 in the main text shows the two simulations conducted to compare different cumulus parameterizations in this work, Wang et al. (2015a) (refer to as W15) and SEN1. The cumulus parameterization scheme used in this work is based on Grell 3D ensemble scheme (referred to as G3D, Grell and Devenyi, 2002; Grell and Freitas, 2014), which allows for a series of different assumptions that are commonly used in convective parameterizations and includes options to spread subsidence to neighboring grid points. In addition to the options listed in Table 1 of Wang et al. (2015a), W15 also includes prescribed SST forcing from NCEP by updating every 6-hour. SEN1 is conducted with the same model configurations as W15 but with a different cumulus parameterization scheme based on Grell and Freitas (2014) (referred to as GF scheme), which allows for subgrid scale convection representation. The differences in the model results between W15 and SEN1 can provide insights about the sensitivity of cumulus parameterization on model meteorological, cloud/radiative, and chemical predictions. Comprehensive model comparisons between GF scheme and G3D scheme and model evaluations are discussed as below. * Corresponding author. Tel: ; Fax: address: yang_zhang@ncsu.edu 1
2 Meteorological Predictions Figures S1a and b show the absolute differences in monthly-averaged meteorology, cloud/radiative variables, and chemical predictions between SEN1 and W15. Compared to W15, SEN1 predicts higher T2 over most land area, and lower T2 over part of oceanic area. The increases of T2 in SEN1 can be up to 0.76 o C and the decrease of T2 can be up to 0.4 o C, with a domain averaged increase of 0.07 o C. The increase of T2 over land and decrease of T2 over ocean are mainly due to an increase of SWD by 5.2 W m -2 over land and a decrease of SWD by 2.5 W m -2 over ocean. Q2 decreases in SEN1 over most of domain, with a domain averaged decrease of 0.3 g kg -1, indicating much drier conditions predicted in SEN1. GF scheme is designed to be less active as the grid size reduces to cloud resolving scales. Precipitation decreases in SEN1 over most of domain, with a domain averaged reduction of 3.9 mm day -1. The reduction of the total precipitation is mainly from the dominance of the decrease in nonconvective precipitation (by domain averaged of 6.9 mm day -1 ) over the increase in convective precipitation (by domain averaged of 3.0 mm day -1 ). This is because, comparing to the G3D scheme, the GF scheme predicts stronger convection which leads to stronger detrainment of cloud water and ice near the cloud top, drying the troposphere and reducing the grid-scale precipitation. As explained in Grell and Freitas (2014), less precipitation simulated by GF than G3D is attributed to the differences in autoconversion mechanism used in both schemes. Due to the stronger convection in SEN1, PBLH predicted by SEN1 also increases up to 185 m, with a domain averaged increase of 55.0 m. Due to higher T2 and lower Q2 predicted by SEN1, less water vapor can condense onto the CCN surface. As a result, SEN1 predicts smaller cloud droplets than W15. CDNC predicted by SEN1 varies throughout the domain, with increases up to 993 cm -3 and decreases up to 749 cm -3, 2
3 resulting in a domain averaged increase of 3.4 cm -3. The decreases of LWP and CF are associated with the decrease in large-scale precipitation, which is affected by the GF scheme. As a result, SEN1 predicts lower CF and LWP, with a domain averaged decrease of 7.0% and 19.4 g m -2, respectively. However, COT increases in SEN1, with a domain averaged increase of The increase of COT is likely due to the decrease of cloud effective radius from smaller cloud droplets in SEN1. Although both CDNC and COT increase over land, the significant decrease of CF and LWP over land can result in a decrease in cloud albedo, and therefore a decrease in SWCF over land and near coastal areas in SEN1. The increase of SWCF over remote ocean is mainly due to the increase of CDNC and COT over these regions. As a result, compared to W15, SEN1 predicts higher SWCF up to 49 W m -2 and lower SWCF up to 45.3 W m -2, with a domain averaged decrease of 1.7 W m -2. The decrease or increase in SWCF can result in an increase or a decrease, respectively, in SWD. Compared to W15, SEN1 predicts higher SWD by up to W m -2 and lower SWD by up to 51.8 W m -2, with a domain averaged increase of 1.1 W m -2. Tables S1a and b show the model performance of W15 and SEN1. Meteorological variables such as T2, RH2, and SST are well predicted in both W15 and SEN1, with NMBs within 6%, and with slightly better performance in SEN1. RMSEs of T2 and SST are very similar in W15 and SEN1, with a slightly lower RMSE of T2 in SEN1. The RMSE of RH2 is also lower in SEN1 than that in W15. Vertical evaluation of monthly-averaged temperature and specific humidity are shown in Figures 2a and b. As shown in Figure 2a, temperature profiles are well simulated compared to the NCEP reanalysis data. However, relatively large biases exist for specific humidity profiles. For example, both W15 and SEN1 overpredict specific humidity profiles (see Figure 2b) over Gulfport Youth Court (with a smaller bias by SEN1). But W15 predicts better specific humidity profile over Indian River Lagoon, Everglades, and Cape 3
4 Romain than SEN1. WS10 is moderately underpredicted against observations at the NCEI sites in both W15 and SEN1, with NMBs of -58.3% and -61.3%, respectively, whereas it is well predicted against the observations at the CASTNET sites, with NMBs of 5.4% and 4.9%, respectively, for W15 and SEN1. A slight shift in wind direction (i.e., WD10) to more westerly is predicted in both W15 and SEN1, with relatively good correlation coefficients of 0.6 for both cases. With GF in SEN1, PBLH is impacted significantly over ocean, with increasing NMBs from 0.2% in W15 to 16.2% in SEN1 against the NCEP reanalysis data. The biases in PBLH can be due in part to different methods for calculating PBLH in the NCEP models (e.g., the Global Forecast System and North American Model) and WRF. Also, Seidel et al. (2012) found that the NCEP reanalysis data showed deeper PBLH due to difficulty in simulating stable conditions compared with radiosonde observations. Therefore, the performance of PBLH here can only represent the deviation from the NCEP models. Both LHFLX and SHFLX are overpredicted in W15 and SEN1, which is mainly due to a lack of representations of the air-sea interactions. The uncertainties associated with the WRF/Chem s representations of convection-cloud-radiation may also contribute to the overpredictions. For example, Alapaty et al. (2012) reported that lack of the model treatments of subgrid cloud feedbacks in radiation calculation in WRF can explain overpredictions in shortwave radiation and precipitation. Even though the convection-cloud-radiation feedback is included in G3D/GF in WRF/Chem v3.6.1, uncertainties exist in the model representation of such feedbacks. Compared to W15, SEN1 improves the predictions of Precip over land (ocean) significantly, by reducing NMBs of 95.9% (335.2%) to 31.7% (211.5%) against GPCP. The RMSE of Precip against GPCP is substantially reduced from W15 (7.6 mm day -1 ) to SEN1 (2.8 mm day -1 ). CF is also improved by reducing NMBs from 23.7% in W15 to -1.0% in SEN1 over 4
5 land, and from 48.7% in W15 to 42.3% in SEN1 over ocean, compared to CERES SYN1deg observations. LWP is more underpredicted with NMBs from -35.0% in W15 to -80.7% in SEN1 over land but improved substantially over ocean with NMBs from 304.6% in W15 to 35.1% in SEN1. The significant decrease of LWP over ocean is likely due to smaller cloud effective radius associated with higher CDNC, resulting from less precipitation in SEN1. The cloud effective radius is not included in the model output. However, LWP is proportional to both the COT and the effective radius, since SEN1 gives higher COT than W15, the decrease of LWP in SEN1 can be due to the smaller cloud effective radius in SEN1. Also, the increase of CDNC is usually associated with a decrease in cloud effective radius. Total precipitation is reduced in SEN1, resulting in more aerosols that can be activated to increase CDNC. The performance of COT is improved over land with NMBs reducing from -70.3% in W15 to -39.5% in SEN1 whereas it is degraded over ocean, with NMBs increasing from -21.8% in W15 to 64.6% in SEN1. The large overpredictions of COT over ocean are likely due to the smaller cloud effective radius in SEN1, which indicates the uncertainties in the treatments of cloud dynamics and thermodynamics. Compared to MODIS data, PWV over land is more underpredicted, with NMBs from -0.5% in W15 to -5.5% in SEN1, and the performance of PWV over ocean is from overprediction by 3.2% in W15 to underprediction by 4.2% in SEN1. The performance of AOD over land is slightly degraded with NMBs from -10.8% in W15 to -11.5% in SEN1 and the performance of AOD over ocean is slightly improved with NMBs from -1.0 in W15 to -0.3% in SEN1. The predictions of CCN5 are improved in SEN1, with NMBs from 21.1% in W15 to -0.8% in SEN1. The decreases of CCN5 in SEN1 are mainly due to the lower aerosol number concentrations in SEN1. The overpredictions of CDNC are largely due to the uncertainties in the observations as there are only a few grid cells that contain observations. 5
6 Model predictions of radiative variables such as LWD, SWD, and OLR are comparable in W15 and SEN1, with slightly better performance of LWD over ocean (NMBs of 0.8% vs. 0.3% for W15 and SEN1, respectively), SWD over land (NMBs of -2.4% vs. 0.5%), and OLR over land (NMBs of -13.9% vs. -7.0%) and ocean (NMBs of -22.9% vs %) in SEN1. On the other hand, there are significant changes in SWCF and LWCF. Compared to W15, the domain averaged SWCF predicted by SEN1 decreases from W m -2 to W m -2 over land (with NMBs reduced from 57.2% to 45.1%), and it increases from W m -2 to W m -2 over ocean (with NMBs increased slightly from 108.9% to 112.5%). The domain averaged LWCF predicted by SEN1 decreases from 53.2 W m -2 to 37.7 W m -2 over land (with NMBs reduced significantly from 61.7% to 18.9%), and it decreases from 77.8 W m -2 to 74.5 W m -2 over ocean (with NMBs reduced from 152.1% to 141.4%). The improvements of SWCF and LWCF over land are attributed to the improvement of cloud variables (e.g., CF and COT) over land. The large overpredictions of SWCF and LWCF over ocean are attributed to the inaccurate predictions clouds over ocean, indicating the model uncertainties in the cloud dynamics and thermodynamics. Impacts on Chemical Predictions As shown in Figure S1b, compared to W15, SEN1 predicts higher surface CO and SO 2, with domain averaged of 6.2 ppb and 0.06 ppb, respectively. The increased mixing ratios of CO and SO 2 are likely due to the lower chemical loss through oxidation by lower OH levels and less wet deposition resulted from lower precipitation in SEN1. The increase of surface mixing ratios of NO 2 over land is likely due to less wet deposition, and the decrease of surface mixing ratio of NO 2 over ocean is likely due to the vertical mixing over ocean (e.g., higher PBLH). The increase of surface O 3 mixing ratios over eastern land areas and east coast in SEN1 is likely due to the increase of NO 2 surface mixing ratios and the decrease of surface mixing ratios of O 3 over 6
7 remote ocean is likely due to the more convection in SEN1. The decrease of surface mixing ratio of O 3 over southwestern areas of the domain is likely due to the more chemical loss through oxidation with alkenes (e.g., isoprene and terpene) under more stable and warmer conditions over these regions. Compared to W15, SEN1 predicts higher SO 2-4 by up to 1.0 μg m -3 and lower SO 2-4 by up to 1.6 μg m -3. The increase of SO 2-4 over oceanic areas and some land areas is mainly due to the increase of surface mixing ratios of SO 2 and decrease of wet deposition. The decrease of SO 2-4 concentration over some land areas is mainly due to the decrease of chemical production from lower OH levels over these regions. The increase of SOA concentrations is mainly due to the increase of ASOA (by domain-average of 0.22 µg m -3 ) and BSOA (by domainaverage of 0.37 µg m -3 ). Higher concentrations of ASOA can be attributed to less wet deposition and higher gaseous precursors of SOA due to less wet deposition. Higher concentrations of BSOA can be attributed to less wet deposition and higher biogenic emissions resulted from higher SWD and T2 in SEN1. Compared to W15, SEN1 predicts higher PM 2.5 and PM 10 up to 4.9 µg m -3, with a domain averaged increase of 0.74 and 0.18 µg m -3, respectively. Unlike PM 2.5 concentrations that increase over most of the domain, the concentrations of PM 10 decrease over remote ocean, which is mainly due to the decrease of sea-salt concentrations resulted from lower WS10 in SEN1. Table S1b shows the statistical performance for chemical predictions. As total precipitation is reduced in SEN1, the concentrations of gases and aerosols are less underpredicted or more overpredicted, with better performance for surface SO 2 (with NMBs changed from -43.7% in W15 to -23.0% in SEN1 against SEARCH), EC (with NMBs changed from -71.2% in W15 to % in SEN1 against SEARCH), OC (with NMBs changed from -44.1% in W15 to -0.4% in SEN1 against SEARCH), TC (with NMBs changed from -16.2% in W15 to 1.0% in SEN1 7
8 against STN and from -40.3% in W15 to 1.5% in SEN1 against SEARCH), PM 2.5 (with NMBs changed from -22.2% in W15 to -12.0% in SNE1 against, and from -29.3% in W15 to -25.1% in SEN1 against STN), PM 10 (with NMBs changed from -65.4% in W15 to -62.1% in SEN1 against AIRS-AQS), and column SO 2 (with NMBs changed from -68.8% in W15 to -63.8% in SEN1 against SCIAMACHY). Compared to WRF-CMAQ simulations (Yu et al., 2014), SEN1 gives better agreement for SO 2-4, EC, and PM 2.5 against, and for SO 2-4 and NH + 4 against CASTNET. Chemical Predictions from SEN1 Figure S3 shows the monthly-averaged surface predictions of the concentrations of chemical species from SEN1, which serves as the baseline results for the absolute differences between SEN2 and SEN1 in Figure 6 and between SEN3 and SEN1 in Figure 7 in the main text of this manuscript in which those changes are discussed in detail. 8
9 Table S1a. Statistical Performance of Meteorological, Cloud, and Radiative Variables. W15 SEN1 SEN2 SEN3 Species/ Datasets obs NMB NME NMB NME NMB NME NMB NME Variables sim Corr sim Corr sim Corr sim Corr (%) (%) (%) (%) (%) (%) (%) (%) NCEI T2 ( o C) NDBC SEARCH RH2 (%) NCEI SEARCH NCEI WS10 (m s -1 ) 1 NDBC SEARCH GPCP (land) Precip GPCP (ocean) (mm day -1 ) TMPA (land) TMPA (ocean) SWD (W m -2 ) 3 CERES (land) CERES (ocean) CASTNET SEARCH OLR CERES (land) (W m -2 ) CERES (ocean) SWCF CERES (land) (W m -2 ) CERES (ocean) LWCF CERES (land) (W m -2 ) CERES (ocean) CF (%) CERES (land) CERES (ocean) COT CERES (land) CERES (ocean) LWP CERES (land) (g m -2 ) CERES (ocean) AOD MODIS (land) MODIS (ocean) CCN5 (10 8 cm -2 ) MODIS (ocean) CDNC Bennartz (2007) NARR (land) PBLH (m) NARR (ocean) SST ( o OAFlux (ocean) C) NDBC LHFLX (W m -2 ) OAFlux (ocean) SHFLX (W m -2 ) OAFlux (ocean)
10 Species/ Variables Table S1b. Statistical Performance of Chemical Species. W15 SEN1 SEN2 SEN3 Datasets obs NMB NME NMB NME NMB NME NMB NME sim Corr sim Corr sim Corr sim Corr (%) (%) (%) (%) (%) (%) (%) (%) CO SEARCH SO 2 CASTNET SEARCH NO 2 SEARCH HNO 3 CASTNET Max 1-h O 3 CASTNET AIRS-AQS Max 8-h O 3 CASTNET AIRS-AQS Hourly O 3 AIRS-AQS SEARCH STN NH 4 CASTNET SO 4 STN CASTNET NO 3 STN CASTNET Na Cl EC SEARCH OC SEARCH TC STN SEARCH PM 2.5 STN SEARCH PM 10 AIRS-AQS Col.CO MOPITT Col.NO 2 SCIMACHY Col. SO 2 SCIMACHY TOR OMI/MLS MODIS (land) AOD MODIS (ocean) * The units for all surface gaseous and aerosol species are μg m -3 except for CO (ppb), SO 2 (ppb), NO 2 (ppb) against SEARCH, and O 3 (ppb). The units for column CO and NO 2 are molecules cm -2 and for column SO 2 and TOR are DU. 10


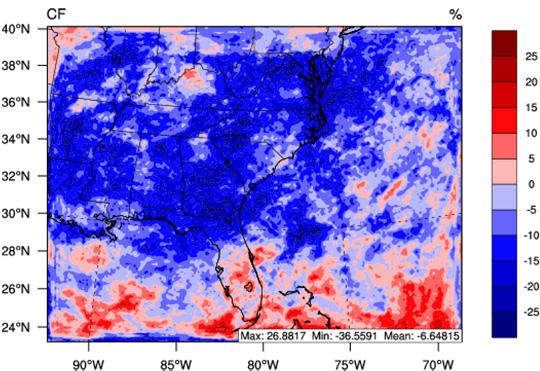


11 SEN1 W15 Figure S1a. Absolute differences in the monthly-averaged predictions of major meteorological and cloud/radiative variables between SEN1 and W15. 11


12 SEN1 W15 Figure S1b. Absolute differences in the monthly-averaged predictions of surface concentrations of chemical species between SEN1 and W15. 12
13 Beaufort (BFT142), NC (34.88, ), CASTNET Holiday ( ), FL (28.20, ), AQS Blackwater NWR (BWR139), MD (38.44, ), CASTNET St. Marks Wildlife Refuge ( ), FL (30.09, ), AQS Indian River Lagoon (IRL141), FL (27.85, ), CASTNET Gulfport Youth Court ( ), MS (30.39, ), AQS 13
14 Chassahowitzka (CHAS1), FL (28.75, ), Everglades (EVER1), FL (25.39, ), Brigantine (BRIG1), NJ (39.47, ), St. Marks (SAMA1), FL (30.09, ), 14
15 Cape Romain (ROMA1), SC (32.94, ), IMRPOVE Swanquarter (SWAN1), NC (35.45, ), Figure S2a. Comparison of simulated monthly-averaged temperature profiles with NCEP over coastal sites. 15
16 Beaufort (BFT142), NC (34.88, ), CASTNET Holiday ( ), FL (28.20, ), AQS Blackwater NWR (BWR139), MD (38.44, ), CASTNET St. Marks Wildlife Refuge ( ), FL (30.09, ), AQS Indian River Lagoon (IRL141), FL (27.85, ), CASTNET Gulfport Youth Court ( ), MS (30.39, ), AQS 16
17 Chassahowitzka (CHAS1), FL (28.75, ), Everglades (EVER1), FL (25.39, ), Brigantine (BRIG1), NJ (39.47, ), St. Marks (SAMA1), FL (30.09, ), 17
18 Cape Romain (ROMA1), SC (32.94, ), IMRPOVE Swanquarter (SWAN1), NC (35.45, ), Figure S2b. Comparison of simulated monthly-averaged specific humidity profiles with NCEP over coastal sites. 18


19 SEN1 Figure S3. Spatial distribution of surface concentrations of chemical species by SEN1 (WRF/Chem standalone without ocean coupling). 19
Impacts of Air-sea Interactions on Regional Air Quality Predictions Using a Coupled Atmosphere-ocean Model in Southeastern U.S.
 Aerosol and Air Quality Research, 18: 1044 1067, 2018 Copyright Taiwan Association for Aerosol Research ISSN: 1680-8584 print / 2071-1409 online doi: 10.4209/aaqr.2016.12.0570 Impacts of Air-sea Interactions
Source apportionment of fine particulate matter over the Eastern U.S. Part I. Source sensitivity simulations using CMAQ with the Brute Force method
 S1 SUPPORTING MATERIAL Source apportionment of fine particulate matter over the Eastern U.S. Part I. Source sensitivity simulations using CMAQ with the Brute Force method Michael Burr and Yang Zhang Department
ANALYSIS OF THE MPAS CONVECTIVE-PERMITTING PHYSICS SUITE IN THE TROPICS WITH DIFFERENT PARAMETERIZATIONS OF CONVECTION REMARKS AND MOTIVATIONS
 ANALYSIS OF THE MPAS CONVECTIVE-PERMITTING PHYSICS SUITE IN THE TROPICS WITH DIFFERENT PARAMETERIZATIONS OF CONVECTION Laura D. Fowler 1, Mary C. Barth 1, K. Alapaty 2, M. Branson 3, and D. Dazlich 3 1
Atmospheric Environment
 Atmospheric Environment 44 (2010) 2443e2456 Contents lists available at ScienceDirect Atmospheric Environment journal homepage: www.elsevier.com/locate/atmosenv Responses of future air quality to emission
Standalone simulations: CAM3, CAM4 and CAM5
 Standalone simulations: CAM3, and CAM5 CAM5 Model Development Team Cécile Hannay, Rich Neale, Andrew Gettelman, Sungsu Park, Joe Tribbia, Peter Lauritzen, Andrew Conley, Hugh Morrison, Phil Rasch, Steve
Application and Evaluation of the Global Weather Research and Forecasting (GWRF) Model
 Model") Application and Evaluation of the Global Weather Research and Forecasting (GWRF) Model Joshua Hemperly, Xin-Yu Wen, Nicholas Meskhidze, and Yang Zhang* Department of Marine, Earth, and Atmospheric Sciences,
Application and Evaluation of the Global Weather Research and Forecasting (GWRF) Model Joshua Hemperly, Xin-Yu Wen, Nicholas Meskhidze, and Yang Zhang* Department of Marine, Earth, and Atmospheric Sciences,
Incorporating Space-borne Observations to Improve Biogenic Emission Estimates in Texas (Project )
") Incorporating Space-borne Observations to Improve Biogenic Emission Estimates in Texas (Project 14-017) Arastoo Pour Biazar, Richard T. McNider, Andrew White University of Alabama in Huntsville Daniel
Incorporating Space-borne Observations to Improve Biogenic Emission Estimates in Texas (Project 14-017) Arastoo Pour Biazar, Richard T. McNider, Andrew White University of Alabama in Huntsville Daniel
Implementation and Testing of EQUISOLV II in the CMAQ Modeling System
 Implementation and Testing of EQULV II in the CMAQ Modeling System Yang Zhang North Carolina State University Mark Z. Jacobson Stanford University, Stanford, CA CMAQ, September 26-29, 25 Acknowledgments
5. General Circulation Models
 5. General Circulation Models I. 3-D Climate Models (General Circulation Models) To include the full three-dimensional aspect of climate, including the calculation of the dynamical transports, requires
The PRECIS Regional Climate Model
 The PRECIS Regional Climate Model General overview (1) The regional climate model (RCM) within PRECIS is a model of the atmosphere and land surface, of limited area and high resolution and locatable over
The Global Weather Research and Forecasting (GWRF) Model: Model Evaluation, Sensitivity Study, and Future Year Simulation
 Model: Model Evaluation, Sensitivity Study, and Future Year Simulation") Atmospheric and Climate Sciences, 2012, 2, 231-253 doi:10.4236/acs.2012.23024 Published Online July 2012 (http://www.scirp.org/journal/acs) The Global Weather Research and Forecasting (GWRF) Model: Model
Atmospheric and Climate Sciences, 2012, 2, 231-253 doi:10.4236/acs.2012.23024 Published Online July 2012 (http://www.scirp.org/journal/acs) The Global Weather Research and Forecasting (GWRF) Model: Model
Data Assimilation for Tropospheric CO. Avelino F. Arellano, Jr. Atmospheric Chemistry Division National Center for Atmospheric Research
 Data Assimilation for Tropospheric CO Avelino F. Arellano, Jr. Atmospheric Chemistry Division National Center for Atmospheric Research Caveat: Illustrative rather than quantitative, applied rather than
Direct radiative forcing due to aerosols in Asia during March 2002
 Direct radiative forcing due to aerosols in Asia during March 2002 Soon-Ung Park, Jae-In Jeong* Center for Atmospheric and Environmental Modeling *School of Earth and Environmental Sciences, Seoul National
Short-term modulation of Indian summer monsoon rainfall bywest Asian dust
 SUPPLEMENTARY INFORMATION DOI: 10.1038/NGEO2107 Short-term modulation of Indian summer monsoon rainfall bywest Asian dust 6 7 8 9 10 11 12 13 14 15 16 17 18 19 20 21 V Vinoj 1,2, Philip J Rasch 1*, Hailong
CHAPTER 8 NUMERICAL SIMULATIONS OF THE ITCZ OVER THE INDIAN OCEAN AND INDONESIA DURING A NORMAL YEAR AND DURING AN ENSO YEAR
 CHAPTER 8 NUMERICAL SIMULATIONS OF THE ITCZ OVER THE INDIAN OCEAN AND INDONESIA DURING A NORMAL YEAR AND DURING AN ENSO YEAR In this chapter, comparisons between the model-produced and analyzed streamlines,
Comprehensive Analysis of Annual 2005/2008 Simulation of WRF/CMAQ over Southeast of England
 Comprehensive Analysis of Annual 2005/2008 Simulation of WRF/CMAQ over Southeast of England The 13 th International Conference on Harmonization within Atmospheric Dispersion Modelling for Regulatory Purposes
How good are our models?
 direct Estimates of regional and global forcing: ^ How good are our models? Bill Collins with Andrew Conley, David Fillmore, and Phil Rasch National Center for Atmospheric Research Boulder, Colorado Models
Implications of Sulfate Aerosols on Clouds, Precipitation and Hydrological Cycle
 Implications of Sulfate Aerosols on Clouds, Precipitation and Hydrological Cycle Source: Sulfate aerosols are produced by chemical reactions in the atmosphere from gaseous precursors (with the exception
Sensitivity to the CAM candidate schemes in climate and forecast runs along the Pacific Cross-section
 Sensitivity to the CAM candidate schemes in climate and forecast runs along the Pacific Cross-section Cécile Hannay, Dave Williamson, Jerry Olson, Jim Hack, Jeff Kiehl, Richard Neale and Chris Bretherton*
The Atmosphere. All of it. In one hour. Mikael Witte 10/27/2010
 The Atmosphere All of it. In one hour. Mikael Witte 10/27/2010 Outline Structure Dynamics - heat transport Composition Trace constituent compounds Some Atmospheric Processes Ozone destruction in stratosphere
Responsibilities of Harvard Atmospheric Chemistry Modeling Group
 Responsibilities of Harvard Atmospheric Chemistry Modeling Group Loretta Mickley, Lu Shen, Daniel Jacob, and Rachel Silvern 2.1 Objective 1: Compile comprehensive air pollution, weather, emissions, and
6 th INTERNATIONAL WORKSHOP ON SAND/DUSTSTORMS AND ASSOCIATED DUSTFALL 7-9 September 2011, Athens, Greece
 6 th INTERNATIONAL WORKSHOP ON SAND/DUSTSTORMS AND ASSOCIATED DUSTFALL Motivations Importance of Numerical Prediction Models to mineral dust cycle evaluation of dust effects over Italian region Identify
1.7 APPLICATION AND EVALUATION OF MM5 FOR NORTH CAROLINA WITH A 4-KM HORIZONTAL GRID SPACING
 .7 APPLICATION AND EVALUATION OF MM5 FOR NORTH CAROLINA WITH A 4-KM HORIZONTAL GRID SPACING Srinath Krishnan, Shiang-Yuh Wu 2, Danny Hamilton, Yang Zhang, and Viney P. Aneja Department of Marine, Earth
Satellite analysis of aerosol indirect effect on stratocumulus clouds over South-East Atlantic
 1/23 Remote sensing of atmospheric aerosol, clouds and aerosol-cloud interactions. Bremen, 16-19 December 2013 Satellite analysis of aerosol indirect effect on stratocumulus clouds over South-East Atlantic
Evaluating parameterized variables in the Community Atmospheric Model along the GCSS Pacific cross-section
 Evaluating parameterized variables in the Community Atmospheric Model along the GCSS Pacific cross-section Cécile Hannay, Dave Williamson, Rich Neale, Jerry Olson, Dennis Shea National Center for Atmospheric
Understanding land-surfaceatmosphere. observations and models
 Understanding land-surfaceatmosphere coupling in observations and models Alan K. Betts Atmospheric Research akbetts@aol.com MERRA Workshop AMS Conference, Phoenix January 11, 2009 Land-surface-atmosphere
Sensitivity to the PBL and convective schemes in forecasts with CAM along the Pacific Cross-section
 Sensitivity to the PBL and convective schemes in forecasts with CAM along the Pacific Cross-section Cécile Hannay, Jeff Kiehl, Dave Williamson, Jerry Olson, Jim Hack, Richard Neale and Chris Bretherton*
A synthesis of published VOCALS studies on marine boundary layer and cloud structure along 20S
 A synthesis of published VOCALS studies on marine boundary layer and cloud structure along 20S Chris Bretherton Department of Atmospheric Sciences University of Washington VOCALS RF05, 72W 20S Work summarized
Understanding the importance of chemistry representation in CESM1-CAM5
 Understanding the importance of chemistry representation in CESM1-CAM5 Simone Tilmes, Jean-Francois Lamarque, Louisa Emmons, CAM-chem team Radiative impact of different chemistry descriptions Improved
The Role of Post Cold Frontal Cumulus Clouds in an Extratropical Cyclone Case Study
 The Role of Post Cold Frontal Cumulus Clouds in an Extratropical Cyclone Case Study Amanda M. Sheffield and Susan C. van den Heever Colorado State University Dynamics and Predictability of Middle Latitude
The effects of dust emission on the trans- Pacific transport of Asian dust in the CESM
 The effects of dust emission on the trans- Pacific transport of Asian dust in the CESM Mingxuan Wu, Xiaohong Liu, Zhien Wang, Kang Yang, Chenglai Wu University of Wyoming Kai Zhang, Hailong Wang Pacific
Utilization of Geostationary Satellite Observations for Air Quality Modeling During 2013 Discover-AQ Texas Campaign
 Utilization of Geostationary Satellite Observations for Air Quality Modeling During 2013 Discover-AQ Texas Campaign Arastoo Pour Biazar 1, Andrew White 1, Daniel Cohan 2, Rui Zhang 2, Maudood Khan 1, Bright
ESM development at the Met Office Hadley Centre
 ENSEMBLES RT1/RT2A Meeting ECMWF, 8-9 th Jun 2006 ESM development at the Met Office Hadley Centre Tim Johns, and HadGEM model development teams Crown copyright Page 1 Model Development Timeline: HadGEM1a/GEM2/GEM2ES
A review of VOCALS Hypothesis. VOCALS Science Meeting July 2009 Seattle Washington C. R. Mechoso, UCLA
 A review of VOCALS Hypothesis VOCALS Science Meeting 12-14 July 2009 Seattle Washington C. R. Mechoso, UCLA VOCALS Strategy MODELING Operational Centers, Reseach Institutions, Universities REx AIRBORNE
Aerosol-Cloud-Climate Interaction: A Case Study from the Indian Ocean. Sagnik Dey
 Aerosol-Cloud-Climate Interaction: A Case Study from the Indian Ocean Sagnik Dey Centre for Atmospheric Sciences Indian Institute of Technology Delhi sagnik@cas.iitd.ac.in Content Background and Motivation
Regional Climate Simulations with WRF Model
 WDS'3 Proceedings of Contributed Papers, Part III, 8 84, 23. ISBN 978-8-737852-8 MATFYZPRESS Regional Climate Simulations with WRF Model J. Karlický Charles University in Prague, Faculty of Mathematics
Kalimantan realistically (Figs. 8.23a-d). Also, the wind speeds of the westerly
. Also, the wind speeds of the westerly") suppressed rainfall rate (maximum vertical velocity) around 17 LST (Figs. 8.21a-b). These results are in agreement with previous studies (e. g., Emanuel and Raymond 1994). The diurnal variation of maximum
suppressed rainfall rate (maximum vertical velocity) around 17 LST (Figs. 8.21a-b). These results are in agreement with previous studies (e. g., Emanuel and Raymond 1994). The diurnal variation of maximum
Arctic System Reanalysis Provides Highresolution Accuracy for Arctic Studies
 Arctic System Reanalysis Provides Highresolution Accuracy for Arctic Studies David H. Bromwich, Aaron Wilson, Lesheng Bai, Zhiquan Liu POLAR2018 Davos, Switzerland Arctic System Reanalysis Regional reanalysis
Supplemental Material for Transient climate impacts for scenarios of aerosol emissions from Asia: a story of coal versus gas
 Supplemental Material for Transient climate impacts for scenarios of aerosol emissions from Asia: a story of coal versus gas B. S. Grandey, H. Cheng, and C. Wang December 22, 2015 List of Tables 1 Annual
Rich Neale, Peter Caldwell, Christiane Jablonowski and Cecile Hannay
 Rich Neale, Peter Caldwell, Christiane Jablonowski and Cecile Hannay and many, many others! AMP/CGD National Center for Atmospheric Research Boulder, Colorado 1 Rich Neale 2010 Julio Bacmeister 2 AIM:
Correspondence between short and long timescale systematic errors in CAM4/CAM5 explored by YOTC data
 Correspondence between short and long timescale systematic errors in CAM4/CAM5 explored by YOTC data Hsi-Yen Ma In collaboration with Shaocheng Xie, James Boyle, Stephen Klein, and Yuying Zhang Program
Updated Dust-Iron Dissolution Mechanism: Effects Of Organic Acids, Photolysis, and Dust Mineralogy
 Updated Dust-Iron Dissolution Mechanism: Effects Of Organic Acids, Photolysis, and Dust Mineralogy Nicholas Meskhidze & Matthew Johnson First International Workshop on the Long Range Transport and Impacts
Nathan Hosannah. Advisor Professor J. E. Gonzalez
 Nathan Hosannah nhosannah@gmail.com Advisor Professor J. E. Gonzalez Department of Mechanical Engineering, NOAA CREST Center CCNY / Graduate-Center, CUNY This study was supported and monitored National
Atmosphere-Ocean-Land Interaction Theme. VOCALS Preparatory Workshop - NCAR, May 18-29, 2007
 Atmosphere-Ocean-Land Interaction Theme VOCALS Preparatory Workshop - NCAR, May 18-29, 2007 The Southeastern Pacific Cloud-topped ABLs, with mesoscale structures Influenced by and influential on remote
Progress on Application of Modal Aerosol Dynamics to CAM
 Progress on Application of Modal Aerosol Dynamics to CAM Xiaohong Liu, Steve Ghan, Richard Easter, Rahul Zaveri, Yun Qian (Pacific Northwest National Laboratory) Jean-Francois Lamarque, Peter Hess, Natalie
Putting Secondary Organic Aerosol in Global Models. Issues and Approaches
 Putting Secondary Organic Aerosol in Global Models (and FRP s) Issues and Approaches Dean Hegg (University of Washington) Walter Sessions (NRL Monterey) Outline of Talk 1. The necessity of dealing with
4.4 EVALUATION OF AN IMPROVED CONVECTION TRIGGERING MECHANISM IN THE NCAR COMMUNITY ATMOSPHERE MODEL CAM2 UNDER CAPT FRAMEWORK
 . EVALUATION OF AN IMPROVED CONVECTION TRIGGERING MECHANISM IN THE NCAR COMMUNITY ATMOSPHERE MODEL CAM UNDER CAPT FRAMEWORK Shaocheng Xie, James S. Boyle, Richard T. Cederwall, and Gerald L. Potter Atmospheric
Influence of clouds on radiative fluxes in the Arctic. J. English, J. Kay, A. Gettelman CESM Workshop / PCWG Meeting June 20, 2012
 Influence of clouds on radiative fluxes in the Arctic J. English, J. Kay, A. Gettelman CESM Workshop / PCWG Meeting June 20, 2012 The complexity of arctic clouds Arctic Mixed-Phase Clouds Morrison et al.,
Modelling aerosol-cloud interations in GCMs
 Modelling aerosol-cloud interations in GCMs Ulrike Lohmann ETH Zurich Institute for Atmospheric and Climate Science Reading, 13.11.2006 Acknowledgements: Sylvaine Ferrachat, Corinna Hoose, Erich Roeckner,
Atmospheric Composition Matters: To Air Quality, Weather, Climate and More
 Atmospheric Composition Matters: To Air Quality, Weather, Climate and More Burkholder et al., ES&T, 2017 2 Overarching Research Need: Improve Prediction Capabilities via Incorporating/Integrating Composition,
Numerical simulation of marine stratocumulus clouds Andreas Chlond
 Numerical simulation of marine stratocumulus clouds Andreas Chlond Marine stratus and stratocumulus cloud (MSC), which usually forms from 500 to 1000 m above the ocean surface and is a few hundred meters
Sungsu Park, Chris Bretherton, and Phil Rasch
 Improvements in CAM5 : Moist Turbulence, Shallow Convection, and Cloud Macrophysics AMWG Meeting Feb. 10. 2010 Sungsu Park, Chris Bretherton, and Phil Rasch CGD.NCAR University of Washington, Seattle,
Air Quality Screening Modeling
 Air Quality Screening Modeling 2007 Meteorology Simulation with WRF OTC Modeling Committee Meeting September 16, 2010 Baltimore, MD Presentation is based upon the following technical reports available
AEROCOM-Workshop,Paris, June 2-3, model. Øyvind Seland; Alf Kirkevåg
 An AGCM operated at University of Oslo (UiO) Norway Øyvind Seland; Alf Kirkevåg AEROCOM-Workshop,Paris, June 2-3, 2003 by Kirkevåg; Jón Egill Kristjánsson; ; Trond Iversen Basic: NCAR-CCM3.2 CCM3.2 (Kiehl,et
Model error and seasonal forecasting
 Model error and seasonal forecasting Antje Weisheimer European Centre for Medium-Range Weather Forecasts ECMWF, Reading, UK with thanks to Paco Doblas-Reyes and Tim Palmer Model error and model uncertainty
The Regional Arctic System Model (RASM) for Studying High Resolution Climate Changes in the Arctic
 for Studying High Resolution Climate Changes in the Arctic") The Regional Arctic System Model (RASM) for Studying High Resolution Climate Changes in the Arctic Mark W. Seefeldt, John J. Cassano, Alice K. Duvivier, and Mimi H. Hughes University of Colorado Boulder
The Regional Arctic System Model (RASM) for Studying High Resolution Climate Changes in the Arctic Mark W. Seefeldt, John J. Cassano, Alice K. Duvivier, and Mimi H. Hughes University of Colorado Boulder
Development and Implementation of Universal Cloud/Radiation Parameterizations in Navy Operational Forecast Models
 DISTRIBUTION STATEMENT A. Approved for public release; distribution is unlimited. Development and Implementation of Universal Cloud/Radiation Parameterizations in Navy Operational Forecast Models Harshvardhan
ATM S 111: Global Warming Climate Feedbacks. Jennifer Fletcher Day 7: June
 ATM S 111: Global Warming Climate Feedbacks Jennifer Fletcher Day 7: June 29 2010 Climate Feedbacks Things that might change when the climate gets warmer or colder and in turn change the climate. We ll
The Climate Sensitivity of the Community Climate System Model Version 3 (CCSM3)
") 2584 J O U R N A L O F C L I M A T E VOLUME 19 The Climate Sensitivity of the Community Climate System Model Version 3 (CCSM3) JEFFREY T. KIEHL, CHRISTINE A. SHIELDS, JAMES J. HACK, AND WILLIAM D. COLLINS
2584 J O U R N A L O F C L I M A T E VOLUME 19 The Climate Sensitivity of the Community Climate System Model Version 3 (CCSM3) JEFFREY T. KIEHL, CHRISTINE A. SHIELDS, JAMES J. HACK, AND WILLIAM D. COLLINS
Clouds in the Climate System: Why is this such a difficult problem, and where do we go from here?
 Clouds in the Climate System: Why is this such a difficult problem, and where do we go from here? Joel Norris Scripps Institution of Oceanography CERES Science Team Meeting April 29, 2009 Collaborators
THE INFLUENCE OF HIGHLY RESOLVED SEA SURFACE TEMPERATURES ON METEOROLOGICAL SIMULATIONS OFF THE SOUTHEAST US COAST
 THE INFLUENCE OF HIGHLY RESOLVED SEA SURFACE TEMPERATURES ON METEOROLOGICAL SIMULATIONS OFF THE SOUTHEAST US COAST Peter Childs, Sethu Raman, and Ryan Boyles State Climate Office of North Carolina and
Aerosol modeling with WRF/Chem
 Aerosol modeling with WRF/Chem Jan Kazil University of Colorado / NOAA Earth System Research Laboratory WRF/Chem Tutorial, 3 August 2015 (WRF/Chem 3.7) Part I - Introduction Overview of... Aerosol Aerosol
Monitoring Climate Change from Space
 Monitoring Climate Change from Space Richard Allan (email: r.p.allan@reading.ac.uk twitter: @rpallanuk) Department of Meteorology, University of Reading Why Monitor Earth s Climate from Space? Global Spectrum
How Will Low Clouds Respond to Global Warming?
 How Will Low Clouds Respond to Global Warming? By Axel Lauer & Kevin Hamilton CCSM3 UKMO HadCM3 UKMO HadGEM1 iram 2 ECHAM5/MPI OM 3 MIROC3.2(hires) 25 IPSL CM4 5 INM CM3. 4 FGOALS g1. 7 GISS ER 6 GISS
Climate change outlook over the Mediterranean from the science respective
 Climate change outlook over the Mediterranean from the science respective Ashraf Zakey(1), F. Giorgi(2) (1) The Egyptian Meteorological Authority (2) The International Center for Theoretical Physics (ICTP)-Italy
National Center for Atmospheric Research,* Boulder, Colorado S. J. GHAN. Pacific Northwest National Laboratory, Richland, Washington
 3660 J O U R N A L O F C L I M A T E VOLUME 21 A New Two-Moment Bulk Stratiform Cloud Microphysics Scheme in the Community Atmosphere Model, Version 3 (CAM3). Part II: Single-Column and Global Results
Toward improved initial conditions for NCAR s real-time convection-allowing ensemble. Ryan Sobash, Glen Romine, Craig Schwartz, and Kate Fossell
 Toward improved initial conditions for NCAR s real-time convection-allowing ensemble Ryan Sobash, Glen Romine, Craig Schwartz, and Kate Fossell Storm-scale ensemble design Can an EnKF be used to initialize
Introduction to HadGEM2-ES. Crown copyright Met Office
 Introduction to HadGEM2-ES Earth System Modelling How the climate will evolve depends on feedbacks Ecosystems Aerosols Chemistry Global-scale impacts require ES components Surface temperature Insolation
CHAPTER 8. AEROSOLS 8.1 SOURCES AND SINKS OF AEROSOLS
 1 CHAPTER 8 AEROSOLS Aerosols in the atmosphere have several important environmental effects They are a respiratory health hazard at the high concentrations found in urban environments They scatter and
Satellite-based estimate of global aerosol-cloud radiative forcing by marine warm clouds
 SUPPLEMENTARY INFORMATION DOI: 10.1038/NGEO2214 Satellite-based estimate of global aerosol-cloud radiative forcing by marine warm clouds Y.-C. Chen, M. W. Christensen, G. L. Stephens, and J. H. Seinfeld
Air sea satellite flux datasets and what they do (and don't) tell us about the air sea interface in the Southern Ocean
 tell us about the air sea interface in the Southern Ocean") Air sea satellite flux datasets and what they do (and don't) tell us about the air sea interface in the Southern Ocean Carol Anne Clayson Woods Hole Oceanographic Institution Southern Ocean Workshop Seattle,
Air sea satellite flux datasets and what they do (and don't) tell us about the air sea interface in the Southern Ocean Carol Anne Clayson Woods Hole Oceanographic Institution Southern Ocean Workshop Seattle,
The Effect of Future Climate Change on Aerosols: Biogenic SOA and Inorganics
 The Effect of Future Climate Change on Aerosols: Biogenic SOA and Inorganics GCAP Phase 2 Science Team Meeting October 12, 2007 Havala O. T. Pye 1, Hong Liao 2, John Seinfeld 1, Shiliang Wu 3, Loretta
The Atmospheric Boundary Layer. The Surface Energy Balance (9.2)
") The Atmospheric Boundary Layer Turbulence (9.1) The Surface Energy Balance (9.2) Vertical Structure (9.3) Evolution (9.4) Special Effects (9.5) The Boundary Layer in Context (9.6) What processes control
The Atmospheric Boundary Layer Turbulence (9.1) The Surface Energy Balance (9.2) Vertical Structure (9.3) Evolution (9.4) Special Effects (9.5) The Boundary Layer in Context (9.6) What processes control
Aerosol Dynamics. Antti Lauri NetFAM Summer School Zelenogorsk, 9 July 2008
 Aerosol Dynamics Antti Lauri NetFAM Summer School Zelenogorsk, 9 July 2008 Department of Physics, Division of Atmospheric Sciences and Geophysics, University of Helsinki Aerosol Dynamics: What? A way to
Can a change of single scattering albedo in Amami-Oshima in a low pressure condition be explained by GCM simulations?
 Can a change of single scattering albedo in Amami-Oshima in a low pressure condition be explained by GCM simulations? Daisuke Goto 1, Toshihiko Takemura 2, Nick Schutgens 1, Haruo Tsuruta 1, and Teruyuki
NSF 2005 CPT Report. Jeffrey T. Kiehl & Cecile Hannay
 NSF 2005 CPT Report Jeffrey T. Kiehl & Cecile Hannay Introduction: The focus of our research is on the role of low tropical clouds in affecting climate sensitivity. Comparison of climate simulations between
Parameterization of Cumulus Convective Cloud Systems in Mesoscale Forecast Models
 DISTRIBUTION STATEMENT A. Approved for public release; distribution is unlimited. Parameterization of Cumulus Convective Cloud Systems in Mesoscale Forecast Models Yefim L. Kogan Cooperative Institute
Oceanic Eddies in the VOCALS Region of the Southeast Pacific Ocean
 Oceanic Eddies in the VOCALS Region of the Southeast Pacific Ocean Outline: Overview of VOCALS Dudley B. Chelton Oregon State University Overview of the oceanographic component of VOCALS Preliminary analysis
Supplement of Insignificant effect of climate change on winter haze pollution in Beijing
 Supplement of Atmos. Chem. Phys., 18, 17489 17496, 2018 https://doi.org/10.5194/acp-18-17489-2018-supplement Author(s) 2018. This work is distributed under the Creative Commons Attribution 4.0 License.
Recent Performance of the NOAA Air Quality Forecasting Capability and the Impact of Driving Meteorology
 Recent Performance of the NOAA Air Quality Forecasting Capability and the Impact of Driving Meteorology http://www.emc.ncep.noaa.gov/mmb/aq Jeff McQueen, Jianping Huang, Ho-Chun Huang, Perry Shafran NCEP/EMC
Land-cloud-climate Coupling on the Canadian Prairies
 Land-cloud-climate Coupling on the Canadian Prairies Dr. Alan K. Betts (Atmospheric Research, Pittsford, VT 05763) Ray Desjardin, D. Cerkowniak (Agriculture-Canada) and Ahmed Tawfik (NCAR) akbetts@aol.com
Evaluation of Satellite and Reanalysis Products of Downward Surface Solar Radiation over East Asia
 International Workshop on Land Use/Cover Changes and Air Pollution in Asia August 4-7th, 2015, Bogor, Indonesia Evaluation of Satellite and Reanalysis Products of Downward Surface Solar Radiation over
Klimaänderung. Robert Sausen Deutsches Zentrum für Luft- und Raumfahrt Institut für Physik der Atmosphäre Oberpfaffenhofen
 Klimaänderung Robert Sausen Deutsches Zentrum für Luft- und Raumfahrt Institut für Physik der Atmosphäre Oberpfaffenhofen Vorlesung WS 2017/18 LMU München 7. Wolken und Aerosole Contents of IPCC 2013 Working
An Introduction to Climate Modeling
 An Introduction to Climate Modeling A. Gettelman & J. J. Hack National Center for Atmospheric Research Boulder, Colorado USA Outline What is Climate & why do we care Hierarchy of atmospheric modeling strategies
The Importance of Ammonia in Modeling Atmospheric Transport and Deposition of Air Pollution. Organization of Talk:
 The Importance of Ammonia in Modeling Atmospheric Transport and Deposition of Air Pollution Organization of Talk: What is modeled Importance of NH 3 emissions to deposition Status of NH 3 emissions (model-based)
Characterizing Clouds and Convection Associated with the MJO Using the Year of Tropical Convection (YOTC) Collocated A-Train and ECMWF Data Set
 Collocated A-Train and ECMWF Data Set") Characterizing Clouds and Convection Associated with the MJO Using the Year of Tropical Convection (YOTC) Collocated A-Train and ECMWF Data Set Wei-Ting Chen Department of Atmospheric Sciences, National
Characterizing Clouds and Convection Associated with the MJO Using the Year of Tropical Convection (YOTC) Collocated A-Train and ECMWF Data Set Wei-Ting Chen Department of Atmospheric Sciences, National
The Interaction between Climate Forcing and Feedbacks From the global scale to the process level
 The Interaction between Climate Forcing and Feedbacks From the global scale to the process level A. Gettelman (NCAR), L. Lin (U. Lanzhou), B. Medeiros, J. Olson (NCAR) The interaction of Forcing & Feedbacks
A Global Atmospheric Model. Joe Tribbia NCAR Turbulence Summer School July 2008
 A Global Atmospheric Model Joe Tribbia NCAR Turbulence Summer School July 2008 Outline Broad overview of what is in a global climate/weather model of the atmosphere Spectral dynamical core Some results-climate
Polar Weather Prediction
 Polar Weather Prediction David H. Bromwich Session V YOPP Modelling Component Tuesday 14 July 2015 A special thanks to the following contributors: Kevin W. Manning, Jordan G. Powers, Keith M. Hines, Dan
Polar WRF. Polar Meteorology Group Byrd Polar and Climate Research Center The Ohio State University Columbus Ohio
 Polar WRF David H. Bromwich, Keith M. Hines, Lesheng Bai and Sheng-Hung Wang Polar Meteorology Group Byrd Polar and Climate Research Center The Ohio State University Columbus Ohio Byrd Polar and Climate
ESA-CCI CMUG Workpackages
 ESA-CCI CMUG Workpackages WP3.9 Assessments of glaciers, land cover and sea-level data for hydrological modelling of the Arctic ocean drainage basi n WP3.8 Cross-assessments of clouds, soil moisture, water
Biogenic aerosols and their interactions with climate. Yuzhong Zhang
 Biogenic aerosols and their interactions with climate Yuzhong Zhang 2011.4.4 Biogenic aerosols and their interactions with climate 1. OVERVIEW OF BIOGENIC AEROSOL Definition and categories Why important?
Presented at the NADP Technical Meeting and Scientific Symposium October 16, 2008
 Future Climate Scenarios, Atmospheric Deposition and Precipitation Uncertainty Alice B. Gilliland, Kristen Foley, Chris Nolte, and Steve Howard Atmospheric Modeling Division, National Exposure Research
Effect of Scale Coupling Frequency! on Simulated Climatology! in the Uncoupled SPCAM 3.0
 CMMAP Winter 215 Team Meeting Effect of Scale Coupling Frequency on Simulated Climatology in the Uncoupled SPCAM 3. Sungduk Yu (sungduk@uci.edu) and Mike Pritchard UC Irvine (Special thanks to Gabe Kooperman
STATION If relative humidity is 60% and saturation vapor pressure is 35 mb, what is the actual vapor pressure?
 STATION 1 Vapor pressure is a measure of relative humidity and saturation vapor pressure. Using this information and the information given in the problem, answer the following question. 1. If relative
The Climatology of Clouds using surface observations. S.G. Warren and C.J. Hahn Encyclopedia of Atmospheric Sciences.
 The Climatology of Clouds using surface observations S.G. Warren and C.J. Hahn Encyclopedia of Atmospheric Sciences Gill-Ran Jeong Cloud Climatology The time-averaged geographical distribution of cloud
What is the IPCC? Intergovernmental Panel on Climate Change
 IPCC WG1 FAQ What is the IPCC? Intergovernmental Panel on Climate Change The IPCC is a scientific intergovernmental body set up by the World Meteorological Organization (WMO) and by the United Nations
Introduction to aerosol modeling with WRF/Chem
 Introduction to aerosol modeling with WRF/Chem Jan Kazil University of Colorado/National Oceanic and Atmospheric Administration Outline 1. Aerosols in the atmosphere: Sources Processes Interaction with
TROPICAL-EXTRATROPICAL INTERACTIONS
 Notes of the tutorial lectures for the Natural Sciences part by Alice Grimm Fourth lecture TROPICAL-EXTRATROPICAL INTERACTIONS Anomalous tropical SST Anomalous convection Anomalous latent heat source Anomalous
Improved Representation of Boundary Layer Clouds over the Southeast Pacific in ARW-WRF Using a Modified Tiedtke Cumulus Parameterization Scheme*
 NOVEMBER 2011 Z H A N G E T A L. 3489 Improved Representation of Boundary Layer Clouds over the Southeast Pacific in ARW-WRF Using a Modified Tiedtke Cumulus Parameterization Scheme* CHUNXI ZHANG, YUQING