Satellite-observed Snow Covered Area in the HBV-model
|
|
|
- John Randall
- 5 years ago
- Views:
Transcription
1 Satellite-observed Snow Covered Area in the HBV-model Final report The DemoSnow project Norwegian Space Centre contract JOP Norwegian Water Resources and Energy Directorate 22
2 Consultancy report Series A no 6 Satellite-observed Snow Covered Area in the HBV-model Publisher: Authors: Norwegian Water Resources and Energy Directorate Rune V. Engeset and Hans-Christian Udnæs Print: Copies: 25 Pages: 32 Front page illustration: NVE ISSN: Snow covered area (SCA) observed by three different satellite sensors over Jotunheimen on 3 and 4 May 2. Summary: Key words: Spring snowmelt contributes significantly to floods with severe damages as the results, and updated snow information is very important to the Norwegian flood forecasting services, which uses the HBV-model to simulate runoff. Satellite imagery is used to observe the snow covered area (SCA), but these observations are not used directly in the hydrological simulations. This study assessed if runoff simulations could improve by application of satellite-derived snow data in the operational models, using both optical and radar satellite data. Three catchments in Jotunheimen, south Norway, were studied using eight years of data ( ). The results show that satellite-observed SCA can be used to detect when the models do not simulate the snow reservoir correctly. Error detection early in the melt season helps the services to update and correct the models well in advance of damage floods. The method requires the models to be calibrated against SCA in addition to runoff. Data from the satellite sensors NOAA AVHRR and ERS SAR were used, of which AVHRR showed relatively good correlation with simulated SCA, but SAR at times showed high deviations. Comparison of simultaneous data from May 2 from the sensors AVHRR, SAR, Terra MODIS and Landsat ETM+ showed good correlation. Of a total area of 188 km 2, AVHRR observed a SCA of 823 km 2 and SAR 72 km 2, as compared to 889 km 2 using ETM+. Snow, Satellite, Runoff Norwegian Water Resources and Energy Directorate Middelthuns gate 29 Box 591 Majorstua N-31 OSLO Telephone: Fax: Internet: 1 September 22 2
3 Contents Preface... 4 Summary Introduction Study area and data Study catchments and hydrological data Satellite data Methods SCA-retrieval from satellite data SCA-retrieval methods Comparison of SCA maps from different sensors The HBV-model SCA used in the HBV-model SCA evaluation, selection and processing Model calibration Model simulations Model updating Results and discussion Pilot study SCA data evaluation, selection and conversion Model calibration Model simulation Model updating Updating the snow reservoir by input data correction Updating using assembly selection Demonstration Conclusions References Annexes
4 Preface The Norwegian Space Centre contributed half of the project costs and the project participants financed the rest (in total KNOK 564). The project was leaded by NVE, who participated together with the Norwegian Computing Centre and Norut IT. Liss M. Andreassen, and later Rune V. Engeset, NVE, lead the project. Project participants included Hans-Christian Udnæs and Eli Alfnes from NVE, Rune Solberg and Hans Koren from NR, and Tore Guneriussen and Erik Malnes from Norut IT. This report documents the project work and results, and is complemented by project reports by NR on optical image processing and by Norut IT on radar image processing. Oslo, 1 September 22 Kjell Repp Director Erik Roland Section manager 4
5 Summary Snowmelt during the spring often contributes significantly to floods with severe damages as the results. An example is the large flood in south-east Norway in Thus, updated information on the snow conditions is very important to the national flood forecasting and preparedness services at NVE. At present, the HBV-model is used to simulate runoff in our river systems and satellite imagery are used to observe the snow covered area (SCA). However, the observed SCA is not used directly in the model simulations. The objective of this project was to assess if runoff simulations could be improved by application of satellite-derived snow data in the operational models, using both optical and radar satellite data. The HBV models used by the services were used to study three catchments in Jotunheimen, south Norway using eight years of data ( ). The results show that satellite-observed SCA can be used for detecting when the hydrological models do not simulate the snow reservoir correctly. This is detected early in the melt season, helping the services to update and correct the models well in advance of damage floods later in the spring and summer. This makes the forecasting better and more precise, in particular during years when the snow reservoir deviates from the normal situation. A reason for having errors in the simulations is that observed precipitation and temperature do not represent the actual situation in the catchment. As a consequence, the models simulate a too large or too small snow volume or snow covered area, which is discovered when compared to the satellite observations. A prerequisite for detecting such deviations is that the models are calibrated against SCA in addition to runoff. SCA is presently the only model variable that may be observed relatively simply and efficiently over catchments with little forest. The satellite sensors NOAA AVHRR and ERS SAR were used to derive time series of SCA. AVHRR-based data showed relatively good correlation with simulated SCA (deviation less than 1%). SAR-based data showed at times high deviation, which may be due to the problem of detecting dry snow. A comparison of simultaneous data (May 22) from four satellites (NOAA AVHRR, Terra MODIS, ERS SAR and Landsat ETM+) gave a relatively good correlation. Of a total area of 188 km 2 the SCA was observed as 823 km 2 using AVHRR and 72 km 2 using SAR, as compared to 889 km 2 using the ETM+ sensor, which was consider the reference. Further work on improved satellite-based observation of snow extent, water equivalent, albedo and temperature is carried out together with development of new and better hydrological models. This work is carried out under the Norwegian Research Council project SnowMan ( and the EU-projects EnviSnow ( and EuroClim (euroclim.nr.no). 5
6 1 Introduction The Norwegian Water Resources and Energy Directorate (NVE), the Norwegian Computing Centre (NR) and Norut IT carried out the project (see Figure 1). The objective of the project was to improve simulation of runoff using satellite-observed snow covered area (SCA) in an operational model. Five work packages were identified: WP Administration The project was managed by NVE. WP1 Selection of study catchments Three catchments were selected based on catchment characteristics, and the availability of hydrological, meteorological and satellite data. Mountain catchments are selected in order to reduce the uncertainty caused by vegetation. Four years of runoff and satellite data should be available at a weekly rate during the melt season. WP2 Data processing Historic satellite data covering the test catchments are transformed to a map projection and snow covered area (SCA) calculated for 1km * 1km or higher resolution. A total of approx. 12 optical and 12 radar images are processed for each catchment. WP3 Model calibration HBV models are calibrated for each test catchment using a period of minimum three years. The models are calibrated against both runoff and satellite-derived SCA. Models calibrated against runoff only are used for comparison in WP4. WP4 Simulation and assessment Model simulations are carried out for at least one independent year. Satellite-derived SCA is used for model SCA updating. Simulation of high-flow runoff is assessed in particular. Project flow Study catchment selection NVE EO data selection NVE, NR, Norut Requirements vs. availability SCA timeseries from SAR Norut SCA timeseries from AVHRR NR SCA reference maps NR - ETM+ - MODIS SCA timeseries evaluation and model calibration NVE SCA maps comparison NVE, NR, Norut Outputs: 2 reports: Optical and SAR Model simulation and assessment NVE Outputs: Project report and demonstration Figure 1 Project flow chart and deliverables. 6
7 2 Study area and data 2.1 Study catchments and hydrological data The three test catchments Akslen, Sjodalsvatn and Vinde-elv were selected for the study, all located in the mountains in southern Norway (Figure 2). Meteorological stations were used for each catchment providing daily values of air temperature and precipitation. At the outlet defining each catchment, a runoff gauge provided daily discharge values. The catchment and data characteristics are listed in Table Akslen 2.13 Sjodalsvatn Akslen Sjodalsvatn Vinde-elv Vinde-elv Figure 2 Location map of test catchments. Table 1 Catchment characteristics and meteorological stations Akslen 2.13 Sjodalsvatn Vinde-elv SCA range (%) 1-75 SCA range (%) 5-75 SCA range (%) -75 Area (km2) 791 Area (km2) 474 Area (km2) 268 Min elev. (m) 48 Min elev. (m) 94 Min elev. (m) 56 Med elev. (m) 1476 Med elev. (m) 1461 Med elev. (m) 985 Max elev. (m) 2472 Max elev. (m) 24 Max elev. (m) 168 Forest area (%) 13 Forest area (%) 5 Forest area (%) 31 Glacier area (%) 12 Glacier area (%) 9 Glacier area (%) Lake area (%) 2 Lake area (%) 9 Lake area (%) 7 Mean flood (m3/s) 183 Mean flood (m3/s) 149 Mean flood (m3/s) 54 5-y flood (m3/s) y flood (m3/s) y flood (m3/s) 7 5-y flood (m3/s) y flood (m3/s) 39 5-y flood (m3/s) 113 Meteorological stations: Meteorological stations: Meteorological station: T: 1543 Bøverdal T: 1367 Skåbu-Storslåen 2342 Fagernes 71 m a.s.l. 89 m a.s.l. 365 m a.s.l. P: 1573/2 Bråta P: 1367 Skåbu-Storslåen 664 m a.s.l. 89 m a.s.l. P: 1543 Bøverdal 71 m a.s.l. 7
8 Akslen Test site 1 Akslen (791 km 2 ) drains to the river Bøvra (Figure 3), where discharge (Figure 4) has been observed at gauge Akslen since The catchment ranges from 48 to 2472 m a.s.l. (median of 1476). About 13 percent of the catchment are located below the tree line (958 m a.s.l. is used as the limit in the model), and glaciers cover 12 percent %U %U %a 3 Akslen 1:35 %U %a Akslen catchment Meteorological station Hydrological station %U Discharge NVESnow observations at glacier Hydrological station Hydropower reservoir Lake Main road Country border N5 map sheet River bank River Contour (1-m) Glacier Vegetation Alpine Forest or cultivated Gråsubreen 5529 %U Storbreen %a %a Hellstugubreen Figure 3 Akslen. The meteorological station Bråtå-Slettom (no. 1573) is situated 3 km north-west of Akslen. Data from Bråtå (no. 1572) is used until July In order to harmonise with data from 1572, precipitation data from 1573 was scaled by 1.135, and temperature data was subtracted.3 degrees. Precipitation station 5529 was not used. Daily runoff - Akslen 25 5-year flood Discharge [m3 s-1] Mean flood Figure 4 Discharge at Akslen. 8
9 Sjodalsvatn Test site 2 drains to gauge 2.13 Sjodalsvatn in the river Sjoa (Figure 5), where discharge (Figure 6) has been observed since 193. Its area covers 474 km 2 and ranges from 94 to 24 m a.s.l. (median of 1461). Only about 5 percent of the catchment are below the tree line (12 m a.s.l. is used as the limit in the model), and glaciers cover 9 percent. 2 Sjodalsvatn 1:4 Hellstugubreen %a 2.13 %U %U %a Meteorological station Hydrological station %U Discharge NVESnow observations at glacier Hydrological station Sjodalsvatn catchment Hydropower reservoir Lake Main road Country border N5 map sheet River bank River Contour (1-m) Glacier Vegetation Alpine Forest or cultivated Figure 5 Sjodalsvatn. The meteorological stations Bøverdal (no. 1543) and Skåbu (no. 1367) are situated 3 km north-west and 2 km south-east of Sjodalsvatn. Precipitation was calculated as the average observed at Bøverdal and Skåbu. 9 8 Discharge [m3 s-1] Middl fl d Daily runoff - Sjodalsvatn 5-year flood Mean flood 5-year flood Figure 6 Discharge at Sjodalsvatn. 9
10 Vinde-elv Test site 3 is the catchment that drains to the river Vinde (Figure 7). Discharge (Figure 8) has been observed at gauge Vinde-elv from The 268 km 2 catchment ranges from 56 to 1686 m a.s.l. with a median elevation of 985. About 31 % of the area are located below the tree line (115 m a.s.l. is used as the limit in the model), and there are no glaciers within the catchment %U 1 Vinde-elv 1:3 %U Meteorological station Hydrological station %U Discharge Hydrological station Vinde-elv catchment Hydropower reservoir Lake Main road Country border River bank River Contour (1-m) N5 map sheet Vegetation Alpine Forest or cultivated %U %U Figure 7 Vinde-elv. The meteorological station Fagernes (no. 2342) is situated 2 km south of Vindeelv. Precipitation stations 235 and 2356 were not used. Daily runoff - Vinde-elv Discharge [m3 s-1] year flood 5-year flood Mean flood Figure 8 Discharge at Vinde-elv. 1
11 2.2 Satellite data Data was compiled from the four satellite sensors NOAA AVHRR, Terra MODIS, Landsat ETM+ and ERS SAR. AVHRR and SAR data was used to produce the timeseries of SCA maps for use in the hydrological model. The ETM+ data was used as reference data for evaluating the SCA data retrieved from different sensors (AVHRR, MODIS, SAR). The MODIS data was used to make a simple assessment of the potential of MODIS as compared to AVHRR. The following requirements were formulated for the SCA timeseries: SCA maps gives the percent snow covered area with 1 km by 1 km grid cells SCA maps are provided in the Arcinfo grid format in UTM projection and coordinate system zone 32, and WGS84 datum, One timeseries is require for each test catchment, Timeseries are composed from both optical and SAR data if possible, Timeseries composed from different EO-sensors or using different SCA retrieval algorithms are homogenised. The SCA maps should be within 1% of the true value, systematic differences removed, and the uncertainty quantified, The time series uses as many EO data acquisitions as possible for the melt period from 1 April to 31 July The used data series covers the years and is documented in Malnes and Guneriussen (22) and Koren and Solberg (22). 11
12 3 Methods 3.1 SCA-retrieval from satellite data SCA was retrieved from EO data by NVE (pilot study), NR (optical data) and NORUT (SAR). NR's work is documented in Koren and Solberg (22) and NORUT's in Malnes and Guneriussen (22), see Annexes 3 and SCA-retrieval methods NVE method for NOAA AVHRR data The NVE method (Schjødt-Osmo and Engeset, 1997) derives SCA from AVHRR. Band 2 pixel values are converted into SCA using linear transformation, which is calibrated for each image using snow on glaciers for 1% SCA and snow-free land as % NR method for NOAA AVHRR data NR derives SCA from AVHRR using the band 2 based linear NLR algorithm (Solberg and Andersen 1994), and classifies SCA into six classes (Koren and Solberg 22). Recent changes to the method produces percent SCA maps (from 1999) NORUT method for ERS SAR data NORUT converts SAR data into SCA using the Nagler algorithm (Nagler and Rott 2, Malnes and Guneriussen 22) NR method for Landsat ETM+ data SCA was estimated using an unsupervised clustering on bands 1-5 and 7 with 8 classes. The classes were reduced to three classes No snow, Partly snow cover and Complete snow cover NR method for Terra MODIS data The SNOMAP algorithm (RIG 96) was applied to MODIS (bands 1, 2, 4 and 6) data, mapping snow cover at 5-m spatial resolution. A dummy land mask without water and a cloud mask without clouds were used to improve the snow cover map Comparison of SCA maps from different sensors More detailed were carried out by NR and Norut IT, in which the SCA derived from the Landsat ETM+ image from 4 May 21 was compared to AVHRR and MODIS (Koren and Solberg 22), and ERS SAR (Malnes and Guneriussen 22). In this report the SCA derived from different sensors were compared on a catchment by catchment basis. Calculated SCA for the whole catchment, and for the part of the catchment located above the tree line were compared to simulated SCA and observed runoff, precipitation and temperatures. In this manner the effects of clouds, acquisition time-of-day etc could be assessed. 12
13 3.2 The HBV-model The model used is based upon the Nordic HBV-model (a more detailed description is provided in Annex 2). The main structure of the HBV model is a sequence of submodels: snow submodel soil moisture zone dynamic part routing The model is further structured in altitude intervals. This subdivision can be applied only to the snow submodel, or to the whole model. In the latter case, the height intervals can further be subdivided in one or two vegetation zones and lakes. Even when the model distributed on altitude intervals, the parameters are generally the same for all submodels. Interception, snow melt parameters and soil moisture capacity can however be varied according to vegetation type. The model can operate with up to 15 vegetation types, but usually not more than two or three would be activated. 3.3 SCA used in the HBV-model SCA evaluation, selection and processing The AVHRR and SAR based SCA timeseries were evaluated for use in the HBV-model calibration. Each SCA map was evaluated by the following criteria: The timeseries from NVE, NR and Norut should consistently describe the true change in SCA over time. Most of the catchment should be covered. If only parts of the catchment is covered, the maps should be discarded if the SCA map deviates from earlier or later acquisitions in a way that can not be corroborated using air temperature, precipitation or runoff data. Main problems expected were those induced by partial cloud cover (optical), low sun elevation (optical), dry snow (SAR), and other inter-sensor differences. A combined timeseries of SCA maps was selected based on the evaluation and used for the model calibration. Simple correction algorithms were explored and applied where possible when systematic or physically based deviations were observed Model calibration The HBV model was calibrated automatically for the three catchments using the parameter estimating routine PEST (Brebber et al., 1994). The model was calibrated in two modes for each catchment: first against runoff only, and secondly against both runoff and SCA. The optimal parameter sets from 96 PEST-calibrations from both modes were selected for further analysis. 13
14 3.3.3 Model simulations The best parameter sets from the calibrations were used in simulations for the four validation years in order to evaluate the model consistency in time with respect to runoff and SCA Model updating The working hypothesis was that the simulation of runoff and SCA could be improved in three ways: 1. Calibration: Calibrating the model against runoff and SCA; or 2. Snow variable update: Updated the model when a useful satellite observation of SCA was available, using rules for updating the SWE and SCA variables in the model. For example, the SWE could be updated by changing input precipitation or temperature, or adjusting the calibration variables such as the degree-day melt factor; or 3. Assembly update: An assembly of calibrated models is compared with observations when a useful satellite observation of SCA was available. The model which best describe observed runoff and SCA is used for the next period until SCA is observed again. 14
15 4 Results and discussion 4.1 Pilot study Due to delays in the delivery of EO-derived SCA data, NVE processed a number of AVHRR scenes into SCA maps in order to assess the use of EO-derived SCA in the HBV-model. This preliminary analysis is documented in Udnæs et al. (22), see Annex 2, and summarised as follows: 1. SCA was derived from optical satellite imagery to test if the hydrological model may simulate runoff better if it is calibrated using SCA data in addition to runoff. 2. HBV models are calibrated for 3 catchments in the mountainous area in southern Norway. Several parameter sets are calibrated automatically against runoff, and against runoff and SCA for the three years 1997, 1998 and Simulations are then carried out for the verification years 1995, 1996 and For all catchments the additional calibration against SCA caused clear improvements in simulation of SCA. For two of the catchments there was minor reductions in the precision of the runoff simulations. 5. In the simulation period, the models calibrated against SCA and runoff did not prove to simulate runoff better, or worse, than the traditionally calibrated models the first days next to an updating of SCA and runoff. 4.2 SCA data evaluation, selection and conversion Evaluation and selection Satellite-derived SCA data available for modelling is listed in Table 2 (calibration) and Table 3 (simulation). Table 2 Number of EO-based SCA data for calibration (AVHRR from NVE and NR, and SAR from NORUT). Akslen Sjodalsvatn Vinde-elv Year NVE NR Norut Used NVE NR Norut Used NVE NR Norut Used Table 3 Number of EO-based SCA data for simulation (AVHRR from NVE and NR, and SAR from NORUT). Akslen Sjodalsvatn Vinde-elv Year NVE NR Norut Used NVE NR Norut Used NVE NR Norut Used
16 The main outcome and results from the evaluation process were: NR-processed data were normally not useful for days with clouds, when the SCA were 1-3% below SCA from cloud-free acquisitions. The cloud-corrupted NR acquisitions were discarded. A small difference was observed between NR- and NVE-processed data. The difference was typically up to 5% with NVE-based SCA in the lower range. SAR-based SCA deviated with up to 25 % from optically-based SCA data. Most SAR acquisitions were discarded. The reason for this was that SCA observed by SAR did not show a decrease as expected from AVHRR and model simulations. The reason for this may be the procedure used for classification of dry snow by SAR. SCA conversion The selected SCA timeseries were processed in order to conform with the HBV-model SCA. The Akslen and Sjodalsvatn catchments are covered by 13% and 9% glaciers. The glaciers will be covered by snow or firn even at the end of the summer every year. Thus % SCA could never be observed over these catchments. The snow routine in the HBVmodel does not consider this effect. Based on these considerations and an analysis of snow runoff and satellite-based SCA, the lower limit for SCA observation was estimated to 1% for Akslen and 5% for Sjodalsvatn. Furthermore, the HBV-model simulates 1% SCA during most of the winter before significant snowmelt starts. The satellite-based SCA observations hardly exceed 75%, and the higher limit was estimated to 75%. Based on these SCA ranges, satellite-based SCA was transformed linearly to cover the interval -1% before used in model calibration. SCA comparison SCA was retrieved form a near simultaneous set acquisitions by AVHRR, MODIS, SAR and ETM+. The ETM+ image was used as reference, as due to the high spatial resolution and proven capability to separate bare ground and snow. A data comparison was prepared by NR (AVHRR and MODIS) and Norut (SAR). In addition a comparison of the SCA from the different sensors was done by NVE in order to compare the data as they are used as input to the hydrological model. The Landsat ETM+ image from 4 May 2 was classified into percent SCA by NR (see Koren and Solberg 22). The NOAA AVHRR image from 4 May 22 was classified into percent SCA using the NVE retrieval algorithm. In addition, a linear transformation was applied that was specific to each catchment in order to transform the SCA into the range simulated by the model (-1 %). The ERS SAR image from 3 May 22 was classified into percent SCA by Norut (see Malnes and Guneriussen 22). The mask applied to the SAR image was applied to all data sets in order to enable direct comparison. Figure 9 shows the SCA maps produced by the three sensors ETM+, AVHRR and SAR. 16


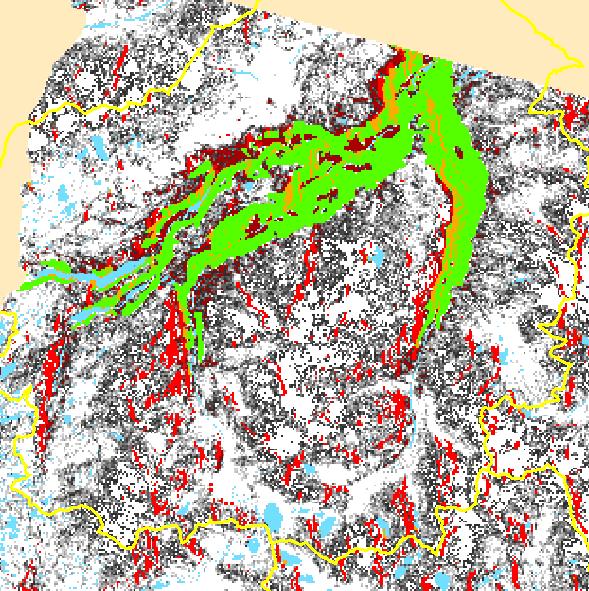
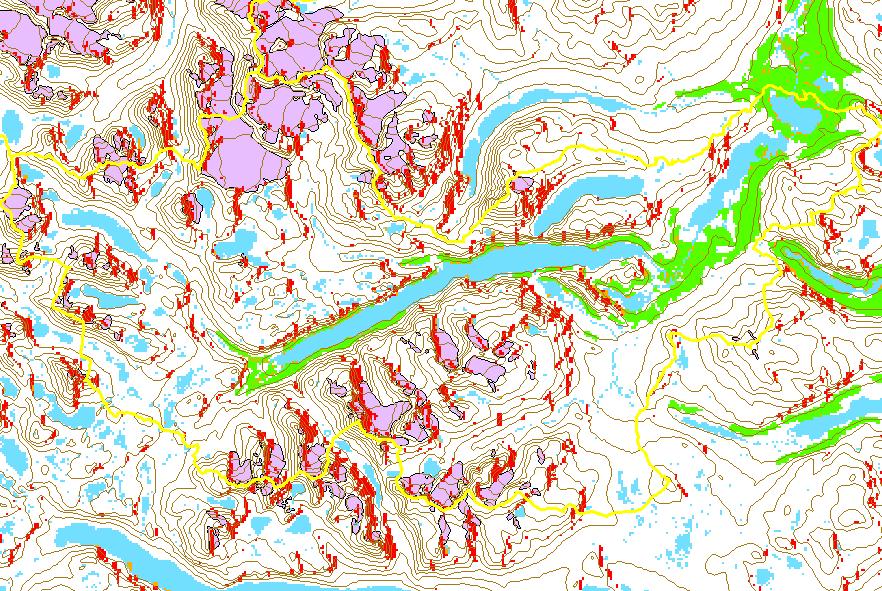
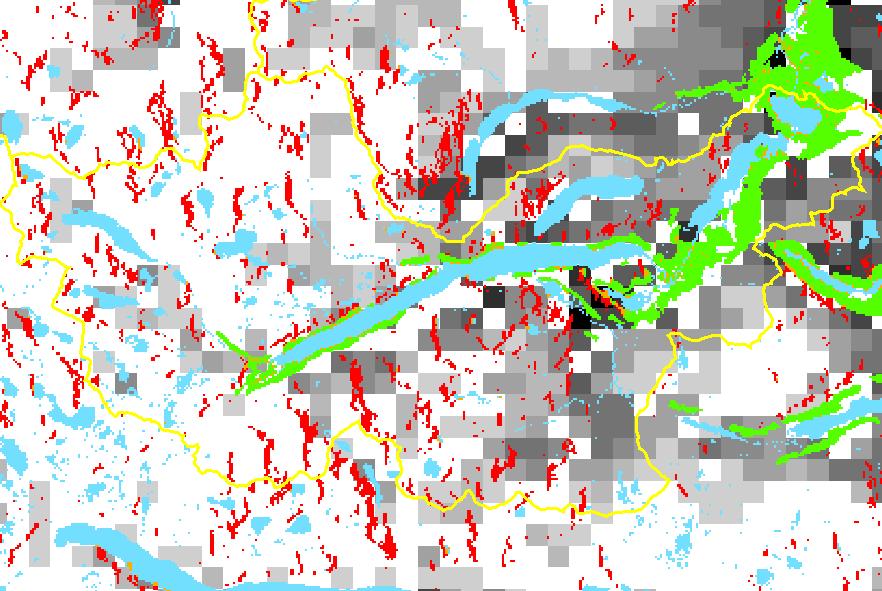
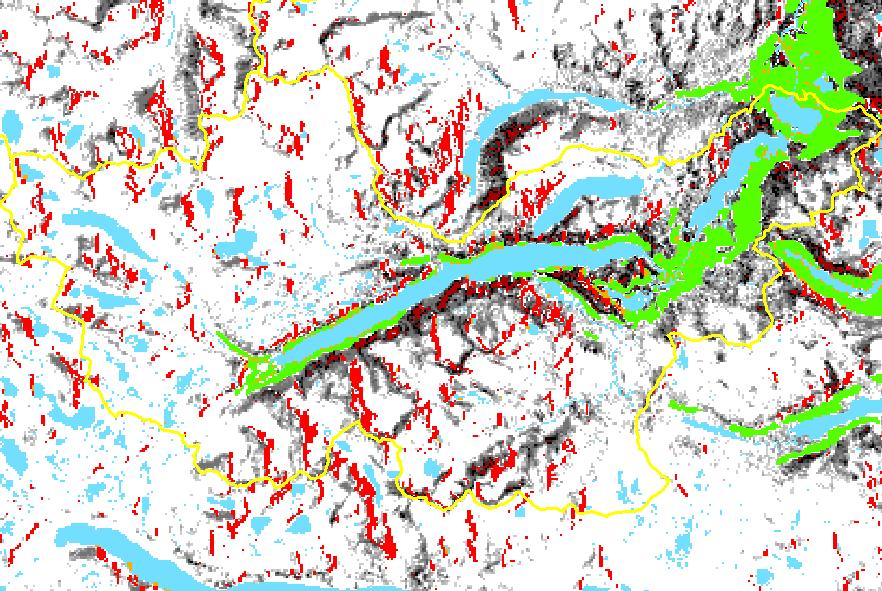

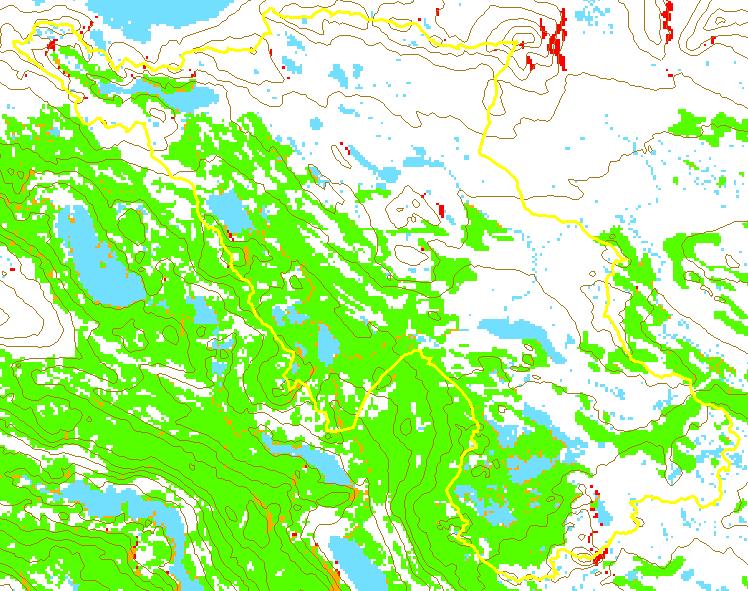
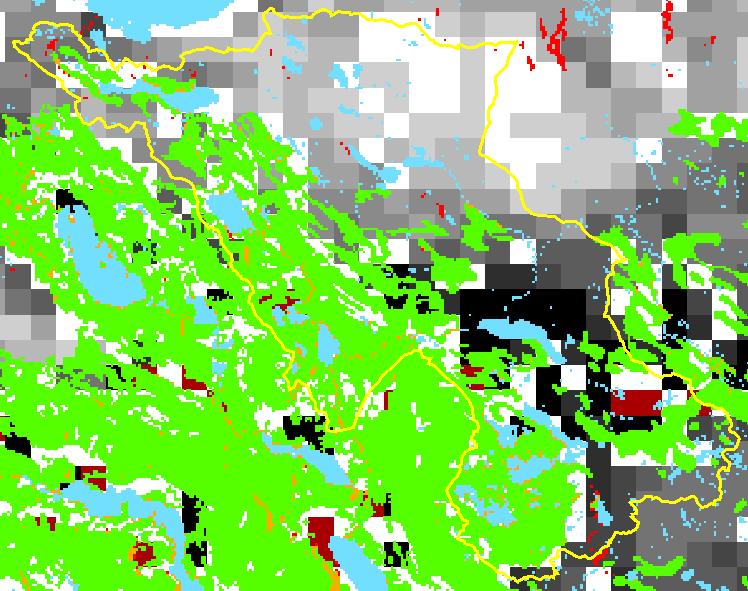
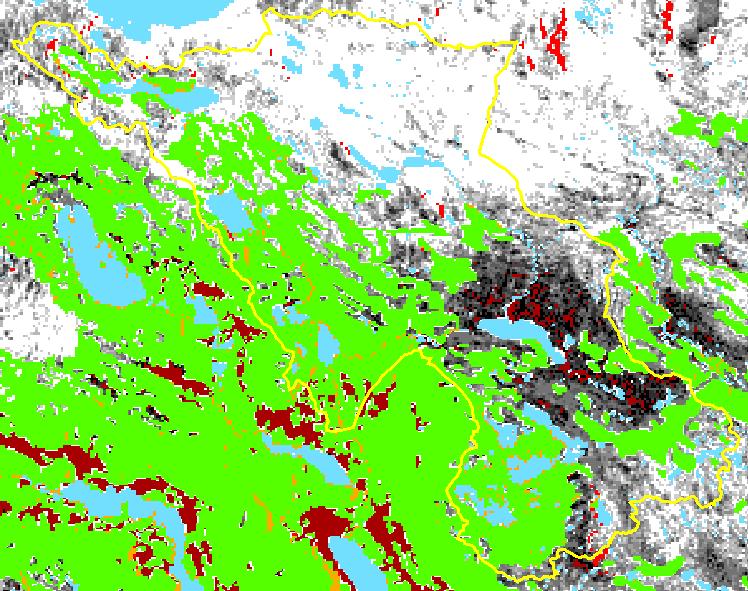
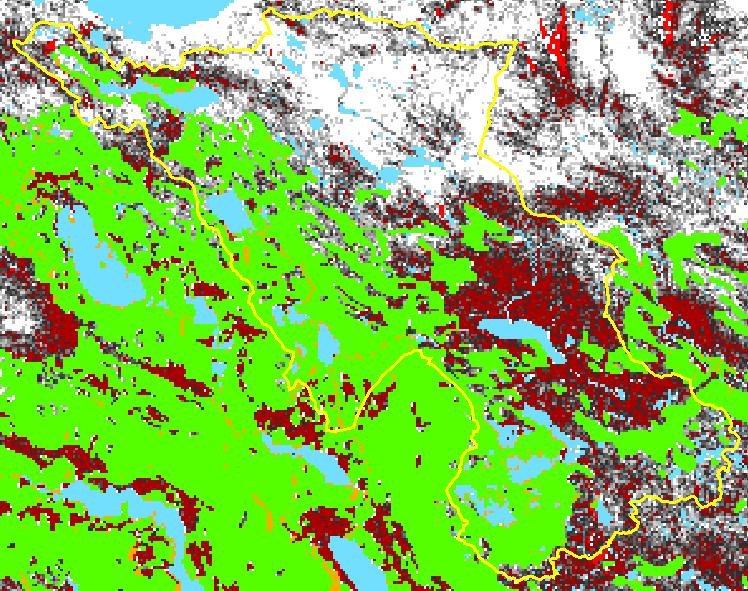

17 Akslen Sjodalsvatn Vinde-elv Mask SCA from AVHRR SCA from ETM+ SCA from SAR Figure 9 SCA maps for Akslen (top), Sjodalsvatn (middle) and Vinde-elv (bottom) based on data from ETM+ (left), AVHRR (middle) and SAR (right). Mask is shown to the left. 17
18 The average SCA over the unmasked areas was calculated for each of the three test catchments. The results show that the catchments were partly covered by dry snow, which called for special care when processing the SAR image. A very small part of the unmasked area was covered by 1% bare ground. In other words, most of the unmasked part of the catchment was covered by fragmented snow, which partly was dry. The results are listed in Table 4. Table 4 Comparison of SCA calculated from different sensors on 3 and 4 May 2. Total area Unmasked area SCA of unmasked area (%) Catchment km 2 % km 2 AVHRR ETM+ SAR Akslen Sjodalsvatn Vinde-elv The three catchments cover an area of 1533 km 2, of which 188 km 2 was included in the comparison as it was not masked in the SAR analysis. In terms of size, the snow covered area was 889 km 2 according to ETM+, 823 km 2 according to AVHRR, and 72 km 2 according to SAR. The study of the other dates with satellite-based SCA data suggest that the difference between optical and SAR based SCA can be even larger. The is probably due to the problem SAR has with detecting dry snow, and that a logical rule has to be applied to determine which pixels covers dry snow and also the SCA value for these pixels. 4.3 Model calibration The three years 1997, 1998 and 1999 were used for calibration. The models were automatically calibrated using PEST. 96 models were calibrated against runoff only (called the Q-models), and 96 against both runoff and SCA (called the QS-models). The calibration of many models thus produced a large number of models that could be used to simulate the water balance in the catchments. In order to further select the best models three procedures were explored: Selection A: Selection of the Q-models that best reproduced runoff and at the same time did not match the satellite-observed SCA well. This selection represented models that simulate runoff well and could typically be chosen for use by the flood forecasting service if SCA data was not available. Runoff only was used in the calibration. Selection B: Selection of the Q-models that best reproduced runoff and at the same time matched the satellite-observed SCA well. This selection represents models that simulate runoff well and would typically be chosen for use by the flood forecasting service if SCA data was available. Runoff only was used in the calibration. Satellite-observed SCA was used to select those models that best simulated SCA. Selection C: Selection of the QS-models that best reproduced runoff and SCA well. This selection represents models that simulate runoff well and could typically be chosen for 18
19 use by the flood forecasting service if SCA data was available. Both runoff and SCA were used in the calibration. Selection A represented models that traditionally could be selected for use in the flood forecasting service or for runoff simulations. On the other hand, Selections B and C represented model that could be selected if satellite-derived SCA was available - either for calibration (Selection C) or for selection (selection B). The results suggested that the methods used for Selection B and Selection C could be used for producing models that are better than the traditional method (exemplified by Selection A). That the difference in the results from Selection B and Selection C was small, and in the following section results from Selection A (labelled Using runoff only) and Selection C (labelled Using both runoff and SCA) are shown. It should be noted that in this (Model calibration) and the next (Model simulation) section, the graphs showing simulated SCA (labelled Q_SCA in the figures) have been inversely scaled as to be comparable with the new calibration procedure used for AVHRR SCA retrieval. This means that where the graph shows a simulated SCA of 75% this is equal to 1% in the model. 19
20 Akslen 2 calibration solutions gave R 2 from.88 to.85 for the QS-models, and 53 solutions gave R 2 =.89 using the Q-models. Figure 1 shows Selection A (left) and Selection C (right) models. Using runoff only Using both runoff and SCA Abbreviations are as follows: nve denotes NVE-processed images, nr-kl denotes NRprocessed class-based images, nr-pr denotes NRprocessed percent-based images, rad denotes NORUTprocessed radar (SAR) images, lan denotes NRprocessed Landsat image. skyfr denotes percent of catchment where SCA is calculated. % denotes SCA percent and sf denotes SCA calculated for area above treeline only. QS_Q denotes simulated runoff, QS_S simulated SCA. Q denotes observed runoff, P observed precipitation, and T temperature Legend nr-kl skyfr nr-kl % nr-kl sf skyfr nr-kl sf % nve skyfr nve % nve sf skyfr nve sf % nr-pr skyfr nr-pr % nr-pr sf skyfr nr-pr sf % rad skyfr rad % rad sf skyfr rad sf % lan skyfr lan % lan sf skyfr lan sf % SCA-EO P T QS-S QS-Q Q Figure 1 Calibration period Akslen catchment. The graphs show observed precipitation (P), temperature (T), runoff (Q) and SCA, and modelled runoff (HBV_Q) and SCA (HBV_SCA). The observed SCA values used in the calibration are marked with a circle
21 Sjodalsvatn 15 calibration solutions gave R 2 from.74 to.75 for the QS-models, and 9 solutions gave R 2 =.79 using the Q-models. Figure 11 shows Selection A (left) and selection C (right) models. Using runoff only Using both runoff and SCA Abbreviations are as follows: nve denotes NVE-processed images, nr-kl denotes NRprocessed class-based images, nr-pr denotes NRprocessed percent-based images, rad denotes NORUTprocessed radar (SAR) images, lan denotes NRprocessed Landsat image. skyfr denotes percent of catchment where SCA is calculated. % denotes SCA percent and sf denotes SCA calculated for area above treeline only. QS_Q denotes simulated runoff, QS_S simulated SCA. Q denotes observed runoff, P observed precipitation, and T temperature Legend nr-kl skyfr nr-kl % nr-kl sf skyfr nr-kl sf % nve skyfr nve % nve sf skyfr nve sf % nr-pr skyfr nr-pr % nr-pr sf skyfr nr-pr sf % rad skyfr rad % rad sf skyfr rad sf % lan skyfr lan % lan sf skyfr lan sf % SCA-EO P T QS-S QS-Q Q Figure 11 Calibration period Sjodalsvatn catchment. The graphs show observed precipitation (P), temperature (T), runoff (Q) and SCA, and modelled runoff (HBV_Q) and SCA (HBV_SCA). The observed SCA values used in the calibration are marked with a circle
22 Vinde-elv The upper four elevation intervals (4% of the area) above the treeline were used for calibration to avoid the SCA observation problem over forest. 14 calibration solutions gave R 2 from.83 to.81 for the QS-models, and 16 solutions gave R 2 =.85 using the Q- models. Figure 12 shows Selection A (left) and selection C (right) models. Using runoff only Using both runoff and SCA Abbreviations are as follows: nve denotes NVE-processed images, nr-kl denotes NR-processed class-based images, nr-pr denotes NR-processed percent-based images, rad denotes NORUT-processed radar (SAR) images, lan denotes NR-processed Landsat image. skyfr denotes percent of catchment where SCA is calculated. % denotes SCA percent and sf denotes SCA calculated for area above treeline only. QS_Q denotes simulated runoff, QS_S simulated SCA. Q denotes observed runoff, P observed precipitation, and T temperature Legend nr-kl skyfr nr-kl % nr-kl sf skyfr nr-kl sf % nve skyfr nve % nve sf skyfr nve sf % nr-pr skyfr nr-pr % nr-pr sf skyfr nr-pr sf % rad skyfr rad % rad sf skyfr rad sf % lan skyfr lan % lan sf skyfr lan sf % SCA-EO P T QS-S QS-Q Q Figure 12 Calibration period Vinde-elv catchment. The graphs show observed precipitation (P), temperature (T), runoff (Q) and SCA, and modelled runoff (HBV_Q) and SCA (HBV_SCA). The observed SCA values used in the calibration are marked with a circle
23 The automatic calibration procedure finds the optimal parameter sets based on the fit between observed and simulated runoff. This implies that the model cannot be calibrated to give a better fit, using the same input data, when more variables are used. In this project the SCA variable was used in addition to runoff. The calibration showed that SCA was simulated well by the QS-models without significant reduction in the quality of the runoff simulations as compared to the Q- models. In the Akslen case, even the Q-models simulated SCA well. In the cases of Sjodalsvatn and Vinde-elv, the Q-models clearly overestimated SCA. For this reason the QS-models were used to evaluate simulated SCA in the validation periods. Both the Q- models and QS-models simulated runoff well for the Vinde-elv and Akslen catchments. However, the largest floods in Sjodalsvatn were not well simulated by any of the models. The reason is probably that the point observations of precipitation and temperature at the meteorological stations do not represent the area value of the catchments during these events. The snowmelt contribution to runoff was simulated reasonable well for the calibration years. 4.4 Model simulation Simulations for the four years 1995, 1996, 2 and 21 were validated against observed runoff and SCA. The simulation results are shown in Figure 13, Figure 14 and Figure 15. Models that simulated both SCA and runoff well in the calibration were used in the validation (Selection C models, see description in the above section). The results show that the simulation of runoff and SCA during the validation years was of the same quality as in the calibration period, which indicated that the models were consistent in time. All years except 21 simulated SCA well for Akslen and Sjodalsvatn. For Vinde-elv, the observed SCA showed variation, which was difficult to explain. In this catchment the SCA was calculated for 4% of the area only. This made validation difficult for Vinde-elv. Runoff was simulated fairly well for Vinde-elv and Akslen, except in 21. The year 21 was an exception, as none of the models performed well this year in terms of both runoff and SCA. During the autumn and winter 2-1 extreme amounts of precipitation were recorded in south-east Norway. The ratio between precipitation at the meteorological stations and precipitation integrated over the catchments was probably not normal in during this period. The observed precipitation used as input to the model, and consequently the modelled SWE for Sjodalsvatn and Akslen were therefore probably underestimated. Such an underrating of the amount of snow in the model caused the modelled SCA to decrease too quickly when melting occurred. Another consequence was that the simulated runoff caused by snowmelt was too low throughout the melting season. For Vinde-elv the runoff simulation in 21 tended to be too high, possibility due to an overestimation of the precipitation during the snow accumulation period. 23
24 Akslen Akslen 3 Akslen Akslen 3 Akslen QS-mod Abbreviations are as follows: nve denotes NVE-processed images, nr-kl denotes NRprocessed class-based images, nr-pr denotes NRprocessed percent-based images, rad denotes NORUTprocessed radar (SAR) images, lan denotes NRprocessed Landsat image. skyfr denotes percent of catchment where SCA is calculated. % denotes SCA percent and sf denotes SCA calculated for area above treeline only. QS_Q denotes simulated runoff, QS_S simulated SCA. Q denotes observed runoff, P observed precipitation, and T temperature Legend nr-kl skyfr nr-kl % nr-kl sf skyfr nr-kl sf % nve skyfr nve % nve sf skyfr nve sf % nr-pr skyfr nr-pr % nr-pr sf skyfr nr-pr sf % rad skyfr rad % rad sf skyfr rad sf % lan skyfr lan % lan sf skyfr lan sf % SCA-EO P T QS-S QS-Q Q Figure 13 Simulation period Akslen catchment. The graphs show observed precipitation, temperature, runoff and SCA, and modelled runoff and SCA. The observed SCA used in the validation is marked with a circle
25 Sjodalsvatn Abbreviations are as follows: nve denotes NVE-processed images, nr-kl denotes NRprocessed class-based images, nr-pr denotes NRprocessed percent-based images, rad denotes NORUTprocessed radar (SAR) images, lan denotes NRprocessed Landsat image. skyfr denotes percent of catchment where SCA is calculated. % denotes SCA percent and sf denotes SCA calculated for area above treeline only. QS_Q denotes simulated runoff, QS_S simulated SCA. Q denotes observed runoff, P observed precipitation, and T temperature Legend nr-kl skyfr nr-kl % nr-kl sf skyfr nr-kl sf % nve skyfr nve % nve sf skyfr nve sf % nr-pr skyfr nr-pr % nr-pr sf skyfr nr-pr sf % rad skyfr rad % rad sf skyfr rad sf % lan skyfr lan % lan sf skyfr lan sf % SCA-EO P T QS-S QS-Q Q Figure 14 Simulation period Sjodalsvatn catchment. The graphs show observed precipitation, temperature, runoff and SCA, and modelled runoff and SCA. The observed SCA used in the validation is marked with a circle
26 Vinde-elv Abbreviations are as follows: nve denotes NVE-processed images, nr-kl denotes NRprocessed class-based images, nr-pr denotes NRprocessed percent-based images, rad denotes NORUTprocessed radar (SAR) images, lan denotes NRprocessed Landsat image. skyfr denotes percent of catchment where SCA is calculated. % denotes SCA percent and sf denotes SCA calculated for area above treeline only. QS_Q denotes simulated runoff, QS_S simulated SCA. Q denotes observed runoff, P observed precipitation, and T temperature Legend nr-kl skyfr nr-kl % nr-kl sf skyfr nr-kl sf % nve skyfr nve % nve sf skyfr nve sf % nr-pr skyfr nr-pr % nr-pr sf skyfr nr-pr sf % rad skyfr rad % rad sf skyfr rad sf % lan skyfr lan % lan sf skyfr lan sf % SCA-EO P T QS-S QS-Q Q Figure 15 Simulation period Vinde-elv catchment. The graphs show observed precipitation, temperature, runoff and SCA, and modelled runoff and SCA
27 4.5 Model updating Updating of the SCA variable in the model could be done when observations and models described the same variable in a comparative way. In the HBV model, simulated SCA depend on the SWE, which has to be updated when updating SCA from observation. Two methods for updating were prescribed: Input data correction: In this method observed and simulated SCA are compared, deviation above a certain level was used to detect when the model did not manage to simulate the snow reservoir correctly. Simulated SCA and SWE were under these circumstances identified as incorrect. In order to adjust and update the model to account for this, the input precipitation and/or temperature data are adjusted to produce a better simulation. As an example, if simulated SCA decreased significantly more than observed this could be due to too little snow simulated by in the SWE variable in the model at the time of snowmelt starts at the beginning of the spring. The reason for this could be that the precipitation gauge recorded less precipitation than received in the catchment. In response to this deficiency, an increase in precipitation is applied during one day or a period of days in order to add to the snow reservoir in the model. Assembly selection updating: In this method the input data was not adjusted, but rather a new selection of calibrated models was carried out. When the SCA and SWE were incorrectly simulated, a model with a better fit between simulated and observed SCA is selected. Model simulations showed that simulated and observed SCA and snowmelt runoff corresponded well in all years except for 21. In 21, simulated SCA was significantly lower than observed from the melt season started at about 1 May and until 2 June. After 2 June, the simulated runoff was only half of what was observed. For these reasons data for the catchments Akslen and Sjodalsvatn during 21 were used for investigating the methods of model updating. The possibility and need for updating the models in the other three simulation years were assessed to be low Updating the snow reservoir by input data correction Simulated SCA was much lower than observed on 1 June 21, since the SWE was underestimated in the model. The divergence between modelled and observed SCA was used to detect that one or more model state variables were wrong. The updating of the SWE in the model was done by a gradually correction of the model input precipitation before melt started in order to produce more snow in the model, and a gradual correction of temperature during the melt period in order to reduce the snowinduced runoff. Simulations using the corrected inputs were adjusted until runoff and SCA were simulated well. Simulations with and without model updating are compered to observations in Figure 16. The five best parameter sets for simulating both runoff and SCA were used in the simulations shown in Figure 16. Updating to achieve better correspondence between 27
28 observed and simulated SCA was done until reaching a difference lower than 1% on June 1 th. Both the Q-models and QS-models performed better after the updating was introduced, supporting that the proposed updating method could be successfully applied this year - simulating both flood peaks and volumes better. SCA % Akslen SCA % Sjodalsvatn Q mm/day Akslen Q mm/day Sjodalsvatn Observed runoff Simulations with updating Simulations without updating... Days with observed SCA Figure 16 Simulation of SCA and runoff compered with observation for Akslen and Sjodalsvatn in 21 with and without updating of input data to the model. The models shown are QS-models Updating using assembly selection The second method for updating the model SCA was to choose the models among the QS-models that simulated SCA best whenever observations of SCA were available. This method was described and tested during the pilot phase of this project (Udnæs et al., 22). The results of this method used on the 21 data for Sjodalsvatn and Akslen are shown in Figure 17. The simulation of the updated models was compared to the best Q- models (the best runoff models in the calibration period). The updating by this method appeared to give small changes in the simulations as compared to the simulations without updating for Akslen. For Sjodalsvatn this method produced poorer simulations than using the best Q-model without updating. Even the QSmodels simulating SCA best did not simulate SCA well this year (Figure 17). These results suggested that the best updating method would be adjusting the input data as described in the previous section. 28
29 Akslen Sjodalsvatn SCA % SCA % Akslen Sjodalsvatn Q (mm/day) Q mm/day Observed runoff Simulations with updating Simulations without updating... Days with observed SCA Figure 17 Simulations of SCA and runoff compared to observations for Sjodalsvatn and Akslen in 21 with and without updating by assembly set selection. QS-models are shown. 29
30 5 Demonstration A demonstration was carried out for Akslen during the period from 1 September 21 to 1 August 22. The results are shown in Figure 18. It should be noted that the meteorological input data used for the demonstration had not been subjected to final quality control at met.no - as is the case for all data used in the day-to-day flood forecasting Runoff observed Runoff QS-model Runoff Q-model SCA observed SCA QS-model SCA Q-model SCA (%) Figure 18 Results from Akslen during the demonstration period. Simulated SCA (QS-model in the figure) was in fair agreement with satellite observations, which suggested that model updating was not required. The correlation between simulated and observed runoff was lower this year than all other years except 21. Simulated runoff was consistently higher than observed for a period of four weeks from the end of May until the end of June. This situation was the reverse of that identified in 21. In 21, simulations showed much lower runoff than observed and this was attributed unobserved or underestimated precipitation, which produced a too small snow reservoir in the model at the time of snow maximum. In 21, the problem was identified as a problem with the snow simulation since observed SCA was much higher than simulated. However, in 22 the observed SCA was in accordance with simulated. With the existing methods and data we could not use the SCA to correct and update the model in order to simulate runoff better during this period. Figure 18 also shows the results from an example of a model, which simulated runoff well and SCA less well in the calibration period (Q-model in the figure). This model overestimated SCA with more than 2% during long periods. This model could hardly been used to detect errors in the simulated SCA and the snow reservoir. 3
31 6 Conclusions The results showed that the HBV-model could be calibrated against SCA in addition to runoff and simulate SCA well without major reduction in the precision of the runoff simulations. In order to this, the calibration of the SCA retrieval algorithm had to be changed. The satellite-observed SCA provided a new and independent mean to assess how well the HBV-model simulated the snow reservoir. This was used to detect when the model did not simulate the snow reservoir correctly. When such simulation errors were identified, promising results were found by updating the model by correcting the input temperature and precipitation data. Another method of model updating, updating by selecting the best model whenever a SCA observation was available did not improve the simulations as initially suggested in the pilot study. Uncertainties were identified in the precision of the satellite-derived SCA. Further work should aim at producing time- and sensor-independent SCA estimates in order to calibrate and verify the model results against consistent data. The gap between SAR and optically based SCA observations was not systematic and at times too large. Methods for estimating SCA in sparsely forested areas are also required. This study suggests that the precision of the SCA observation for a catchment should be better than 1%. To assess the model simulation of the snow reservoir and snowmelt, a series of observations are required. If the uncertainty in observed SCA is low, two or three acquisitions during the melt period are sufficient to assess if the model simulates snow well. If the uncertainty is high, more acquisitions are required. The HBV-model has a simplified description of the snow, groundwater and lake reservoirs. Few of the state variables are directly observable. We have through this project shown that it could be useful to observe the state variable SCA by satellite in order to assess the model simulation. However, the simulated runoff will always deviate from observed, due to the simplified structure of the model, the lack of observations of other state variables and the difference between point observations and catchment values of precipitation and temperature. The results showed that the choice of catchment and study years gave different results, which suggest that more study catchments and years should be included to achieve more general conclusions. 7 References Brebber, L., Doherty, J. and Whyte, P., PEST Model Independent Parameter Estimation. Watermark Computing, Corinda, Australia. Malnes, E., and Guneriussen, T., 22. Demosnø - Algorithms for mapping snow covered area with SAR. Norut IT Report 67/1-2. Koren, H., and Solberg, R., 22. DemoSnow - Snow cover mapping with optical data. Norsk Regnesentral Note SAMBA/24/2. 31
Satellite-observed Snow Covered Area and Spring Flood Prediction in the HBV-model
 Satellite-observed Snow Covered Area and Spring Flood Prediction in the HBV-model Norwegian Water Resources and Energy Directorate 24 Report No. 4-24 Satellite-observed Snow Covered Area and Spring Flood
SNOW MAP SYSTEM FOR NORWAY. Majorstua, N-0301 Oslo, Norway. 2 Norwegian Meteorological Institute (met.no), Box 43 Blindern, N-0313
, Box 43 Blindern, N-0313") SNOW MAP SYSTEM FOR NORWAY Rune Engeset 1, Ole Einar Tveito 2, Eli Alfnes 1, Zelalem Mengistu 1, Hans- Christian Udnæs 1, Ketil Isaksen 2, and Eirik J. Førland 2 1 Norwegian Water Resources and Energy
SNOW MAP SYSTEM FOR NORWAY Rune Engeset 1, Ole Einar Tveito 2, Eli Alfnes 1, Zelalem Mengistu 1, Hans- Christian Udnæs 1, Ketil Isaksen 2, and Eirik J. Førland 2 1 Norwegian Water Resources and Energy
SAR Remote Sensing of Snow Parameters in Norwegian Areas Current Status and Future Perspective
 182 Progress In Electromagnetics Research Symposium 2006, Cambridge, USA, March 26-29 SAR Remote Sensing of Snow Parameters in Norwegian Areas Current Status and Future Perspective R. Storvold, E. Malnes,
MULTI-POLARISATION MEASUREMENTS OF SNOW SIGNATURES WITH AIR- AND SATELLITEBORNE SAR
 EARSeL eproceedings 5, 1/2006 111 MULTI-POLARISATION MEASUREMENTS OF SNOW SIGNATURES WITH AIR- AND SATELLITEBORNE SAR Eirik Malnes 1, Rune Storvold 1, Inge Lauknes 1 and Simone Pettinato 2 1. Norut IT,
Using MODIS imagery to validate the spatial representation of snow cover extent obtained from SWAT in a data-scarce Chilean Andean watershed
 Using MODIS imagery to validate the spatial representation of snow cover extent obtained from SWAT in a data-scarce Chilean Andean watershed Alejandra Stehr 1, Oscar Link 2, Mauricio Aguayo 1 1 Centro
Modelling snow accumulation and snow melt in a continuous hydrological model for real-time flood forecasting
 IOP Conference Series: Earth and Environmental Science Modelling snow accumulation and snow melt in a continuous hydrological model for real-time flood forecasting To cite this article: Ph Stanzel et al
Supplementary Materials for
 advances.sciencemag.org/cgi/content/full/3/12/e1701169/dc1 Supplementary Materials for Abrupt shift in the observed runoff from the southwestern Greenland ice sheet Andreas P. Ahlstrøm, Dorthe Petersen,
Snow cover monitoring and modelling in the Alps using multi temporal MODIS data
 cover monitoring and modelling in the Alps using multi temporal MODIS data Rastner P. 1, Irsara L. 1, Schellenberger T. 1, Della Chiesa S. 2, Bertoldi G. 2, Endrizzi S. 3, Notarnicola C. 1 and Zebisch
The use of earth observation technology to improve the characterization of ice and snow
 The use of earth observation technology to improve the characterization of ice and snow Swedish Meteorological and Hydrological Institute (SMHI) Outline: EO and ice/snow CryoLand North Hydrology EO in
Watershed simulation and forecasting system with a GIS-oriented user interface
 HydroGIS 96: Application of Geographic Information Systems in Hydrology and Water Resources Management (Proceedings of the Vienna Conference, April 1996). IAHS Publ. no. 235, 1996. 493 Watershed simulation
Drought Monitoring with Hydrological Modelling
 st Joint EARS/JRC International Drought Workshop, Ljubljana,.-5. September 009 Drought Monitoring with Hydrological Modelling Stefan Niemeyer IES - Institute for Environment and Sustainability Ispra -
NIDIS Intermountain West Regional Drought Early Warning System February 7, 2017
 NIDIS Drought and Water Assessment NIDIS Intermountain West Regional Drought Early Warning System February 7, 2017 Precipitation The images above use daily precipitation statistics from NWS COOP, CoCoRaHS,
The relationship between catchment characteristics and the parameters of a conceptual runoff model: a study in the south of Sweden
 FRIEND: Flow Regimes from International Experimental and Network Data (Proceedings of the Braunschweie _ Conference, October 1993). IAHS Publ. no. 221, 1994. 475 The relationship between catchment characteristics
PRELIMINARY DRAFT FOR DISCUSSION PURPOSES
 Memorandum To: David Thompson From: John Haapala CC: Dan McDonald Bob Montgomery Date: February 24, 2003 File #: 1003551 Re: Lake Wenatchee Historic Water Levels, Operation Model, and Flood Operation This
The Importance of Snowmelt Runoff Modeling for Sustainable Development and Disaster Prevention
 The Importance of Snowmelt Runoff Modeling for Sustainable Development and Disaster Prevention Muzafar Malikov Space Research Centre Academy of Sciences Republic of Uzbekistan Water H 2 O Gas - Water Vapor
Hydrologic Forecast Centre Manitoba Infrastructure, Winnipeg, Manitoba. MARCH OUTLOOK REPORT FOR MANITOBA March 23, 2018
 Page 1 of 21 Hydrologic Forecast Centre Manitoba Infrastructure, Winnipeg, Manitoba MARCH OUTLOOK REPORT FOR MANITOBA March 23, 2018 Overview The March Outlook Report prepared by the Hydrologic Forecast
Snow Cover Applications: Major Gaps in Current EO Measurement Capabilities
 Snow Cover Applications: Major Gaps in Current EO Measurement Capabilities Thomas NAGLER ENVEO Environmental Earth Observation IT GmbH INNSBRUCK, AUSTRIA Polar and Snow Cover Applications User Requirements
Assessment of possible jôkulhlaups from Lake Demmevatn in Norway
 The Eslrciui's of flu' Extremes: Eflraortlinarv Floods (Proceedings of ;i svinposinm held ill Reykjavik. Iceland. July 2000). IAliSPubl.no. 271. 2002. 31 Assessment of possible jôkulhlaups from Lake Demmevatn
IEEE GEOSCIENCE AND REMOTE SENSING LETTERS, VOL. 1, NO. 2, APRIL
 IEEE GEOSCIENCE AND REMOTE SENSING LETTERS, VOL. 1, NO. 2, APRIL 2004 57 Delta-K Interferometric SAR Technique for Snow Water Equivalent (SWE) Retrieval Geir Engen, Tore Guneriussen, and Øyvind Overrein
Operational Perspectives on Hydrologic Model Data Assimilation
 Operational Perspectives on Hydrologic Model Data Assimilation Rob Hartman Hydrologist in Charge NOAA / National Weather Service California-Nevada River Forecast Center Sacramento, CA USA Outline Operational
Souris River Basin Spring Runoff Outlook As of March 15, 2018
 Souris River Basin Spring Runoff Outlook As of March 15, 2018 Prepared by: Flow Forecasting & Operations Planning Water Security Agency Basin Conditions Summer rainfall in 2017 in the Saskatchewan portion
Advancements and validation of the global CryoClim snow cover extent product
 www.nr.no Advancements and validation of the global CryoClim snow cover extent product Rune Solberg1, Øystein Rudjord1, Arnt-Børre Salberg1 and Mari Anne Killie2 1) Norwegian Computing Center (NR), P.O.
Hydrologic Forecast Centre Manitoba Infrastructure, Winnipeg, Manitoba. FEBRUARY OUTLOOK REPORT FOR MANITOBA February 23, 2018
 Page 1 of 17 Hydrologic Forecast Centre Manitoba Infrastructure, Winnipeg, Manitoba FEBRUARY OUTLOOK REPORT FOR MANITOBA February 23, 2018 Overview The February Outlook Report prepared by the Hydrologic
Central Asia Regional Flash Flood Guidance System 4-6 October Hydrologic Research Center A Nonprofit, Public-Benefit Corporation
 http://www.hrcwater.org Central Asia Regional Flash Flood Guidance System 4-6 October 2016 Hydrologic Research Center A Nonprofit, Public-Benefit Corporation FFGS Snow Components Snow Accumulation and
The indicator can be used for awareness raising, evaluation of occurred droughts, forecasting future drought risks and management purposes.
 INDICATOR FACT SHEET SSPI: Standardized SnowPack Index Indicator definition The availability of water in rivers, lakes and ground is mainly related to precipitation. However, in the cold climate when precipitation
Modelling runoff from large glacierized basins in the Karakoram Himalaya using remote sensing of the transient snowline
 Remote Sensing and Hydrology 2000 (Proceedings of a symposium held at Santa Fe, New Mexico, USA, April 2000). IAHS Publ. no. 267, 2001. 99 Modelling runoff from large glacierized basins in the Karakoram
NIDIS Intermountain West Drought Early Warning System May 23, 2017
 NIDIS Drought and Water Assessment NIDIS Intermountain West Drought Early Warning System May 23, 2017 Precipitation The images above use daily precipitation statistics from NWS COOP, CoCoRaHS, and CoAgMet
Fjernmåling av snø. Why snow? Runoff. Overview. Why Snow? - Albedo. Why Snow? Dagrun Vikhamar Schuler. snow albedo (picture earth) Snow properties
 Snow properties") The retrieval of snow properties using remote sensing techniques from the visible to the microwave spectral region. Fjernmåling av snø Dagrun Vikhamar Schuler Bidrag fra: Max Konig, Norsk Polarinstitutt
The retrieval of snow properties using remote sensing techniques from the visible to the microwave spectral region. Fjernmåling av snø Dagrun Vikhamar Schuler Bidrag fra: Max Konig, Norsk Polarinstitutt
Oregon Water Conditions Report May 1, 2017
 Oregon Water Conditions Report May 1, 2017 Mountain snowpack in the higher elevations has continued to increase over the last two weeks. Statewide, most low and mid elevation snow has melted so the basin
ADVANCEMENTS IN SNOW MONITORING
 Polar Space Task Group ADVANCEMENTS IN SNOW MONITORING Thomas Nagler, ENVEO IT GmbH, Innsbruck, Austria Outline Towards a pan-european Multi-sensor Snow Product SnowPEx Summary Upcoming activities SEOM
NIDIS Drought and Water Assessment
 NIDIS Drought and Water Assessment PRECIPITATION The images above use daily precipitation statistics from NWS COOP, CoCoRaHS, and CoAgMet stations. From top to bottom, and left to right: most recent 7-days
HyMet Company. Streamflow and Energy Generation Forecasting Model Columbia River Basin
 HyMet Company Streamflow and Energy Generation Forecasting Model Columbia River Basin HyMet Inc. Courthouse Square 19001 Vashon Hwy SW Suite 201 Vashon Island, WA 98070 Phone: 206-463-1610 Columbia River
Flood Forecasting Tools for Ungauged Streams in Alberta: Status and Lessons from the Flood of 2013
 Flood Forecasting Tools for Ungauged Streams in Alberta: Status and Lessons from the Flood of 2013 John Pomeroy, Xing Fang, Kevin Shook, Tom Brown Centre for Hydrology, University of Saskatchewan, Saskatoon
Validation of satellite derived snow cover data records with surface networks and m ulti-dataset inter-comparisons
 Validation of satellite derived snow cover data records with surface networks and m ulti-dataset inter-comparisons Chris Derksen Climate Research Division Environment Canada Thanks to our data providers:
C o p e r n i c u s L a n d M o n i t o r i n g S e r v i c e
 C o p e r n i c u s L a n d M o n i t o r i n g S e r v i c e Integration into existing Snow and Ice Services and draft product specifications Annett BARTSCH b.geos Copernicus High Resolution Snow and
NIDIS Intermountain West Drought Early Warning System April 18, 2017
 1 of 11 4/18/2017 3:42 PM Precipitation NIDIS Intermountain West Drought Early Warning System April 18, 2017 The images above use daily precipitation statistics from NWS COOP, CoCoRaHS, and CoAgMet stations.
EVALUATION AND MONITORING OF SNOWCOVER WATER RESOURCES IN CARPATHIAN BASINS USING GEOGRAPHIC INFORMATION AND SATELLITE DATA
 EVALUATION AND MONITORING OF SNOWCOVER WATER RESOURCES IN CARPATHIAN BASINS USING GEOGRAPHIC INFORMATION AND SATELLITE DATA Gheorghe Stancalie, Simona Catana, Anisoara Iordache National Institute of Meteorology
Measures Also Significant Factors of Flood Disaster Reduction
 Non-Structual Measures Also Significant Factors of Flood Disaster Reduction Babiaková Gabriela, Leškov ková Danica Slovak Hydrometeorological Institute, Bratislava Hydrological Forecasts and Warning Department
Water information system advances American River basin. Roger Bales, Martha Conklin, Steve Glaser, Bob Rice & collaborators UC: SNRI & CITRIS
 Water information system advances American River basin Roger Bales, Martha Conklin, Steve Glaser, Bob Rice & collaborators UC: SNRI & CITRIS Opportunities Unprecedented level of information from low-cost
CHAPTER VII FULLY DISTRIBUTED RAINFALL-RUNOFF MODEL USING GIS
 80 CHAPTER VII FULLY DISTRIBUTED RAINFALL-RUNOFF MODEL USING GIS 7.1GENERAL This chapter is discussed in six parts. Introduction to Runoff estimation using fully Distributed model is discussed in first
The value of MODIS snow cover data in validating and calibrating conceptual hydrologic models
 Journal of Hydrology (2) 35, 2 25 available at www.sciencedirect.com journal homepage: www.elsevier.com/locate/jhydrol The value of MODIS snow cover data in validating and calibrating conceptual hydrologic
CARFFG System Development and Theoretical Background
 CARFFG Steering Committee Meeting 15 SEPTEMBER 2015 Astana, KAZAKHSTAN CARFFG System Development and Theoretical Background Theresa M. Modrick, PhD Hydrologic Research Center Key Technical Components -
Remote sensing of snow at SYKE Sari Metsämäki
 Remote sensing of snow at SYKE 2011-01-21 Sari Metsämäki Activities in different projects Snow extent product in ESA DUE-project GlobSnow Long term datasets (15-30 years) on Snow Extent (SE) and Snow Water
4. THE HBV MODEL APPLICATION TO THE KASARI CATCHMENT
 Application of HBV model to the Kasari River, 1994 Page 1 of 6 Application of the HBV model to the Kasari river for flow modulation of catchments characterised by specific underlying features by R. Vedom,
Preliminary Runoff Outlook February 2018
 Preliminary Runoff Outlook February 2018 Prepared by: Flow Forecasting & Operations Planning Water Security Agency General Overview The Water Security Agency (WSA) is preparing for 2018 spring runoff including
THE INVESTIGATION OF SNOWMELT PATTERNS IN AN ARCTIC UPLAND USING SAR IMAGERY
 THE INVESTIGATION OF SNOWMELT PATTERNS IN AN ARCTIC UPLAND USING SAR IMAGERY Johansson, M., Brown, I.A. and Lundén, B. Department of Physical Geography, Stockholm University, S-106 91 Stockholm, Sweden
Fact Sheet on Snow Hydrology Products in GIN. SWE Maps
 Fact Sheet on Snow Hydrology Products in GIN SWE Maps Description The snow water equivalent maps (SWE maps) present an estimation of the distribution of snow water resources in Switzerland. The maps have
[Final report of the visiting stay.] Assoc. Prof. Juraj Parajka. TU Vienna, Austria
![[Final report of the visiting stay.] Assoc. Prof. Juraj Parajka. TU Vienna, Austria](/thumbs/73/68603022.jpg "[Final report of the visiting stay.] Assoc. Prof. Juraj Parajka. TU Vienna, Austria") Validation of HSAF snow products in mountainous terrain in Austria and assimilating the snow products into a conceptual hydrological model at regional scale [Final report of the visiting stay.] Assoc.
Validation of HSAF snow products in mountainous terrain in Austria and assimilating the snow products into a conceptual hydrological model at regional scale [Final report of the visiting stay.] Assoc.
ESTIMATING SNOWMELT CONTRIBUTION FROM THE GANGOTRI GLACIER CATCHMENT INTO THE BHAGIRATHI RIVER, INDIA ABSTRACT INTRODUCTION
 ESTIMATING SNOWMELT CONTRIBUTION FROM THE GANGOTRI GLACIER CATCHMENT INTO THE BHAGIRATHI RIVER, INDIA Rodney M. Chai 1, Leigh A. Stearns 2, C. J. van der Veen 1 ABSTRACT The Bhagirathi River emerges from
9. PROBABLE MAXIMUM PRECIPITATION AND PROBABLE MAXIMUM FLOOD
 9. PROBABLE MAXIMUM PRECIPITATION AND PROBABLE MAXIMUM FLOOD 9.1. Introduction Due to the size of Watana Dam and the economic importance of the Project to the Railbelt, the Probable Maximum Flood (PMF)
Effect of land use/land cover changes on runoff in a river basin: a case study
 Water Resources Management VI 139 Effect of land use/land cover changes on runoff in a river basin: a case study J. Letha, B. Thulasidharan Nair & B. Amruth Chand College of Engineering, Trivandrum, Kerala,
NASA Flood Monitoring and Mapping Tools
 National Aeronautics and Space Administration ARSET Applied Remote Sensing Training http://arset.gsfc.nasa.gov @NASAARSET NASA Flood Monitoring and Mapping Tools www.nasa.gov Outline Overview of Flood
EFFICIENCY OF THE INTEGRATED RESERVOIR OPERATION FOR FLOOD CONTROL IN THE UPPER TONE RIVER OF JAPAN CONSIDERING SPATIAL DISTRIBUTION OF RAINFALL
 EFFICIENCY OF THE INTEGRATED RESERVOIR OPERATION FOR FLOOD CONTROL IN THE UPPER TONE RIVER OF JAPAN CONSIDERING SPATIAL DISTRIBUTION OF RAINFALL Dawen YANG, Eik Chay LOW and Toshio KOIKE Department of
Analysis of real-time prairie drought monitoring and forecasting system. Lei Wen and Charles A. Lin
 Analysis of real-time prairie drought monitoring and forecasting system Lei Wen and Charles A. Lin Back ground information A real-time drought monitoring and seasonal prediction system has been developed
Comparison of remote sensing derived glacier facies maps with distributed mass balance modelling at Engabreen, northern Norway
 126 Glacier Mass Balance Changes and Meltwater Discharge (selected papers from sessions at the IAHS Assembly in Foz do Iguaçu, Brazil, 2005). IAHS Publ. 318, 2007. Comparison of remote sensing derived
Operational snowmelt runoff forecasting in the Spanish Pyrenees using the snowmelt runoff model
 HYDROLOGICAL PROCESSES Hydrol. Process. 16, 1583 1591 (22) Published online in Wiley InterScience (www.interscience.wiley.com). DOI: 1.12/hyp.122 Operational snowmelt runoff forecasting in the Spanish
Ocean & Sea Ice SAF. Validation of ice products January March Version 1.1. May 2005
 Ocean & Sea Ice SAF Validation of ice products January 2002 - March 2005 Version 1.1 May 2005 Morten Lind, Keld Q. Hansen, Søren Andersen 1 INTRODUCTION... 3 2 PRODUCTS VALIDATION METHODS... 3 3 GENERAL
NIDIS Intermountain West Drought Early Warning System November 21, 2017
 NIDIS Drought and Water Assessment NIDIS Intermountain West Drought Early Warning System November 21, 2017 Precipitation The images above use daily precipitation statistics from NWS COOP, CoCoRaHS, and
Global SWE Mapping by Combining Passive and Active Microwave Data: The GlobSnow Approach and CoReH 2 O
 Global SWE Mapping by Combining Passive and Active Microwave Data: The GlobSnow Approach and CoReH 2 O April 28, 2010 J. Pulliainen, J. Lemmetyinen, A. Kontu, M. Takala, K. Luojus, K. Rautiainen, A.N.
NIDIS Intermountain West Drought Early Warning System September 4, 2018
 NIDIS Drought and Water Assessment NIDIS Intermountain West Drought Early Warning System September 4, 2018 Precipitation The images above use daily precipitation statistics from NWS COOP, CoCoRaHS, and
Evaluation of distributed snowpack simulation with in-situ and remote sensing information in Arveupper catchment
 Evaluation of distributed snowpack simulation with in-situ and remote sensing information in Arveupper catchment J. Revuelto 1,2, G. Lecourt 2, L. Charrois 2, T. Condom 1, M. Dumont 2, M. Lafaysse 2,,
Trends in floods in small Norwegian catchments instantaneous vs daily peaks
 42 Hydrology in a Changing World: Environmental and Human Dimensions Proceedings of FRIEND-Water 2014, Montpellier, France, October 2014 (IAHS Publ. 363, 2014). Trends in floods in small Norwegian catchments
Data Fusion and Multi-Resolution Data
 Data Fusion and Multi-Resolution Data Nature.com www.museevirtuel-virtualmuseum.ca www.srs.fs.usda.gov Meredith Gartner 3/7/14 Data fusion and multi-resolution data Dark and Bram MAUP and raster data Hilker
Module 2.1 Monitoring activity data for forests using remote sensing
 Module 2.1 Monitoring activity data for forests using remote sensing Module developers: Frédéric Achard, European Commission (EC) Joint Research Centre (JRC) Jukka Miettinen, EC JRC Brice Mora, Wageningen
Assimilation of GlobSnow Data in HIRLAM. Suleiman Mostamandy Kalle Eerola Laura Rontu Katya Kourzeneva
 Assimilation of GlobSnow Data in HIRLAM Suleiman Mostamandy Kalle Eerola Laura Rontu Katya Kourzeneva 10/03/2011 Contents Introduction Snow from satellites Globsnow Other satellites The current study Experiment
Project title. Evaluation of MIR data from SPOT4/VEGETATION for the monitoring of climatic phenomena impact on vegetation
 Project title 1 Evaluation of MIR data from SPOT4/VEGETATION for the monitoring of climatic phenomena impact on vegetation Principal investigator: M-Christine IMBERTI Co-investigator: Frédéric BIARD Stockholm
NIDIS Intermountain West Drought Early Warning System November 14, 2017
 NIDIS Intermountain West Drought Early Warning System November 14, 2017 Precipitation The images above use daily precipitation statistics from NWS COOP, CoCoRaHS, and CoAgMet stations. From top to bottom,
SNOW COVER MONITORING IN ALPINE REGIONS WITH COSMO-SKYMED IMAGES BY USING A MULTITEMPORAL APPROACH AND DEPOLARIZATION RATIO
 SNOW COVER MONITORING IN ALPINE REGIONS WITH COSMO-SKYMED IMAGES BY USING A MULTITEMPORAL APPROACH AND DEPOLARIZATION RATIO B. Ventura 1, T. Schellenberger 1, C. Notarnicola 1, M. Zebisch 1, T. Nagler
NIDIS Intermountain West Drought Early Warning System August 8, 2017
 NIDIS Drought and Water Assessment 8/8/17, 4:43 PM NIDIS Intermountain West Drought Early Warning System August 8, 2017 Precipitation The images above use daily precipitation statistics from NWS COOP,
2015 Fall Conditions Report
 2015 Fall Conditions Report Prepared by: Hydrologic Forecast Centre Date: December 21 st, 2015 Table of Contents Table of Figures... ii EXECUTIVE SUMMARY... 1 BACKGROUND... 2 SUMMER AND FALL PRECIPITATION...
Dear Editor, Response to Anonymous Referee #1. Comment 1:
 Dear Editor, We would like to thank you and two anonymous referees for the opportunity to revise our manuscript. We found the comments of the two reviewers very useful, which gave us a possibility to address
LANDSAF SNOW COVER MAPPING USING MSG/SEVIRI DATA
 LANDSAF SNOW COVER MAPPING USING MSG/SEVIRI DATA Niilo Siljamo and Otto Hyvärinen Finnish Meteorological Institute, Erik Palménin aukio 1, P.O.Box 503, FI-00101 Helsinki, Finland Abstract Land Surface
MSG/SEVIRI AND METOP/AVHRR SNOW EXTENT PRODUCTS IN H-SAF
 MSG/SEVIRI AND METOP/AVHRR SNOW EXTENT PRODUCTS IN H-SAF Niilo Siljamo, Otto Hyvärinen Finnish Meteorological Institute, Erik Palménin aukio 1, Helsinki, Finland Abstract Weather and meteorological processes
Snow Water Equivalent (SWE) of dry snow derived from InSAR -theory and results from ERS Tandem SAR data
 of dry snow derived from InSAR -theory and results from ERS Tandem SAR data") Snow Water Equivalent (SWE) of dry snow derived from InSAR -theory and results from ERS Tandem SAR data Tore Guneriussen, Kjell Arild Høgda, Harald Johnsen and Inge Lauknes NORUT IT Ltd., Tromsø Science
Snow Water Equivalent (SWE) of dry snow derived from InSAR -theory and results from ERS Tandem SAR data Tore Guneriussen, Kjell Arild Høgda, Harald Johnsen and Inge Lauknes NORUT IT Ltd., Tromsø Science
SNOW AND GLACIER HYDROLOGY
 SNOW AND GLACIER HYDROLOGY by PRATAP SINGH National Institute of Hydrology, Roorkee, India and VIJAY P. SINGH Department of Civil and Environmental Engineering, Louisiana State University, Baton Rouge,
Ocean & Sea Ice SAF. Validation of ice products January September Version 1.0. September 2004
 Ocean & Sea Ice SAF Validation of ice products January 2002 - September 2004 Version 1.0 September 2004 Keld Q. Hansen, Morten Lind, Søren Andersen 1 INTRODUCTION... 3 2 PRODUCTS VALIDATION METHODS...
Precipitation. Standardized Precipitation Index. NIDIS Intermountain West Regional Drought Early Warning System January 3, 2017
 1/3/2017 NIDIS Drought and Water Assessment NIDIS Intermountain West Regional Drought Early Warning System January 3, 2017 Precipitation The images above use daily precipitation statistics from NWS COOP,
NIDIS Intermountain West Drought Early Warning System December 18, 2018
 NIDIS Intermountain West Drought Early Warning System December 18, 2018 Precipitation The images above use daily precipitation statistics from NWS COOP, CoCoRaHS, and CoAgMet stations. From top to bottom,
REMOTE SENSING OF SNOW COVER FOR OPERATIONAL FORECASTS *
 REMOTE SENSING OF SNOW COVER FOR OPERATIONAL FORECASTS * K. Seidel, J. Martinec, C. Steinmeier and W. Bruesch Remote Sensing Group Institute for Communication Technology Swiss Federal Institute of Technology
NIDIS Intermountain West Drought Early Warning System February 6, 2018
 NIDIS Intermountain West Drought Early Warning System February 6, 2018 Precipitation The images above use daily precipitation statistics from NWS COOP, CoCoRaHS, and CoAgMet stations. From top to bottom,
SNOWMELT RUNOFF ESTIMATION OF A HIMALIYAN WATERSHED THROUGH REMOTE SENSING, GIS AND SIMULATION MODELING
 SNOWMELT RUNOFF ESTIMATION OF A HIMALIYAN WATERSHED THROUGH REMOTE SENSING, GIS AND SIMULATION MODELING A. Alam g, *, A. H. Sheikh g, S. A. Bhat g, A. M.Shah g g Department of Geology & Geophysics University
3.0 TECHNICAL FEASIBILITY
 3.0 TECHNICAL FEASIBILITY 3.1 INTRODUCTION To enable seasonal storage and release of water from Lake Wenatchee, an impoundment structure would need to be constructed on the lake outlet channel. The structure
Modelling the spatial variability of snow water equivalent at the catchment scale
 Author(s) 7. This work is licensed under a Creative Commons License. Hydrology and Earth System Sciences Modelling the spatial variability of snow water equivalent at the catchment scale T. Skaugen Norwegian
NIDIS Intermountain West Drought Early Warning System April 16, 2019
 NIDIS Intermountain West Drought Early Warning System April 16, 2019 Precipitation The images above use daily precipitation statistics from NWS COOP, CoCoRaHS, and CoAgMet stations. From top to bottom,
Flood Risk Assessment
 Flood Risk Assessment February 14, 2008 Larry Schick Army Corps of Engineers Seattle District Meteorologist General Assessment As promised, La Nina caused an active winter with above to much above normal
Solution: The ratio of normal rainfall at station A to normal rainfall at station i or NR A /NR i has been calculated and is given in table below.
 3.6 ESTIMATION OF MISSING DATA Data for the period of missing rainfall data could be filled using estimation technique. The length of period up to which the data could be filled is dependent on individual
NIDIS Intermountain West Drought Early Warning System January 15, 2019
 NIDIS Drought and Water Assessment NIDIS Intermountain West Drought Early Warning System January 15, 2019 Precipitation The images above use daily precipitation statistics from NWS COOP, CoCoRaHS, and
Remote Sensing of SWE in Canada
 Remote Sensing of SWE in Canada Anne Walker Climate Research Division, Environment Canada Polar Snowfall Hydrology Mission Workshop, June 26-28, 2007 Satellite Remote Sensing Snow Cover Optical -- Snow
Open Source ENKI: Dynamic Environmental Model Framework. A possible pre-processor for WRF-Hydro?
 Open Source ENKI: Dynamic Environmental Model Framework A possible pre-processor for WRF-Hydro? 1st European Fully Coupled AtmosphericHydrological Modeling and WRF-Hydro Users workshop. University of Calabria.
Real Time (RT) Snow Water Equivalent (SWE) Simulation May 11, 2014 Sierra Nevada Mountains, California
 Snow Water Equivalent (SWE) Simulation May 11, 2014 Sierra Nevada Mountains, California") Real Time (RT) Snow Water Equivalent (SWE) Simulation May 11, 2014 Sierra Nevada Mountains, California Abstract On May 11 th, percent of average SWE values for this date have shown an increase (see note
Real Time (RT) Snow Water Equivalent (SWE) Simulation May 11, 2014 Sierra Nevada Mountains, California Abstract On May 11 th, percent of average SWE values for this date have shown an increase (see note
USE OF SATELLITE INFORMATION IN THE HUNGARIAN NOWCASTING SYSTEM
 USE OF SATELLITE INFORMATION IN THE HUNGARIAN NOWCASTING SYSTEM Mária Putsay, Zsófia Kocsis and Ildikó Szenyán Hungarian Meteorological Service, Kitaibel Pál u. 1, H-1024, Budapest, Hungary Abstract The
NIDIS Intermountain West Drought Early Warning System February 12, 2019
 NIDIS Intermountain West Drought Early Warning System February 12, 2019 Precipitation The images above use daily precipitation statistics from NWS COOP, CoCoRaHS, and CoAgMet stations. From top to bottom,
Oregon Water Conditions Report April 17, 2017
 Oregon Water Conditions Report April 17, 2017 Mountain snowpack continues to maintain significant levels for mid-april. By late March, statewide snowpack had declined to 118 percent of normal after starting
Data Quality and Uncertainty. Accuracy, Precision, Data quality and Errors
 Data Quality and Uncertainty The power of GIS analysis is based on the assembly of layers of data, but as data layers increase, errors multiply (and quality decreases). Garbage in, garbage out. High quality
PRECIPITATION. Last Week Precipitation:
 12/3/2014 NIDIS Drought and Water Assessment PRECIPITATION The images above use daily precipitation statistics from NWS COOP, CoCoRaHS, and CoAgMet stations. From top to bottom, and left to right: most
Effects of distribution level of hydrological models in mountainous catchments
 Cold and Mountain Region Hydrological Systems Under Climate Change: Towards Improved Projections Proceedings of H02, IAHS-IAPSO-IASPEI Assembly, Gothenburg, Sw eden, July 2013 (IAHS Publ. 360, 2013). 53
III. Publication III. c 2004 Authors
 III Publication III J-P. Kärnä, J. Pulliainen, K. Luojus, N. Patrikainen, M. Hallikainen, S. Metsämäki, and M. Huttunen. 2004. Mapping of snow covered area using combined SAR and optical data. In: Proceedings
Operational water balance model for Siilinjärvi mine
 Operational water balance model for Siilinjärvi mine Vesa Kolhinen, Tiia Vento, Juho Jakkila, Markus Huttunen, Marie Korppoo, Bertel Vehviläinen Finnish Environment Institute (SYKE) Freshwater Centre/Watershed
Inter-linkage case study in Pakistan
 7 th GEOSS Asia Pacific Symposium GEOSS AWCI Parallel Session: 26-28 May, 2014, Tokyo, Japan Inter-linkage case study in Pakistan Snow and glaciermelt runoff modeling in Upper Indus Basin of Pakistan Maheswor
Calibration of HBV hydrological models using PEST parameter estimation. Deborah Lawrence Ingjerd Haddeland Elin Langsholt R E P O R T
 Calibration of HBV hydrological models using PEST parameter estimation Deborah Lawrence Ingjerd Haddeland Elin Langsholt 1 2009 R E P O R T Calibration of HBV hydrological models using PEST parameter estimation