DECISION SUPPORT FOR FREEZE PROTECTION USING ARTIFICIAL NEURAL NETWORKS
|
|
|
- Kelley Wright
- 5 years ago
- Views:
Transcription
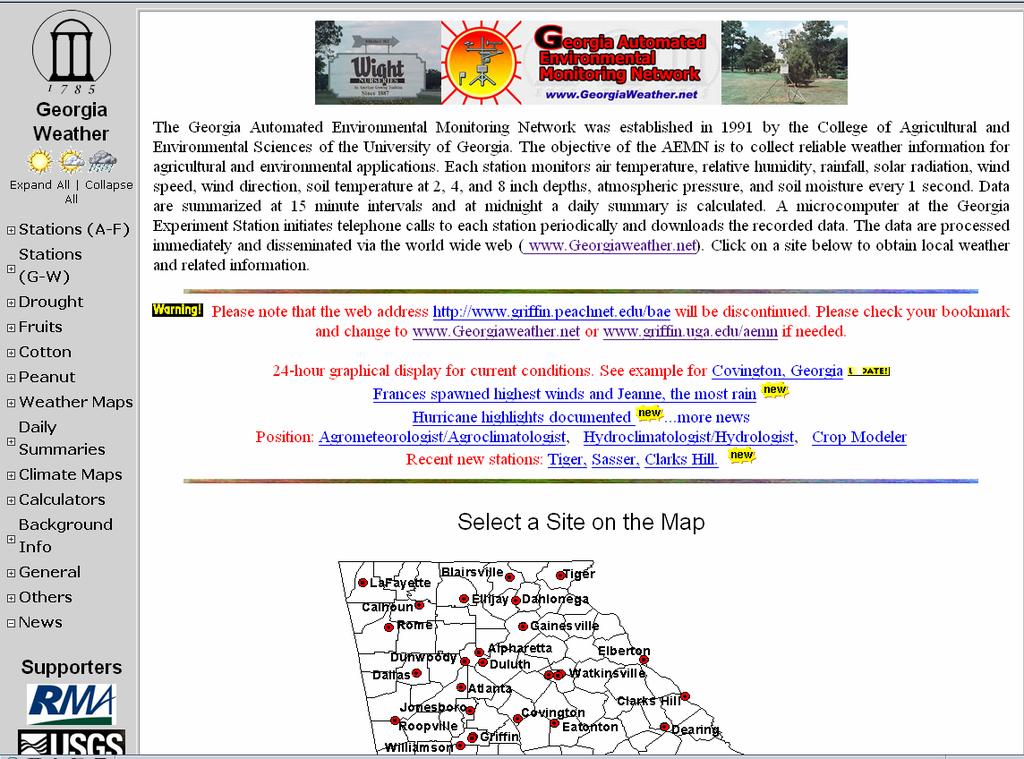
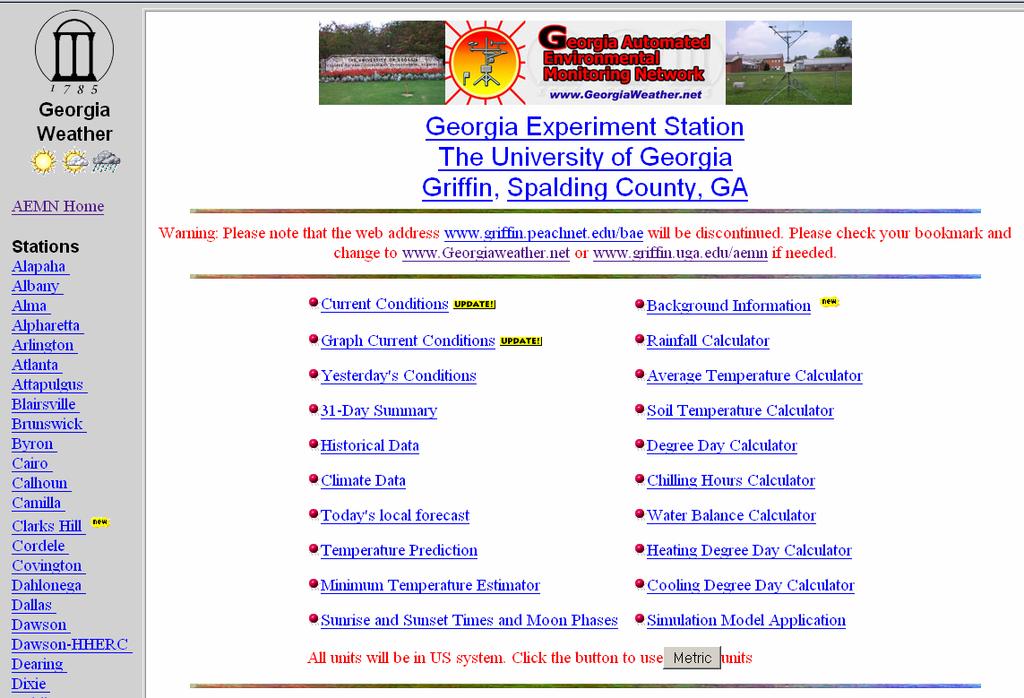
1 Agricultural Outlook Forum 2005 Presented Thursday February 24, 2005 DECISION SUPPORT FOR FREEZE PROTECTION USING ARTIFICIAL NEURAL NETWORKS Ronald W. McClendon, Professor Gerrit Hoogenboom, Professor Biological & Agricultural Engineering, University of Georgia Introduction In rainfed agricultural production systems, up to 90% of the variability in the yield can be attributed to weather differences. Fruit crops such as blueberries and peaches are particularly susceptible to low air temperatures. Temperatures near but above freezing might slow plant growth and development but such conditions do not typically cause significant damage if the plants are exposed for a short duration. However, once the temperature drops below freezing, the plants are easily damaged, with the severity of damage being determined by the duration of low temperature as well as the temperature itself. As an example, during the Spring of 2002, a large area in blueberry and peach production in South Georgia was damaged due to an unusually severe and unexpected late frost. Irrigation is the most widely practiced frost protection measure for southeastern U.S. crops including peaches and blueberries. Irrigation results in the formation of a layer of ice that keeps the temperature of the flower near freezing, preventing it from dropping to below freezing temperatures. Farmers need information about when to start irrigation, as the process has to be started before the temperature drops to freezing. In addition to the expected low temperatures, farmers also need information about local wind speed, dew point or vapor pressure deficit to determine the point to initiate the freeze protection measures. Thus there is a need for accurate local weather information and short-term weather forecasts. The goal of frost/freeze protection is to prevent plant parts (particularly flower and fruit) from being damaged by temperatures that drop below a critical level. This critical temperature is a function of crop variety and growth stage. There are several factors that can affect the degree of injury due to low temperature including the following: 1) type of plant, 2) stage of development of the crop, 3) the amount of leaf cover over the blossoms and fruit, 4) severity and duration of the freeze, and 5) wind speed. The primary prevention mechanism used by horticultural growers is irrigation. However, there are some problems associated with irrigating to prevent frost and freeze damage. If the humidity is low and the wind speed is high during a freeze, insufficient irrigation may cause evaporative cooling, which may damage crops more than non-irrigated fields. There are a number of recommendations that have been published by the extension service regarding frost/freeze damage: 1) If relative humidity is greater than 90%, there is little likelihood of worsening freeze damage with irrigation. 2) Open blueberry flowers cannot survive temperature less than 28 º F. At the petal fall, the developing berry can be damaged by temperatures less than 30 º F.
2 Agricultural Outlook Forum 2005 Presented Thursday February 24, ) Overhead irrigation can be effective in preventing damage to blueberries if there is very little wind when the temperature drops below freezing. 4) If the humidity is low, irrigation should begin when temperature drops to 37 º F. 5) If the temperature drops to the low 20s or below, or if wind is higher than 5 miles an hour, irrigation can cause increased damage. 6) If wind rises to 5 miles an hour, an application rate of 0.5 inches per hour will be needed to give some protection from frost or freeze damage. 7) At wind speeds above 5 miles an hour, more damage may be done by irrigating than by non-irrigating. The dewpoint temperature is an important factor in decision making related to frost/freeze protection. Producers need an accurate estimate of temperature, wind speed, relative humidity or dew point temperature during critical times of the freeze. The dewpoint temperature is useful for estimating moisture content of air during freezes. With little wind, the dewpoint temperature changes only slightly between noon and the following sunrise, which makes it a good indicator of humidity. Relative humidity, however, may have large fluctuations during such periods. Traditionally the role of providing weather forecasts has been the responsibility of the National Weather Service (NWS). However, due to changes in the laws, the NWS no longer provides data for agricultural applications. The NWS collects data from urban centers, thus the data are less useful for rural areas where farming is mostly done. In response to this need, the University of Georgia initiated the Georgia Automated Environmental Monitoring Network (AEMN) (Hoogenboom, 1996; 2000a; 2000b; Hoogenboom et al., 2000). This is a network of automated weather stations that are mainly located in the rural areas of Georgia ( These weather stations collect data every second on the following variables: air temperature, relative humidity, soil temperature at 5 cm, 10 cm and 20 cm depths, wind speed, wind direction, solar radiation, vapor pressure deficit and soil moisture. The averages, or totals depending on the variable, are calculated every fifteen minutes and stored in the data logger. In addition, daily summaries are also calculated. The 15-minute and daily summary data are downloaded automatically to a central computer located in Griffin. The website disseminates this information as well as simple calculators that can dynamically provide degree days, chilling hours or water balance for management of irrigation (Georgiev and Hoogenboom, 1998; 1999; Hoogenboom et al., 1998). An Artificial Neural Network (ANN) is a computational intelligence technique that mimics the behavior of neurons in the brain. The basic components of an ANN are its nodes or neurons and the connections between the nodes. A node is primarily a computational unit. It receives inputs, calculates a weighted sum and presents the sum to an activation function. The nodes are generally arranged in layers. In the back propagation ANN architecture, the input layer nodes receive the inputs and pass the results of their computations to the nodes in the hidden layer by means of the connections. The hidden nodes sum these weighted values as inputs, calculate an activation level and pass the results to the output nodes. For an ANN to be useful it should be able to learn or capture the complex relationships between inputs and outputs. This is done by searching for an optimal set of the weights of the
3 Agricultural Outlook Forum 2005 Presented Thursday February 24, 2005 connections between the nodes. It is achieved by first sending one set of inputs in the feed forward mode through the ANN. The error between the ANN output and the expected output is calculated. The error is then used to adjust the weights of the connections by using the method of gradient descent. The data that are used for this process are called the training data. The process is repeated until the error on another set of data called the testing data reaches a minimum. The testing data set is used in the feed forward mode only and are not used to adjust the weights. The training data and testing data comprise the model development data set. Once the training is complete, the ANN is then used with a separate model evaluation data set to determine its accuracy. The overall goal of the research reported herein is to develop an ANN based Decision Support System (DSS) for predicting the occurrence of frost by predicting hourly temperatures during the subsequent twelve hour period. The most important inputs needed for the temperature predictions will be determined. Methodology Weather data for this study were obtained from the Georgia AEMN for the fruit producing areas of Georgia, including sites in peach producing areas (Fort Valley and Blairsville) as well as a blueberry producing area (Alma). The data from each location were divided into a model development set and model evaluation set. Data prior to 2001 were used for model development and data from years 2001 and 2002 were used for model evaluation. A final evaluation of the models was performed with data for 2003 since the 2001 and 2002 data, while not directly used for model development, were used to select the best configuration of hidden nodes. Only data from the months of January through April were used in the study. It is during this period that air temperatures vary between freezing and non-freezing and the crops are susceptible to freeze conditions. The weather data consisted of observations of temperature, relative humidity, wind speed, solar radiation and rainfall. The current values of these variables were used as inputs along with corresponding prior values of these variables. The change in value of the weather variables from the prior values to current value ( ) were calculated and also used as inputs. To identify which weather variables are important, experiments were conducted with the hourly data from Fort Valley. The duration of prior data was held constant at four hours and the period of prediction was kept constant at four hours. The first set of experiments was performed to determine the best architecture when only temperature and its related inputs i.e. four hours of prior temperatures as well as their respective values were used along with time of day. This set of inputs was called the core set of input variables. It was assumed that the current and prior air temperatures as well as time of day were important input variables. Subsequently, experiments were conducted for determining the best architecture when two weather variables are used as inputs. For this set of experiments the core set of inputs was used in conjunction with each of the other weather variables (relative humidity, solar radiation, rainfall and wind speed) one at a time to serve as the inputs. These experiments were then ranked based on the accuracy of their best architectures. The combination ranked first then became the new core set of inputs and
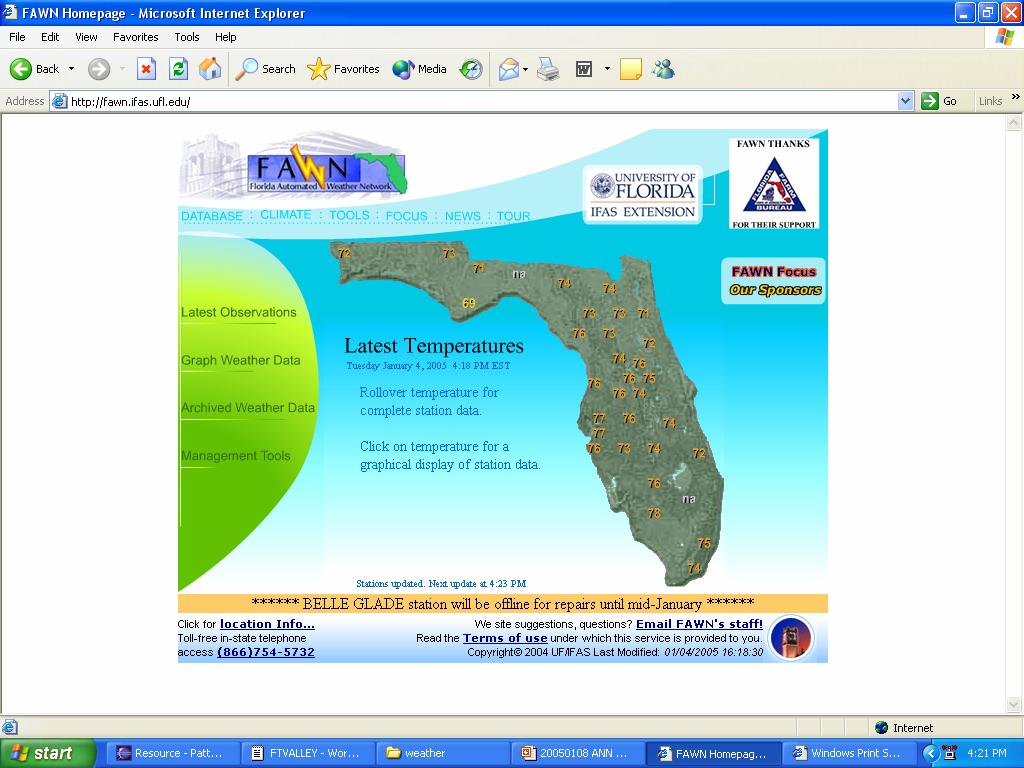
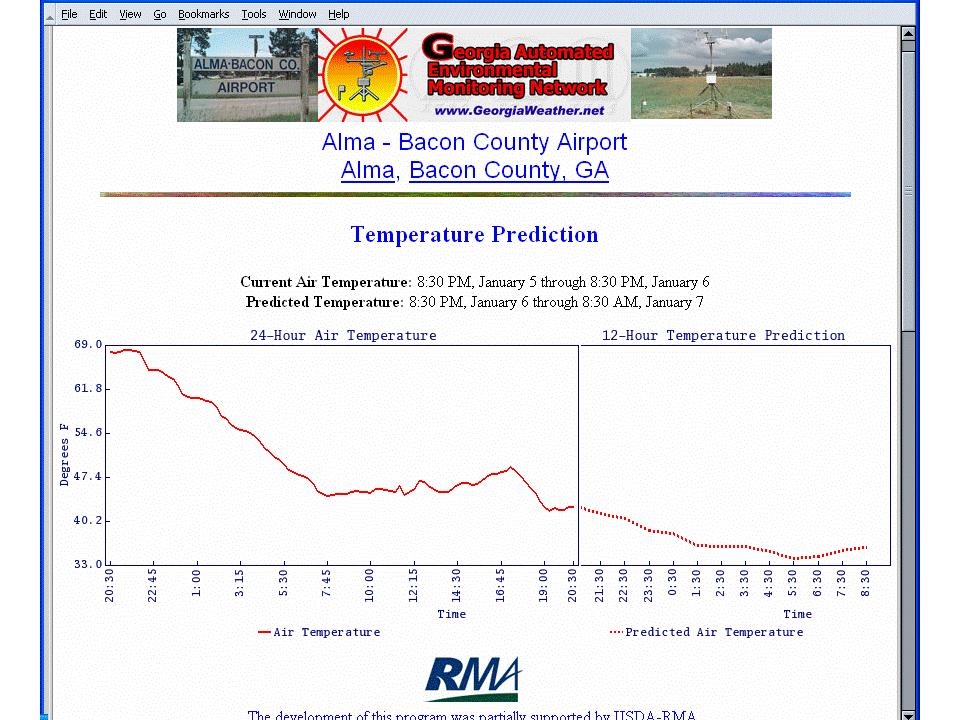
4 Agricultural Outlook Forum 2005 Presented Thursday February 24, 2005 subsequent experiments were conducted by adding a third weather variable. This process was carried out until the most important input variables were determined in order of importance. Results A study was performed to determine the most important input variables. When using only temperature and its associated values as the only inputs, it was found that the lowest MAE was 1.41 o C when predicting four hours in the future. Each of the remaining weather variables and associated values were included one at a time to determine the next most important input variables. Using this approach it was thus determined that the order of importance of the weather variable inputs considered was temperature, relative humidity, wind speed and solar radiation. The addition of rainfall slightly reduced the accuracy of the ANNs and it was thus excluded from all subsequent model development. As expected, the accuracy of the ANNs decreased as the prediction period increased. Using the hourly format the MAE for predicting the temperature one hour in the future was 0.56 o C and was 2.36 o C for predicting temperature twelve hours in the future. A plot of predicted temperatures for a one hour period of prediction vs. the observed temperatures using the hourly data format for Fort Valley, GA, is shown. A linear regression line fit to this data gives an R 2 of A similar plot of predicted temperatures for a twelve hour period is shown. As expected, the scatter is greater for the 12 hour period of prediction and the R 2 is The overall goal of this project was to develop ANN models for predicting temperatures which could be incorporated into a real time frost warning system. As such, all twelve ANNs predicting hourly temperatures for a given location were used to generate a simulated temperature forecast for the subsequent twelve hours. The outputs from the twelve networks that were developed were combined into a Decision Support System for frost prediction. Sample periods of data were selected for the simulation which included a freeze event. A Decision Point (DP) is defined as that point in time t when all networks are presented with the latest values of the input variables. For the simulation, the first decision point (DP1) was selected to be approximately ten hours prior to a freeze event. The subsequent decision points follow on an hourly basis. Five day plots of predicted temperature and observed temperature versus time are shown using the eight hour prediction model. The data are for Ft. Valley, GA for February 24-March 1, 2002 and March 2-March 7, The model predicted the occurrences and durations of freezing conditions with reasonable accuracy. An animation of an actual twelve hour temperature prediction for Alma, GA in Bacon county is shown for the period January 5 through January 7, For this plot the prediction is updated every 45 minutes, although it could be performed every 15 minutes. As an indication of the value of this frost/freeze decision support system, a quote from a UGA College of Agricultural and Environmental Sciences (CAES) county agent is included as an appendix. Robert T. Boland, Jr., county agent of Brantley County, Georgia, included this impact statement on the CAES website regarding the value of the AEMN weather network.
5 Agricultural Outlook Forum 2005 Presented Thursday February 24, 2005 Acknowledgements This work was funded in part by the USDA Federal Crop Insurance Corporation Risk Management Agency and by State and Federal Funds allocated to Georgia Agricultural Experiment Stations Hatch projects GEO00877 and GEO References Georgiev, G. and G. Hoogenboom Crop growth and yield estimation using current weather forecasts and weather observations, p 69-72, In: Preprints of the 23 rd Conf. On Agricultural and Forest Meteorology, American Meteorological Society, Boston, Massachusetts. Georgiev, G. A. and G. Hoogenboom Near real-time agricultural simulations on the web, Simulation 73(1): Hoogenboom, G The Georgia Automated Environmental Monitoring Network, In: Preprints of the 22 nd Conf. On Agricultural and Forest Meteorology , Boston, Mass., American Meteorological Society. Hoogenboom, G. 2000a. Contribution of agrometeorlogy to the simulation of crop production and its applications, Agricultural and Forest Meteorology 103(1-2): Hoogenboom, G. 2000b. The Georgia Automated Environmental Monitoring Network, p , In: Preprints of the 24 th Conference On Agricultural and Forest Meteorology, American Meteorological Society, Boston, Massachusetts. Hoogenboom, G., G. Georgiev, D. Clarke, D.D. Gresham and G. Harbers Internet Tools for delivery of weather data and applications, p , In: Preprints of the 23 rd Conf. On Agricultural and Forest Meteorology, American Meteorological Society, Boston, Massachusetts. Hoogenboom, G., G. A. Georgiev, and D.D. Gresham Development of weather based products for agricultural and environmental applications, p , In: Preprints of the 24 th Conf. On Agricultural and Forest Meteorology, Boston, Mass., American Meteorological Society.
6 Agricultural Outlook Forum 2005 Presented Thursday February 24, 2005 Appendix Freeze Protection for Southern Highbush Blueberries Robert T. Boland Jr. Brantley County Situation Brantley County s growth in Southern Highbush Blueberries acreage is on the increase. Southern Highbush Blueberries are harvested around April 15 th in Brantley County. This is a time when Florida is finishing their blueberry harvest, and the price for early Georgia Southern Highbush Blueberries start around $36.00 a flat ($10.00/lb). However, producing the early maturing Southern Highbush Blueberry is not without risk. Late winter freezes can wipe out an entire crop. To reduce this risk of late winter freezes growers must use irrigation to protect the fruit and blooms. This method of irrigation involves a process of water melting and freezing, which keeps the fruit and blooms at a temperature around 32. The key variable with freeze protection is knowing when to start irrigating. This requires knowing temperature, relative humidity, and dew points. Brantley County Blueberry growers were getting their weather information from the Weather Channel web site and from NOAA Weather Station in Jacksonville, Florida. However, this data is not generated in Brantley County. Due to the lack of good weather information ZBLU Farms experience a loss of about 80% of the crop, which includes the early Southern Highbush Blueberry. Response To address this problem for future Blueberry crops, the Brantley County Extension Coordinator contacted Dr. Gerrit Hoogenboom, Coordinator of the UGA s College of Agriculture and Environmental Sciences/Georgia Automated Environmental Monitoring Network about locating a weather station in Brantley County. This weather station would give growers in Brantley County local weather information. The request was granted and a weather station was located in Brantley County at ZBLU Farms on March 22, ZBLU Farms provide the local phone line allowing Dr. Hoogenboom to collect weather data and post it on the web. Results Brantley County Southern Highbush Blueberry growers have an early market window during which they can receive higher prices, around $10.00 a pound. However, with early maturing varieties they face the risk of late freezes. Losses from the February 28, 2002 freeze were a whopping 80%, an estimated $115, loss to the Brantley County Blueberry crop to the early maturing varieties. The Georgia Automated Environmental Monitoring Network is, and will continue to be a management tool which Brantley County Southern Highbush Blueberry growers are using to monitor weather condition in the county. This weather station will allow growers to use current and local weather data to guide them on when to start freeze protection for their blueberries.
7 Decision Support for Freeze Protection Using Artificial Neural Networks R.W. McClendon, G. Hoogenboom A. Jain, R. Ramyaa, B.A. Smith Biological & Agricultural Engineering, University of Georgia, Athens and Griffin Campuses Artificial Intelligence Center Agricultural Outlook Forum 2005
8 Discussion 1) Frost/Freeze Problem 2) Recommendations 3) Weather Monitoring Systems
9 1) Frost / Freeze Problem
10 Goal Goal of Frost/Freeze Protection is to prevent plant parts (particularly flower and fruit) from being damaged by temperatures that drop below a critical level. Critical temperature is a function of crop, variety and growth stage.
11 Factors in degree of injury due to low temperature 1) Type of plant 2) Stage of development of the crop 3) Amount of leaf cover over the blossoms and fruit 4) Severity and duration of freeze 5) Wind speed
12 Problem associated with irrigation If humidity is low and wind speed is high during freeze, insufficient irrigation may cause evaporative cooling which may damage crops more than non-irrigated fields.
13 2) Recommendations
14 Recommendations If RH > 90%, little likelihood of worsening freeze damage with irrigation Open blueberry flowers cannot survive T < 28 ºF. After petal fall, the developing berry can be damaged by T < 30 ºF. Overhead irrigation can be very effective in preventing damage to blueberries if there is little wind when temp drops below freezing.
15 Recommendations If humidity is low, start irrigation at 37 ºF. If temp. drops to low 20 s or below or if wind is higher than 5 mph, sprinkling can cause increased damage.
16 Recommendations If wind rises to 5 mph, an application rate of 0.5 in. / hr. will be needed to give some protection. At wind speeds above 5 mph, more damage may be done by irrigating than not irrigating
17 Dew point temperature (T DP ) Producers need estimates of temperature, wind speed, relative humidity (or T DP ) during critical times of the freeze. T DP is useful for estimating moisture content of air during freezes. With little wind, the T DP changes little between noon and the following sunrise.
18 3) Weather Monitoring Systems
19 AEMN The University of Georgia s Automated Environmental Monitoring Network Dr. Gerrit Hoogenboom 58 automated weather stations in rural areas of Georgia
20 AEMN Stations

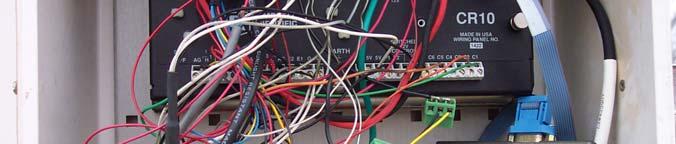


21 Equipment Campbell Scientific CR10/CR10X Measurement and Control Module
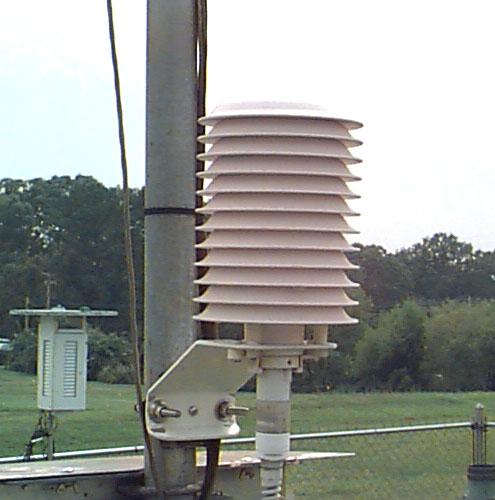
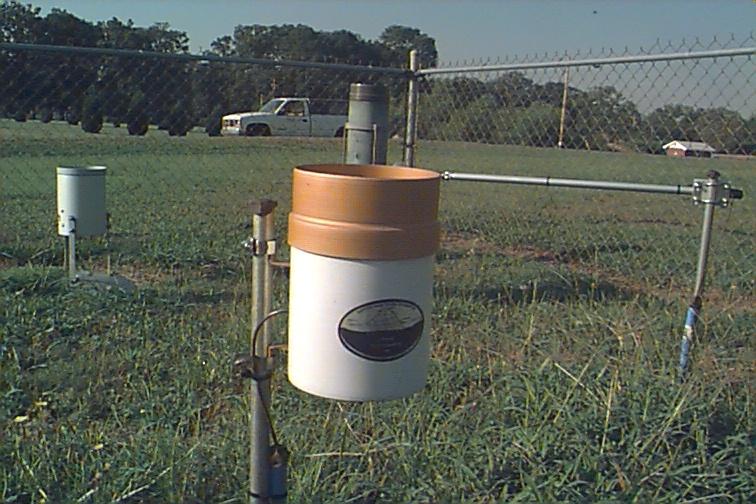
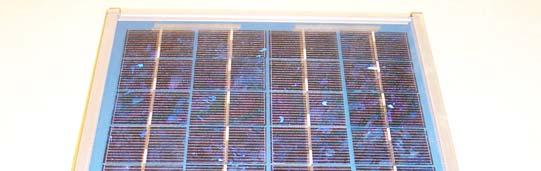
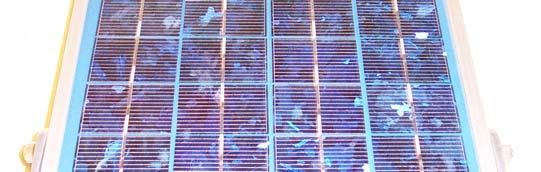
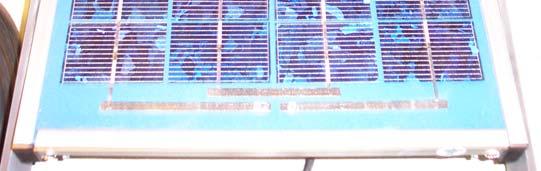
22 Air Temperature & Relative Humidity Rainfall CR10 Power Supply


23 Solar Radiation Wind Speed Wind Direction Soil Temperature

24 Communications Telephone Modem Voice modem Dedicated land lines Cellular phone/modem combination
25 Data Recording Collect data every second on: Air temperature Relative humidity Soil temperature (4 depths) Wind speed Wind direction Solar radiation Vapor pressure deficit Soil moisture
26 Data Recording Sensors are scanned at a one-second frequency Data are stored at 15-minute intervals 15-Minute Average 15-Minute Total Maximum wind speed Time of maximum wind speed First rainfall occurrence
 software for data")
27 Automated Processing Communications Call all stations, at least, every hour Call local stations at 15 minute intervals Loggernet (Campbell Scientific) software for data downloading
28
29 Simple Applications & Calculators Heat Index/Wind Chill (humans & livestock) WBGT Wet Bulb Globe Temperature = Heat stress index (humans & livestock) Degree Days Chilling Hours Water Balance Calculator Heating Degree Days Cooling Degree Days Rainfall Calculator Average Temperature Calculator Soil Temperature Calculator
30
31
32 FAWN
33
34
35
36 Approach Develop web-based, frost-warning Decision Support System (DSS) which utilizes current and prior weather data Use Artificial Neural Networks (ANNs) to develop the algorithms used in the DSS
37 Standard Three-Layer Back-Propagation Artificial Neural Network Input Layer Hidden Layer Output Layer Input 1 Input 2 Input 3 Output Input n Pattern Input 1 Input 2 Input 3 Input n Output
38 Temperature Rel. Humidity Wind Solar Radiation Rainfall MAE o C * X 1.41 X X 1.19 X X 1.34 X X 1.35 X X 1.44 X X X 1.15 X X X 1.17 X X X 1.21 X X X X 1.12 X X X X 1.16 X X X X X 1.14 * Ft. Valley evaluation data set, Four-hour temperature prediction
39 T(t) T(t-1) T(t-2) ANN architecture for 12-hour prediction T(t-x) SR(t) SR(t-1) SR(t-2) T(t+12 t+12) SR(t-y) Hidden Nodes Var(t-z)
40 Two General Categories of ANNs 1) Estimation of a numerical value 2) Classification We have pursued both types of ANNs in our research project.
41 A. Jain, M.S. Artificial Intelligence, UGA Developed estimation ANNs to predict air temperature in hourly increments from one to twelve hours in the future based on current and prior weather data.
42 R. Ramyaa, M.S. Artificial Intelligence, UGA Developed classification ANNs to predict if frost occurs in a subsequent four, eight, or twelve-hour period.
43 B.A. Smith, M.S. Artificial Intelligence, UGA (expected 2005) Developed software to allow the automatic training of large numbers of temperaturepredicting ANNs using larger data sets.
44 Initial Study Locations Blairsville North Georgia Mountains Fort Valley Central Georgia Alma South Georgia Weather Data Model Development: Model Evaluation:
45 Predicted and observed one-hour temperature predictions for Fort Valley, 2001 and 2002 data.
46 Predicted and observed twelve-hour temperature predictions for Fort Valley, 2001 and 2002 data.
47 A Predicted Freeze Event March 4, hrs to 2200hrs
48 Temperature ( o C) Observed Elapsed Time (Hrs) Observed temperatures on March 4, 2002, 1200hrs to 2200hrs
49 Temperature ( o C) Observed 1st DP Elapsed Time (Hrs) Predictions made from the Decision Points (DP), March 4, 2002, 1200hrs to 2200hrs
50 Temperature ( o C) Observed 1st DP 2nd DP Elapsed Time (Hrs) Predictions made from the Decision Points (DP), March 4, 2002, 1200hrs to 2200hrs
51 Temperature ( o C) Observed 1st DP 2nd DP 3rd DP Elapsed Time (Hrs) Predictions made from the Decision Points (DP), March 4, 2002, 1200hrs to 2200hrs
52 Temperature ( o C) Observed 4th DP Elapsed Time (Hrs) Predictions made from the Decision Points (DP), March 4, 2002, 1200hrs to 2200hrs
53 Temperature ( o C) Observed 4th DP 5th DP Elapsed Time (Hrs) Predictions made from the Decision Points (DP), March 4, 2002, 1200hrs to 2200hrs
54 Temperature ( o C) Observed 4th DP 5th DP 6th DP Elapsed Time (Hrs) Predictions made from the Decision Points (DP), March 4, 2002, 1200hrs to 2200hrs
55 Temperature ( o C) Observed 7th DP Elapsed Time (Hrs) Predictions made from the Decision Points (DP), March 4, 2002, 1200hrs to 2200hrs
56 Temperature ( o C) Observed 7th DP 8th DP Elapsed Time (Hrs) Predictions made from the Decision Points (DP), March 4, 2002, 1200hrs to 2200hrs
57 Temperature ( o C) Observed 7th DP 8th DP 9th DP Elapsed Time (Hrs) Predictions made from the Decision Points (DP), March 4, 2002, 1200hrs to 2200hrs
58 Temperature ( o C) Observed 10th DP Elapsed Time (Hrs) Predictions made from the Decision Points (DP), March 4, 2002, 1200hrs to 2200hrs
59 A Predicted Freeze Event January 8, hrs to 2400hrs
60 Temperature ( o C) Observed Elapsed Time (Hrs) Observed temperatures on, January 8, 2001, 1200hrs to 2400hrs
61 Temperature ( o C) Observed 1st DP Elapsed Time (Hrs) Predictions made from the Decision Points (DP), January 8, 2001, 1200hrs to 2400hrs
62 Temperature ( o C) Observed 1st DP 2nd DP Elapsed Time (Hrs) Predictions made from the Decision Points (DP), January 8, 2001, 1200hrs to 2400hrs
63 Temperature ( o C) Observed 1st DP 2nd DP 3rd DP Elapsed Time (Hrs) Predictions made from the Decision Points (DP), January 8, 2001, 1200hrs to 2400hrs
64 Temperature ( o C) Observed 4th DP Elapsed Time (Hrs) Predictions made from the Decision Points (DP), January 8, 2001, 1200hrs to 2400hrs
65 Temperature ( o C) Observed 4th DP 5th DP Elapsed Time (Hrs) Predictions made from the Decision Points (DP), January 8, 2001, 1200hrs to 2400hrs
66 Temperature ( o C) Observed 4th DP 5th DP 6th DP Elapsed Time (Hrs) Predictions made from the Decision Points (DP), January 8, 2001, 1200hrs to 2400hrs
67 Temperature ( o C) Observed 7th DP Elapsed Time (Hrs) Predictions made from the Decision Points (DP), January 8, 2001, 1200hrs to 2400hrs
68 Temperature ( o C) Observed 7th DP 8th DP Elapsed Time (Hrs) Predictions made from the Decision Points (DP), January 8, 2001, 1200hrs to 2400hrs
69 Temperature ( o C) Observed 7th DP 8th DP 9th DP Elapsed Time (Hrs) Predictions made from the Decision Points (DP), January 8, 2001, 1200hrs to 2400hrs
70 Temperature ( o C) Observed 10th DP Elapsed Time (Hrs) Predictions made from the Decision Points (DP), January 8, 2001, 1200hrs to 2400hrs
71 Temperature ( o C) Observed 10th DP 11th DP Elapsed Time (Hrs) Predictions made from the Decision Points (DP), January 8, 2001, 1200hrs to 2400hrs
72 Temperature ( o C) Observed 10th DP 11th DP 12th DP Elapsed Time (Hrs) Predictions made from the Decision Points (DP), January 8, 2001, 1200hrs to 2400hrs
73 Fort Valley-8 hour prediction February 24-March 1, Temperature ( o C) Observed Predicted Hours
74 Fort Valley-8 hour prediction March 2-7, Temperature ( o C) Observed Predicted Hours
75 Implementation During Spring 2004, the temperature prediction ANN was implemented on the website.
76
77 Robert T. Boland Jr., Brantley County Agent Brantley County Southern Highbush Blueberry growers have an early market window during which they can receive higher prices, around $10 per pound. However, with early maturing varieties they face the risk of late freezes. Losses from the Feb. 28, 2002 freeze were a whopping 80%, an estimated $115,000 loss to the Brantley County Blueberry crop s early maturing varieties. The Georgia [AEMN] is, and will continue to be, a management tool which Brantley County Southern Highbush Blueberry growers are using to monitor weather conditions... [It] will allow growers to use current and local weather data to guide them on when to start freeze protection for their blueberries.
78 Acknowledgement Risk Management Agency of the USDA Federal Crop Insurance Corporation

79 Decision Support for Freeze Protection Using Artificial Neural Networks Questions and Comments
PREDICTING AIR TEMPERATURE FOR FROST WARNING USING ARTIFICIAL NEURAL NETWORKS ABHISHEK JAIN. (Under the Direction of R.W. McClendon) ABSTRACT
 ABSTRACT") PREDICTING AIR TEMPERATURE FOR FROST WARNING USING ARTIFICIAL NEURAL NETWORKS by ABHISHEK JAIN (Under the Direction of R.W. McClendon) ABSTRACT One of the most important factors in crop growth is weather,
PREDICTING AIR TEMPERATURE FOR FROST WARNING USING ARTIFICIAL NEURAL NETWORKS by ABHISHEK JAIN (Under the Direction of R.W. McClendon) ABSTRACT One of the most important factors in crop growth is weather,
FROST PREDICTION USING ARTIFICIAL NEURAL NETWORKS: A CLASSIFICATION APPROACH RAMYAA. (Under the Direction of Ronald W. McClendon) ABSTRACT
 ABSTRACT") FROST PREDICTION USING ARTIFICIAL NEURAL NETWORKS: A CLASSIFICATION APPROACH by RAMYAA (Under the Direction of Ronald W. McClendon) ABSTRACT Air temperatures below freezing can damage plants. Irrigation
FROST PREDICTION USING ARTIFICIAL NEURAL NETWORKS: A CLASSIFICATION APPROACH by RAMYAA (Under the Direction of Ronald W. McClendon) ABSTRACT Air temperatures below freezing can damage plants. Irrigation
An Enhanced Artificial Neural Network for Air Temperature Prediction
 An Enhanced Artificial Neural Network for Air Temperature Prediction Brian A. Smith, Ronald W. McClendon, and Gerrit Hoogenboom Abstract The mitigation of crop loss due to damaging freezes requires accurate
AgWeatherNet A Tool for Making Decisions Based on Weather
 AgWeatherNet A Tool for Making Decisions Based on Weather Gerrit Hoogenboom Director, AgWeatherNet & Professor of Agrometeorology Washington State University Prosser, Washington November 14, 2013 Washington
Improving Air Temperature Prediction with Artificial Neural Networks
 Improving Air Temperature Prediction with Artificial Neural Networks Brian A. Smith, Ronald W. McClendon, and Gerrit Hoogenboom Abstract The mitigation of crop loss due to damaging freezes requires accurate
Using Sprinklers to Reduce Freeze Injury to Blueberries
 Using Sprinklers to Reduce Freeze Injury to Blueberries Mark Longstroth Extension Small Fruit Educator Paw Paw, Michigan Cold Front Coming Types of Frost Radiation Clear skies Calm Winds Advective Cold
Weather versus Climate: What is the difference? Sources of Weather Information
 Joel O. Paz, Extension Agrometerologist and Gerrit Hoogenboom, Professor & REI Coordinator Department of Biological and Agricultural Engineering Weather versus Climate: What is the difference? The difference
Operational MRCC Tools Useful and Usable by the National Weather Service
 Operational MRCC Tools Useful and Usable by the National Weather Service Vegetation Impact Program (VIP): Frost / Freeze Project Beth Hall Accumulated Winter Season Severity Index (AWSSI) Steve Hilberg
Weather Data for Citrus Irrigation Management 1
 HS950 Weather Data for Citrus Irrigation Management 1 Larry Parsons and Howard Beck 2 Weather is one of the most important factors that affects citrus growth and production. Citrus can be grown in a variety
Climate Change Impact on Air Temperature, Daily Temperature Range, Growing Degree Days, and Spring and Fall Frost Dates In Nebraska
 EXTENSION Know how. Know now. Climate Change Impact on Air Temperature, Daily Temperature Range, Growing Degree Days, and Spring and Fall Frost Dates In Nebraska EC715 Kari E. Skaggs, Research Associate
Frost Management. Recommended Practices
 Frost Management Cranberries, like many other temperate crops, are sensitive to below-freezing temperatures during the active growing season. This sensitivity is an important factor in cranberry management.
MxVision WeatherSentry Web Services Content Guide
 MxVision WeatherSentry Web Services Content Guide July 2014 DTN 11400 Rupp Drive Minneapolis, MN 55337 00.1.952.890.0609 This document and the software it describes are copyrighted with all rights reserved.
COMPARISON OF INDIVIDUAL, COMBINED AND SERIES ARTIFICIAL NEURAL NETWORK MODELS FOR AIR TEMPERATURE AND DEW POINT TEMPERATURE PREDICTION
 COMPARISON OF INDIVIDUAL, COMBINED AND SERIES ARTIFICIAL NEURAL NETWORK MODELS FOR AIR TEMPERATURE AND DEW POINT TEMPERATURE PREDICTION by KARTHIK VIVEK NADIG (Under the Direction of Dr. Walter D. Potter)
IMPROVING AIR TEMPERATURE AND DEW POINT TEMPERATURE PREDICTION ACCURACY OF ARTIFICIAL NEURAL NETWORKS
 IMPROVING AIR TEMPERATURE AND DEW POINT TEMPERATURE PREDICTION ACCURACY OF ARTIFICIAL NEURAL NETWORKS by SIVA VENKADESH IYAPPAN LATHA (Under the Direction of Walter D. Potter) ABSTRACT Air temperature
2012 will likely be remembered for the significant cold injury damage that occurred to fruit during the spring season. Our scheduled first speaker
 2012 will likely be remembered for the significant cold injury damage that occurred to fruit during the spring season. Our scheduled first speaker this afternoon was unable to attend today. Unable to secure
Range Cattle Research and Education Center January CLIMATOLOGICAL REPORT 2012 Range Cattle Research and Education Center.
 1 Range Cattle Research and Education Center January 2013 Research Report RC-2013-1 CLIMATOLOGICAL REPORT 2012 Range Cattle Research and Education Center Brent Sellers Weather conditions strongly influence
Range Cattle Research and Education Center January CLIMATOLOGICAL REPORT 2016 Range Cattle Research and Education Center.
 1 Range Cattle Research and Education Center January 2017 Research Report RC-2017-1 CLIMATOLOGICAL REPORT 2016 Range Cattle Research and Education Center Brent Sellers Weather conditions strongly influence
Precipitation. Standardized Precipitation Index. NIDIS Intermountain West Regional Drought Early Warning System January 3, 2017
 1/3/2017 NIDIS Drought and Water Assessment NIDIS Intermountain West Regional Drought Early Warning System January 3, 2017 Precipitation The images above use daily precipitation statistics from NWS COOP,
The Climate of Bryan County
 The Climate of Bryan County Bryan County is part of the Crosstimbers throughout most of the county. The extreme eastern portions of Bryan County are part of the Cypress Swamp and Forest. Average annual
The Kentucky Mesonet: Entering a New Phase
 The Kentucky Mesonet: Entering a New Phase Stuart A. Foster State Climatologist Kentucky Climate Center Western Kentucky University KCJEA Winter Conference Lexington, Kentucky February 9, 2017 Kentucky
DEW POINT TEMPERATURE PREDICTION USING ARTIFICIAL NEURAL NETWORKS DANIEL B. SHANK. (Under the Direction of Ronald W. McClendon) ABSTRACT
 ABSTRACT") DEW POINT TEMPERATURE PREDICTION USING ARTIFICIAL NEURAL NETWORKS by DANIEL B. SHANK (Under the Direction of Ronald W. McClendon) ABSTRACT Dew point temperature is the temperature at which water vapor
DEW POINT TEMPERATURE PREDICTION USING ARTIFICIAL NEURAL NETWORKS by DANIEL B. SHANK (Under the Direction of Ronald W. McClendon) ABSTRACT Dew point temperature is the temperature at which water vapor
Cold and freeze protection of blueberries in Florida. Dr. Dorota Z. Haman Agricultural and Biological Dept. University of Florida
 Cold and freeze protection of blueberries in Florida Dr. Dorota Z. Haman Agricultural and Biological Dept. University of Florida Frost versus Freeze Frost is a local condition which occurs in your area
Comparison of individual and combined ANN models for prediction of air and dew point temperature
 Comparison of individual and combined ANN models for prediction of air and dew point temperature Karthik Nadig, Walter Potter, Gerrit Hoogenboom & Ronald McClendon Applied Intelligence The International
The Climate of Grady County
 The Climate of Grady County Grady County is part of the Central Great Plains, encompassing some of the best agricultural land in Oklahoma. Average annual precipitation ranges from about 33 inches in northern
The Climate of Kiowa County
 The Climate of Kiowa County Kiowa County is part of the Central Great Plains, encompassing some of the best agricultural land in Oklahoma. Average annual precipitation ranges from about 24 inches in northwestern
N ew York State Agricultural Experiment S tation vnrfx* NYSAES I Publications I Latest Press Releases
 N ew York State Agricultural Experiment S tation vnrfx* NYSAES I Publications I Latest Press Releases CORNELL U N I V E R S I T Y GENEVA NEW YORK. 100 Years of New York Weather August 16th, 2000 CONTACT:
The Climate of Pontotoc County
 The Climate of Pontotoc County Pontotoc County is part of the Crosstimbers. This region is a transition region from the Central Great Plains to the more irregular terrain of southeast Oklahoma. Average
AgWeatherNet and WA Climate Nic Loyd Meteorologist and Associate in Research AgWeatherNet
 AgWeatherNet and WA Climate Nic Loyd Meteorologist and Associate in Research AgWeatherNet February 23, 2017 Lewis County WSU Extension; Chehalis, WA AgWeatherNet Background WA Climate: Past, Present, and
The Climate of Payne County
 The Climate of Payne County Payne County is part of the Central Great Plains in the west, encompassing some of the best agricultural land in Oklahoma. Payne County is also part of the Crosstimbers in the
The Climate of Marshall County
 The Climate of Marshall County Marshall County is part of the Crosstimbers. This region is a transition region from the Central Great Plains to the more irregular terrain of southeastern Oklahoma. Average
HAZARD DESCRIPTION... 1 LOCATION... 1 EXTENT... 1 HISTORICAL OCCURRENCES...
 WINTER STORM HAZARD DESCRIPTION... 1 LOCATION... 1 EXTENT... 1 HISTORICAL OCCURRENCES... 3 SIGNIFICANT PAST EVENTS... 4 PROBABILITY OF FUTURE EVENTS... 5 VULNERABILITY AND IMPACT... 5 Hazard Description
The Climate of Seminole County
 The Climate of Seminole County Seminole County is part of the Crosstimbers. This region is a transition region from the Central Great Plains to the more irregular terrain of southeastern Oklahoma. Average
The Climate of Murray County
 The Climate of Murray County Murray County is part of the Crosstimbers. This region is a transition between prairies and the mountains of southeastern Oklahoma. Average annual precipitation ranges from
NIDIS Intermountain West Drought Early Warning System January 16, 2018
 NIDIS Drought and Water Assessment NIDIS Intermountain West Drought Early Warning System January 16, 2018 Precipitation The images above use daily precipitation statistics from NWS COOP, CoCoRaHS, and
Workshop on Drought and Extreme Temperatures: Preparedness and Management for Sustainable Agriculture, Forestry and Fishery
 Workshop on Drought and Extreme Temperatures: Preparedness and Management for Sustainable Agriculture, Forestry and Fishery 16-17 Feb.2009, Beijing, China Modeling Apple Tree Bud burst time and frost risk
CLIMATOLOGICAL REPORT 2002
 Range Cattle Research and Education Center Research Report RC-2003-1 February 2003 CLIMATOLOGICAL REPORT 2002 Range Cattle Research and Education Center R. S. Kalmbacher Professor, IFAS, Range Cattle Research
Monitoring Extreme Weather Events. February 8, 2010
 Monitoring Extreme Weather Events February 8, 2010 Extensive network of over 800 stations across the Prairies Good coverage across entire agriculture production region Network of networks strategy includes
Protecting Blueberries from Freezes in Florida 1
 HS968 1 J. G. Williamson, P. M. Lyrene, and J. W. Olmstead 2 Introduction Blueberries bloom in late winter or early spring in Florida, making the flowers and young fruit highly susceptible to freeze and
NIDIS Intermountain West Regional Drought Early Warning System February 7, 2017
 NIDIS Drought and Water Assessment NIDIS Intermountain West Regional Drought Early Warning System February 7, 2017 Precipitation The images above use daily precipitation statistics from NWS COOP, CoCoRaHS,
Founding of a Grower-based Weather/Pest Information Network to Aid IPM Adoption
 Founding of a Grower-based Weather/Pest Information Network to Aid IPM Adoption December, 1996 Final Report Agricultural Telecommunications Project No. 95-EATP-1-0065 Project Coordinator: Curtis Petzoldt,
Weather and Climate of the Rogue Valley By Gregory V. Jones, Ph.D., Southern Oregon University
 Weather and Climate of the Rogue Valley By Gregory V. Jones, Ph.D., Southern Oregon University The Rogue Valley region is one of many intermountain valley areas along the west coast of the United States.
Accuracy of cotton-planting forecasts assessed in the San Joaquin Valley
 RESEARCH ARTICLE Accuracy of cotton-planting forecasts assessed in the San Joaquin Valley Douglas J. Munier Peter B. Goodell Joyce F. Strand In the first evaluation of its kind, we found that the UC Cooperative
SOIL MOISTURE MODELING USING ARTIFICIAL NEURAL NETWORKS
 Int'l Conf. Artificial Intelligence ICAI'17 241 SOIL MOISTURE MODELING USING ARTIFICIAL NEURAL NETWORKS Dr. Jayachander R. Gangasani Instructor, Department of Computer Science, jay.gangasani@aamu.edu Dr.
An Online Platform for Sustainable Water Management for Ontario Sod Producers
 An Online Platform for Sustainable Water Management for Ontario Sod Producers 2014 Season Update Kyle McFadden January 30, 2015 Overview In 2014, 26 weather stations in four configurations were installed
NIDIS Intermountain West Drought Early Warning System April 18, 2017
 1 of 11 4/18/2017 3:42 PM Precipitation NIDIS Intermountain West Drought Early Warning System April 18, 2017 The images above use daily precipitation statistics from NWS COOP, CoCoRaHS, and CoAgMet stations.
The Climate of Haskell County
 The Climate of Haskell County Haskell County is part of the Hardwood Forest. The Hardwood Forest is characterized by its irregular landscape and the largest lake in Oklahoma, Lake Eufaula. Average annual
Precipitation. Standardized Precipitation Index. NIDIS Intermountain West Drought Early Warning System September 5, 2017
 9/6/2017 NIDIS Drought and Water Assessment NIDIS Intermountain West Drought Early Warning System September 5, 2017 Precipitation The images above use daily precipitation statistics from NWS COOP, CoCoRaHS,
The TexasET Network and Website User s Manual
 The TexasET Network and Website http://texaset.tamu.edu User s Manual By Charles Swanson and Guy Fipps 1 September 2013 Texas AgriLIFE Extension Service Texas A&M System 1 Extension Program Specialist;
WeatherManager Weekly
 Issue 288 July 14, 2016 WeatherManager Weekly Industries We Serve Agriculture Energy/Utilities Construction Transportation Retail Our Weather Protection Products Standard Temperature Products Lowest Daily
The Climate of Texas County
 The Climate of Texas County Texas County is part of the Western High Plains in the north and west and the Southwestern Tablelands in the east. The Western High Plains are characterized by abundant cropland
Orange Visualization Tool (OVT) Manual
 Manual") Orange Visualization Tool (OVT) Manual This manual describes the features of the tool and how to use it. 1. Contents of the OVT Once the OVT is open (the first time it may take some seconds), it should
Orange Visualization Tool (OVT) Manual This manual describes the features of the tool and how to use it. 1. Contents of the OVT Once the OVT is open (the first time it may take some seconds), it should
CustomWeather Statistical Forecasting (MOS)
") CustomWeather Statistical Forecasting (MOS) Improve ROI with Breakthrough High-Resolution Forecasting Technology Geoff Flint Founder & CEO CustomWeather, Inc. INTRODUCTION Economists believe that 70% of
CustomWeather Statistical Forecasting (MOS) Improve ROI with Breakthrough High-Resolution Forecasting Technology Geoff Flint Founder & CEO CustomWeather, Inc. INTRODUCTION Economists believe that 70% of
Using an Artificial Neural Network to Predict Parameters for Frost Deposition on Iowa Bridgeways
 Using an Artificial Neural Network to Predict Parameters for Frost Deposition on Iowa Bridgeways Bradley R. Temeyer and William A. Gallus Jr. Graduate Student of Atmospheric Science 31 Agronomy Hall Ames,
NIDIS Intermountain West Drought Early Warning System October 17, 2017
 NIDIS Drought and Water Assessment NIDIS Intermountain West Drought Early Warning System October 17, 2017 Precipitation The images above use daily precipitation statistics from NWS COOP, CoCoRaHS, and
Arizona Climate Summary May 2012
 Arizona Climate Summary May 2012 Summary of conditions for April 2012 April 2012 Temperature and Precipitation Summary April 1 st 16 th : Although April began with another low pressure system sweeping
2011 National Seasonal Assessment Workshop for the Eastern, Southern, & Southwest Geographic Areas
 2011 National Seasonal Assessment Workshop for the Eastern, Southern, & Southwest Geographic Areas On January 11-13, 2011, wildland fire, weather, and climate met virtually for the ninth annual National
ZANER WHEN DOES WEATHER MATTER? For more information, call: Or visit: Zaner is proud to present
 ZANER The market has been under pressure the past three weeks. The 9 and 20 day moving average have met, for the first time since September and again falls below 40. Zaner is proud to present WHEN DOES
DROUGHT ASSESSMENT USING SATELLITE DERIVED METEOROLOGICAL PARAMETERS AND NDVI IN POTOHAR REGION
 DROUGHT ASSESSMENT USING SATELLITE DERIVED METEOROLOGICAL PARAMETERS AND NDVI IN POTOHAR REGION Researcher: Saad-ul-Haque Supervisor: Dr. Badar Ghauri Department of RS & GISc Institute of Space Technology
EXAMINATION OF MODELS FOR THE PREDICTION OF THE ONSET AND SEVERITY OF POTATO LATE BLIGHT IN OREGON
 EXAMINATION OF MODELS FOR THE PREDICTION OF THE ONSET AND SEVERITY OF POTATO LATE BLIGHT IN OREGON Clinton C. Shock, Cedric A. Shock, Lamont D. Saunders, and Brad Coen Malheur Experiment Station Lynn Jensen
Weather 101 Brad Jakubowski Doane College Water
 Weather 101 Fundamental Meteorology for Turf Managers Brad Jakubowski Doane College Do Baseballs Really Fly Farther at Coors Field? In theory, A well struck baseball should travel 10 percent farther at
Christopher ISU
 Christopher Anderson @ ISU Excessive spring rain will be more frequent (except this year). Will it be more manageable? Christopher J. Anderson, PhD 89th Annual Soil Management and Land Valuation Conference
Table of Contents. Page
 Eighteen Years (1990 2007) of Climatological Data on NMSU s Corona Range and Livestock Research Center Research Report 761 L. Allen Torell, Kirk C. McDaniel, Shad Cox, Suman Majumdar 1 Agricultural Experiment
Current Climate Trends and Implications
 Current Climate Trends and Implications Dr. Mark Seeley Professor emeritus Department of Soil, Water, and Climate University of Minnesota St Paul, MN 55108 Crop Insurance Conference September 12, 2018
Road Weather: The Science Behind What You Know
 The Weather Road Weather: The Science Behind What You Know Jon Tarleton Global Roads Marketing Manager Meteorologist Jon.tarleton@vaisala.com Page 2 / date / name / Internal use / Vaisala Weather and Our
Research Note COMPUTER PROGRAM FOR ESTIMATING CROP EVAPOTRANSPIRATION IN PUERTO RICO 1,2. J. Agric. Univ. P.R. 89(1-2): (2005)
: (2005)") Research Note COMPUTER PROGRAM FOR ESTIMATING CROP EVAPOTRANSPIRATION IN PUERTO RICO 1,2 Eric W. Harmsen 3 and Antonio L. González-Pérez 4 J. Agric. Univ. P.R. 89(1-2):107-113 (2005) Estimates of crop
Research Note COMPUTER PROGRAM FOR ESTIMATING CROP EVAPOTRANSPIRATION IN PUERTO RICO 1,2 Eric W. Harmsen 3 and Antonio L. González-Pérez 4 J. Agric. Univ. P.R. 89(1-2):107-113 (2005) Estimates of crop
Comparing the Relationships Between Heat Stress Indices and Mortality in North Carolina
 Comparing the Relationships Between Heat Stress Indices and Mortality in North Carolina Jordan Clark PhD Student CISA Research Assistant Department of Geography UNC-Chapel Hill 10/30/2018 Overview Background
Accessing and Using National Long Term Ecological Research (LTER) Climate and Hydrology Data from ClimDB and HydroDB: A Tutorial
 Climate and Hydrology Data from ClimDB and HydroDB: A Tutorial") Accessing and Using National Long Term Ecological Research (LTER) Climate and Hydrology Data from ClimDB and HydroDB: A Tutorial Gordon M. Heisler USDA Forest Service, Syracuse, NY Gary Fisher U.S. Geological
Accessing and Using National Long Term Ecological Research (LTER) Climate and Hydrology Data from ClimDB and HydroDB: A Tutorial Gordon M. Heisler USDA Forest Service, Syracuse, NY Gary Fisher U.S. Geological
The role of climate normals in crop specific weather forecasts. Department of Geography, Western Michigan University, Kalamazoo, MI, USA 2
 The role of climate normals in crop specific weather forecasts K.M. Baker 1, J. Williams 2, T.L. Lake 2 and W.W. Kirk 3 1 Department of Geography, Western Michigan University, Kalamazoo, MI, USA 2 Department
Climate Indices and Indicators for Agriculture
 Climate Indices and Indicators for Agriculture ADRIAN TROTMAN CHIEF, A PPLIED M ETEOROLOGY A ND CLIMATOLOGY CARIBBEAN INSTITUTE FOR METEOROLOGY AND HYDROLOGY WMO WORKSHOP ON ENHANCING CLIMATE INDICES FOR
September 2018 Weather Summary West Central Research and Outreach Center Morris, MN
 September 2018 Weather Summary The mean temperature for September was 60.6 F, which is 1.5 F above the average of 59.1 F (1886-2017). The high temperature for the month was 94 F on September 16 th. The
Sensing Strategies and Software Tools to Help Farmers Adapt to a Changing Climate
 Sensing Strategies and Software Tools to Help Farmers Adapt to a Changing Climate John D. Lea-Cox Department of Plant Science and Landscape Architecture University of Maryland, College Park, MD USA JLC@umd.edu
Table 1. August average temperatures and departures from normal ( F) for selected cities.
 for selected cities.") Climate Summary for Florida August 2016 Prepared by Lydia Stefanova and David Zierden Florida Climate Center, The Florida State University, Tallahassee, Florida Online at: http://climatecenter.fsu.edu/products-services/summaries
Climate Summary for Florida August 2016 Prepared by Lydia Stefanova and David Zierden Florida Climate Center, The Florida State University, Tallahassee, Florida Online at: http://climatecenter.fsu.edu/products-services/summaries
Name the surface winds that blow between 0 and 30. GEO 101, February 25, 2014 Monsoon Global circulation aloft El Niño Atmospheric water
 GEO 101, February 25, 2014 Monsoon Global circulation aloft El Niño Atmospheric water Name the surface winds that blow between 0 and 30 What is the atmospheric pressure at 0? What is the atmospheric pressure
5B.1 DEVELOPING A REFERENCE CROP EVAPOTRANSPIRATION CLIMATOLOGY FOR THE SOUTHEASTERN UNITED STATES USING THE FAO PENMAN-MONTEITH ESTIMATION TECHNIQUE
 DEVELOPING A REFERENCE CROP EVAPOTRANSPIRATION CLIMATOLOGY FOR THE SOUTHEASTERN UNITED STATES USING THE FAO PENMAN-MONTEITH ESTIMATION TECHNIQUE Heather A. Dinon*, Ryan P. Boyles, and Gail G. Wilkerson
Chill Hour Assessment for the Yuma Area
 Chill Hour Assessment for the Yuma Area Item Type text; Article Authors Brown, Paul W. Publisher College of Agriculture, University of Arizona (Tucson, AZ) Journal Deciduous Fruit and Nut: A College of
Variability of Reference Evapotranspiration Across Nebraska
 Know how. Know now. EC733 Variability of Reference Evapotranspiration Across Nebraska Suat Irmak, Extension Soil and Water Resources and Irrigation Specialist Kari E. Skaggs, Research Associate, Biological
1st Annual Southwest Ohio Snow Conference April 8, 2010 Abner F. Johnson, Office of Maintenance - RWIS Coordinator
 1st Annual Southwest Ohio Snow Conference April 8, 2010 Abner F. Johnson, Office of Maintenance - RWIS Coordinator The Ohio Department of Transportation ODOT has approximately 5500 full-time employees
Montana Drought & Climate
 Montana Drought & Climate MARCH 219 MONITORING AND FORECASTING FOR AGRICULTURE PRODUCERS A SERVICE OF THE MONTANA CLIMATE OFFICE IN THIS ISSUE IN BRIEF PAGE 2 REFERENCE In a Word PAGE 3 REVIEW Winter 219:
Understanding Cranberry Frost Hardiness
 40 Understanding Cranberry Frost Hardiness Beth Ann A. Workmaster and Jiwan P. Palta Department of Horticulture University of Wisconsin, Madison, WI 53706 phone: (608) 262-5782 or 262-5350 email: palta@calshp.cals.wisc.edu
Satellites, Weather and Climate Module 40: Agriculture & forestry in a changing climate
 Satellites, Weather and Climate Module 40: Agriculture & forestry in a changing climate http://www.youtube.com/watch?v=ksnblyhrru8 http://1.bp.blogspot.com/-lemica8b_h4/ufln63qlxdi/aaaaaaaacym/xc3htckubeg/s1600/animated.gif
Vantage Pro Technical Reference
 Vantage Pro Technical Reference Davis Instruments 3465 Diablo Ave. Hayward, CA 94545 Created: 9/11/01 Calculations of Derived Variables The following parameters do not have any sensors or circuitry. They
NIDIS Intermountain West Drought Early Warning System February 6, 2018
 NIDIS Intermountain West Drought Early Warning System February 6, 2018 Precipitation The images above use daily precipitation statistics from NWS COOP, CoCoRaHS, and CoAgMet stations. From top to bottom,
NIDIS Intermountain West Drought Early Warning System August 8, 2017
 NIDIS Drought and Water Assessment 8/8/17, 4:43 PM NIDIS Intermountain West Drought Early Warning System August 8, 2017 Precipitation The images above use daily precipitation statistics from NWS COOP,
A Feature Based Neural Network Model for Weather Forecasting
 World Academy of Science, Engineering and Technology 4 2 A Feature Based Neural Network Model for Weather Forecasting Paras, Sanjay Mathur, Avinash Kumar, and Mahesh Chandra Abstract Weather forecasting
UWM Field Station meteorological data
 University of Wisconsin Milwaukee UWM Digital Commons Field Station Bulletins UWM Field Station Spring 992 UWM Field Station meteorological data James W. Popp University of Wisconsin - Milwaukee Follow
November 2018 Weather Summary West Central Research and Outreach Center Morris, MN
 November 2018 Weather Summary Lower than normal temperatures occurred for the second month. The mean temperature for November was 22.7 F, which is 7.2 F below the average of 29.9 F (1886-2017). This November
Spatial Climate Datasets and Tools for Improved Agricultural Risk Management in a Changing Climate. Christopher Daly & David Hannaway
 Agricultural Outlook Forum Presented: February 23-24, 2012 U.S. Department of Agriculture Spatial Climate Datasets and Tools for Improved Agricultural Risk Management in a Changing Climate Christopher
2012 Rainfall, Runoff, Water Level & Temperature Beebe Lake Wright County, MN (# )
") www.fixmylake.com 18029 83 rd Avenue North Maple Grove, MN 55311 mail@freshwatersci.com (651) 336-8696 2012 Rainfall, Runoff, Water Level & Temperature Beebe Lake Wright County, MN (#86-0023) Prepared
www.fixmylake.com 18029 83 rd Avenue North Maple Grove, MN 55311 mail@freshwatersci.com (651) 336-8696 2012 Rainfall, Runoff, Water Level & Temperature Beebe Lake Wright County, MN (#86-0023) Prepared
NIDIS Intermountain West Drought Early Warning System July 18, 2017
 NIDIS Drought and Water Assessment NIDIS Intermountain West Drought Early Warning System July 18, 2017 Precipitation The images above use daily precipitation statistics from NWS COOP, CoCoRaHS, and CoAgMet
Arizona Climate Summary April 2018 Summary of conditions for March 2018
 Arizona Climate Summary April 2018 Summary of conditions for March 2018 March 2018 Temperature and Precipitation Summary March 1 st 16 th : March began with rainfall in southeastern Arizona as the tail
NATIONAL HYDROPOWER ASSOCIATION MEETING. December 3, 2008 Birmingham Alabama. Roger McNeil Service Hydrologist NWS Birmingham Alabama
 NATIONAL HYDROPOWER ASSOCIATION MEETING December 3, 2008 Birmingham Alabama Roger McNeil Service Hydrologist NWS Birmingham Alabama There are three commonly described types of Drought: Meteorological drought
Jeffrey Boyne, NOAA/NWS WFO La Crosse, WI
 Jeffrey Boyne, NOAA/NWS WFO La Crosse, WI Wednesday, May 23, 2018 NOAA's 16th Annual Climate Prediction Applications Science Workshop (CPASW) Trends: Warmer Earlier Spring in the Upper Midwest Climate
Transportation and Road Weather
 Portland State University PDXScholar TREC Friday Seminar Series Transportation Research and Education Center (TREC) 4-18-2014 Transportation and Road Weather Rhonda Young University of Wyoming Let us know
National Public Weather and Warning Services in the Swaziland Meteorological Service Dennis S.Mkhonta /
 National Public Weather and Warning Services in the Swaziland Meteorological Service Dennis S.Mkhonta dennis.mkhonta@gmail.com / dennis@swazimet.gov.sz Introduction Swaziland s geographical position exposes
Local Precipitation Variability
 Local Precipitation Variability Precipitation from one storm can vary from neighborhood to neighborhood. What falls in your yard may not fall in the next. The next time it rains see how the precipitation
Model enhancement & delivery plans, RAI
 Model enhancement & delivery plans, RAI Karen McCourt, UK VCP Manager 12 th June 2013 Outline Current model outputs & dissemination Future model outputs & dissemination New website for dissemination to
CoCoRaHS Monitoring Colorado s s Water Resources through Community Collaborations
 CoCoRaHS Monitoring Colorado s s Water Resources through Community Collaborations Nolan Doesken Colorado Climate Center Atmospheric Science Department Colorado State University Presented at Sustaining
Stand-Alone Systems that Measure, Record, and Display Weather Data - and Often More
 Page 1 of 5 Marne Coggan is a vineyard technology consultant, a software entineer and a Sonoma County vineyard owner. You can email him at marne@svn.net Stand-Alone Systems that Measure, Record, and Display
Comparison of measured and modelled wetness duration as inputs to a grape disease model
 405 Comparison of measured and modelled wetness duration as inputs to a grape disease model W.R. Henshall, G.N. Hill and R.M. Beresford The New Zealand Institute for Plant & Food Research Ltd, Private
Cold hardiness in peach floral buds using differential thermal analysis
 THE COLLEGE of AGRICULTURAL SCIENCES Cold hardiness in peach floral buds using differential thermal analysis Ioannis Minas*, David Sterle, Horst Caspari USDA-Plant Hardiness Zones Map Grand Junction, CO