Atmospheric Aerosols and Their Influence on Urban Air Quality in Malaysia
|
|
|
- Isaac Crawford
- 5 years ago
- Views:
Transcription
1 Land Cover/Land Use Changes (LC/LUC) and Impacts on Environment in South/Southeast Asia - International Regional Science Meeting 28-30th May, 2018, Philippines Atmospheric Aerosols and Their Influence on Urban Air Quality in Malaysia Arnis Asmat School Of Chemistry & Environmnetal Studies University Teknologi MARA (UiTM) Shah Alam, Selangor MALAYSIA
2 Air quality studies in Malaysia Sources of aerosol data OUTLINE Aerosol studies using remote sensing Way Forward
3 Air Quality Studies in Malaysia Air pollution -serious environmental problem in the developing Southeast Asian countries Major sources of air pollution urbanisation & associated industrial and transportation activities, land clearing, open burning & forest fire. Trans-boundary aerosols transport southwest monsoon Effects: Health Poor visibility Radiative forcing Aerosols large uncertainties in earth s climate system due to their high spatio-temporal variability and various optical properties Rdiative it s absorb and scatter the radiation through the atmosphere depending on their chemical and physical characteristics and also can indirectly change the cloud condensation nuclei [Oh et al. 2004]. Changes in aerosol loadings, composition of aerosols and aerosols size distribution will lead to the differences in aerosol optical properties [Rozwadowska et al. 2010].
")
4 (ASM, 2016)
")
5 (ASM, 2016)
")
6 (ASM, 2016)
7
8
9
10

11 Source of Haze Based on Satellite Image

12 Air Quality Monitoring Network The Department of Environment (DOE) monitors ambient air quality through a network of 52 continuous monitoring stations. These monitoring stations are strategically located in urban, sub urban and industrial areas (to detect any signifcant change in the air quality which may be harmful to human health and the environment.


13 Distribution of station locations

14

15

16
")
17 (ASM, 2016)


18
19 Source of Air Pollution Land use changes Local anthropogenic Peat combustion Slash and burn Burning within oil palm plantation

20

21
22

23
24 Source of Aerosol Data Ground based monitoring WMO Global Atmospheric Watch Aeronet Space borne remote sensing

25
26 WMO Global Atmospheric Watch (GAW) Network of Stations) Danum Valley, Sabah (1 station) Tanah Rata in Cameron Highlands (2 regional station) Petaling Jaya (1 station) Regional stations: PJ stations measures TSP & PM10 The samples are then sent for analysis to determine its chemical compositions To study urban air quality and meteorology and providing urban air pollution forecasts Tanah Rata stations includes Rainwater chemical composition, reactive gases, aerosol load and chemical composition, surface ozone and meteorology Global station monitors background concentration of atmospheric parameters to study long-range transport of pollutions and ability of forecast to act as sinks for atmospheric pollutants
27 CHARACTERIZATION OF AEROSOL OPTICAL PROPERTIES VARIABILITY USING AERONET SUNPHOTOMETER AND CLASSIFICATION OF AEROSOL TYPES
28 4.1 Climatology Variations in Aerosol Optical Properties Four years observations of aerosol optical properties were carried out at the Kuching, Sarawak by using AERONET Sun-photometer data from August 2011 until December Long term measurements of aerosol optical depth (AOD), Angstrom exponent (α), single scattering albedo (SSA), asymmetry factor (ASY), refractive index and aerosol size distribution were analyzed and compiled to describe the climatology of the optical properties of aerosols in study area. The contribution of this climatology variations helps to gain knowledge on how aerosols might influence the regional radiation budget (Olcese et al. 2014). According to Garcia et al. (2008), the aerosols can influence the radiation budget by the interaction of aerosols with the solar radiation causes strong scattering and absorption mechanisms For that reason, different aerosol types will have different characteristics of scattering and absorption properties can leads to different effect on the estimation of aerosol radiative forcing (ARF) value.

29 STUDY SITE The experimental site for this study is at Kuching, Sarawak. This region has high potential because of the high sources for pollution to occur and rapid urbanization and industrial expansion. Figure 4.1: Study site of Kuching area

30 As for the location of AERONET Sunphotometer at Kuching area, it is mounted at the Observation Tower of Kuching Meteorological Station located at the Kuching International Airport, Sarawak. The latitude for AERONET Sunphotometer is at 1.491ºN and ºE for the longitude with elevation at 28 meters Figure 4.2: Location of AERONET Sunphotometer at Observation Tower of Kuching Meteorological Station
31 4.1.1 Aerosol Optical Depth (AOD) AOD indicates the concentrations of aerosol loading presence in the atmosphere either indicate lower or higher values. Ranjan et al. (2007) explained the characterization of AOD values at different wavelengths is very useful in gaining knowledge and understanding on the aerosol size distribution, seasonal variations of aerosols can be investigated and helps to identify the main sources of different types aerosol which presence in the atmosphere.
32 The highest appearance of AOD was recorded during September 2015 at wavelength 440nm with ±1.032 and December 2012 recorded the lowest AOD values with the range of ±0.004 at 1020nm. The low concentration of AOD recorded at Kuching from November 2011 until April 2011 due to heavy rainfalls that probably washed away some of the aerosols and reduce the presence of aerosols in the atmosphere. High concentration of AOD observed from August 2012 to October 2012 maybe due to the presence of dry season, biomass burning activities from neighboring countries and urban activities. Low patterns of AOD distribution occurred during November to February for each year and high patterns of AOD distribution are observed from June to October yearly. Therefore, the trends for AOD variations are based on the seasonal monsoon weather. Aerosol Optical Depth FEB 2012 DEC 2011 OCT 2011 AUG 2011 FEB 2013 DEC 2012 OCT 2012 AUG 2012 OCT 2015 AUG 2015 JUN 2015 APR 2015 FEB 2015 DEC 2014 FEB 2014 DEC 2013 OCT 2013 AUG 2013 JUN 2013 APR 2013 Month/Year AOD1020 AOD870 AOD675 AOD500 AOD440 Figure 4.3: Monthly Variations of Aerosol Optical Depth at Five Different Wavelengths from August 2011 until December 2015

, Central Kalimantan, Borneo")


 regarding the application of back trajectory model to predict long range transport of pollutant")
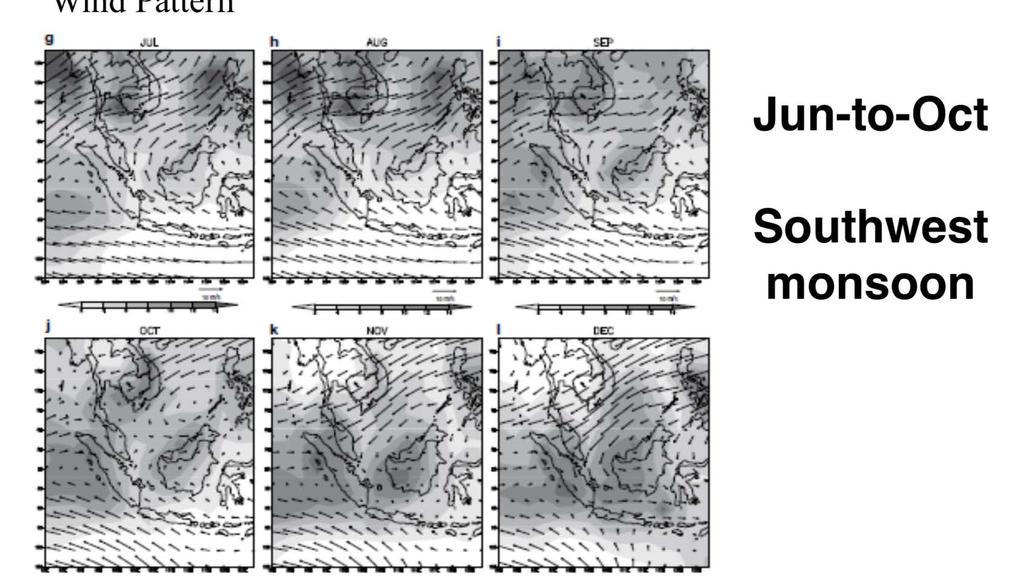
33 For the investigation of the origins of the air masses arriving at Kuching area for the period of study due to long range transport, the back trajectory model was performed based on NOAA HYSPLIT model invented by Draxler and Rolph (2003). The origin air masses reached Kuching comes from Sumatera (Indonesia), Central Kalimantan, Borneo (Indonesia), Java Sea and also from South China Sea. The long range transport of aerosols is causes mainly form the forests fires and open burning continues to occur on the Indonesian islands in the dry season. From Jun to September, Malaysia is affected by the southwest monsoon which causes the dry weather and the prevailing wind direction is generally blowing from Sumatra to Malaysia. Figure 4.4: HYSPLIT Back Trajectory Model at 1000, 1500 and 2500m on Different Days from 2011 until 2015 Same result was obtained from the study by Rahman et al. (2011) regarding the application of back trajectory model to predict long range transport of pollutant for Klang Valley. The observations is clearly shows that the forest fires in parts of Sumatra and Kalimantan which usually occurred from Jun to September is one of the probable key sources to the heavy haze phenomenon across Southeast Asia.
34 4.1.2 Angstrom Exponent (α) Angstrom exponent (α) is an informative parameter regarding aerosol size distribution either it shows the presence of fine mode aerosols or coarse mode aerosols Angstrom at nm Normal_fit It shows the normal fitted distribution for α value at nm where the mu value is and the sigma is with the equation presented in Equation 4.1. Density ff xx μμ, σσ = ππ ee (xx 1.211)2 2(0.302) 2, - < x < (4.1) Balakrishnaiah et al. (2011) stated there are two modes of aerosols that usually occurred in study area dusty (α<1) and non-dusty (α>1) conditions Data Figure 4.5: Normal Fitted Distribution for Angstrom Exponent at nm It reveals a great dispersion of α values with obviously single peak distribution with the range varied from 0.2 to 2.2 and the peak is between 1.0 and 1.4. High presence of fine mode aerosols (α>1) at Kuching area related to the mixture of urban or continental and biomass burning aerosols. As for the value of α lower than 1 represents the coarse mode particles consist of dust or maritime aerosols.
35 4.1.3 Single Scattering Albedo (SSA) and Asymmetry Factor (ASY) θ=180º and the light is being scattered entirely in a forward direction (θ = 0º). SSA is the ratio of scattering to total extinction efficiency and both of the parameters provide information regarding scattering and absorption properties of different aerosol types (Alam et al. 2012). For SSA value is between 0 and 1 where value near to 0 indicates total absorption and SSA value near to 1 indicates total scattering. The range value for ASY is between -1 to 1 with ASY value near to -1 corresponds to back scattering direction with
36 Most of the SSA value was higher than 0.8 and it shows that shorter wavelengths produced higher SSA value compared to longer wavelengths with the range value of SSA is between and SSA value was decreasing with increasing wavelength reflecting the dominance of urban or continental aerosols over Kuching with mostly the value for each month is higher than 0.9. As state by Dubovik et al. (2002) when SSA value is between 0.9 to 0.8 it corresponds to the presence of urban and continental aerosols. October 2012 it is reported only slightly changes of SSA value when wavelength bands are increasing which concluded the presence of high sulfate or silicate particles (Verma et al. 2010). August 2011 there is drastically decreased of SSA value when wavelength band is increasing vary between at 1020nm and at 440nm which indicate highly absorbing aerosols which comes from local pollution such as urban aerosols or biomass burning aerosols (Bergstrom et al. 2007). Single Scattering Albedo Wavelength (nm) 1020 Figure 4.6: Monthly Variations for Single Scattering Albedo at Different Wavelengths from 2011 until 2015 AUG2011 SEPT2011 SEPT2012 OCT2012 JUL2013 FEB2014 AUG2015 SEPT2015 OCT2015
37 ASY value is decreasing with increasing wavelength bands which suggests dominance of fine mode aerosols and mostly the lights scattered in forward scattering aerosols Based on the graph presented in Figure 4.11, December 2014 shows the highest contribution of ASY value with at 441nm and the lowest value was obtained during July 2013 at 1020nm with Range of ASY between 0.64 and 0.83 with the averaged at 0.72 indicates for dry aerosol particles depending on the aerosol types and seasonal variability. Spectral variability of ASY recorded for September 2013, February and April 2015 shows a decrease in ASY in the visible region and then slightly increases in the near IR region. It is corresponding to the influence of coarse mode particles for those particular months Asymmetry Factor Wavelength (nm) FEB14 DEC14 FEB15 APR15 MAY15 JUN15 JULY15 AUG15 SEPT15 OCT15 Figure 4.7: Monthly Variations for Asymmetry Factor at Different Wavelengths from 2011 until 2015
38 4.1.4 Refractive Index Refractive index provides information on physical and chemical composition of aerosols in the atmosphere. In refractive index, there are two parameters involves which are real part of refractive index (n(λ)) and imaginary part of refractive index (k(λ)). The real part refractive index corresponds to scattering properties of aerosols while imaginary part refractive index characterizes the degree of absorption for aerosol types (Bohren and Huffman, 1983; Alam et al. 2012).
39 Range value for n(λ) at available months is between and and mostly the n(λ) is concentrated within 1.4 and 1.5. The lower value of n(λ) consistent with the occurrence of anthropogenic aerosols such as urban and biomass burning aerosols (Yu et al. 2006). The occurrence for urban industrial aerosols at the study areas can be estimated with the n(λ) value between 1.40 to While for the biomass burning aerosols, the value of n(λ) is the range from 1.47 and 1.51 and higher than 1.51 usually shows the presence for dust aerosols. Based on the result, it may not show a significant presence of dust aerosols because there are no drastically increase of n(λ) was observed at near infrared wavelength band. Real Part of Refractive Index Wavelength (nm) Figure 4.8: Monthly Variations for Refractive Index at Different Wavelengths from 2011 until 2015 for Real Part Refractive Index 871 AUG11 SEPT11 AUG12 SEP12 OCT12 JULY13 FEB14 AUG15 SEPT15 OCT15
40 The range for k(λ) value is between to The higher value for k(λ) attributed to the influence of enhanced levels of anthropogenic absorbing particles released during the study period. Research study by Dubovik et al. (2002) where urban industrial aerosols had the range of k(λ) value from to while for the presence of biomass burning to However, the estimation for the k(λ) value for most of the monthly observations do not show any significant for spectral dependence and very low sensitivity to wavelengths with no clear pattern. Imaginary Part of Refractive Index Wavelength (nm) AUG11 SEPT11 AUG12 SEP12 OCT12 JULY13 FEB14 AUG15 SEPT15 OCT15 Figure 4.9: Monthly Variations for Refractive Index at Different Wavelengths from 2011 until 2015 for Imaginary Part Refractive Index
41 4.1.5 Aerosol Volume Size Distribution.4 Aerosol Size Distribution Radius (µm) Figure 4.10: Monthly Variations for Aerosol Size Distribution Derived from Sky Radiance as a Function of Particle Radius It represents a bimodal lognormal distribution with fine mode dominating at a radius of about 0.15µm, whereas the coarse mode is dominant with a radius at 3.86µm. There are two distinct mode of aerosols occurred which are fine mode at <0.6µm and >0.6µm is for coarse mode aerosols. The fine mode size distribution indicated that during July 2013 the fine peak radius higher at 0.14µm while for September 2015, October 2012 and 2015 indicated at 0.25µm. The higher values shows the frequent biomass burning activities, forest fire events and also related to human activities.
42 4.2 Classification of Aerosol Types categorized the aerosols in the atmosphere into four major types according to their radiation absorptivity and size. It can be divided into carbonaceous (absorbing fine mode), soil dust (absorbing coarse mode), sulfate (non-absorbing fine mode), and sea salt (non-absorbing coarse mode) (Higurashi and Nakajima (2002). Different types of aerosol can be classified by using various measurements by such as analyzing the chemical composition of the aerosols or form a relationship between optical properties parameters such as AOD, α and SSA. Particularly, in this study the technique used to classify aerosol types over Kuching area is by using threshold criteria analysis.
43 4.2.1 Aerosol Optical Depth and Angstrom Exponent The purpose of using AOD and α parameter it will help to identify aerosol types based on frequency distributions of AOD and aerosol size distribution. This is because AOD value gives the information regarding aerosol loading while α is related to the aerosol size therefore the joint analysis for both parameters can have a better interpretation and understanding of data. In this analysis, AOD at two different wavelength bands are used firstly is at 500nm because optically 500nm is an effective visible wavelength that is very suitable for aerosol characteristics study (Stone et al. 2002; Tan et al. 2015) and give more clarification on fine mode aerosols (Ranjan et al. 2007). The other one is AOD at 870nm because as explained earlier in AOD variations at different wavelengths 870nm is very usefull to classify coarse mode aerosols (Toledano et al. 2007).
44 Figure 4.11: Scatter Plot of Aerosol Optical Depth and Angstrom Exponent for Aerosol Classification Types It shows that mostly the value is concentrated below 0.5 for AOD and below 1.5 for α. According to Toledano et al. (2007), the presence of pure maritime aerosols should be analyzed at the region with AOD at 440nm below than 0.2 and α is between 0 and 2 in the scatter plot while for Salinas et al. (2009) AOD at 440nm observed below than 0.15 and value for α at the range of 0.5 to 1.7. While the proposed threshold value for maritime aerosols in this study is AOD 0.1 and α 0.9. The allocation for maritime aerosols can be seen in purple color. Based on the proposed threshold values, most of the value was highly concentrated at AOD 0.4 and at α value 1.2 and with this result it indicates the presence of urban aerosol (blue color). Another circle is in green color which contributes to the presence of biomass burning aerosol with AOD 0.4 and α 1. At AOD more than 0.2 and α less than 0.8 show the identification of dust aerosols with yellow circle in color.
45 60 50 Frequency Percentage Toledano Salinas 0 Biomass Dust Maritime Mixed Urban In this study Aerosol Types Figure 4.12: Frequency Percentage Distributions for Different Aerosol Types Based on Proposed Threshold Criteria
46 The threshold value proposed by Salinas et al. (2009) does not corresponds entirely to the range of threshold used in our study which shows less occurrence for urban and biomass burning aerosols with only 21.1% and 10.4%, respectively at AOD 500nm. As compared with the study by Toledano et al. (2007) where by using their threshold, it can be found that the amount of biomass burning aerosols recorded was 16.2% while for urban aerosols it was reported as 16.4% only. However, by using the threshold criteria value proposed from this study high frequency percentage for biomass burning aerosols was observed with 23.8% and quite high percentage at 34.7% for urban aerosols. There is consistency with the occurrence of haze that usually happens to Kuching area yearly produced by active burning in local and neighboring countries. These results are consistent with the records obtained from the Malaysian Meteorological Department, MET (2016). The high presence of urban and continental aerosols is due to the location of Kuching area as where rapid urbanization is developing. The appearance of dust aerosols shows for Toledano et al. (2007) only 9.6% and when using the threshold value from Salinas et al. (2009) the frequency percentage is 0.9%. By using the value obtained from this analysis, the dust aerosols recorded at 1.8%. High percentage of maritime aerosols was reported with 47.8% for Toledano et al. (2007) and 31.3% for Salinas et al. (2009). Fortunately, the lowest frequency percentage was obtained when using the proposed threshold values with only 4%. Based on the testing results indicate that the threshold criteria by Toledano et al. (2007) were quite reliable to use for the classification of aerosols types due to the minimal occurrence value of the indistinguishable aerosols which referred as mixed aerosol types. However, the threshold value do not show strong classification for urban and biomass burning aerosols. Therefore, the proposed threshold value retrieved from this study can be used to detect high presence of urban with AOD 0.4 and α 1.2 and for biomass burning aerosols the AOD value 0.4 with high value of α (α 1.0) even though there are some presence of mixed aerosols. It can be concluded that urban and biomass burning aerosols are dominating at Kuching area.
47 4.2.2 Aerosol Optical Depth, Angstrom Exponent and Asymmetry Factor In this study, proposed of aerosol classification of aerosol types based on AERONET Sun photometer data by including the combination of AOD, α and ASY value. The combination of these three parameters help to classify different types of aerosols based on aerosol loading, size of aerosol particles and the scattering direction of aerosols. As stated by Srivastava et al. (2011), the ASY parameter is a very important parameter because it regulates the aerosol radiative forcing and as similar with SSA, ASY value is also dependent on the size and composition of aerosol particles (Ramachandran and Rajesh (2008); Srivastava et al. 2011).
48 The highest percentage observed was for urban aerosols with 39% followed by mixed aerosols at 27%, 20% for biomass burning aerosols, 11% for maritime aerosols and lastly dust aerosols was observed at 3%. When using the relationship between three parameters it will help to reduce the observations for mixed aerosols types from 35.7% to 27%. Figure 4.13: Different Types of Aerosol Classification Based on Relationship between Aerosol Optical Depth, Angstrom Exponent and Asymmetry Factor Dust 3.0% Mixed 27.0% Biomass Burning 20.0% Maritime 11.0% Urban 39.0%
49 Table 4.1 Percentage Comparison for Different Types of Aerosols by Using Different Optical Properties Aerosol Types/Parameters (%) AOD and α AOD, α, and ASY Urban Aerosols Biomass Burning Aerosols Maritime Aerosols Dust Aerosols Mixed Aerosols It can be concluded that the proposed aerosol classification algorithm by using three parameters which are AOD, α, and ASY also can be used to classify different types of aerosols. From the information obtained from ASY value, it will support the presence of different types of aerosols at that particular area.
50 SPATIAL DISTRIBUTIONS AND TEMPORAL VARIATIONS OF AEROSOL OPTICAL DEPTH USING MODIS DATA
51 DATA ACQUISITION Moderate Imaging Resolution Spectroradiometer (MODIS) - Terra MODIS data Level 2 (Collection 5) and the code is MOD04. - The MOD04 product provides global AOD over land and ocean with spatial resolution of 10km x 10km Aerosol Robotic Network (AERONET) Sunphotometer - Ground based monitoring aerosol that can assess aerosol optical properties and to validate satellite retrievals of aerosol optical properties. - Level 2 AOD retrieval from 500nm only was used for the analysis
52 METHODOLOGY Spatial and temporal averaging Time window of ±20 min Spatial average from pixels lying in ±(1/4º) Retrieval of AOD Minimum Distance Technique Multiple Plane Regression Technique Artificial Neural Network Interpolation Technique Least Square Regression Technique
53 Interpolation Technique The AOD MODIS data was at the wavelength range 550nm while AOD AERONET was at 500nm. For easy comparison with AOD MODIS, AOD AERONET were interpolated by using Equation 3. AOD 550nm = AOD 500nm α (3) Where α is the angstrom exponent at wavelength 440/870nm obtained from AERONET data. After that, the relationship between AOD MODIS is established with AOD AERONET based on least square regression and it output presented in correlation coefficient (R 2 ).
54 5.1 Minimum Distance Technique Minimum distance technique was performed for MODIS data to calculate the closest pixel of latitude and longitude to the AERONET site and the output were given in column and row pixel. The equation for minimum distance technique in the following way: RR, CC = min xx xxx 2 + yy yyy (1) Based on Equation 1, x is a longitude for MODIS and AERONET and y is the latitude for MODIS and AERONET. Smaller window sizes (11 x 11 pixels) are used to reduce undesirable errors due to topographic or aerosol types heterogeneity.

55 Figure 5.1: Variations for Aerosol Optical Depth for MODIS and AERONET using Minimum Distance Technique The minimum and maximum AOD AERONET value is and 1.795, respectively. For the AOD MODIS the value range between 0.01 and Basically, the AOD value obtained is below than 2 however there are extremely high value of AOD MODIS was retrieved at Julian Day 294 in 2015 with while for AOD AERONET the value obtained was only The reason for the overestimation of AOD MODIS may come from dry season in Kuching area causes surface to become dry thus leads to higher value for surface reflectance (Tripathi et al., 2005).

56 Figure 5,2: Linear Regression for Aerosol Optical Depth Derived from MODIS and AERONET using Minimum Distance Technique Based on the scatter plot, the coefficient of determination (R 2 ) value obtained in this result is 0.9 and it shows strong correlation between AOD derived from MODIS and AERONET. The regression equation derived from this model is AOD MODIS = 1.93 AOD AERONET 0.33 where the intercept value is with a slope at 1.93.
57 5.2 Multiple Plane Regression Technique Based on the tabulated table, five values of latitude and longitude for each day were chosen based on two different methods which are mean and standard deviation and relative percentage error. Mean and standard deviation The corresponding latitude and longitude for these pixels was prepared and the mean (µ) and standard deviation (σσ) have been calculated by using Eq. 1 and Eq. 2. Relative percentage error The corresponding latitude and longitude for these pixels was prepared and relative percentage error was calculated by using Eq. 3. Next, the selected five point values were plotted by using scatter plot with independent variables, latitude and longitude, on the X and Y axes and dependent variable, AOD, on the Z axis for the multiple regression plane technique. These points have been fitted in the form of Eq. 4.
58 6 Aerosol Optical Depth Missing AERONET MODIS Julian Days Figure 5.3: Variations of Aerosol Optical Depth for MODIS and AERONET Data using Mean and standard deviation (µ±σσ) The range value for AOD MODIS is to 5.3 while for AOD AERONET the minimum and maximum values were 0.04 and 2.95, respectively. Study by Abd Jalal, Asmat, & Ahmad, (2012) classified that In Kuching area dominant aerosols occurred in Kuching area urban and continental aerosols. Overestimation of AOD MODIS occurred at Julian Day 253 in 2015 when there were extremely high of AOD MODIS was observed with 5.3 while for AOD AERONET is only 2.9. There was a large underestimation for AOD MODIS at Julian Day 245 in 2011 where predicted AOD MODIS is -1.6 as compared with the actual value from AOD AERONET which only at 0.15.
59 7 6 Aerosol Optical Depth AERONET MODIS Julian Day Figure 5.4: Variations of Aerosol Optical Depth for MODIS and AERONET Data using Relative Absolute Error (RAE) The range value for AOD MODIS is to 6.0 while for AOD AERONET the minimum and maximum values were 0.04 and 2.95, respectively. Overestimation of AOD MODIS occurred at Julian Day 253 in 2015 when there was extremely high value of AOD MODIS was observed with 6.0 and only 2.9 for AOD AERONET. The distribution patterns of AOD at Kuching is basically constant where high concentration of AOD was observed during dry seasons (June to September). On the contrary, during wet seasons from November to March, the aerosol loading was monitored at low AOD. Same results were obtained by Salinas, Chew, Mohamad, Mahmud, & Liew, (2013) at Kuching area but data available only for 2011 where low aerosol loading basically most of the period except for the months of August and September examined high AOD values likely from regional episodes of biomass burning and fire activity during that particular months.
60 6 5 4 a) The regression equation derived from this model for MODIS µ±σ is MODIS AOD = AERONET AOD and the regression equation derived from MODIS RAE is MODIS AOD = AERONET AOD MODIS Rsq = AERONET b) The R 2 obtained for MODIS µ±σ is and using MODIS RAE is at shows strong relationship between AOD MODIS and AOD AERONET. For MODIS µ±σ, the MAPE was found to be 24% and RMSE value is 0.45 while for MODIS RAE, the MAPE is around 12% and for RMSE is There were only little differences between RMSE for MODIS µ±σ and MODIS RAE while for MAPE value for MODIS µ±σ is quite higher with 24% as compared to MODIS RAE with only 12%. Based on that, it shows that the selection method by using MODIS RAE can also be used to retrieve true value of AOD. MODIS Rsq = AERONET Figure 5.5: Linear Regression for Aerosol Optical Depth from MODIS and AERONET Data a) Mean and standard deviation (µ±σσ) and b) Relative Absolute Error (RAE) Here non-zero intercepts (A= and ) for MODIS µ±σ and MODIS RAE, respectively show that the retrieval algorithm is biased at low AOD value due association with a sensor calibration error or an improper assumption on ground surface reflectance (T. X. P. Zhao et al., 2002). Slope higher than unity at for MODIS µ±σ and for MODIS RAE at indicates an overestimation of AOD by MODIS with respect to AERONET retrieval.
61 5.3 Artificial Neural Network (ANN) In this study, the artificial neural network (ANN) had been performed in constructing a model based on MODIS and AERONET as an input also AERONET AOD data as an output in this model. First model is by using the latitude, longitude and AOD MODIS as an input and secondly, the inputs used are latitude, longitude, AOD MODIS and solar zenith angle. Different input variables were tested in developing good prediction for the ANN model. Therefore, the objective of this analysis is to improve the results from the AOD MODIS from the multiple regression plane technique to obtain AOD MODIS as close as possible to the one obtained from AOD AERONET

62 Figure 5.6: Temporal series of Aerosol Optical Depth for the direct and the improved values with the chosen method The variations of direct and improved AOD MODIS was plotted in Figure 5.6 for both models for easy comparison. It shows that the improved AOD value by using Model II have the great relationship with the AERONET data. As explained earlier, the high variations of AOD at Julian Days may cause from the urbanization and haze episodes. There are obviously the MODIS data had underestimate and overestimate the AOD value.

63 b) The regression equation derived from this model using Model I is MODIS AOD = 0.96 AERONET AOD and the regression equation derived from Model II is MODIS AOD = 0.91 AERONET AOD The R 2 obtained for Model I is with RMSE and using Model II is at and RMSE value is shows strong relationship between improved AOD MODIS and AOD AERONET. Figure 5.7: Linear Regression for Aerosol Optical Depth from MODIS and AERONET using a) Model I and b) Model II
64 5.4 Discussions By using minimum distance technique only several data were obtained even though the AOD value retrieved was as close as possible to the AERONET station. For multiple regression plane technique, the common usage for the selection of latitude and longitude for each pixel s data is based on their mean and standard deviation (µ±σσ). In this study, new method has been introduced by using the selection based on relative absolute error (RAE) for both latitude and longitude data and these methods are compared. Even though the RMSE for MODIS µ±σ is quite lower than MODIS RAE with 0.45 and 0.47 respectively but need to compare with others statistical parameters. It shows that the MAPE for MODIS µ±σ is quite high with 24% as compared to MODIS RAE with only 12%. Based on that, it shows that the selection method using MODIS RAE can also being used to retrieve better
65 5.4 Discussions For the improvement of AOD MODIS using ANN models it shows that by using Model II consists of 4 inputs including latitude, longitude, AOD MODIS and solar zenith angle may improve the AOD MODIS values. Thus, from the comparison shows the importance of modifying the existing technique for the retrieval of AOD to reduce the error and uncertainties during the application of the parameter into radiative transfer model. Therefore, it is required to improve the MODIS retrieval algorithm because radiative transfer simulations should be bearing in mind that they have an uncertainty generated by uncertainties in the outputs. The limitation of this study was low availability for AOD value derived from MODIS. As the conclusion, the requirement for another satellite data is necessary so that it can provide more information for further analysis.
66 Way forward To strengthen the aerosol studies as an established aerosol community in Malaysia under Clean Air Society Forum of Malaysia (Dr Noor Zaitun Yahaya) To proposed Ultrafine Particles (mass/particle number) South East Asia (SEA) Network (UFP-SEANET) To explore vertical measurement of particles at urban and high altitude areas in selected region in Malaysia and SEA
An Analysis of Aerosol Optical Properties During Seasonal Monsoon Circulation
 International Workshop on Land Use/Cover Changes and Air Pollution in Asia 4-7 August 2015 IPB ICC, Bogor, Indonesia An Analysis of Aerosol Optical Properties During Seasonal Monsoon Circulation Lim Hwee
Physicochemical and Optical Properties of Aerosols in South Korea
 Physicochemical and Optical Properties of Aerosols in South Korea Seungbum Kim, Sang-Sam Lee, Jeong-Eun Kim, Ju-Wan Cha, Beom-Cheol Shin, Eun-Ha Lim, Jae-Cheol Nam Asian Dust Research Division NIMR/KMA
Observation of Smoke and Dust Plume Transport and Impact on the Air Quality Remote Sensing in New York City
 Observation of Smoke and Dust Plume Transport and Impact on the Air Quality Remote Sensing in New York City Yonghua Wu*, Chowdhury Nazmi, Cuiya Li, Daniel Hoyos, Barry Gross, Fred Moshary NOAA-CREST and
Seasonal Aerosol Vertical Distribution and Optical Properties over North China Xing-xing GAO, Yan CHEN, Lei ZHANG * and Wu ZHANG
 2017 International Conference on Energy, Environment and Sustainable Development (EESD 2017) ISBN: 978-1-60595-452-3 Seasonal Aerosol Vertical Distribution and Optical Properties over North China Xing-xing
Sources and Properties of Atmospheric Aerosol in Texas: DISCOVER-AQ Measurements and Validation
 Sources and Properties of Atmospheric Aerosol in Texas: DISCOVER-AQ Measurements and Validation Thanks to: Rebecca Sheesley and Sascha Usenko, Baylor Barry Lefer, U. Houston, AQRP Sarah D. Brooks T. Ren,
Aerosol Retrieved from MODIS: Algorithm, Products, Validation and the Future
 Aerosol Retrieved from MODIS: Algorithm, Products, Validation and the Future Presented by: Rob Levy Re-presenting NASA-GSFC s MODIS aerosol team: Y. Kaufman, L. Remer, A. Chu,, C. Ichoku,, R. Kleidman,,
Projects in the Remote Sensing of Aerosols with focus on Air Quality
 Projects in the Remote Sensing of Aerosols with focus on Air Quality Faculty Leads Barry Gross (Satellite Remote Sensing), Fred Moshary (Lidar) Direct Supervision Post-Doc Yonghua Wu (Lidar) PhD Student
A new perspective on aerosol direct radiative effects in South Atlantic and Southern Africa
 A new perspective on aerosol direct radiative effects in South Atlantic and Southern Africa Ian Chang and Sundar A. Christopher Department of Atmospheric Science University of Alabama in Huntsville, U.S.A.
Satellite remote sensing of aerosols & clouds: An introduction
 Satellite remote sensing of aerosols & clouds: An introduction Jun Wang & Kelly Chance April 27, 2006 junwang@fas.harvard.edu Outline Principals in retrieval of aerosols Principals in retrieval of water
Authors response to the reviewers comments
 Manuscript No.: amtd-3-c1225-2010 Authors response to the reviewers comments Title: Satellite remote sensing of Asian aerosols: A case study of clean, polluted, and Asian dust storm days General comments:
UPDATE OF REGIONAL WEATHER AND SMOKE HAZE (December 2017)
") UPDATE OF REGIONAL WEATHER AND SMOKE HAZE (December 2017) 1. Review of Regional Weather Conditions for November 2017 1.1 In November 2017, Southeast Asia experienced inter-monsoon conditions in the first
UPDATE OF REGIONAL WEATHER AND SMOKE HAZE (December 2017) 1. Review of Regional Weather Conditions for November 2017 1.1 In November 2017, Southeast Asia experienced inter-monsoon conditions in the first
TESTS. GRASP sensitivity. Observation Conditions. Retrieval assumptions ISTINA-WP AERO. MODELS. B. Torres, O. Dubovik and D.
 TESTS Retrieval assumptions GRASP sensitivity ISTINA-WP3380-2 Observation Conditions AERO. MODELS B. Torres, O. Dubovik and D. Fuertes Introduction Scope of ISTINA-WP3380-2 To establish fundamental limits
Impact of aerosol on air temperature in Baghdad
 Journal of Applied and Advanced Research 2017, 2(6): 317 323 http://dx.doi.org/10.21839/jaar.2017.v2i6.112 http://www.phoenixpub.org/journals/index.php/jaar ISSN 2519-9412 / 2017 Phoenix Research Publishers
Interannual variation of MODIS NDVI in Lake Taihu and its relation to climate in submerged macrophyte region
 Yale-NUIST Center on Atmospheric Environment Interannual variation of MODIS NDVI in Lake Taihu and its relation to climate in submerged macrophyte region ZhangZhen 2015.07.10 1 Outline Introduction Data
UPDATE OF REGIONAL WEATHER AND SMOKE HAZE December 2016
 UPDATE OF REGIONAL WEATHER AND SMOKE HAZE December 2016 1. Review of Regional Weather Conditions in November 2016 1.1 Inter monsoon conditions prevailed in the first half of November 2016. During this
UPDATE OF REGIONAL WEATHER AND SMOKE HAZE (February 2018)
") UPDATE OF REGIONAL WEATHER AND SMOKE HAZE (February 2018) 1. Review of Regional Weather Conditions for January 2018 1.1 The prevailing Northeast monsoon conditions over Southeast Asia strengthened in January
UPDATE OF REGIONAL WEATHER AND SMOKE HAZE (February 2018) 1. Review of Regional Weather Conditions for January 2018 1.1 The prevailing Northeast monsoon conditions over Southeast Asia strengthened in January
SPATIAL AND TEMPORAL PATTERN OF FOREST/PLANTATION FIRES IN RIAU, SUMATRA FROM 1998 TO 2000
 SPATIAL AND TEMPORAL PATTERN OF FOREST/PLANTATION FIRES IN RIAU, SUMATRA FROM 1998 TO 2000 SHEN Chaomin, LIEW Soo Chin, KWOH Leong Keong Centre for Remote Imaging, Sensing and Processing (CRISP) Faculty
UPDATE OF REGIONAL WEATHER AND SMOKE HAZE November 2016
 UPDATE OF REGIONAL WEATHER AND SMOKE HAZE November 2016 1. Review of Regional Weather Conditions in November 2016 1.1 Southwest Monsoon conditions prevailed on most days in October 2016 and the winds were
UPDATE OF REGIONAL WEATHER AND SMOKE HAZE (September 2017)
") UPDATE OF REGIONAL WEATHER AND SMOKE HAZE (September 2017) 1. Review of Regional Weather Conditions in August 2017 1.1 Southwest Monsoon conditions continued to prevail in the region in August 2017. The
UPDATE OF REGIONAL WEATHER AND SMOKE HAZE (September 2017) 1. Review of Regional Weather Conditions in August 2017 1.1 Southwest Monsoon conditions continued to prevail in the region in August 2017. The
Evaluation of aerosol optical depth and aerosol models from VIIRS retrieval algorithms over North China Plain
 University of Nebraska - Lincoln DigitalCommons@University of Nebraska - Lincoln Papers in the Earth and Atmospheric Sciences Earth and Atmospheric Sciences, Department of 2017 Evaluation of aerosol optical
Airborne High Spectral Resolution Lidar Aerosol Measurements and Comparisons with GEOS-5 Model
 Airborne High Spectral Resolution Lidar Aerosol Measurements and Comparisons with GEOS-5 Model Richard Ferrare, Chris Hostetler, John Hair, Anthony Cook, David Harper, Mike Obland, Ray Rogers, Sharon Burton,
Using remotely sensed data to quantify the characteristics of Southeast Asian forest 7ires. Xi Xi Yuk Lunch Seminar at Caltech July 9, 2013
 Using remotely sensed data to quantify the characteristics of Southeast Asian forest 7ires Xi Xi Yuk Lunch Seminar at Caltech July 9, 2013 Southeast Asia and Singapore 2 Source: Google Map The Haze Problem
Regional Air Quality Monitoring and Forecasting using Remote Sensing Satellites, Ground-level Measurements and Numerical Modelling
 Regional Air Quality Monitoring and Forecasting using Remote Sensing Satellites, Ground-level Measurements and Numerical Modelling PI: Santo V. Salinas [a] Collaborators: Ellsworth J. Welton [b], Brent
Aerosol Optical Depth Variation over European Region during the Last Fourteen Years
 Aerosol Optical Depth Variation over European Region during the Last Fourteen Years Shefali Singh M.Tech. Student in Computer Science and Engineering at Meerut Institute of Engineering and Technology,
UPDATE OF REGIONAL WEATHER AND SMOKE HAZE FOR MAY 2015
 UPDATE OF REGIONAL WEATHER AND SMOKE HAZE FOR MAY 2015 1. Review of Regional Weather Conditions in April 2015 1.1 Inter-Monsoon conditions prevailed over the ASEAN region in April 2015. The gradual northward
Who is polluting the Columbia River Gorge?
 Who is polluting the Columbia River Gorge? Final report to the Yakima Nation Prepared by: Dan Jaffe, Ph.D Northwest Air Quality, Inc. 7746 Ravenna Avenue NE Seattle WA 98115 NW_airquality@hotmail.com December
Spatial Variability of Aerosol - Cloud Interactions over Indo - Gangetic Basin (IGB)
") Spatial Variability of Aerosol - Cloud Interactions over Indo - Gangetic Basin (IGB) Shani Tiwari Graduate School of Environmental Studies Nagoya University, Nagoya, Japan Email: pshanitiwari@gmail.com
Spatial Variability of Aerosol - Cloud Interactions over Indo - Gangetic Basin (IGB) Shani Tiwari Graduate School of Environmental Studies Nagoya University, Nagoya, Japan Email: pshanitiwari@gmail.com
CHAPTER 8. AEROSOLS 8.1 SOURCES AND SINKS OF AEROSOLS
 1 CHAPTER 8 AEROSOLS Aerosols in the atmosphere have several important environmental effects They are a respiratory health hazard at the high concentrations found in urban environments They scatter and
MISR remote sensing of tropospheric aerosols
 MISR remote sensing of tropospheric aerosols David J. Diner, John V. Martonchik, Ralph A. Kahn Jet Propulsion Laboratory, California Institute of Technology Michel M. Verstraete Institute for Environment
JOURNAL OF INTERNATIONAL ACADEMIC RESEARCH FOR MULTIDISCIPLINARY Impact Factor 1.393, ISSN: , Volume 2, Issue 4, May 2014
 Impact Factor 1.393, ISSN: 3583, Volume, Issue 4, May 14 A STUDY OF INVERSIONS AND ISOTHERMALS OF AIR POLLUTION DISPERSION DR.V.LAKSHMANARAO DR. K. SAI LAKSHMI P. SATISH Assistant Professor(c), Dept. of
«Action Thématique Incitative sur Programme» CNRS/INSU
 Development and validation of a regional model of desert dust for the study of seasonal and interannual variations over Sahara and Sahel coupling with satellite observations «Action Thématique Incitative
Sand and Dust Monitoring in RA II
 Sand and Dust Monitoring in RA II Xiang Fang National Satellite Meteorological Center,CMA Outline Dust products in RA II Validation of multi-satellite products Action Proposed Dust products in RA II Operational
UPDATE OF REGIONAL WEATHER AND SMOKE HAZE (May 2017)
") UPDATE OF REGIONAL WEATHER AND SMOKE HAZE (May 2017) 1. Review of Regional Weather Conditions in April 2017 1.1 Inter monsoon conditions, characterised by afternoon showers and winds that are generally
UPDATE OF REGIONAL WEATHER AND SMOKE HAZE (May 2017) 1. Review of Regional Weather Conditions in April 2017 1.1 Inter monsoon conditions, characterised by afternoon showers and winds that are generally
Aerosol Impacts on Earth s Energy Budget: What We Can Say, and What We Can t. Ralph Kahn NASA Goddard Space Flight Center
 Aerosol Impacts on Earth s Energy Budget: What We Can Say, and What We Can t Ralph Kahn NASA Goddard Space Flight Center Trenberth, Fasullo, Kiehl, BAMS 2009 Even DARF and Anthropogenic DARF are NOT Solved
Long-lead prediction of the 2015 fire and haze episode in Indonesia
 Long-lead prediction of the 2015 fire and haze episode in Indonesia Robert Field 1,2 Dilshad Shawki 3, Michael Tippett 2, Bambang Hero Saharjo 4, Israr Albar 5, Dwi Atmoko 6, Apostolos Voulgarakis 1 1.
UPDATE OF REGIONAL WEATHER AND SMOKE HAZE February 2016
 UPDATE OF REGIONAL WEATHER AND SMOKE HAZE February 2016 1. Review of Regional Weather Conditions in January 2016 1.1 The Northeast Monsoon conditions prevailed in the region in January 2016. With the monsoon
Satellite analysis of aerosol indirect effect on stratocumulus clouds over South-East Atlantic
 1/23 Remote sensing of atmospheric aerosol, clouds and aerosol-cloud interactions. Bremen, 16-19 December 2013 Satellite analysis of aerosol indirect effect on stratocumulus clouds over South-East Atlantic
BMKG Research on Air sea interaction modeling for YMC
 BMKG Research on Air sea interaction modeling for YMC Prof. Edvin Aldrian Director for Research and Development - BMKG First Scientific and Planning Workshop on Year of Maritime Continent, Singapore 27-3
Improvement of the retrieval of aerosol optical properties over oceans using SEVIRI
 Improvement of the retrieval of aerosol optical properties over oceans using SEVIRI A. Vermeulen 1, C. Moulin 2, F. Thieuleux 3, I. Chiapello 3, J. Descloitres 1, F. Ducos 3, J-M Nicolas 1, F.-M. Bréon
An Observational Study of the Relationship between Cloud, Aerosol and Meteorology in Marine Stratus Regions
 An Observational Study of the Relationship between Cloud, Aerosol and Meteorology in Marine Stratus Regions Norman G. Loeb NASA Langley Research Center Hampton, VA Oct 18 th, 2006, AeroCom Meeting (Virginia
Daily Rainfall Disaggregation Using HYETOS Model for Peninsular Malaysia
 Daily Rainfall Disaggregation Using HYETOS Model for Peninsular Malaysia Ibrahim Suliman Hanaish, Kamarulzaman Ibrahim, Abdul Aziz Jemain Abstract In this paper, we have examined the applicability of single
V. Danylevsky Astronomical observatory of National Taras Shevchenko university. Kyiv, Ukraine.
 V. Danylevsky Astronomical observatory of National Taras Shevchenko university Kyiv, Ukraine vdanylevsky@gmail.com Astronomy and space physics in Kyiv university conference May 24 27, 2016 Kyiv, Ukraine
KUALA LUMPUR MONSOON ACTIVITY CENT
 T KUALA LUMPUR MONSOON ACTIVITY CENT 2 ALAYSIAN METEOROLOGICAL http://www.met.gov.my DEPARTMENT MINISTRY OF SCIENCE. TECHNOLOGY AND INNOVATIO Introduction Atmospheric and oceanic conditions over the tropical
Recent Update on MODIS C6 and VIIRS Deep Blue Aerosol Products
 Recent Update on MODIS C6 and VIIRS Deep Blue Aerosol Products N. Christina Hsu, Photo taken from Space Shuttle: Fierce dust front over Libya Corey Bettenhausen, Andrew M. Sayer, and Rick Hansell Laboratory
Projeto Temático FAPESP 2013/ Climate Ecosystems Atmospheric Composition
 Projeto Temático FAPESP 2013/05014-0 Climate Ecosystems Atmospheric Composition GoAmazon2014/15 Experiment Manaus is a city of 2 million people surrounded by just forest in a radius of 1.500 Km. UNIQUE
Lecture 26. Regional radiative effects due to anthropogenic aerosols. Part 2. Haze and visibility.
 Lecture 26. Regional radiative effects due to anthropogenic aerosols. Part 2. Haze and visibility. Objectives: 1. Attenuation of atmospheric radiation by particulates. 2. Haze and Visibility. Readings:
Solar radiation in Onitsha: A correlation with average temperature
 Scholarly Journals of Biotechnology Vol. 1(5), pp. 101-107, December 2012 Available online at http:// www.scholarly-journals.com/sjb ISSN 2315-6171 2012 Scholarly-Journals Full Length Research Paper Solar
Physio-chemical and Optical Characterization of Anthropogenic and Natural Aerosol: Implications for Assessing Global Effects
 Physio-chemical and Optical Characterization of Anthropogenic and Natural Aerosol: Implications for Assessing Global Effects GLOBE Pollution Southern Japan TRACE-P, 2001 Dust Antony Clarke, University
Classification of Aerosol Types over Ghardaia, Algeria, Based on MODIS Data
 Classification of Aerosol Types over Ghardaia, Algeria, Based on MODIS Data Zaiani Mohamed, Djafer Djelloul, and Chouireb Fatima Abstract Anthropogenic and natural aerosols are important atmospheric constituents
TOTAL COLUMN OZONE AND SOLAR UV-B ERYTHEMAL IRRADIANCE OVER KISHINEV, MOLDOVA
 Global NEST Journal, Vol 8, No 3, pp 204-209, 2006 Copyright 2006 Global NEST Printed in Greece. All rights reserved TOTAL COLUMN OZONE AND SOLAR UV-B ERYTHEMAL IRRADIANCE OVER KISHINEV, MOLDOVA A.A. ACULININ
Remote Sensing ISSN
 Remote Sens. 2010, 2, 2127-2135; doi:10.3390/rs2092127 Communication OPEN ACCESS Remote Sensing ISSN 2072-4292 www.mdpi.com/journal/remotesensing Determination of Backscatter-Extinction Coefficient Ratio
How good are our models?
 direct Estimates of regional and global forcing: ^ How good are our models? Bill Collins with Andrew Conley, David Fillmore, and Phil Rasch National Center for Atmospheric Research Boulder, Colorado Models
On the use of satellite remote sensing to determine direct aerosol radiative effect over land : A case study over China
 On the use of satellite remote sensing to determine direct aerosol radiative effect over land : A case study over China Anu-Maija Sundström, Antti Arola, Pekka Kolmonen, Gerrit de Leeuw, and Markku Kulmala
TEMPO Aerosols. Need for TEMPO-ABI Synergy
 TEMPO Aerosols Need for TEMPO-ABI Synergy Omar Torres, Hiren Jethva, Changwoo Ahn CEOS - 2018 NOAA-College Park May 04, 2018 Use of near UV Satellite Observations for retrieving aerosol properties over
Estimation of Solar Radiation at Ibadan, Nigeria
 Journal of Emerging Trends in Engineering and Applied Sciences (JETEAS) 2 (4): 701-705 Scholarlink Research Institute Journals, 2011 (ISSN: 2141-7016) jeteas.scholarlinkresearch.org Journal of Emerging
Satellite Constraints on Arctic-region Airborne Particles Ralph Kahn NASA Goddard Space Flight Center
 Satellite Constraints on Arctic-region Airborne Particles Ralph Kahn NASA Goddard Space Flight Center Sea of Okhotsk, MODIS image Feb. 6, 2007, NASA Earth Observatory Arctic Aerosol Remote Sensing Overview
SATELLITE AEROSOL COMPOSITION RETRIEVAL
 SATELLITE AEROSOL COMPOSITION RETRIEVAL USING NEURAL NETWORKS τ(λ), ω(λ), g(λ), m(λ), dv/d log(r), Gabriele Curci (1,2) Del Frate, F. (3), Di Noia, A. (4), Sist, M. (3), Tirelli, C. (1) (1) CETEMPS (2)
ACTRIS TNA Activity Report
 ACTRIS TNA Activity Report Characterization of Aerosol mixtures of Dust And MArine origin by synergy of lidar, sunphotometer and surface/airborne in situ, ADAMA Natalia Kouremeti Introduction and motivation
SIMULATION OF THE MONOCHROMATIC RADIATIVE SIGNATURE OF ASIAN DUST OVER THE INFRARED REGION
 P1.4 SIMULATION OF THE MONOCHROMATIC RADIATIVE SIGNATURE OF ASIAN DUST OVER THE INFRARED REGION Hyo-Jin Han 1, Byung-Ju Sohn 1 *, Aellen Huang 2, and Elizabeth Weisz 2 School of Earth and Environmental
Verification of Aerosols Loading Over Kano: A Theoretical Estimation via Mathematical Rudiments
 Verification of Aerosols Loading Over Kano: A Theoretical Estimation via Mathematical Rudiments Moses E. Emetere, Marvel L. Akinyemi, Samuel E. Sanni Abstract The danger of aerosols loading is dangerous
Dependence of Air Quality on Meteorological Parameters in Dar es Salaam, Tanzania
 Tanzania Journal of Natural and ISSN 1821-7249 Applied Sciences (TaJONAS) Faculty of Natural and Applied Science December 21: Volume 1, Issue 2 Dependence of Air Quality on Meteorological Parameters in
Regional evaluation of an advanced very high resolution radiometer (AVHRR) two-channel aerosol retrieval algorithm
 two-channel aerosol retrieval algorithm") JOURNAL OF GEOPHYSICAL RESEARCH, VOL. 109,, doi:10.1029/2003jd003817, 2004 Regional evaluation of an advanced very high resolution radiometer (AVHRR) two-channel aerosol retrieval algorithm Tom X.-P. Zhao,
JOURNAL OF GEOPHYSICAL RESEARCH, VOL. 109,, doi:10.1029/2003jd003817, 2004 Regional evaluation of an advanced very high resolution radiometer (AVHRR) two-channel aerosol retrieval algorithm Tom X.-P. Zhao,
What are Aerosols? Suspension of very small solid particles or liquid droplets Radii typically in the range of 10nm to
 What are Aerosols? Suspension of very small solid particles or liquid droplets Radii typically in the range of 10nm to 10µm Concentrations decrease exponentially with height N(z) = N(0)exp(-z/H) Long-lived
Aniekan Eyoh 1* Department of Geoinformatics & Surveying, Faculty of Environmental Studies, University of Uyo, Nigeria
 Available online at http://euroasiapub.org/journals.php, pp. 53~62 Thomson Reuters Researcher ID: L-5236-2015 TEMPORAL APPRAISAL OF LAND SURFACE TEMPERATURE DYNAMICS ACROSS THE NINE STATES OF NIGER DELTA
EXTRACTION OF THE DISTRIBUTION OF YELLOW SAND DUST AND ITS OPTICAL PROPERTIES FROM ADEOS/POLDER DATA
 EXTRACTION OF THE DISTRIBUTION OF YELLOW SAND DUST AND ITS OPTICAL PROPERTIES FROM ADEOS/POLDER DATA Takashi KUSAKA, Michihiro KODAMA and Hideki SHIBATA Kanazawa Institute of Technology Nonoichi-machi
Comparison of aerosol radiative forcing over the Arabian Sea and the Bay of Bengal
 Advances in Space Research 33 (2004) 1104 1108 www.elsevier.com/locate/asr Comparison of aerosol radiative forcing over the Arabian Sea and the Bay of Bengal S. Dey a, S. Sarkar b, R.P. Singh a, * a Department
Common Elements: Nitrogen, 78%
 Chapter 23 Notes Name: Period: 23.1 CHARACTERISTICS OF THE ATMOSPHERE The atmosphere is a layer of that surrounds the earth and influences all living things. Meteorology is the study of the. WHAT S IN
DROUGHT IN MAINLAND PORTUGAL
 DROUGHT IN MAINLAND Ministério da Ciência, Tecnologia e Ensino Superior Instituto de Meteorologia, I. P. Rua C Aeroporto de Lisboa Tel.: (351) 21 844 7000 e-mail:informacoes@meteo.pt 1749-077 Lisboa Portugal
A severe dust event over the Mongolian Gobi in 3-5 March, 2016
 A severe dust event over the Mongolian Gobi in 3-5 March, 2016 Dr.D.Jugder and E.Munkhjargal Information and Research Institute of Meteorology, Hydrology and Environment The 4 th Session of East Asia winter
Field Observation on Thermal Environment of an Urban Street with Roadside Trees in a Tropical Climate
 Field Observation on Thermal Environment of an Urban Street with Roadside Trees in a Tropical Climate Hai Jian Toh¹, Sheikh Ahmad Zaki¹, Aya Hagishima², Mohamed Sukri Mat Ali¹ 1 Universiti Teknologi Malaysia,
Aerosol Characterization and Direct Radiative Forcing Assessment over the Ocean. Part I: Methodology and Sensitivity Analysis
 1799 Aerosol Characterization and Direct Radiative Forcing Assessment over the Ocean. Part I: Methodology and Sensitivity Analysis MARIA JOÃO COSTA Department of Physics, and Évora Geophysics Centre, University
November outlook for haze over Indonesia November 4, 2015 For more information, please contact Dr. Robert Field
 November outlook for haze over Indonesia November 4, 2015 For more information, please contact Dr. Robert Field (robert.field@columbia.edu) The following is an interpretation of current NOAA Climate Prediction
Bulk aerosol optical properties over the western North Pacific estimated by MODIS and CERES measurements : Coastal sea versus Open sea
 Bulk aerosol optical properties over the western North Pacific estimated by MODIS and CERES measurements : Coastal sea versus Open sea Hye-Ryun Oh 1, Yong-Sang Choi 1, Chang-Hoi Ho 1, Rokjin J. Park 1,
APPLICATION OF CCNY LIDAR AND CEILOMETERS TO THE STUDY OF AEROSOL TRANSPORT AND PM2.5 MONITORING
 P1.14 APPLICATION OF CCNY LIDAR AND CEILOMETERS TO THE STUDY OF AEROSOL TRANSPORT AND PM2.5 MONITORING Leona A. Charles*, Shuki Chaw, Viviana Vladutescu, Yonghua Wu, Fred Moshary, Barry Gross, Stanley
VERTICAL PROFILING OF AEROSOL TYPES OBSERVED ACROSS MONSOON SEASONS WITH A RAMAN LIDAR IN PENANG ISLAND, MALAYSIA
 VERTICAL PROFILING OF AEROSOL TYPES OBSERVED ACROSS MONSOON SEASONS WITH A RAMAN LIDAR IN PENANG ISLAND, MALAYSIA Presentation by: Assoc Prof Dr. Lim Hwee San School of Physics, Universiti Sains Malaysia
Direct radiative forcing due to aerosols in Asia during March 2002
 Direct radiative forcing due to aerosols in Asia during March 2002 Soon-Ung Park, Jae-In Jeong* Center for Atmospheric and Environmental Modeling *School of Earth and Environmental Sciences, Seoul National
Simulated Radiances for OMI
 Simulated Radiances for OMI document: KNMI-OMI-2000-004 version: 1.0 date: 11 February 2000 author: J.P. Veefkind approved: G.H.J. van den Oord checked: J. de Haan Index 0. Abstract 1. Introduction 2.
Short-term modulation of Indian summer monsoon rainfall bywest Asian dust
 SUPPLEMENTARY INFORMATION DOI: 10.1038/NGEO2107 Short-term modulation of Indian summer monsoon rainfall bywest Asian dust 6 7 8 9 10 11 12 13 14 15 16 17 18 19 20 21 V Vinoj 1,2, Philip J Rasch 1*, Hailong
PROJECT REPORT (ASL 720) CLOUD CLASSIFICATION
 CLOUD CLASSIFICATION") PROJECT REPORT (ASL 720) CLOUD CLASSIFICATION SUBMITTED BY- PRIYANKA GUPTA 2011CH70177 RINI KAPOOR 2011CH70179 INDIVIDUAL CONTRIBUTION- Priyanka Gupta- analysed data of region considered in India (West:80,
PROJECT REPORT (ASL 720) CLOUD CLASSIFICATION SUBMITTED BY- PRIYANKA GUPTA 2011CH70177 RINI KAPOOR 2011CH70179 INDIVIDUAL CONTRIBUTION- Priyanka Gupta- analysed data of region considered in India (West:80,
Comparison of column-integrated aerosol optical and physical properties in Beijing and Xianghe
 Comparison of column-integrated aerosol optical and physical properties in Beijing and Xianghe Fan X.H., Chen H.B., Xia X.A. Key Laboratory of Middle Atmosphere and Global Environment Observation (LAGEO),
UKCA_RADAER Aerosol-radiation interactions
 UKCA_RADAER Aerosol-radiation interactions Nicolas Bellouin UKCA Training Workshop, Cambridge, 8 January 2015 University of Reading 2014 n.bellouin@reading.ac.uk Lecture summary Why care about aerosol-radiation
Comparing MERRA surface global solar radiation and diffuse radiation against field observations in Shanghai. Reporter: Yue Kun
 Comparing MERRA surface global solar radiation and diffuse radiation against field observations in hanghai Reporter: Yue Kun 1 OUTLINE 1 Background and Objectives 2 Materials and Methods 3 Results and
Asian Journal on Energy and Environment
 As. J. Energy Env. 2007, 08(02), 523-532 Asian Journal on Energy and Environment ISSN 1513-4121 Available online at www.asian-energy-journal.info An Assessment of the ASHRAE Clear Sky Model for Irradiance
Characterization of free-tropospheric aerosol layers from different source regions
 Leibniz Institute for Tropospheric Research Leipzig, Germany Characterization of free-tropospheric aerosol layers from different source regions Ina Mattis, Detlef Müller, Albert Ansmann, Ulla Wandinger,
Geostatistical Analysis of Rainfall Temperature and Evaporation Data of Owerri for Ten Years
 Atmospheric and Climate Sciences, 2012, 2, 196-205 http://dx.doi.org/10.4236/acs.2012.22020 Published Online April 2012 (http://www.scirp.org/journal/acs) Geostatistical Analysis of Rainfall Temperature
2016 Meteorology Summary
 2016 Meteorology Summary New Jersey Department of Environmental Protection AIR POLLUTION AND METEOROLOGY Meteorology plays an important role in the distribution of pollution throughout the troposphere,
Examining effect of Asian dusts on the AIRS-measured radiances from radiative transfer simulations
 Examining effect of Asian dusts on the AIRS-measured radiances from radiative transfer simulations Hyo-Jin Han 1, B.J. Sohn 1 Allen Huang 2, Elisabeth Weisz 2 1 School of Earth and Environmental Sciences
Evaluation of tropical and extratropical Southern Hemisphere African aerosol properties simulated by a climate model
 Click Here for Full Article JOURNAL OF GEOPHYSICAL RESEARCH, VOL. 114,, doi:10.1029/2008jd011128, 2009 Evaluation of tropical and extratropical Southern Hemisphere African aerosol properties simulated
Can a change of single scattering albedo in Amami-Oshima in a low pressure condition be explained by GCM simulations?
 Can a change of single scattering albedo in Amami-Oshima in a low pressure condition be explained by GCM simulations? Daisuke Goto 1, Toshihiko Takemura 2, Nick Schutgens 1, Haruo Tsuruta 1, and Teruyuki
Aerosol characteristics over urban Cairo: Seasonal variations as retrieved from Sun photometer measurements
 JOURNAL OF GEOPHYSICAL RESEARCH, VOL. 113,, doi:10.1029/2008jd009834, 2008 Aerosol characteristics over urban Cairo: Seasonal variations as retrieved from Sun photometer measurements M. El-Metwally, 1
Chiang Rai Province CC Threat overview AAS1109 Mekong ARCC
 Chiang Rai Province CC Threat overview AAS1109 Mekong ARCC This threat overview relies on projections of future climate change in the Mekong Basin for the period 2045-2069 compared to a baseline of 1980-2005.
Aerosol Monitoring and Modeling
 Aerosol Monitoring and Modeling Olivier Boucher Presentation to ECMWF seminar on Global Earth-System Monitoring 5-9 September 2005 Page 1 Aerosols are integral part of the Earth s system. CCN f(wind,convection)
Toward a Fire and Haze Early Warning System for Southeast Asia
 FEATURED ARTICLES 13 Toward a Fire and Haze Early Warning System for Southeast Asia Jin Ho YOO a, Jaepil CHO a, Saji HAMEED b, Robert FIELD c, Kok Foo KWAN d, Israr ALBAR e APN Project Reference: / Received:
Direct Normal Radiation from Global Radiation for Indian Stations
 RESEARCH ARTICLE OPEN ACCESS Direct Normal Radiation from Global Radiation for Indian Stations Jaideep Rohilla 1, Amit Kumar 2, Amit Tiwari 3 1(Department of Mechanical Engineering, Somany Institute of
THE SOLAR RESOURCE: PART I MINES ParisTech Center Observation, Impacts, Energy (Tel.: +33 (0) )
 )") MASTER REST Solar Resource Part I THE SOLAR RESOURCE: PART I MINES ParisTech Center Observation, Impacts, Energy philippe.blanc@mines-paristech.fr (Tel.: +33 (0)4 93 95 74 04) MASTER REST Solar Resource
MASTER REST Solar Resource Part I THE SOLAR RESOURCE: PART I MINES ParisTech Center Observation, Impacts, Energy philippe.blanc@mines-paristech.fr (Tel.: +33 (0)4 93 95 74 04) MASTER REST Solar Resource
Trends and Patterns in Atmospheric Optical Depth at Diekirch, Luxembourg ( )
") Trends and Patterns in Atmospheric Optical Depth at Diekirch, Luxembourg (1997-2007) Francis Massen (francis.massen@education.lu) Meteorological Station of the Lycée Classique de Diekirch (LCD) http://meteo.lcd.lu
Trends and Patterns in Atmospheric Optical Depth at Diekirch, Luxembourg (1997-2007) Francis Massen (francis.massen@education.lu) Meteorological Station of the Lycée Classique de Diekirch (LCD) http://meteo.lcd.lu
Chapter 4 Nadir looking UV measurement. Part-I: Theory and algorithm
 Chapter 4 Nadir looking UV measurement. Part-I: Theory and algorithm -Aerosol and tropospheric ozone retrieval method using continuous UV spectra- Atmospheric composition measurements from satellites are
THE GLI 380-NM CHANNEL APPLICATION FOR SATELLITE REMOTE SENSING OF TROPOSPHERIC AEROSOL
 THE GLI 380-NM CHANNEL APPLICATION FOR SATELLITE REMOTE SENSING OF TROPOSPHERIC AEROSOL Robert Höller, 1 Akiko Higurashi 2 and Teruyuki Nakajima 3 1 JAXA, Earth Observation Research and Application Center
Advantageous GOES IR results for ash mapping at high latitudes: Cleveland eruptions 2001
 GEOPHYSICAL RESEARCH LETTERS, VOL. 32, L02305, doi:10.1029/2004gl021651, 2005 Advantageous GOES IR results for ash mapping at high latitudes: Cleveland eruptions 2001 Yingxin Gu, 1 William I. Rose, 1 David
Disaster Monitoring with Remote Sensing at CRISP, NUS
 Disaster Monitoring with Remote Sensing at CRISP, NUS KWOH, Leong Keong Director, CRISP The 3rd Sentinel Asia Joint Project Team Meeting (JPTM) Le Meridien Hotel, Singapore 13-15 March 2007 6 metre Antenna