INVESTIGATING SOLAR CYCLES
|
|
|
- Clinton Byrd
- 5 years ago
- Views:
Transcription


1 INVESTIGATING SOLAR CYCLES A SOHO ARCHIVE & ULYSSES FINAL ARCHIVE TUTORIAL SCIENCE ARCHIVES AND VO TEAM

2 Tutorial Written By: Madeleine Finlay, as part of an ESAC Trainee Project 2013 (ESA Student Placement) Tutorial Design and Layout: Pedro Osuna & Madeleine Finlay Tutorial Science Support: Deborah Baines Acknowledgements would like to be given to the whole SAT Team for the implementation of the Ulysses and Soho archives We would also like to thank; Benjamín Montesinos, Department of Astrophysics, Centre for Astrobiology (CAB, CSIC-INTA), Madrid, Spain for having reviewed and ratified the scientific concepts in this tutorial. CONTACT ESAC Science Archives and Virtual Observatory Team European Space Agency European Space Astronomy Centre (ESAC) Tutorial
3 CONTENTS PART BACKGROUND THE EXPERIMENT...6 PART 1 SECTION PART 1 SECTION PART BACKGROUND THE EXPERIMENT...15 PART 2 SECTION PART 2 SECTION CONCLUSIONS...20 ADDITIONAL TASKS...20 NUMERICAL ANSWERS...21
4
5 PART 1
6 BACKGROUND

. It had an average speed of 56,000 km/hr.")


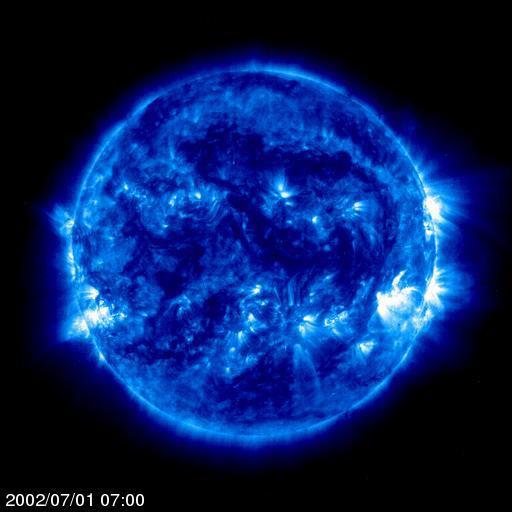
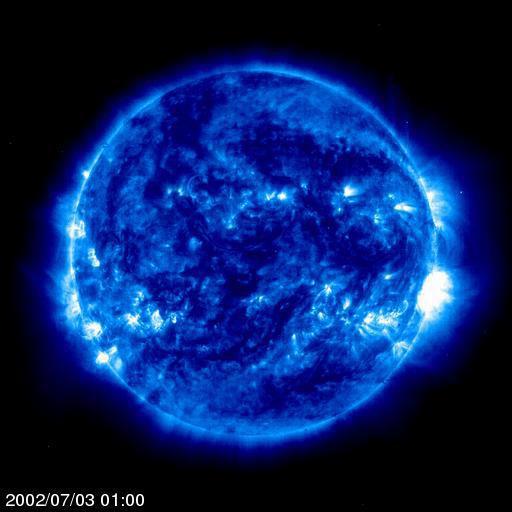
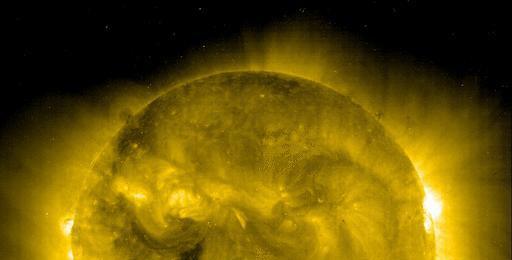
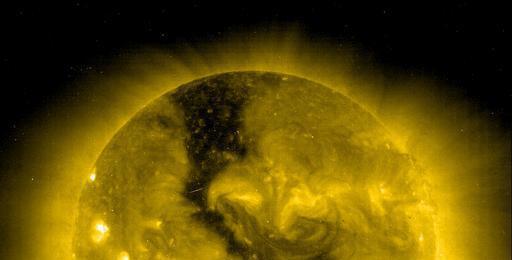
7 ABOUT ULYSSES Ulysses was a ESA/NASA joint deep-space mission, which lasted more than 18 years and measured a number of properties of the Sun. It studied the heliosphere; the region of space affected by the solar wind and magnetic fields originating from the Sun. It also provided the first ever measurement of the space above the Sun s magnetic poles. Ulysses was in a highly elliptical orbit, with the Sun at the centre. Its closest separation from the Sun was 1.3AU and its furthest point was 5.4AU (1AU= distance from Earth to the Sun). It had an average speed of 56,000 km/hr. Solar Flares & Coronal Mass Ejections A solar flare is a sudden, quick brightening of a part of the Sun s surface, and is caused by a rapid release of magnetic energy which has built up in the solar atmosphere. These are often followed by Coronal Mass Ejections; huge blasts of solar winds, which extend far into space. A solar wind is made up of a flow of charged particles, mainly consisting of protons and electrons. ABOUT SUNSPOTS Although the cause of the periodical variation of the magnetic field is still under debate, the phenomena has been known to exist for hundreds of years and was initially discovered due to changing rates of Sunspots. Sunspots are indicative of intense magnetic activity and are seen as dark patches on the surface of the Sun. They also usually indicate that other solar activity dependent on complex magnetic fields is likely to occur; such as Coronal Mass Ejections and solar flares. Background Illustration of Ulysses orbit around the Sun. There were 10 instruments aboard Ulysses, each sampling different effects produced by the Sun. For example, the Magnetometer measured the magnetic fields in the heliosphere and their variation with respect to changing latitudes. The Solar Wind Plasma Experiment studied the solar wind (a stream of charged particles expelled by the Sun); the Solar Wind Ion Composition Instrument was used to help determine the composition, temperature and speed of the particles. It is the cyclical variation of Sunspots which is seen in the solar cycles. As the number of Sunspots goes towards maximum, this corresponds to a maximum in the solar cycle. It also implies that the Sun s magnetic field has become extremely complex, and whose strength has become intense over much of the Sun. This usually means the poles are about to flip - although often this flip can take up to seven years to complete! Can You Spot The Difference? ABOUT SOLAR CYCLES Ulysses has provided extensive and indispensible data from all of its instruments. In this case-study the focus will be the behaviour of the magnetic fields. The Sun s magnetic field is extremely complicated; it is always changing. At solar minimum they have a general dipole structure, however they become twisted so that the structure disappears. The twisting eventually becomes so extreme that the poles swap the magnetic north pole becomes the magnetic south pole and vice versa. Twisted and Tangled The twisting of magnetic field lines happens periodically and causes Solar Cycles the Sun goes through increased or decreased activity depending on how twisted the magnetic field has become; at a maximum when the field lines are at their most tangled. Sunspots: Appear as dark patches on the surface of the Sun. Coronal Mass Ejections and solar flares are blasted from the Sun. European Space Agency ESAC Tutorial
8 THE EXPERIMENT THE AIM The aim of Part 1 of tutorial will be to use the Ulysses Final Archive to investigate a given hypothesis about solar cycles. This will involve studying the form of the magnetic field throughout Ulysses mission to deduce where the different points in the solar cycle lie. The task will also comprise of retrieving data from the archive for these points in the solar cycle and performing some basic analysis to test the hypothesis. At the end of this part of tutorial it should be understood how to independently use the main functions of the Ulysses Final archive.


9 THE HYPOTHESIS During a solar maximum, Ulysses will have observed an increase in the average magnetic field magnitude; when compared with during a solar minimum. The Experiment GRAPHICAL ANALYSIS PART 1 SECTION 1 The Tools Used Ulysses Final Archive: This contains all the data from the Ulysses Spacecraft mission. It provides a way to easily interact with the data. Topcat: Topcat is a program which produces tables of data, with which it is possible to perform a number of methods of analysis on the data. Such as finding out the mean, or creating a plot. An illustration of complex magnetic field lines emerging from the Sun during a solar maximum. Sunspots produce magnetic field loops, which can break; sending charged particles accelerating into space. To perform the experiment and test the hypothesis, follow the instructions in the order given here. There will be illustrations of what you should see on your screen along the way. Numerical answers required are provided in the back of this booklet. Opening the Archive and Performing the Search Firstly, open the Ulysses Final Archive homepage: and click on SEARCH. This is the Ulysses Final Archive main search interface. Firstly, choose mission under Date selection. This will give the data from Ulysses for the whole mission. Now select R component (Radial component of the magnetic field - which is the component that faces outward from the Sun s surface) and Magnetic Field Magnitude by ticking their boxes. Then click OK. This should close the new window. Then, in the Output selection box, under Trajectory File select Radius + Latitude in the drop-down menu. This will provide the position of Ulysses with respect to the Sun. Under Results output choose Plot in the drop-down menu. Click on Submit Next, under Instrument selection, choose VHM/FGM (The Ulysses Magnetic Field Investigation Vector Helium Magnetometer / Flux Gate Magnetometer). Click on Advanced. This will start up a window on the page, once this is open, click on Plot Y-Axis Selection. Analysing the Produced Plots There should be two plots - one with the two magnetic field components and one with the trajectory data. Firstly, the distance of Ulysses from the Sun needs to be compared with the magnetic field magnitude. Try clicking on a data label; this should hide the data on the plot. Therefore, click on the data label Heliographic Latitude of SC (deg) and B_R (nt). These datasets should now be hidden. European Space Agency ESAC Tutorial
10 The Experiment You should have initially produced plots where the data was over-layed. By clicking on a label, the corresponding data on the plot is hidden. This can be seen in the second plot shown here. The second plot illustrates the changing magnetic field magnitude that Ulysses detects as it moves closer to the Sun. Radial (outward) field goes from negative to positive as Ulysses moves from negative to positive latitude. The radial field is dominated by noise Radial component goes from positive to negative as Ulysses moves from negative to positive latitude. The plots should only be showing the radial component of the magnetic field and the latitude of Ulysses. What can you infer from these plots? Interpreting the Data As Ulysses travels past the Sun each time from one pole to another, we would expect a constant field to repeat the same pattern. This is not the case. In fact, what can be seen here is a reversal of the field after a noisy period. The Sun s magnetic poles appear to have flipped. From this, and what you have read in the background section, decide which sections of the mission you think might be at solar maximum and solar minimum. The first and third latitude changes (around 1995 and 2008 respectively) represent a solar minimum; there is a clear structure to the radial magnetic field. The second change (around 2001) is a solar maximum; there is no clear structure and lots of magnetic field variability over all the latitudes. Now unhide the data by re-clicking on the labels. Next, hide the data Magnetic field Magnitude (nt) and Heliocentric Radius AU (AU).


11 PART 1 SECTION 2 DATA ANALYSIS Using the Ulysses Final Archive to Produce Tables Go back to the main search interface, by clicking on Back to Search in the left-hand corner. In this section, will we consider the magnetic fields. However it should be noted that these cause the Coronal Mass Ejections and solar winds that Ulysses detected. Both of these effects are made up of charged particles flowing through space, and mainly consist of electrons and protons. Charged particles from the Sun can easily reach Earth, and often do! The Experiment Change Data Selection on the drop-down box to Arbitrary. Using this it is possible to designate specific dates. By Start Time dates, click on the calendar icon. The double arrows change the year, whereas the single arrow edits the month. Firstly the data for the solar minimum will be analysed. It was noted in the previous section that this was around It will be necessary to choose similar latitude points for both the minimum and maximum, as well as the same length of time. In this tutorial 01/01/95 01/01/96 (minimum) and 14/03/01 14/03/02 (maximum) will be used. If you aren t sure about these dates, click on Go to Results to go back to the plot of the whole mission to re-examine the plot. Therefore, under Start Time select 01/01/95 and under Stop Time choose 01/01/96. Next, in Instrument selection click on the Advanced link for the VHM/FGM instrument. A new window on the search interface should open. Now click on the blue tab which reads Table Column Selection. Then, click on Clear, which should deselect all the checked boxes. Choose Start Time, R component and Magnetic Field Magnitude. Click OK. Change the Results output to Table. Click on Submit. An artists impression of Ulysses flying through space. Interacting with the Tables You should now be under the blue tab Result #2, and grey tab VHM/FGM. This is the interactive table interface. To analyse the data, it is necessary to open the data in Topcat (interactive graphical viewer and editor for tabular data). For more information about this, click on the circular i icon. Click on the Send To and then on the Topcat link. This will open a new window on the interface. Firstly, a window will open called Jsampwebhub.Jnlp. Make sure Open with is selected and selet OK Next, a window will open called SAMP Hub Security to authorise the connection and continue sending the data to Topcat, click on Yes. After, another window should pop-up called Opening topcat-full.jnlp to open Topcat with the data select Open with and OK. European Space Agency ESAC Tutorial


12 Using Topcat Topcat should now be open. The data will be labelled UFA Table ; the trajectory data will not have been sent. To check whether this is the correct data, double click on UFA Table in the box Table List and compare it to the data in the interactive table. To do this it will be necessary to click Close on the window that is currently open in the Ulysses Final Archive. This won t close anything in Topcat. Go back to the Topcat window. Click on the statistics button. A new table window should open. Read off the Mean value for the magnetic field magnitude (B) and its standard deviation (SD), and write it down in the table provided below. The standard deviation illustrates how much the data varies with respect to the mean value. Now repeat this process from Step 1, but using the dates 14/03/01 14/03/02, so that you are finding the data for the solar maximum. Finish filling in the above table. What can you see from this data? An example of a coronal mass ejection, captured by SOHO (Solar and Heliospheric Observatory). The shaded disc at the centre of the image is a mask in the instrument that blots out direct sunlight. The white circle in the disc shows the size and position of the Sun. It can be seen how big the Coronal Mass Ejections are! OPTIONAL Try plotting the data in Topcat by pressing scatter-plot button and selecting data for the x-axis and y-axis. Try plotting the date epoch (x-axis) and magnetic field magnitude B (y-axis) and comparing it to the plots produced using the archive (as was done in Section 1). The Experiment This is the statistics button. This is the data sent; to open it in Topcat, double click the label here. This button opens a window where the user can create scatter-plots. MAGNETIC FIELD MAGNITUDE TABLE POINT IN SOLAR CYCLE MEAN VALUE STANDARD DEVIATION SOLAR MINIMUM SOLAR MAXIMUM The answers can be found in the back of this tutorial booklet.
13 The Experiment ANALYSIS In this part of the tutorial we have seen how to deduce what part of the solar cycle the Sun might currently be in, by using data from the Ulysses Final Archive. The data you collected for the magnetic field magnitude should be greater for the dates for the solar maximum, and the standard deviation (variation away from the mean) much higher. This is due to the increased rate of sunspots during the solar maximum. Another effect whose rate increases during a solar maximum is Coronal Mass Ejections, which blast off charged particles from the Sun, as a massive solar wind. Can you tell how long the solar cycle takes, from the graphs you produced in Ulysses? It should be possible to see that each cycle lasts around 11 years; to go from a solar minimum to the next. Often the solar cycle is known in terms of the 22-year cycle because this is how long it takes for the Sun s polarity to return to its original configuration. Have a go at guessing what stage of the solar cycle we are currently in. What next? The second part of this tutorial will look at solar winds and Coronal Mass Ejections. Firstly, some background information will be given. Then the SOHO (Solar and Heliospheric Observatory) archive will be utilised to examine a Coronal Mass Ejection, along with Ulysses data. Another hypothesis concerning solar cycles will be made and tested. Finally, some conclusions from what has been found in this tutorial will be made. The European Space Agency ESAC Tutorial
14 PART 2
15 BACKGROUND


.")
 are the phenomena of the Sun when it blasts great amounts of charged particles into space, mainly consisting of electrons and protons.")

16 Background ABOUT SOHO SOHO is a spacecraft built by ESA and NASA to study the Sun, from its core to the solar wind it produces. The mission was launched in 1995 and has 12 instruments on board. Its aim was to analyse the structure and dynamics of the inside of the Sun, as well as the solar corona and the solar wind. SOHO s orbit has the Sun at its centre and moves with the Earth; the combined gravity of the Earth and Sun keep SOHO in this orbit, and locked to the Earth about 1.5 million km away. The data that will be considered in this tutorial will come from three instruments aboard SOHO. These are EITs (Extreme Ultraviolet Imaging Telescopes), which produce images of the Sun in four colours at the extreme end of the Ultraviolet frequency. SOHO is constantly observing the Sun, so that we can better understand the science MORE ON CORONAL MASS EJECTIONS Next, there is the Large Angle and Spectrometric Coronograph (LASCO). This observes the corona (exterior layer of the Sun s atmosphere) and blocks the direct light from the Sun s surface by creating an artificial eclipse. As was stated previously, Coronal Mass Ejections (CMEs) are the phenomena of the Sun when it blasts great amounts of charged particles into space, mainly consisting of electrons and protons. This can also be seen as a release of a vast quantity of electromagnetic radiation, which carries away lots of energy into space. CMEs are linked with changes in the corona s magnetic field, where the corona is the plasma around the surface of the Sun which extends millions of km into space. The exact explanation of what causes this phenomenon is unknown, and so CMEs are an active area of research. Finally there is the Michelson Doppler Imager (MDI). This instrument records the motion of the Sun s surface, which scientists can use to gain information about the structure and dynamics of the Sun s interior. CMEs are impressive events to observe. They eject vast amounts of material; around kg per event. Although this seems a lot, it is very much less than the mass of the Sun itself, 2 x kg. The protons and electrons are also travelling extremely fast; and often reach speeds of around km/s!
17 THE EXPERIMENT THE AIM The aim of Part 2 of the tutorial will be to use the SOHO archive to investigate some properties of the Sun during solar maxima and minima, in particular Coronal Mass Ejections. Following on from this the Ulysses Final Archive will be used to analyse a given hypothesis about Coronal Mass Ejections and the Sun s solar cycles. At the end of Part 2 of the tutorial, it should be understood how to independently use both of the archives, as well as having a basic understanding of some of the Sun s properties during different parts of the solar cycle.


18 The Experiment THE HYPOTHESIS During a solar maximum there will be an increase in the density of electrons and protons measured by Ulysses, due to an increase in Coronal Mass Ejections. PART 2 SECTION 1 Analysing SOHO Data Tools Used SOHO archive: The SOHO archive contains all the data from the SOHO space-mission so far. Using this it is possible to easily search for data, as well as making time animations from images from the Sun. Ulysses Final Archive: This has the data from the Ulysses space-mission and can make both interactive tables and graphs. Topcat: Topcat is a program which creates tabular data. It has a number of features which make it easily to anaylse the data, such as the finding the mean, or creating a plot. An illustration of a Coronal Mass Ejection pointed towards the Earth and its magnetic field. Now click on the time animator button, as indicated in the picture. Or click on Windows and then Time Animator. This will open a new tab within the SOHO archive. The time animator takes the images taken by SOHO and creates a short animation. Under Instrument/Filter select EIT 195 LASCO C2 and MDI Continuum. It is possible to select all three at the same time by holding down the ctrl key whilst clicking on the instruments. Using the SOHO Archive To Produce Animations Firstly, it will be important to convince yourself that there are more CMEs during a solar maximum than a solar minimum. To do this the SOHO archive will be used. Open the SOHO archive. This is done by going to and clicking on the link which reads Click here to start the user interface. A new window will open called ssa.jnlp ; click on Open with and then click OK to open the SOHO archive. The SOHO archive should now be open. Next, change the Max Number of Evenly Spaced Images to 300 by selecting it in the dropdown box. Initially, the images for the solar minimum will be analysed. Therefore, the dates 01/06/ /06/1996 should be entered. If you are not sure about these dates go back to Part 1 of the tutorial and consider the graph of the magnetic field for the whole mission again. To input the dates, go to the box labelled Date Range and click on the calendar icon for Begin and End and choose the relevant Then click on the Search button with the green tick icon. Don t worry if it is taking time to create the animations, there may be around 900 images being loaded.

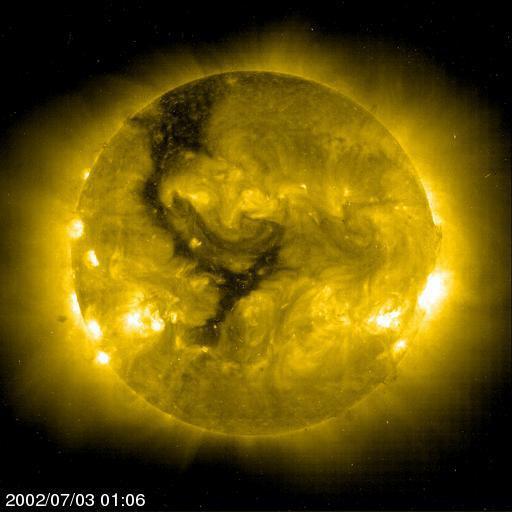
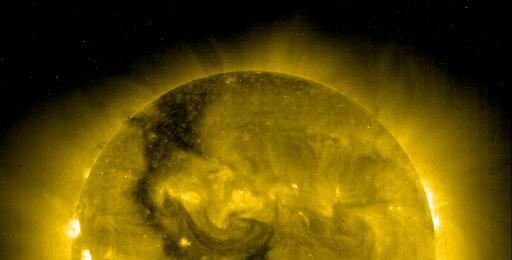
19 Evaluating the Animations An animation for each of the instruments should be in the box Time Animator Results. Watch each of the films by clicking on the blue play icon under the title Play Movie. Write down what you notice about each of the animations. WHAT DO YOU SEE? Now repeat this for a solar maximum. It is only necessary to change the dates for the search. Change the dates to 01/02/ /02/2002. Again, click on the Search button and once the three films have been made, watch them by clicking on the blue play icon. Write down what you notice about the solar maximum videos. How do they compare to the solar minimum videos. The Experiment SOLAR MINIMUM SOLAR MAXIMUM MDI CONTINUUM EIT 195 LASCO C2 MDI Continuum the dark spots you should be able to see are the sunspots mentioned in the first part of the tutorial. It should be noted that there are many more sunspots during the dates inputted for the solar maximum compared to the solar minimum dates. EIT 195 the image should have many more luminous patches during the solar maximum, of which most will be solar flares; which were previously defined as a brightening of a section of the Sun s surface usually followed by a Coronal Mass Ejection. LASCO C2 It should have been noted that during the solar maximum there was much more activity from the Sun to observe. Some of the large bursts it is possible to see are likely to be Coronal Mass Ejections. Therefore it can be assumed that there were many more Coronal Mass Ejections during the solar maximum than the solar minimum. This was what was expected. (You may have also noticed that the Sun appeared to be turning. This is right; the Sun actually rotates! It has different rates of rotation at different latitudes, but at the equator the period for one full rotation is around 24 days.) This is an example of the kind of images you will see in an EIT 195 video. From the SOHO data it can be concluded that during a solar maximum there is much more activity than during a solar minimum, including Coronal Mass Ejections. Now we will investigate the mean proton and electron densities during these times to see if Ulysses observed an increase; which will test the hypothesis. European Space Agency ESAC Tutorial

 and click on the Advanced link.")

. Now select the SWOOPS Electrons tab.")

20 PART 2 SECTION 2 Analysing Ulysses Data Selecting the Data To begin, go to the Ulysses archive main search page; Next, select the solar minimum dates in the Date Selection box. To do this, select Arbitrary in the Date Selection dropdown box, then choose the relevant dates for Start Time and Stop Time by clicking on the calendar icon. The dates are those used for SOHO; 01/06/ /06/1996. Under Instrument Selection select SWOOPS (Solar Wind Plasma Investigation) and click on the Advanced link. Select the Table Column Selection tab. Make sure the SWOOPS Ions tab is open. Therefore, click on the Send To button, and then on the Topcat link. A window should open called Jsampwebhub.Jnlp. Make sure Open with is selected and select OK. Next, a window will open called SAMP Hub Security to authorise the connection and continue sending the data to Topcat, click on Yes. After, another window should pop-up called Opening topcat-full.jnlp to open Topcat with the data select Open with and OK. The Experiment Click Clear and then select Start Time and p+ density (which is the proton density). Now select the SWOOPS Electrons tab. Click Clear again and this time select Start Time and Total Density. Click OK, the Advanced window should close. The trajectory data is not necessary for this part of the tutorial, so select Off in the dropdown box next to Trajectory File. In the Results Output box, select table. Finally, click Submit. Sending the Tables to Topcat The tabular data results should now appear. The tab SWOOPS Ions should be open. The data needs to be sent to Topcat (as was done in part 1 of the tutorial). Topcat should now be open. The data will be labelled UFA Table. To check whether this is the correct data, double click on UFA Table in the box Table List and compare it to the data in the interactive table. To do this it will be necessary to click Close on the window that is currently open in the Ulysses Final Archive. This won t close anything in Topcat. This is the statistics button You should also see that only the proton density data has been sent. To send the electron density data, click on the grey SWOOPS Electrons tab. Once this tab is open, click on Send To and the Topcat link. The data should be sent to Topcat again.


21 This new data will also be labelled under UFA Table, however they will be numbered. Go back to the Ulysses archive tables, and click on Close. The Experiment Finding the Mean Values To compare this data with the solar maximum data, firstly click on the Back to Search link in the top left-hand corner of the screen. Now edit the dates to the solar maximum dates; 01/02/ /02/2002. Do this as before, under the Date Selection box. The same data should still be selected as in the previous search, so now just click on Submit. The new tables should open as before. Once again, as before send SWOOPS proton data by making sure that the SWOOPS Ions tab is open and clicking on Send To and then Topcat. Do the same under the SWOOPS Electrons tab. Now all the necessary data has been sent to Topcat, click on first UFA Table label in the box Table List so that it is selected in blue, and then click on the statistics button. Do this with each of the labels, so that four new windows have opened. The first statistics window should show the mean for the proton density in the solar minimum, the second for the electron density in the solar minimum, the third for the proton density for the solar maximum and the fourth for the electron density for the solar maximum. Comparing the Data Write the values you find in the table below. The answers are given in the back of this tutorial booklet. This is an example of one of the statistics windows that you will open. It is the proton density for the solar minimum. See if the numerical values match with the ones you found. The important value for this experiment is the mean. SOLAR MINIMUM SOLAR MAXIMUM MEAN PROTON DENSITY MEAN ELECTRON DENSITY European Space Agency ESAC Tutorial


22 The Experiment You should notice that, as predicted, Ulysses has detected higher mean proton and electron densities during the solar maximum compared to the solar minimum. Therefore, from this and the corresponding SOHO data, it is possible to see that the hypothesis was correct; that Ulysses observed an increased proton and electron density due to the increased rate of CME s during a solar maximum. Conclusions In Part 1 of the tutorial information was given about certain characteristics of the Sun; in particular sunspots, CMEs and solar flares. A hypothesis about the magnetic field detected by the ESA/NASA spacecraft Ulysses was made, and proved correct. This showed that in the solar cycle, during the solar maximum there is an increase in the radial (outwards) component of the magnetic field of the Sun. One of the reasons given for this is the increased rate of Sunspots during this time, which are associated with strong magnetic fields. In Part 2 of the tutorial more in depth information was give about CMEs - Coronal Mass Ejections, and one of their properties was investigated. A hypothesis was analysed, using ESA/NASA SOHO data, as well as Ulysses data. The hypothesis was proved correct, which illustrated that during a solar maximum there is an increase in the proton and electron densities detected by Ulysses. These are associated with the Coronal Mass Ejections which create huge solar winds that are sent far into space at great speeds. Therefore, in conclusion we have seen that the Sun goes through cycles; solar cycles. The solar maximum is associated with more activity such as sunspots, Coronal Mass Ejections and solar flares. These can be directly observed using data from the SOHO archive, or some of their properties can be investigated using the Ulysses archive. We also briefly considered some of the consequences of increased activity from the Sun, such as aurora, or the danger of radiation damage for astronauts. Additional Activites Try coming up with your own hypothesis about the Sun to test with SOHO or Ulysses data. If you aren t sure, use a search engine to do some research about other solar effects you are likely to see, or look at data using the archives for solar maxima and minima and see what things you can spot! You can even the Science Archives Team with your conclusions at: Pedro.Osuna@esa.int Write your own booklet about the Sun and its activity. You could even try including some pictures from the SOHO archive, or graphs from the Ulysses archive. Pick some random dates and look at the data from both of the archives to see if you can tell whether they belong to a solar maximum, or a solar minimum. Revealing new ways to see our Sun can teach us a lot about the way it works.


23 Answers to Numerical Problems PART 1 SECTION 2 : MAGNETIC FIELD MAGNITUDE TABLE Answers POINT IN SOLAR CYCLE MEAN VALUE STANDARD DEVIATION SOLAR MINIMUM SOLAR MAXIMUM PART SECTION 2 : OPTIONAL ACITIVITES The plots produced should look something like this: Plots made with Topcat Plots made with the Ulysses Final Archive PART 2 SECTION 2 : PROTON AND ELECTRON DENSITIES SOLAR MINIMUM SOLAR MAXIMUM MEAN PROTON DENSITY MEAN ELECTRON DENSITY European Space Agency ESAC Tutorial
24 CONTACT ESAC Science Archives and Virtual Observatory Team EUROPEAN SPACE AGENCY AGENCE SPATIALE EUROPÉENNE ESAC TUTORIAL
The information you need will be on the internet. Please label your data with the link you used, in case we need to look at the data again.
 Solar Activity in Many Wavelengths In this lab you will be finding the sidereal rotation period of the Sun from observations of sunspots, you will compare the lifetimes of larger and smaller sunspots,
The Structure of the Sun. CESAR s Booklet
 How stars work In order to have a stable star, the energy it emits must be the same as it can produce. There must be an equilibrium. The main source of energy of a star it is nuclear fusion, especially
ESAC VOSPEC SCIENCE TUTORIAL
 SCIENCE ARCHIVES AND VO TEAM ESAC VOSPEC SCIENCE TUTORIAL COMPARING SPECTRA OF THE SUN AND SIMILAR STARS THEORY SECTION Tutorial created by Luis Sánchez, ESAC SOHO Archive scientist, adapted from the Tracking
Solar Observation Class Project
 Name: School: Grade or Level: Lesson Plan #: Date: Object Solar Observation Class Project The object of this classroom exercise to involve as individuals or as teams, students in the actual astronomical
Using This Flip Chart
 Using This Flip Chart Sunspots are the first indicators that a storm from the Sun is a possibility. However, not all sunspots cause problems for Earth. By following the steps in this flip chart you will
The Magnetic Sun. CESAR s Booklet
 The Magnetic Sun CESAR s Booklet 1 Introduction to planetary magnetospheres and the interplanetary medium Most of the planets in our Solar system are enclosed by huge magnetic structures, named magnetospheres
Summer School Lab Activities
 Summer School Lab Activities Lab #5: Predicting and Modeling the Arrival of the May 12 th 1997 CME In this lab we will use remote observations of the May 12, 1997 solar flare and halo CME made at and near
The Sun. Never look directly at the Sun, especially NOT through an unfiltered telescope!!
 The Sun Introduction We will meet in class for a brief discussion and review of background material. We will then go outside for approximately 1 hour of telescope observing. The telescopes will already
CESAR Science Case. Jupiter Mass. Calculating a planet s mass from the motion of its moons. Student s Guide
 Jupiter Mass Calculating a planet s mass from the motion of its moons Student s Guide 2 Table of Contents The... Error! Marcador no definido. Kepler s Three Laws... 4 Activity 1: Properties of the Galilean
Chapter 9 The Sun. Nuclear fusion: Combining of light nuclei into heavier ones Example: In the Sun is conversion of H into He
 Our sole source of light and heat in the solar system A common star: a glowing ball of plasma held together by its own gravity and powered by nuclear fusion at its center. Nuclear fusion: Combining of
The Project. National Schools Observatory
 Sunspots The Project This project is devised to give students a good understanding of the structure and magnetic field of the Sun and how this effects solar activity. Students will work with sunspot data
Astronomy 154 Lab 4: The Sun. NASA Image comparing the Earth with the Sun. Image from:
 Astronomy 154 Lab 3: The Sun NASA Image comparing the Earth with the Sun. Image from: http://www.universetoday.com/16338/the-sun/ The Sun at the center of our Solar System is a massive ball of Hydrogen,
Acceleration of the Solar Wind
 From Sun to Mud: Solar and Space Physics for the UG Classroom Acceleration of the Andrew Jordan All images from SOHO spacecraft This presentation helps introductory physics students apply their skills
Prelab 7: Sunspots and Solar Rotation
 Name: Section: Date: Prelab 7: Sunspots and Solar Rotation The purpose of this lab is to determine the nature and rate of the sun s rotation by observing the movement of sunspots across the field of view
Weight of upper layers compresses lower layers
 Weight of upper layers compresses lower layers Gravitational equilibrium: Energy provided by fusion maintains the pressure Gravitational contraction: Provided energy that heated core as Sun was forming
Exploring the Solar Wind with Ultraviolet Light
 Timbuktu Academy Seminar, Southern University and A&M College, November 19, 2003 Exploring the Solar Wind with Ultraviolet Light Steven R. Cranmer Harvard-Smithsonian Center for Astrophysics, Cambridge,
Student s guide CESAR Science Case Rotation period of the Sun and the sunspot activity
 Student s guide CESAR Science Case Rotation period of the Sun and the sunspot activity Name Date Introduction As you may know, the Sun is a luminous globe among many, consisting of hot gas that provides
The Sun as Our Star. Properties of the Sun. Solar Composition. Last class we talked about how the Sun compares to other stars in the sky
 The Sun as Our Star Last class we talked about how the Sun compares to other stars in the sky Today's lecture will concentrate on the different layers of the Sun's interior and its atmosphere We will also
Chapter 10 Our Star. X-ray. visible
 Chapter 10 Our Star X-ray visible Radius: 6.9 10 8 m (109 times Earth) Mass: 2 10 30 kg (300,000 Earths) Luminosity: 3.8 10 26 watts (more than our entire world uses in 1 year!) Why does the Sun shine?
Radiation Zone. AST 100 General Astronomy: Stars & Galaxies. 5. What s inside the Sun? From the Center Outwards. Meanderings of outbound photons
 AST 100 General Astronomy: Stars & Galaxies 5. What s inside the Sun? From the Center Outwards Core: Hydrogen ANNOUNCEMENTS Midterm I on Tue, Sept. 29 it will cover class material up to today (included)
Astronomy 150: Killer Skies. Lecture 18, March 1
 Assignments: Astronomy 150: Killer Skies HW6 due next Friday at start of class HW5 and Computer Lab 1 due Night Observing continues next week Lecture 18, March 1 Computer Lab 1 due next Friday Guest Lecturer:
1.3j describe how astronomers observe the Sun at different wavelengths
 1.3j describe how astronomers observe the Sun at different wavelengths 1.3k demonstrate an understanding of the appearance of the Sun at different wavelengths of the electromagnetic spectrum, including
19 The Sun Introduction. Name: Date:
 Name: Date: 19 The Sun 19.1 Introduction The Sun is a very important object for all life on Earth. The nuclear reactions that occur in its core produce the energy required by plants and animals for survival.
Intensity of Light and Heat. The second reason that scientists prefer the word intensity is Well, see for yourself.
 IDS 102 Intensity of Light and Heat When talking about a light source, most people are more comfortable with the word brightness than they are with the word intensity. Scientists generally prefer the word
Outline. Astronomy: The Big Picture. Earth Sun comparison. Nighttime observing is over, but a makeup observing session may be scheduled. Stay tuned.
 Nighttime observing is over, but a makeup observing session may be scheduled. Stay tuned. Next homework due Oct 24 th. I will not be here on Wednesday, but Paul Ricker will present the lecture! My Tuesday
Stars and Galaxies. The Sun and Other Stars
 CHAPTER 22 Stars and Galaxies LESSON 2 The Sun and Other Stars What do you think? Read the two statements below and decide whether you agree or disagree with them. Place an A in the Before column if you
Sun Earth Connection Missions
 Sun Earth Connection Missions ACE Advanced Composition Explorer The Earth is constantly bombarded with a stream of accelerated particles arriving not only from the Sun, but also from interstellar and galactic
Chapter 24: Studying the Sun. 24.3: The Sun Textbook pages
 Chapter 24: Studying the Sun 24.3: The Sun Textbook pages 684-690 The sun is one of the 100 billion stars of the Milky Way galaxy. The sun has no characteristics to make it unique to the universe. It is
PHYS133 Lab 6 Sunspots and Solar Rotation
 PHYS133 Lab 6 Sunspots and Solar Rotation Goals: Select a series of images with sunspots suitable for measurement. View an animation of the images showing the motion of the spots as the Sun rotates. Devise
Student Instruction Sheet: Unit 4 Lesson 3. Sun
 Student Instruction Sheet: Unit 4 Lesson 3 Suggested time: 1.25 Hours What s important in this lesson: Sun demonstrate an understanding of the structure, and nature of our solar system investigate the
Student s guide CESAR Science Case The differential rotation of the Sun and its Chromosphere
 Student s guide CESAR Science Case The differential rotation of the Sun and its Chromosphere Name Date Introduction The Sun as you may already know, is not a solid body. It is a massive body of gas constantly
The Sun: Our Star. A glowing ball of gas held together by its own gravity and powered by nuclear fusion
 Our Star, the Sun The Sun: Our Star A glowing ball of gas held together by its own gravity and powered by nuclear fusion Radius: 700,000 km (435,000 miles) Diameter: 1.392 million km (865,000 miles) Circumference:
Chapter 14 Lecture. The Cosmic Perspective Seventh Edition. Our Star Pearson Education, Inc.
 Chapter 14 Lecture The Cosmic Perspective Seventh Edition Our Star 14.1 A Closer Look at the Sun Our goals for learning: Why does the Sun shine? What is the Sun's structure? Why does the Sun shine? Is
Sun s Properties. Overview: The Sun. Composition of the Sun. Sun s Properties. The outer layers. Photosphere: Surface. Nearest.
 Overview: The Sun Properties of the Sun Sun s outer layers Photosphere Chromosphere Corona Solar Activity Sunspots & the sunspot cycle Flares, prominences, CMEs, aurora Sun s Interior The Sun as an energy
1 A= one Angstrom = 1 10 cm
 Our Star : The Sun )Chapter 10) The sun is hot fireball of gas. We observe its outer surface called the photosphere: We determine the temperature of the photosphere by measuring its spectrum: The peak
Convection causes granules. Photosphere isn t actually smooth! Granules Up-Close: like boiling water. Corona or of the Sun. Chromosphere: sphere of
 Overview Properties of the Sun Sun s outer layers Photosphere Chromosphere Corona Solar Activity Sunspots & the sunspot cycle Flares, prominences, CMEs, aurora Sun s Interior The Sun as an energy source
Our Sun Our Star. Image credit: JAXA. OU-L P SC 100 Spring, /81
 Our Sun Our Star Image credit: JAXA OU-L P SC 100 Spring, 2009 1/81 1 Diameter: 1,400,000 km = 864,000 miles = 4.5 light-seconds 1,300,000 Earths could fit inside! 109 Earths would fit across the diameter
The Sun. How are these quantities measured? Properties of the Sun. Chapter 14
 The Sun Chapter 14 The Role of the Sun in the Solar System > 99.9% of the mass Its mass is responsible for the orderly orbits of the planets Its heat is responsible for warming the planets It is the source
Some Good News. Announcements. Lecture 10 The Sun. How does the Sun shine? The Sun s Energy Source
 Announcements Homework due today. Put your homework in the box NOW. Please STAPLE them if you have not done yet. Quiz#3 on Tuesday (Oct 5) Announcement at the end of this lecture. If you could not pick
Is there life outside of Earth? Activity 2: Moving Stars and Their Planets
 Is there life outside of Earth? Activity 2: Moving Stars and Their Planets Overview In this activity, students are introduced to the wobble-method (officially known as the radial velocity method) of detecting
The Sun. 1a. The Photosphere. A. The Solar Atmosphere. 1b. Limb Darkening. A. Solar Atmosphere. B. Phenomena (Sunspots) C.
 C.") The Sun 1 The Sun A. Solar Atmosphere 2 B. Phenomena (Sunspots) Dr. Bill Pezzaglia C. Interior Updated 2006Sep18 A. The Solar Atmosphere 1. Photosphere 2. Chromosphere 3. Corona 4. Solar Wind 3 1a. The
The Sun 1 The Sun A. Solar Atmosphere 2 B. Phenomena (Sunspots) Dr. Bill Pezzaglia C. Interior Updated 2006Sep18 A. The Solar Atmosphere 1. Photosphere 2. Chromosphere 3. Corona 4. Solar Wind 3 1a. The
The Sun. 1a. The Photosphere. A. The Solar Atmosphere. 1b. Limb Darkening. A. Solar Atmosphere. B. Phenomena (Sunspots) C.
 C.") The Sun 1 The Sun A. Solar Atmosphere 2 B. Phenomena (Sunspots) Dr. Bill Pezzaglia C. Interior Updated 2014Feb08 A. The Solar Atmosphere 1. Photosphere 2. Chromosphere 3. Corona 4. Solar Wind & earthly
The Sun 1 The Sun A. Solar Atmosphere 2 B. Phenomena (Sunspots) Dr. Bill Pezzaglia C. Interior Updated 2014Feb08 A. The Solar Atmosphere 1. Photosphere 2. Chromosphere 3. Corona 4. Solar Wind & earthly
Chapter 14 Lecture. Chapter 14: Our Star Pearson Education, Inc.
 Chapter 14 Lecture Chapter 14: Our Star 14.1 A Closer Look at the Sun Our goals for learning: Why does the Sun shine? What is the Sun's structure? Why does the Sun shine? Is it on FIRE? Is it on FIRE?
Lab #2: Activity 5 Exploring the Structure of the Solar Magnetic Field Using the MAS Model
 Lab #2: Activity 5 Exploring the Structure of the Solar Magnetic Field Using the MAS Model In this lab activity we will use results from the MAS (Magnetohydrodynamics Around a Sphere) model of the solar
Module 4: Astronomy - The Solar System Topic 2 Content: Solar Activity Presentation Notes
 The Sun, the largest body in the Solar System, is a giant ball of gas held together by gravity. The Sun is constantly undergoing the nuclear process of fusion and creating a tremendous amount of light
Guidepost. Chapter 08 The Sun 10/12/2015. General Properties. The Photosphere. Granulation. Energy Transport in the Photosphere.
 Guidepost The Sun is the source of light an warmth in our solar system, so it is a natural object to human curiosity. It is also the star most easily visible from Earth, and therefore the most studied.
Helios in Greek and Sol in Roman
 Helios in Greek and Sol in Roman Drove his chariot across the sky to provide daylight Returned each night in a huge golden cup on the river Oceanus His son Phaeton drove the chariot one day but lost control
Lecture 17 The Sun October 31, 2018
 Lecture 17 The Sun October 31, 2018 1 2 Exam 2 Information Bring a #2 pencil! Bring a calculator. No cell phones or tablets allowed! Contents: Free response problems (2 questions, 10 points) True/False
The Interior Structure of the Sun
 The Interior Structure of the Sun Data for one of many model calculations of the Sun center Temperature 1.57 10 7 K Pressure 2.34 10 16 N m -2 Density 1.53 10 5 kg m -3 Hydrogen 0.3397 Helium 0.6405 The
The Sun is the nearest star to Earth, and provides the energy that makes life possible.
 1 Chapter 8: The Sun The Sun is the nearest star to Earth, and provides the energy that makes life possible. PRIMARY SOURCE OF INFORMATION about the nature of the Universe NEVER look at the Sun directly!!
Hydrogen Lines. What can we learn from light? Spectral Classification. Visible Hydrogen Spectrum Lines: Series. Actual Spectrum from SDSS
 What can we learn from light? Hydrogen Lines Temperature Energy Chemical Composition Speed towards or away from us All from the! Lower E, Lower f, λ Visible! Higher E, Higher f, λ Visible Hydrogen Spectrum
Introduction. Name: Basic Features of Sunspots. The Solar Rotational Period. Sunspot Numbers
 PHYS-1050 Tracking Sunspots Spring 2013 Name: 1 Introduction Sunspots are regions on the solar surface that appear dark because they are cooler than the surrounding photosphere, typically by about 1500
The sun, yellow dwarf star at the heart of the solar system NASA.gov, adapted by Newsela staff
 Name: Period: Date: Article of the Week Directions: Read the following article carefully and annotate. You need to include at least 1 annotation per paragraph. Be sure to include all of the following in
Our sun is the star in our solar system, which lies within a galaxy (Milky Way) within the universe. A star is a large glowing ball of gas that
 within the universe. A star is a large glowing ball of gas that") Our sun is the star in our solar system, which lies within a galaxy (Milky Way) within the universe. A star is a large glowing ball of gas that generates energy through nuclear fusion in its core. The
Our sun is the star in our solar system, which lies within a galaxy (Milky Way) within the universe. A star is a large glowing ball of gas that generates energy through nuclear fusion in its core. The
Term Project PHYS Solar Rotation
 Term Project PHYS 1070.03 Solar Rotation Due Date: May 19 th, 2009 (11:30am, in class) Introduction: The objective of this term project is to determine the solar rotation period by using photos of the
Astronomy 101 Lab: Solar Observing
 Name: Astronomy 101 Lab: Solar Observing Pre-Lab Assignment: In this lab, you will determine the rotation rate of the Sun, determine the speed of material ejected from the Sun in a coronal mass ejection,
CESAR BOOKLET General Understanding of the Sun: Magnetic field, Structure and Sunspot cycle
 CESAR BOOKLET General Understanding of the Sun: Magnetic field, Structure and Sunspot cycle 1 Table of contents Introduction to planetary magnetospheres and the interplanetary medium... 3 A short introduction
Astronomy Exam 3 - Sun and Stars
 Astronomy Exam 3 - Sun and Stars Study online at quizlet.com/_4zgp6 1. `what are the smallest group of stars in the H-R diagram 2. A star has a parallax of 0.05". what is the distance from the earth? white
Boyle s Law and Charles Law Activity
 Boyle s Law and Charles Law Activity Introduction: This simulation helps you to help you fully understand 2 Gas Laws: Boyle s Law and Charles Law. These laws are very simple to understand, but are also
We ask questions. Like this one. What does this word make you think of? What is the first "thing" you think of? Hold on to that thought a minute.
 I'm glad you are here. I've made these notes for you to read while I'm presenting, and I've tried to say only what is most important. If you want to learn more, please use your interpreter, if you have
Potter Name: Date: Hour: Earth Science Unit 2: Astronomy
 Unit 2: Astronomy #1 LT 2.1 Galaxy Formation: I am able to describe the formation of the Milky Way Galaxy and our solar system and model earth s position in each. Yes I can 1. Can you roughly explain how
Name Date Per Teacher. Packet #4 The Sun
 Packet #4 The Sun Reading Guide: Chapter 29.1 (read text pages 755 760) STRUCTURE OF THE SUN 1e Students know the Sun is a typical star and is powered by nuclear reactions, primarily the fusion of hydrogen
Long Term Solar Modulation with the AMS-02 detector on the International Space Station
 Long Term Solar Modulation with the AMS-02 detector on the International Space Station TEACHER NOTES DESCRIPTION In this activity, students explore whether solar activity impacts the flux of galactic cosmic
Lecture 6: Our star, the Sun
 Lecture 6: Our star, the Sun 1 Age = 4.6 x 10 9 years Mean Radius = 7.0x10 5 km = 1.1x10 2 R = 1R Volume = 1.4x10 18 km 3 = 1.3x10 6 R = 1V Mass = 2x10 30 kg = 3.3x10 5 M = 1M Surface Temperature = 5,778K
Chapter Introduction Lesson 1 The View from Earth Lesson 2 The Sun and Other Stars Lesson 3 Evolution of Stars Lesson 4 Galaxies and the Universe
 Chapter Introduction Lesson 1 The View from Earth Lesson 2 The Sun and Other Stars Lesson 3 Evolution of Stars Lesson 4 Galaxies and the Universe Chapter Wrap-Up What makes up the universe and how does
Chapter 14 Our Star A Closer Look at the Sun. Why was the Sun s energy source a major mystery?
 Chapter 14 Our Star 14.1 A Closer Look at the Sun Our goals for learning Why was the Sun s energy source a major mystery? Why does the Sun shine? What is the Sun s structure? Why was the Sun s energy source
Lecture Tutorial: Measuring the Frequency and Period of Sunspots
 Lecture Tutorial: Measuring the Frequency and Period of Sunspots Description: This data analysis activity requires students to analyze sunspots on NASA s SOHO coronagraph images to make meaning of cyclical
Our sole source of light and heat in the solar system. A very common star: a glowing g ball of gas held together by its own gravity and powered
 The Sun Visible Image of the Sun Our sole source of light and heat in the solar system A very common star: a glowing g ball of gas held together by its own gravity and powered by nuclear fusion at its
Living in a Star. Sarah Gibson (NCAR/HAO)
") Living in a Star Sarah Gibson (NCAR/HAO) 3D real-time astronomy Solar eruption (CME) Earth s magnetosphere We are observing a stellar system from within What we see may impact us in near-real time Unescapably
Living in a Star Sarah Gibson (NCAR/HAO) 3D real-time astronomy Solar eruption (CME) Earth s magnetosphere We are observing a stellar system from within What we see may impact us in near-real time Unescapably
The Sun sends the Earth:
 The Sun sends the Earth: Solar Radiation - peak wavelength.visible light - Travels at the speed of light..takes 8 minutes to reach Earth Solar Wind, Solar flares, and Coronal Mass Ejections of Plasma (ionized
Go to Click on the first animation: The north pole, observed from space
 IDS 102 The Seasons on a Planet like Earth As the Earth travels around the Sun, it moves in a giant circle 300 million kilometers across. (Well, it is actually a giant ellipse but the shape is so close
REFERENCE: The Blue Planet An Introduction to Earth System Science. Brian J. Skinner and Barbara W. Murck (2011) Third Edition. John Wiley and Sons
 Third Edition. John Wiley and Sons") REFERENCE: The Blue Planet An Introduction to Earth System Science. Brian J. Skinner and Barbara W. Murck (2011) Third Edition. John Wiley and Sons Inc. Energy is the capacity to do work, to move matter,
REFERENCE: The Blue Planet An Introduction to Earth System Science. Brian J. Skinner and Barbara W. Murck (2011) Third Edition. John Wiley and Sons Inc. Energy is the capacity to do work, to move matter,
Worksheet How are the stars we see at night related to the Sun? How are they different?
 Worksheet 4.1 1. Below is a drawing of a pair of sunspots on the surface of the Sun. Scientists have found that sunspots are like magnetic poles of a bar magnet. Draw what you predict the magnetic field
Chapter 8 The Sun Our Star
 Note that the following lectures include animations and PowerPoint effects such as fly ins and transitions that require you to be in PowerPoint's Slide Show mode (presentation mode). Chapter 8 The Sun
The General Properties of the Sun
 Notes: The General Properties of the Sun The sun is an average star with average brightness. It only looks bright because it s so close. It contains 99% of the mass of the solar system. It is made of entirely
Astronomy 210. Outline. Nuclear Reactions in the Sun. Neutrinos. Solar Observing due April 15 th HW 8 due on Friday.
 Astronomy 210 Outline This Class (Lecture 30): Solar Neutrinos Next Class: Stars: Physical Properties Solar Observing due April 15 th HW 8 due on Friday. The Sun Our closest star The Outer Layers of the
Prelab 4: Revolution of the Moons of Jupiter
 Name: Section: Date: Prelab 4: Revolution of the Moons of Jupiter Many of the parameters astronomers study cannot be directly measured; rather, they are inferred from properties or other observations of
10/17/ A Closer Look at the Sun. Chapter 11: Our Star. Why does the Sun shine? Lecture Outline
 Lecture Outline 11.1 A Closer Look at the Sun Chapter 11: Our Star Our goals for learning: Why does the Sun shine? What is the Sun's structure? Why does the Sun shine? Is it on FIRE? Is it on FIRE? Chemical
! The Sun as a star! Structure of the Sun! The Solar Cycle! Solar Activity! Solar Wind! Observing the Sun. The Sun & Solar Activity
 ! The Sun as a star! Structure of the Sun! The Solar Cycle! Solar Activity! Solar Wind! Observing the Sun The Sun & Solar Activity The Sun in Perspective Planck s Law for Black Body Radiation ν = c / λ
Long term data for Heliospheric science Nat Gopalswamy NASA Goddard Space Flight Center Greenbelt, MD 20771, USA
 Long term data for Heliospheric science Nat Gopalswamy NASA Goddard Space Flight Center Greenbelt, MD 20771, USA IAU340 1-day School, Saturday 24th February 2018 Jaipur India CMEs & their Consequences
MULTIPLE CHOICE. Choose the one alternative that best completes the statement or answers the question.
 Homework Ch 7, 8, 9 Name MULTIPLE CHOICE. Choose the one alternative that best completes the statement or answers the question. 1) Our most detailed knowledge of Uranus and Neptune comes from 1) A) the
A Closer Look at the Sun
 Our Star A Closer Look at the Sun Our goals for learning Why was the Sun s energy source a major mystery? Why does the Sun shine? What is the Sun s structure? Why was the Sun s energy source a major mystery?
The Sun. the main show in the solar system. 99.8% of the mass % of the energy. Homework due next time - will count best 5 of 6
 The Sun the main show in the solar system 99.8% of the mass 99.9999...% of the energy 2007 Pearson Education Inc., publishing as Pearson Addison-Wesley Homework due next time - will count best 5 of 6 The
Physical Science Context Lecture 2 The Earth and Sun's Magnetic Fields
 Physical Science Context Lecture 2 The Earth and Sun's Magnetic Fields The earth is a huge magnetic and close to its surface it can be approximated as a bar magnet (a magnetic dipole) that is positioned
The Sun: A Star of Our Own ASTR 2110 Sarazin
 The Sun: A Star of Our Own ASTR 2110 Sarazin Sarazin Travel Wednesday, September 19 afternoon Friday, September 21 Will miss class Friday, September 21 TA Molly Finn will be guest lecturer Cancel Office
10/18/ A Closer Look at the Sun. Chapter 11: Our Star. Why does the Sun shine? Lecture Outline
 10/18/17 Lecture Outline 11.1 A Closer Look at the Sun Chapter 11: Our Star Our goals for learning: Why does the Sun shine? What is the Sun's structure? Why does the Sun shine? Is it on FIRE? Is it on
Dear Teacher, Overview Page 1
 Dear Teacher, You are about to involve your students in one of the most exciting frontiers of science the search for other worlds and life in solar systems beyond our own! Using the MicroObservatory telescopes,
Correction to Homework
 Today: Chapter 10 Reading Next Week: Homework Due March 12 Midterm Exam: March 19 Correction to Homework #1: Diameter of eye: 2.5 cm #10: See Ch. 11 Office Hours Monday. 11AM -2 PM Help Sessions Available:
Astronomy Chapter 12 Review
 Astronomy Chapter 12 Review Approximately how massive is the Sun as compared to the Earth? A. 100 times B. 300 times C. 3000 times D. 300,000 times E. One million times Approximately how massive is the
Geomagnetic storms. Measurement and forecasting
 Geomagnetic storms. Measurement and forecasting Anna Gustavsson 17 October 2006 Project of the Space Physics Course 2006 Umeå University 1 Introduction Effects of magnetic storms on technology Geomagnetic
How the Sun Works. Presented by the
 How the Sun Works Presented by the The Sun warms our planet every day, provides the light by which we see and is absolutely necessary for life on Earth. In this presentation, we will examine the fascinating
COSMIC RAYS DAY INTRODUCTION TO COSMIC RAYS WINDWARD COMMUNITY COLLEGE - SEPTEMBER 26, 2015 VERONICA BINDI - UNIVERSITY OH HAWAII
 COSMIC RAYS DAY WINDWARD COMMUNITY COLLEGE - SEPTEMBER 26, 2015 VERONICA BINDI - UNIVERSITY OH HAWAII INTRODUCTION TO COSMIC RAYS MAJOR QUESTIONS: Are there forms of matter in the Universe that do not
Killer Skies. Homework 5 due Monday Night Observing continuing Last time: White Dwarf Today: Active Sun. Music: Invisible Sun Police
 Killer Skies Homework 5 due Monday Night Observing continuing Last time: White Dwarf Today: Active Sun Music: Invisible Sun Police 1 Night Observing Night Observing probably last week if you do it, need
Solar Activity The Solar Wind
 Solar Activity The Solar Wind The solar wind is a flow of particles away from the Sun. They pass Earth at speeds from 400 to 500 km/s. This wind sometimes gusts up to 1000 km/s. Leaves Sun at highest speeds
Astronomy 404 October 18, 2013
 Astronomy 404 October 18, 2013 Parker Wind Model Assumes an isothermal corona, simplified HSE Why does this model fail? Dynamic mass flow of particles from the corona, the system is not closed Re-write
This page intentionally left blank!
 This page intentionally left blank! Solar-Terrestrial Data Available on the k4msu.com Website The original title was going to be... Is KK4BKD a Spy Using k4msu.com to Send Secret Messages? Or, what else
Space Weather and Satellite System Interaction
 Space Engineering International Course, Kyutech, 4 th Quarter Semester 2017 Space Weather and Satellite System Interaction Lecture 2: Space Weather Concept, Reporting and Forecasting Assoc. Prof. Ir. Dr.
Chapter 14 Our Star Pearson Education, Inc.
 Chapter 14 Our Star Basic Types of Energy Kinetic (motion) Radiative (light) Potential (stored) Energy can change type, but cannot be created or destroyed. Thermal Energy: the collective kinetic energy
Earth Space Systems. Semester 1 Exam. Astronomy Vocabulary
 Earth Space Systems Semester 1 Exam Astronomy Vocabulary Astronomical Unit- Aurora- Big Bang- Black Hole- 1AU is the average distance between the Earth and the Sun (93 million miles). This unit of measurement
What s the longest single-shot exposure ever recorded of any object or area of space by Hubble?
 Hubblecast Episode 50: Q&A with Dr J 00:00 Have you ever wondered why Hubble can make detailed images of of galaxies, but stars appear as featureless blobs? What the most distant object ever observed is?