SHADOW FLICKER MODELING ANALYSIS
|
|
|
- Robyn Joseph
- 5 years ago
- Views:
Transcription
1 KENT HILLS 3: KENT HILLS WIND FARM EXPANSION PHASE 3 Appendix K Shadow Flicker Modeling Analysis SHADOW FLICKER MODELING ANALYSIS
2 KENT HILLS 3: KENT HILLS WIND FARM EXPANSION PHASE 3 Appendix K Shadow Flicker Modeling Analysis
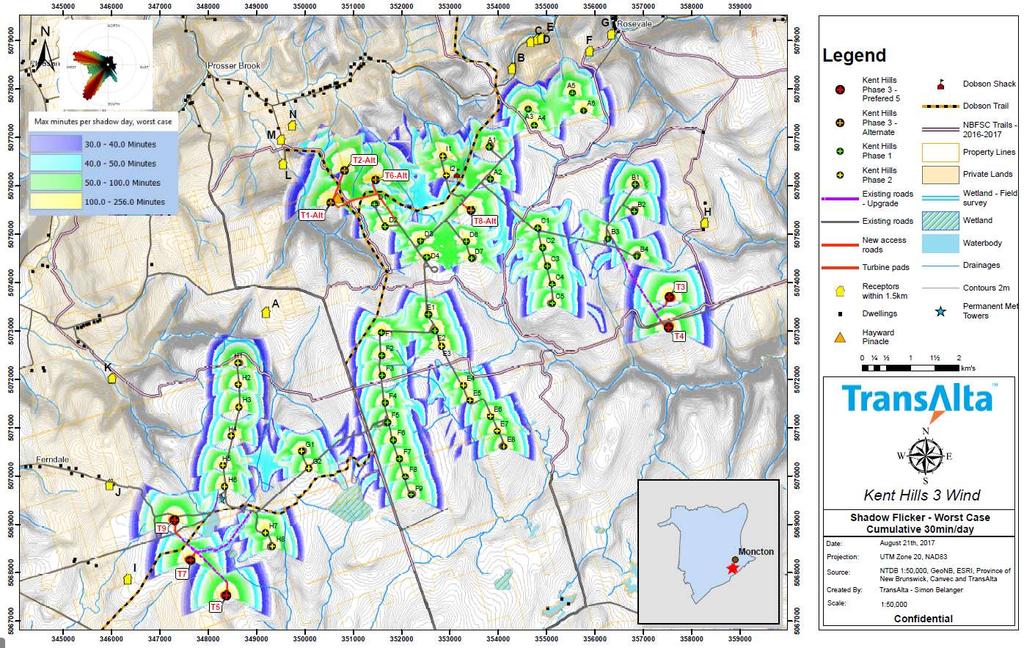
3 Shadow Flicker Analysis Kent Hills 3 Wind Project Date: September 5, 2017 Re: Shadow Flicker Analysis for the Proposed Kent Hills 3 Wind Project 1. Introduction and Project Background The modeling results presented in this report are based on the cumulative impact of the potential shadow flicker to occur at the Kent Hills 3 Wind Project (the Project) considering nine additional turbine locations (5 preferred, 4 alternate) and the existing 50 turbines already in operation from the previous two phases Kent Hills 1 (KH1) and Kent Hills 2 (KH2). Once constructed, the proposed Kent Hills 3 Project will consist of five Vestas V megawatt (MW) turbines with a 117 m hub-height, in addition to the existing 50 Vestas V90-3 MW wind turbines with 80 m hub height. The Project area can be described as a mix of hills and flat terrain covered by hardwood and conifer forest in varying stages of regrowth with a history of logging in the area. There is very little residential development in the Project area as the Project is situated on Crown land. Results from the previous shadow flicker impact assessments completed for the Kent Hills 1 and Kent Hills 2 wind farm phases suggest that maximum number of shadow hours were predicted below 30 hr/yr and 30 min/day at all adjacent known receptors (residences) within 1.5 km of the nearest wind turbine. Incorporating variables such as turbine location, receptor location, topography, rotor diameter, hub height and time zone information the model assumes a worst case scenario including the following conditions: the sun is fully shining all year (no clouds or fog), the rotor plane is perpendicular to the sun (biggest shadows), and the rotor is always turning (causing shadow movements) and no visual obstructions (trees, buildings). To date no shadow flicker complaints have been received by TransAlta in relation to the Kent Hills Wind Farm 1-2 (T. Kwas, pers. comm.) In this report, we will discuss considerations and results to our cumulative shadow flicker modeling of the Kent Hills 3 Project. 2. Shadow Flicker Modeling Shadow flicker caused by wind turbines is defined as alternating changes in light intensity due to Shadow Flicker Impact Assessment
4 the moving blade shadows cast on the ground and objects (including windows at residences). Shadow flicker is more prevalent when the sun is low in the sky at either sunrise or sunset and is less apt to occur during the spring and fall equinoxes (March 21 and September 21), and more likely during the summer and winter solstices (June 21 and December 21) when the sun is low in the sky. The shadow-flicker frequency is related to the rotor speed and number of blades on the rotor. The modeling results presented in this report are based on the respective wind turbine model parameters of each project phase which include blade length, hub height and nominal rotor speed (of less than 1 alternation per second). The modeling software used for this analysis is produced by EMD of Denmark and is part of the WindPro Version modeling software package. The following inputs are used for the simulation: Turbine locations Receptor locations (Adjacent residences within 1.5 km) Area topography map Area height contours Time zone and daylight saving time information Rotor diameter Hub height Receptor window 1 m x 1 m with the bottom edge 1.5 m above grade regardless of direction. To determine daylight hours at this specific site the software holds information about the earth s orbit and rotation relative to the sun and in relation to the Project area. It should be noted that the model intentionally overpredicts shadow flicker effects. Its calculations represent worst case scenarios regardless of typical real case conditions minimizing effects such as: The reduction of shadow flicker on calm or overcast days where there is insufficient sunlight to cast a shadow. The model presumes sun always shining from sunrise to sunset. The rotor orientation not always casting in direction of the dwellings. The model presumes the rotor is always oriented perpendicular to the dwellings (same direction as the sun) If there is a non-transparent obstacle between the receptor that would block the Page 2
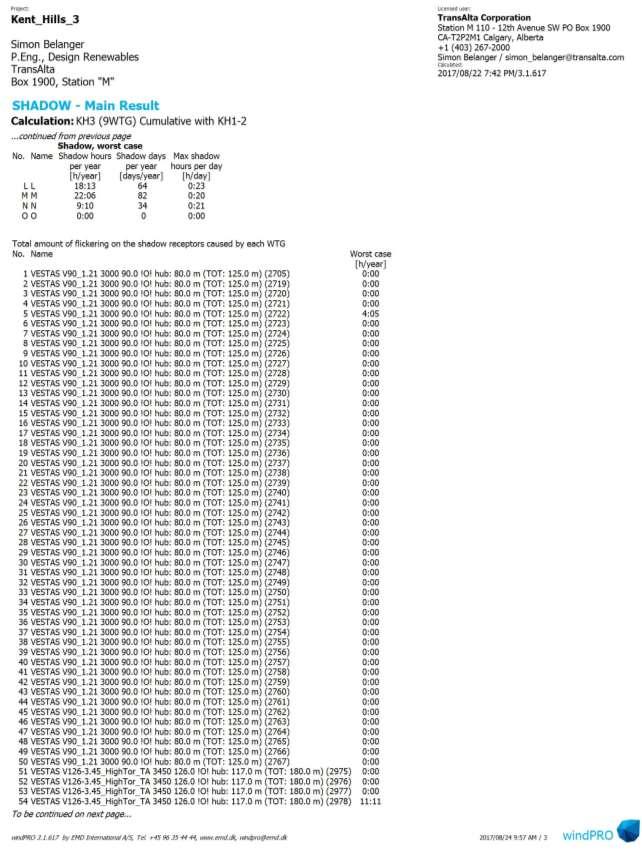
5 sunlight and any shadow impacts (e.g. trees, buildings) Statistics regarding wind conditions and number of hours with clear sky are not considered. The model presumes the turbines always running 3. Modeling Results Wind turbine names (T1 to T9 for the proposed KH3 project and A1 to I2 for the operating turbines at the KH1 and KH2 phases) and shadow-flicker receptors (A to O) have been named according to the attached Project layout maps (Appendix A). Only shadow-flicker receptors in the immediate vicinity of turbines have been included in the model, as those more distant buildings will not be affected. Shadow-flicker receptors to the north or south of wind turbines are not likely to receive shadow-flicker, because the cast shadow is very short in the north and south directions, as can be seen in the shape of the contour lines on the accompanying analysis. The model accounts for all of the adjacent dwellings (regardless of their status) within a 1.5 km range of a wind turbine. These dwellings were selected as they represent the potential worst case scenarios based on their locations relative to the proposed turbines. Presently best industry practices tend to consider the guideline for a maximum of 30 hours per year and 30 min par day as an acceptable threshold of shadow flicker impact using worst case scenarios (WEA-Schattenwurf-Hinweise, 2002). As a result of the cumulative shadow flicker impact from the addition of the 9 proposed turbine locations (5 preferred, 4 alternate) to the existing KH1 and KH2 wind farm; the maximum number of shadow hours cast per year at any receptor within the Kent Hills Wind Farm is at 22 hours (22 hours, 06 minutes) spread over 82 days during the year at Receptor M. Shadow hours is the sum of the durations of all daily occurrences of shadows being cast on the receptor during over the year. A shadow day is any day in which a shadow occurrence is cast on the receptor; the maximum number of shadow minutes per day are at Receptors I & L with 23 minutes. Shadow minutes is the maximum number of minutes for the day of the year a shadow occurrence is the longest of the year (May 6th at receptor I, February 12th & October 30th at Receptor L) The table below summarizes the results of the shadow flicker report calculations. The shadow flicker map can be found in Appendix A. The detailed results from the WindPro analysis are in Appendix B. Page 3
6 Table 1. Cumulative Shadow Flicker Results for Nearby Dwellings at the Kent Hills Wind Farm Receptor PID Max Shadow Hrs/Yr Max Shadow Days/Yr Max Shadow Mins/day A :00 0 0:00 B : :16 C :00 0 0:00 D :00 0 0:00 E :00 0 0:00 F :00 0 0:00 G :00 0 0:00 H :00 0 0:00 I : :23 J : :20 K :00 0 0:00 L : :23 M : :20 N : :21 O :00 0 0:00 4. Conclusion Shadow flicker impact at all dwellings modeled within 1.5 km of all existing and proposed wind turbines are well below generally accepted levels of 30 hours/year and 30 min/day based on a worst-case calculation. Therefore, cumulative shadow flicker from the proposed Kent Hills 3 wind farm, is not expected to cause any significant impact on adjacent receptors nor imply any expected mitigation measure to be required. 5. References WEA Schattenwurf Hinweise Hinweise zur Ermittlung und Beurteilung der optischen Immissionen von Windenergianlagen (Notes on the identification and assessment of the optical pollutions of Wind Turbines) Page 4

7 Shadow Flicker Impact Assessment Appendix A Shadow Flicker maps
8 Page 6
 Shadow Flicker Impact")
9 Appendix B Model results (WindPro) Shadow Flicker Impact Assessment

10 Page 8
11 Page 9
12 Page 10
13 SHADOW FLICKER Introduction Methodology
 Table of contents 13 SHADOW FLICKER... 13-1 13.1 Introduction... 13-1 13.2 Methodology... 13-1 13.2.1 Factors Influencing Shadow Flicker Occurrence... 13-2 13.2.2 Shadow Flicker Analysis Methodology...
Algonquin Power Co. Shadow Flicker Impact Assessment. Amherst Island Wind Project. For. H Rev. 2 February 26, 2013
 Algonquin Power Co. Shadow Flicker Impact Assessment For Amherst Island Wind Project H340642-0000-50-124-0001 Rev. 2 February 26, 2013 Algonquin Power Co. (on behalf of Windlectric Inc.) voluntarily authorized
Algonquin Power Co. Final Shadow Flicker Impact Assessment. Amherst Island Wind Project. For. H Rev. 3 November 28, 2013
 Algonquin Power Co. Final Shadow Flicker Impact Assessment For Amherst Island Wind Project H340642-0000-50-124-0001 Rev. 3 November 28, 2013 Algonquin Power Co. (on behalf of Windlectric Inc.) voluntarily
IV.B. VISUAL RESOURCES SHADE SHADOW
 IV.B. VISUAL RESOURCES SHADE SHADOW INTRODUCTION This section identifies and describes the visual characteristics of the Project site and surrounding area and evaluates the potential change in the existing
SHADOW FLICKER TURBINE LAYOUT 6A GULLEN RANGE WIND FARM GOLDWIND AUSTRALIA
 SHADOW FLICKER TURBINE LAYOUT 6A GULLEN RANGE WIND FARM GOLDWIND AUSTRALIA Document Control Status Written by Approved by Date Comment Revision A T.Lam D.Bolton 14/03/14 Initial Revision B T.Lam D.Bolton
SHADE/SHADOW REPORT. For the Proposed 8777 Washington Project. Culver City, CA. Prepared for:
 SHADE/SHADOW REPORT For the Proposed 8777 Washington Project Culver City, CA Prepared for: VITRUVIAN CULVER CITY LLC (THE APPLICANT) 5822 WEST WASHINGTON BOULEVARD CULVER CITY, CALIFORNIA 90232 Prepared
For most observers on Earth, the sun rises in the eastern
 632 CHAPTER 25: EARTH, SUN, AND SEASONS WHAT IS THE SUN S APPARENT PATH ACROSS THE SKY? For most observers on Earth, the sun rises in the eastern part of the sky. The sun reaches its greatest angular altitude
IV. ENVIRONMENTAL IMPACT ANALYSIS B. AESTHETICS SHADE/SHADOW
 IV. ENVIRONMENTAL IMPACT ANALYSIS B. AESTHETICS SHADE/SHADOW 1. INTRODUCTION Potential effects of the Proposed Project related to visual character, views and light/glare are addressed in Section IV.A,
Grade 6 Nature Walk: Volunteer Guide
 Grade 6 Nature Walk: Volunteer Guide On the first walk, students will mark out a 1x1 meter plot of land along the stream near the back playground. Each month, students will visit this plot and note conditions.
Page 1. Name:
 Name: 1) What is the primary reason New York State is warmer in July than in February? A) The altitude of the noon Sun is greater in February. B) The insolation in New York is greater in July. C) The Earth
Appendix I Shadow Flicker Report
 Appendix I Shadow Flicker Report Report Wind Turbine Shadow Flicker Analysis Update For McLean s Mountain Wind Farm Prepared for: Attention: Dillon Consulting Ltd. 235 Yorkland Blvd., Suite 800 Toronto,
Project No India Basin Shadow Study San Francisco, California, USA
 Project No. 432301 India Basin Shadow Study San Francisco, California, USA Numerical Modelling Studies 04 th June 2018 For Build Inc. Report Title: India Basin Shadow Study San Francisco, California, USA
APPENDIX B SHADOW STUDY
 APPENDIX B SHADOW STUDY Shadow Study Methodology and Analysis Douglas Avenue Multi-Family Residential Development Project Methodology Panorama evaluated for accuracy the building foot print data provided
SHADOW STUDY REPORT REGARDING
 SHADOW STUDY REPORT REGARDING an APPLICATION TO REDEVELOP Three 6 Storey Condominiums Regional Road 25 (Ontario Street) and Britannia Road Milton, Ontario KNYMH FILE # 17030 Prepared by: Krista Lilley
windpro Palovaara_Ahkiovaara WTG Shadow receptor-input
 DE-28217 Breen +49 7142 7781 6.4.216 9:57/3..651 Calculation: WE7, 17x V136 162 hub height, RC Assuptions for shadow calculations Maxiu distance for influence Calculate only when ore than 2 % of sun is
C) wavelength C) eastern horizon B) the angle of insolation is high B) increases, only D) thermosphere D) receive low-angle insolation
 wavelength C) eastern horizon B) the angle of insolation is high B) increases, only D) thermosphere D) receive low-angle insolation") 1. What is the basic difference between ultraviolet, visible, and infrared radiation? A) half-life B) temperature C) wavelength D) wave velocity 2. In New York State, the risk of sunburn is greatest between
1. What is the basic difference between ultraviolet, visible, and infrared radiation? A) half-life B) temperature C) wavelength D) wave velocity 2. In New York State, the risk of sunburn is greatest between
NAME; LAB # SEASONAL PATH OF THE SUN AND LATITUDE Hemisphere Model #3 at the Arctic Circle
 NAME; PERIOD; DATE; LAB # SEASONAL PATH OF THE SUN AND LATITUDE Hemisphere Model #3 at the Arctic Circle 1 OBJECTIVE Explain how latitude affects the seasonal path of the Sun. I) Path of the Sun and Latitude.
Student Exploration: Seasons in 3D
 Name: Date: Student Exploration: Seasons in 3D Vocabulary: axis, equinox, latitude, Northern Hemisphere, revolve, rotate, solar energy, solar intensity, Southern Hemisphere, summer solstice, winter solstice
MOTIONS OF THE EARTH. Figure 3.1 : Inclination of the Earth s axis and the orbital plane. Figure 3.2 : Day and Night on the Earth due to rotation
 3 Let s Do Take a ball to represent the earth and a lighted candle to represent the sun. Mark a point on the ball to represent a town X. Place the ball in such a way that the town X is in darkness. Now
Earth s Motion. Lesson Outline LESSON 1. A. Earth and the Sun 1. The diameter is more than 100 times greater than
 Lesson Outline Earth s Motion LESSON 1 A. Earth and the Sun 1. The diameter is more than 100 times greater than Earth s diameter. a. In the Sun, atoms combine during, producing huge amounts of energy.
Aim: What causes Seasons?
 Notepack 28 Aim: What causes Seasons? Do Now: What is the difference between revolution and rotation? Earth s rotation The Earth rotates on its axis (imaginary vertical line around which Earth spins) every
Practice Questions: Seasons #1
 1. Seasonal changes on Earth are primarily caused by the A) parallelism of the Sun's axis as the Sun revolves around Earth B) changes in distance between Earth and the Sun C) elliptical shape of Earth's
LAB 2: Earth Sun Relations
 LAB 2: Earth Sun Relations Name School The amount of solar energy striking the Earth s atmosphere is not uniform; distances, angles and seasons play a dominant role on this distribution of radiation. Needless
Practice Questions: Seasons #2
 1. How many degrees does the Sun appear to move across the sky in four hours? A) 60 B) 45 C) 15 D) 4 Practice Questions: Seasons #2 2. Base your answer to the following question on the diagram below, which
Earth & Space Science, Interpreting Data DURATION Preparation: 5 minutes Activity: 40 minutes (total over one day)
") Objectives In this activity students will: 1. Observe how the position of the sun in the sky changes during the course of the day 2. Discover the cardinal directions by tracking the motion of the sun Materials
Objectives In this activity students will: 1. Observe how the position of the sun in the sky changes during the course of the day 2. Discover the cardinal directions by tracking the motion of the sun Materials
Which graph best shows the relationship between intensity of insolation and position on the Earth's surface? A) B) C) D)
 B) C) D)") 1. The hottest climates on Earth are located near the Equator because this region A) is usually closest to the Sun B) reflects the greatest amount of insolation C) receives the most hours of daylight D)
1. The hottest climates on Earth are located near the Equator because this region A) is usually closest to the Sun B) reflects the greatest amount of insolation C) receives the most hours of daylight D)
Student Exploration: Seasons: Earth, Moon, and Sun
 Name: Date: Student Exploration: Seasons: Earth, Moon, and Sun Vocabulary: altitude, axis, azimuth, equinox, horizon, latitude, revolution, rotation, solstice Prior Knowledge Questions (Do these BEFORE
Which Earth latitude receives the greatest intensity of insolation when Earth is at the position shown in the diagram? A) 0 B) 23 N C) 55 N D) 90 N
 0 B) 23 N C) 55 N D) 90 N") 1. In which list are the forms of electromagnetic energy arranged in order from longest to shortest wavelengths? A) gamma rays, x-rays, ultraviolet rays, visible light B) radio waves, infrared rays, visible
1. In which list are the forms of electromagnetic energy arranged in order from longest to shortest wavelengths? A) gamma rays, x-rays, ultraviolet rays, visible light B) radio waves, infrared rays, visible
SHADOW - Main Result. windpro CUMULTATIEVE EFFECTEN SLAGSCHADUW HERENTALS. EDF Luminus Markiesstraat Brussel
 SHADOW - Main Result Assumptions for shadow calculations Maximum distance for influence Calculate only when more than 20 % of sun is covered by the blade Please look in WTG table Minimum sun height over
The Seasons. Presented by Kesler Science
 The Seasons Presented by Kesler Science Essential Questions: 1. What causes day and night? 2. What causes the seasons to change? Quick Action INB Template Rotation and Revolution 1. Cut out the template
Average Weather For Coeur d'alene, Idaho, USA
 Average Weather For Coeur d'alene, Idaho, USA Information courtesy of weatherspark.com Location This report describes the typical weather at the Coeur d'alene Air Terminal (Coeur d'alene, Idaho, United
1.4j interpret simple shadow stick data to determine local noon and observer s longitude
 1.4j interpret simple shadow stick data to determine local noon and observer s longitude There are many opportunities for making observations of shadows cast with a vertical stick and the Sun. Observations
Astronomy#2 - Notebook
 Name Test Date Hour Astronomy#2 - Notebook Planet Earth LEARNING TARGETS I can describe a sphere and give evidence used to prove Earth is spherical. I can explain the difference between rotation and revolution.
Chapter Introduction Lesson 1 Earth s Motion Lesson 2 Earth s Moon Lesson 3 Eclipses and Tides Chapter Wrap-Up. Jason Reed/Photodisc/Getty Images
 Chapter Introduction Lesson 1 Earth s Motion Lesson 2 Earth s Moon Lesson 3 Eclipses and Tides Chapter Wrap-Up Jason Reed/Photodisc/Getty Images What natural phenomena do the motions of Earth and the Moon
Laboratory Exercise #7 - Introduction to Atmospheric Science: The Seasons
 Laboratory Exercise #7 - Introduction to Atmospheric Science: The Seasons page - 1 Section A - Introduction: This lab consists of both computer-based and noncomputer-based questions dealing with atmospheric
SUBJECT : GEOGRAPHY ROTATION AND REVOLUTION This paper consists of 5 printed pages.
 SUBJECT : GEOGRAPHY ROTATION AND REVOLUTION 2017-2018 This paper consists of 5 printed pages. 1. Name the motions of the earth. A. They are Rotation and Revolution. 2. What is Rotation? A. Rotation is
SOLAR ENERGY: THAT S HOT Grades 4-6
 NJCCCS: 5.1, 5.2, 5.4 SOLAR ENERGY: THAT S HOT Grades 4-6 Field Trip Overview: This program illuminates the various ways in which our nearest star affects life on Earth. Students will learn about the apparent
LESSON PLAN - Optimum Orientation of Solar Panels Using Soltrex Data
 LESSON PLAN - Optimum Orientation of Solar Panels Using Soltrex Data Title of Lesson: Optimum Orientation of Solar Panels Using Soltrex Data Description of class: High School physics, astronomy, or environmental
Geography Class 6 Chapters 3 and
 CHAPTER 3 MOTIONS OF THE EARTH The Earth is always travelling in Space. That makes each person on Earth, a Space Traveller. No one feels the movement of the Earth because humans are too tiny when compared
March 21. Observer located at 42 N. Horizon
 March 21 Sun Observer located at 42 N Horizon 48 June 21 March 21 A 48 90 S 23.5 S 0 23.5 N 42 N 90 N Equator (June 21) C (March 21) B A 71.5 48 Horizon 24.5 Observer Sun 40 Observer Sun 22 Observer Sun
C) D) 2. The diagram below shows a large pendulum in motion over an 8-hour period.
 D) 2. The diagram below shows a large pendulum in motion over an 8-hour period.") 1. An observer on Earth measured the apparent diameter of the Sun over a period of 2 years. Which graph best represents the Sun's apparent diameter during the 2 years? A) B) C) D) 2. The diagram below
1. An observer on Earth measured the apparent diameter of the Sun over a period of 2 years. Which graph best represents the Sun's apparent diameter during the 2 years? A) B) C) D) 2. The diagram below
Earth-Sun Relationships. The Reasons for the Seasons
 Earth-Sun Relationships The Reasons for the Seasons Solar Radiation The earth intercepts less than one two-billionth of the energy given off by the sun. However, the radiation is sufficient to provide
Viewed from Earth's north pole, the rotation of Earth and its moon are counter-clockwise.!
 The Earth rotates around once in 24 hours The time it takes for the Earth to rotate completely around once is what we call a day. It's Earth's rotation that gives us night and day. Viewed from Earth's
C) the seasonal changes in constellations viewed in the night sky D) The duration of insolation will increase and the temperature will increase.
 the seasonal changes in constellations viewed in the night sky D) The duration of insolation will increase and the temperature will increase.") 1. Which event is a direct result of Earth's revolution? A) the apparent deflection of winds B) the changing of the Moon phases C) the seasonal changes in constellations viewed in the night sky D) the
1. Which event is a direct result of Earth's revolution? A) the apparent deflection of winds B) the changing of the Moon phases C) the seasonal changes in constellations viewed in the night sky D) the
Grade 6 Standard 2 Unit Test Astronomy
 Grade 6 Standard 2 Unit Test Astronomy Multiple Choice 1. Why does the air temperature rise in the summer? A. We are closer to the sun. B. The air becomes thicker and more dense. C. The sun s rays are
Earth Motions Packet 14
 Earth Motions Packet 14 Your Name Group Members Score Minutes Standard 4 Key Idea 1 Performance Indicator 1.1 Explain complex phenomena, such as tides, variations in day length, solar insolation, apparent
November 20, NOTES ES Rotation, Rev, Tilt.notebook. vertically. night. night. counterclockwise. counterclockwise. East. Foucault.
 NOTES ES, Rev,.notebook, and Rotates on an imaginary axis that runs from the to the South North Pole Pole vertically North The of the axis points to a point in space near day Pole Polaris night Responsible
5.6.2 SHADOW / DAYLIGHT ASSESSMENT
 ENVIRONMENTAL IMPACT STATEMENT 5.6.2 SHADOW / DAYLIGHT ASSESSMENT 5.6.2.1 Introduction As part of the Environmental Impact Study (EIS) required for the planning submission for the proposed 120 bed wing
Motions of the Earth
 Motions of the Earth Our goals for learning: What are the main motions of the Earth in space? How do we see these motions on the ground? How does it affect our lives? How does the orientation of Earth's
L.O: EARTH'S 23.5 DEGREE TILT ON ITS AXIS GIVES EARTH ITS SEASONS March 21 (SPRING), June 21(SUMMER), Sept 22 (AUTUMN) & Dec 21(WINTER)
, June 21(SUMMER), Sept 22 (AUTUMN) & Dec 21(WINTER)") L.O: EARTH'S 23.5 DEGREE TILT ON ITS AXIS GIVES EARTH ITS SEASONS March 21 (SPRING), June 21(SUMMER), Sept 22 (AUTUMN) & Dec 21(WINTER) 1. The apparent daily path of the Sun changes with the seasons because
L.O: EARTH'S 23.5 DEGREE TILT ON ITS AXIS GIVES EARTH ITS SEASONS March 21 (SPRING), June 21(SUMMER), Sept 22 (AUTUMN) & Dec 21(WINTER) 1. The apparent daily path of the Sun changes with the seasons because
225 Bush Street Suite 1700 San Francisco, CA phone fax
 225 Bush Street Suite 1700 San Francisco, CA 94104 415.896.5900 phone 415.896.0332 fax www.esassoc.com memorandum date July 29, 2009 to from subject Craig Nikitas, San Francisco Planning Department Daniel
Fall equinox levels the sunlight playing field all around the world
 Fall equinox levels the sunlight playing field all around the world By Washington Post, adapted by Newsela staff on 09.28.17 Word Count 719 Level 950L Sunset over the southern part of the Atlantic Ocean.
Sun Inclinometer. Curriculum Levels 3-4 Maths. Activity Description
 Sun Inclinometer Curriculum Levels 3-4 Maths Activity Description Students will transform a protractor into an accurate and reliable instrument that measures the angle of the sun and by taking multiple
SHADOW STUDY REPORT REGARDING an APPLICATION TO REDEVELOP 6 Storey Condominium Louis Saint Laurent Ave & Leger Way Milton, Ontario
 SHADOW STUDY REPORT REGARDING an APPLICATION TO REDEVELOP 6 Storey Condominium Louis Saint Laurent Ave & Leger Way Milton, Ontario KNY FILE # 15145 Prepared by: Brad Ferguson & Wayne Harrison KNYMH INC.
Tools of Astronomy Tools of Astronomy
 Tools of Astronomy Tools of Astronomy The light that comes to Earth from distant objects is the best tool that astronomers can use to learn about the universe. In most cases, there is no other way to study
Attachment E: CADP Design Shadow Analysis
 Attachment E: CADP Design Shadow Analysis June 6, 2016 TO: Don Lewis San Francisco Planning Department 1650 Mission Street, Suite 400 San Francisco, CA 94103 SUBJECT: 2060 Folsom Street 17 th & Folsom
4.A.3 SHADE/SHADOW 1. INTRODUCTION. 2. ENVIRONMENTAL SETTING a. Existing Conditions. (1) Project Vicinity 4.A.3 1
 Project Vicinity 4.A.3 1") 4.A.3 SHADE/SHADOW 1. INTRODUCTION This section describes the potential for the Project to result in shade/shadow impacts. New construction has the potential to block sunlight from land uses that are sensitive
4.A.3 SHADE/SHADOW 1. INTRODUCTION This section describes the potential for the Project to result in shade/shadow impacts. New construction has the potential to block sunlight from land uses that are sensitive
5. In which diagram is the observer experiencing the greatest intensity of insolation? A) B)
 B)") 1. Which factor has the greatest influence on the number of daylight hours that a particular Earth surface location receives? A) longitude B) latitude C) diameter of Earth D) distance from the Sun 2. In
1. Which factor has the greatest influence on the number of daylight hours that a particular Earth surface location receives? A) longitude B) latitude C) diameter of Earth D) distance from the Sun 2. In
ME 476 Solar Energy UNIT THREE SOLAR RADIATION
 ME 476 Solar Energy UNIT THREE SOLAR RADIATION Unit Outline 2 What is the sun? Radiation from the sun Factors affecting solar radiation Atmospheric effects Solar radiation intensity Air mass Seasonal variations
Chapter 1 Image Slides. Copyright The McGraw-Hill Companies, Inc. Permission required for reproduction or display.
 Chapter 1 Image Slides Copyright The McGraw-Hill Companies, Inc. Permission required for reproduction or display. CH. 1: CYCLES OF THE SKY CO a 1.1 The Celestial Sphere CO b The nearest star to us is about
Meteorology Pretest on Chapter 2
 Meteorology Pretest on Chapter 2 MULTIPLE CHOICE 1. The earth emits terrestrial radiation a) only at night b) all the time c) only during winter d) only over the continents 2. If an imbalance occurs between
MiSP Astronomy Seasons Worksheet #1 L1
 MiSP Astronomy Seasons Worksheet #1 L1 Name Date CHANGING HOURS OF DAYLIGHT ON LONG ISLAND Introduction You sometimes hear people say, Days are longer in the summer and shorter in the winter. That is a
1. Which continents are experiencing daytime? 2. Which continents are experiencing nighttime?
 Name: Section: Astronomy 101: Seasons Lab Objective: When you have completed this lab, you will be able to describe the seasons of the year and explain the reasons for those seasons. Answer the questions
1. The frequency of an electromagnetic wave is proportional to its wavelength. a. directly *b. inversely
 CHAPTER 3 SOLAR AND TERRESTRIAL RADIATION MULTIPLE CHOICE QUESTIONS 1. The frequency of an electromagnetic wave is proportional to its wavelength. a. directly *b. inversely 2. is the distance between successive
Seasons. What causes the seasons?
 Questions: Seasons What causes the seasons? How do we mark the progression of the seasons? What is the seasonal motion of the sun in the sky? What could cause the seasonal motion of the sun to change over
Field Activitie< for Chapter 5 The Cycle of the Sun
 for Chapter 5 The Cycle of the Sun N.B.: Many of these activities include making observations and recording data in tables over the same span of months. Therefore, review these activities before starting
IMPROVING LIGHT PENETRATION FOR GOLF GREENS Scott Robinson ArborCom Technologies Halifax, Nova Scotia
 IMPROVING LIGHT PENETRATION FOR GOLF GREENS Scott Robinson ArborCom Technologies Halifax, Nova Scotia SEASONAL SUN ANGLE CHANGES Definitions Summer Solstice Sun rises and sets farthest away from south
LAB: What Events Mark the Beginning of Each Season?
 Name: Date: LAB: What Events Mark the Beginning of Each Season? The relationship between the Sun and Earth have been used since antiquity to measure time. The day is measured by the passage of the Sun
Motion of the Sun. motion relative to the horizon. rises in the east, sets in the west on a daily basis. Basis for the unit of time, the DAY
 Motion of the Sun motion relative to the horizon rises in the east, sets in the west on a daily basis Basis for the unit of time, the DAY noon: highest point of Sun in sky relative to the horizon 1 altitude:
Astronomy 101 Lab: Seasons
 Name: Astronomy 101 Lab: Seasons Pre-Lab Assignment: In class, we've talked about the cause of the seasons. In this lab, you will use globes to study the relative positions of Earth and the Sun during
Chapter 6. Solar Geometry. Contents
 Chapter 6. Solar Geometry Contents 6.1 Introduction 6.2 The Sun 6.3 Elliptical Orbit 6.4 Tilt of the Earth s Axis 6.5 Consequences of the Altitude Angle 6.6 Winter 6.7 The Sun Revolves Around the Earth!
core temperature: more than surface Definition of revolution How long it takes Earth to make one revolution around the Sun
 Lesson 1 Earth s Motion kim Lesson 1 in your book. Read the headings and look at the photos and illustrations. Write three things you want to learn more about as you read the lesson. Write your ideas in
Laboratory Exercise #7 - Introduction to Atmospheric Science: The Seasons and Daily Weather
 Laboratory Exercise #7 - Introduction to Atmospheric Science: The Seasons and Daily Weather page - Section A - Introduction: This lab consists of questions dealing with atmospheric science. We beginning
The Sun-Earth-Moon System
 CHAPTER 20 The un-earth-moon ystem LEO 1 Earth s Motion What do you think? Read the two statements below and decide whether you agree or disagree with them. Place an A in the Before column if you agree
How to evaluate daylight. Initiated by the VELUX Group
 Initiated by the VELUX Group Daylight in buildings Daylight in buildings is composed of a mix direct sunlight, diffuse skylight, and light reflected from the ground and surrounding elements. Direct sunlight
The Sun-Earth-Moon System
 chapter 311 section 1 Earth The Sun-Earth-Moon System Before You Read What do you already know about Earth s shape, its size, and how it moves? Write what you know on the lines below. What You ll Learn
Earth Science Seasons Test Name Per Date
 Name Per Date Page 1 1. The diagram below represents four positions of the Earth as it revolves around the Sun. 5. Base your answer to the following question on the diagram below, which shows the apparent
Earth rotates on a tilted axis and orbits the Sun.
 Page of 7 KY CONCPT arth rotates on a tilted axis and orbits the Sun. BFOR, you learned Stars seem to rise, cross the sky, and set because arth turns The Sun is very large and far from arth arth orbits
October 16, Dear Mr. Hawkins:
 IBI GROUP 101 410 Albert Street Waterloo ON N2L 3V3 Canada tel 519 585 2255 fax 519 585 2269 October 16, 2017 Mr. Trevor Hawkins Manager of Applications and Implementation Integrated Planning and Public
2.2 The Reason for Seasons
 2.2 The Reason for Seasons Our goals for learning: What causes the seasons? How does the orientation of Earth's axis change with time? Thought Question TRUE OR FALSE? Earth is closer to the Sun in summer
DO NOW HW due Friday; Quiz Wed
 DO NOW HW due Friday; Quiz Wed 1. Draw out a solar eclipse. Write out what a solar eclipse is. 2. Draw out a lunar eclipse. Write out what a lunar eclipse is. 3. Which number moon would give us a solar
Seasonal Path of the Sun and Latitude
 Seasonal Path of the Sun and Latitude Overview This lesson is a modification of what Dave Hess and I, Stan Skotnicki, use in our Earth Science classes at Cheektowaga Central High School. It is an extension
THE EARTH. Some animals and plants live in water. Many animals, plants and human beings live on land.
 THE EARTH The Earth is our planet. It is round and it looks blue from space. The Earth has everything that living beings need: air, water, and heat and light from the Sun. On our planet there is water,
The celestial sphere, the coordinates system, seasons, phases of the moon and eclipses. Chapters 2 and S1
 The celestial sphere, the coordinates system, seasons, phases of the moon and eclipses Chapters 2 and S1 The celestial sphere and the coordinates system Chapter S1 How to find our way in the sky? Let s
Seasons Page 520. A. What Causes Seasons?
 Seasons Page 520 A. What Causes Seasons? 1. Seasons are caused by the tilt of the earth s axis as it moves around the sun. 2. Seasons happen because the Earth is tilted on its axis at a 23.5 angle. 3.
MiSP Astronomy - Seasons Worksheet #1 L2
 MiSP Astronomy - Seasons Worksheet #1 L2 Name Date Changing Hours of Daylight on Long Island (L 1, 2, 3) Introduction You sometimes hear people say, Days are longer in the summer and shorter in the winter.
The Earth Orbits the Sun Student Question Sheet (Advanced)
") The Earth Orbits the Sun Student Question Sheet (Advanced) Author: Sarah Roberts - Faulkes Telescope Project Introduction This worksheet contains questions and activities which will test your knowledge
The Earth Orbits the Sun Student Question Sheet (Advanced) Author: Sarah Roberts - Faulkes Telescope Project Introduction This worksheet contains questions and activities which will test your knowledge
A. the spinning of Earth on its axis B. the path of the Sun around Earth
 stronomy 1 Packet Write answers on your own paper 1. The Sun appears to move across the sky each day. What causes this?. the spinning of Earth on its axis. the path of the Sun around Earth. the production
Celestial Sphere. Altitude [of a celestial object] Zenith. Meridian. Celestial Equator
![Celestial Sphere. Altitude [of a celestial object] Zenith. Meridian. Celestial Equator](/thumbs/83/88077665.jpg "Celestial Sphere. Altitude [of a celestial object] Zenith. Meridian. Celestial Equator") Earth Science Regents Interactive Path of the Sun University of Nebraska Resources Copyright 2011 by Z. Miller Name Period COMPANION WEBSITES: http://www.analemma.com/ http://www.stellarium.org/ INTRODUCTION:
Earth Science Regents Interactive Path of the Sun University of Nebraska Resources Copyright 2011 by Z. Miller Name Period COMPANION WEBSITES: http://www.analemma.com/ http://www.stellarium.org/ INTRODUCTION:
What causes the seasons? 2/11/09
 2/11/09 We can recognize solstices and equinoxes by Sun s path across sky: Summer solstice: Highest path, rise and set at most extreme north of due east. Winter solstice: Lowest path, rise and set at most
How to evaluate the best position for a new dial by means of the Orologi Solari program
 How to evaluate the best position for a new dial by means of the Orologi Solari program In order to evaluate the position of a new dial the lighting conditions of the wall must be taken into account. The
STANDARD. S6E1 d. Explain the motion of objects in the day/night sky in terms of relative position.
 STANDARD S6E1 d. Explain the motion of objects in the day/night sky in terms of relative position. S6E2 b. Explain the alignment of the earth, moon, and sun during solar and lunar eclipses. c. Relate the
Seasons Quiz Please Do Not Write on this Paper Obrigado
 Seasons Quiz Please Do Not Write on this Paper Obrigado Use this diagram of the sun and Earth's path around the sun to answer the next two questions. The N indicates North and Earth is traveling from A
Seasons ASTR 101 2/12/2018
 Seasons ASTR 101 2/12/2018 1 What causes the seasons? Perihelion: closest to Sun around January 4 th Northern Summer Southern Winter 147 million km 152 million km Aphelion (farthest to Sun) around July
THE EARTH AND ITS REPRESENTATION
 UNIT 7 THE EARTH AND ITS REPRESENTATION TABLE OF CONTENTS 1 THE EARTH AND THE SOLAR SYSTEM... 2 2 THE EARTH S MOVEMENTS... 2 2.1 Rotation.... 2 2.2 The revolution of the Earth: seasons of the year....
The following terms are some of the vocabulary that students should be familiar with in order to fully master this lesson.
 Lesson 211: EARTH'S SEASONS Students learn the complex geometry and planetary motions that cause Earth to have four distinct seasons. Fundamental Questions Attempting to give thorough and reasonable answers
5 - Seasons. Figure 1 shows two pictures of the Sun taken six months apart with the same camera, at the same time of the day, from the same location.
 ASTR 110L 5 - Seasons Purpose: To plot the distance of the Earth from the Sun over one year and to use the celestial sphere to understand the cause of the seasons. What do you think? Write answers to questions
L.O: THE ANGLE OF INSOLATION ANGLE INSOLATION: THE ANGLE SUNLIGHT HITS THE EARTH
 L.O: THE ANGLE OF INSOLATION ANGLE INSOLATION: THE ANGLE SUNLIGHT HITS THE EARTH 1. The graph below shows air temperatures on a clear summer day from 7 a.m. to 12 noon at two locations, one in Florida
Daylight Data: Days and Nights Around the World
 Days & Nights 1 Name Daylight Data: Days and Nights Around the World Purpose: To investigate the number of hours of daylight received by countries at different latitudes. Materials: Daylight data sheet
The Celestial Sphere. Chapter 1. Constellations. Models and Science. Constellations. Diurnal vs. Annular Motion 9/16/2010
 The Celestial Sphere Chapter 1 Cycles of the Sky Vast distances to stars prevent us from sensing their true 3-D arrangement Naked eye observations treat all stars at the same distance, on a giant celestial