Gan Magnetic Observatory Annual Report
|
|
|
- Jason Summers
- 5 years ago
- Views:
Transcription


1 Gan Magnetic Observatory Maldive Islands South Indian Ocean 2013 Annual Report Aerial view of the island of Gan, the observatory is located below the runway approximately at its midpoint 1
2 List of Contents 1 Introduction Description of the observatory... 1 Gan Observatory (IAGA code: GAN) Instrumentation... 3 Block diagram of system Data Processing... 5 Checks on calculation of Annual Mean Values Annual Means Operational Diary Statistics on Gan Observatory Data Recorded Baselines Plots of daily magnetograms Gan Magnetograms January February March April May June July August September October November December Participants in Gan Observatory operation Acknowledgements Publications References i

3 1 Introduction This bulletin is a report of the measurements and operations carried out between 1 January and 31 December 2013 at the geomagnetic observatory on the island of Gan in the south Indian Ocean. Gan Observatory was installed by the Institut für Geophysik, ETH Zürich, Switzerland in April Day to day operation of the observatory is the responsibility of the local Meteorological Office staff who also carry out a regular program of absolute observations. The recorded data are automatically transmitted to a database in Zurich and also to the INTERMAGNET Geomagnetic Information Node (GIN) operated by the British Geological Survey (BGS) in Edinburgh, Scotland. All data processing and quality control procedures are carried out by suitably qualified personnel based at various locations in Europe. During 2013 Gan Observatory became a full member of INTERMAGNET. An on-line display of the Gan data can be found at 2 Description of the observatory The island of Gan is the most southerly island of the Maldive Islands and lies in the Indian Ocean almost 1 degree south of the equator. It is a coral atoll and part of the Addu Atol group of islands. The island is the second largest island of the atoll, after Hithadoo and measures square kilometres (0.87 sq mi) in area. During WWII, Gan Island was developed as an airbase for the Royal Air Force who used it as a refuelling point for flights between the UK and the Far East. The observatory in located on the west side of the main runway and comprises 3 weatherproof shelters for the instruments and a hut used for absolute observations. Equipment Housing. Magnetometers and Control Electronics in waterproof boxes, Left to right, Control Electronics, Proton magnetometer, Fluxgate magnetometer
4 Gan Observatory (IAGA code: GAN) Location: Latitude : Gan International Airport, Addu Atoll, Maldives 00 41'40.55" S Longitude : 73 09'13.47" E, Altitude: 3 m Local contact: Muslim Ahmed Regional Meteorological Office, Maldives Meteorological Service Gan Addu City Maldives Telephone: E_mail: ahmedmuslim@hotmail.com Zurich, Switzerland contact: Prof. Andrew Jackson Institut fur Geophysik, Sonneggstrasse 5 CH-8092, Zurich Switzerland Telephone: E_Mail: ajackson@ethz.ch
 along with temperatures in the sensor head and fluxgate electronics.")
5 3 Instrumentation The instruments include a DMI Suspended FGE, 3 component fluxgate magnetometer measuring variations in the horizontal (H) and vertical (Z) intensities and the changes in the declination (D) along with temperatures in the sensor head and fluxgate electronics. Total Field (F) is measured by a GEM Systems GSM 90F1 proton magnetometer which also supports a GPS receiver used to provide accurate timing control for the data sampling and logging. All magnetic components are sampled once a second with magnetometer sampling, data storage and systems housekeeping controlled by a low powered UNIX based PC which operates from a battery backed 12 Volt DC supply deriving its power from a bank of solar cells. As well as storing the data locally a transmission link provides communication between the observatory and the local Meteorological Office in Gan Airport. At this office Internet facilities are available to transmit all recorded data to Zurich where an on-line display and database has been set up ( The observatory is completely self-contained with all power provided by the battery backed solar panels which will support operations for over a week in the event of no solar charge. Gan Observatory Equipment Solar panels used to charge the two 225 AH sealed lead acid batteries.


6 Block diagram of system DMI triaxial suspended fluxgate magnetometer with the protective fibreglass waterproof removed. Power box showing the solar regulator and two, 6 Volt 225 AH batteries.
.")
7 4 Data Processing Throughout 2013 systems on Gan automatically updated the archive computer at ETH, Zurich several times a day. These data were then retrieved and checked, magnetograms plotted and baselines calculated using the GDASView software, (Turbitt, In Press). The daily processing also included a visual check for intermittent, man-made, spikes which were then edited out using the GDASView software. Once the quality control checks were completed the data were uploaded to the BGS Geomagnetic Information Node (GIN) in Edinburgh and the daily magnetograms for the monthly bulletins plotted. Shown left is a typical magnetogram of the daily variations measured at Gan. The fluxgate data, vertical (Z, blue), horizontal (H, red) and declination (D, green) along with total field (F, pink) calculated from the fluxgate H and Z variations are displayed in the upper 4 traces. The total field (F, orange) measured by the proton magnetometer and the difference between F calculated from the fluxgate and F measured by the proton (bottom plot, yellow) are displayed in the lower two traces. These plots gives an excellent indication that both the fluxgate and the proton are operating correctly. In November, following the successful application by Gan Observatory for membership to INTERMAGNET and also the requirement to provide more timely data, following the successful launch of the SWARM satellites, the data processing procedures were revised. These included, an hourly transmission of the Gan data to the Edinburgh GIN providing an on-line provisional data set and at monthly intervals, once baselines had been established, the generation and transmission to the GIN of quasi-definitive observatory data in IAGA 2002 format. Using GDASView in processing Gan data has greatly simplified the data processing and the support of BGS,Edinburgh is acknowledged in providing regular upgrades to this product.

8 Currently a database of all Gan data is maintained on the ETH, Zurich database Data Structure on ETH, Zurich Database The files in the directories, shown above, contain 3 component fluxgate (H D Z) and proton variometer data in a variety of formats and sampling rates from the 1 second recorded data to the baseline corrected, definitive data of minute and annual means in IAGA 2002 format. Gan system housekeeping data, including, temperature, humidity, solar panel, battery and load voltages is also stored along with all absolute observations and baseline data. The Edinburgh GIN database contains day files of Gan minute mean data in INTERMAGNET format. Note: All access to Gan data in both the ETH and BGS databases is password protected. Checks on calculation of Annual Mean Values As a check against the GDASView software and to confirm that the baselines were correctly applied and Annual Means correctly calculated a program to calculate the daily mean from baseline corrected IAGA 2002 format data was written. Using this software the daily mean value for every day in 2013 was calculated and plotted along with selected absolute observations and the Annual Mean calculated by GDASView. Shown below are the results obtained from this comparison. The plots indicate that the absolute spot observation values agree and follow the trend of the daily means and the Annual Mean (yellow triangle) calculated by GDASView is in good agreement with the midpoint of the daily mean plots.
9 37800 H Component Daily Mean Abs Obs Annual Mean Jan Apr Jul Oct Feb-14 D Component Jan Apr Jul Oct Feb Daily Mean Abs Obs Annual Mean -280
10 40200 Total Field Daily Mean Abs Obs Annual Mean Jan Apr Jul Oct Feb Z Component Jan Apr Jul Oct Feb Daily Mean Abs Obs Annual Mean
11 Annual Mean (Degrees) Rate of Change (Minutes) 5 Annual Means Since the observatory was installed in April 2011 Annual Mean values of all components have been calculated from the baseline corrected minute mean values. In 2011, as the observatory had not been operating for a full year, the Annual Mean was estimated from the baseline corrected daily mean using a linear interpolation at For 2012 and 2013, GDASView software has been used to calculate Annual Mean values, the results are shown in the table below. GAN COLATITUDE LONGITUDE ELEVATION 2m YEAR D I H X Y Z F Deg Min Deg Min nt nt nt nt nt Gan Declination Annual Change Annual Mean Rate of Change
12 Annual Mean (Degrees) Rate of Change (nt) Annual Mean (Degrees) Rate of Chanhe (Minutes) Gan Inclination Annual Change Annual Mean Rate of Change Gan Total Field Annual Change Annual Mean Rate of Change
13 Annual Mean (nt) Rate of Change (nt) Annual Mean (nt) Rate of Change (nt) Gan Horizontal Component Annual Change Annual Mean Rate of Change Gan Vertical Component Annual Change Annual Mean Rate of Change
14 6 Operational Diary The following details are taken from the Gan Observatory Monthly Bulletins. This summary gives details of any site changes and operational problems experienced during January 2013 Throughout the month problems continued with the WiFi link between the observatory and the Meteorological Office. On 16 January 2013 the fluxgate magnetometer was replaced. Original fluxgate in operation from May 2011 to 16 January 2013 Fluxgate S0331, Electronics E0398 Scale values X nt/v Y nt/v Z nt/v Replacement fluxgate in operation from 17 January 2013 Fluxgate S0375, Electronics E0475 Scale values X nt/v Y nt/v Z nt/v The replacement of the fluxgate was necessary as over the preceeding 6 months comparisons between the fluxgate and the proton indicated that the fluxgate was becoming increasingly unstable, possibly due to a build up of moisture in the triaxial head. February 2013 During this month problems were experienced with both the WiFi link and the data logging PC, these resulted in considerable data losses. On 25 February the site was visited by members of ETH, Zurich staff and the communications and interfacing problems resolved. A new WiFi antenna was installed under the roof of the electronics hut. The proton interface, USB-RS232 converter was replaced and the USB hub (which was used to connect all instruments (except the Overhauser proton magnetometer) to the USB port on the master motherboard was replaced, unfortunately this did not solve the proton interface problems so finally the data logging the master motherboard was also replaced.
15 March 2013 all systems operated well and no problems were noted, absolute observations made during the month indicate that the replacement fluxgate is producing stable results. April 2013 all systems operated well and no problems were noted.. May all systems operated well and no problems were noted..intermittent communication problems between Gan ant ETHz were experienced June all systems operated well and no problems were noted. July 2013 Disk capacity problems resulted in the loss of 3 days data, 19, 20 and 21 July. August 2013 Throughout the month no problems were experienced with the observatory hardware and no data lost. On several days communication problems were experienced between Gan and ETHz. September Throughout the month no problems were experienced with the observatory hardware and no data were lost. Ibrahim Ziyad began training in making absolute observations and to date has made excellent progress. October Throughout the month no problems were experienced with the observatory hardware and no data were lost. Routine operations and the absolute observation program are now the responsibility of Ibrahim Ziyad. The application to join INTERMAGNET was successful and Gan is now a full member of INTERMAGNET. November 2013 Disk capacity problems resulted in the loss of 21 hours of data between the 23 rd and 24 th of November. This was traced to a faulty script and hopefully this problem has been resolved. During November the Edinburgh GIN database was automatically updated with Gan preliminary data every hour. Procedures have also been set in place to generate quasi-absolute minute values which will be sent to the GIN at monthly intervals.from November 2013 the magnetograms presented in the bulletin will be generated using these quasi-absolute minute values. December Throughout the month no problems were experienced with the observatory hardware and no data were lost.
16 Statistics on Gan Observatory Data Recorded Apart from a period in February when the data logging PC gave problems and on two ocasions in July and November when the disk filled up, throught 2013 all the equipment on Gan operated very reliably. In normal operation 1440 minute samples of all components are generated every day. Shown below is a plot of the data recorded throughout the year Gan 2013 data received by GIN /01/ /04/ /07/ /10/2013 In 2013 Gan obseravtory was operational for 91.3% of the time Baselines Throughout the year a regular program of absolute measurements of declination (D) and inclination (I) have been carried out by the Meteorological Office staff on Gan and the observers are to be congratulated on their excellent work. Depending on the weather and available staff time observations are made twice a week. The results from these observations have indicated that after replacing the fluxgate magnetometer in January this instrument has produced very stable results. Using the measured absolute value of D and I and a site corrected value of total field (F), measured by the recording proton, the absolute value of the horizontal (H) and vertical (Z)
 was measured in 2011 when the observatory was set up. In 2013 a new GSM-90T proton was purchased and this instrument will be used to check this site difference in 2014.")
17 intensities at the D/I pillar are calculated. From these results the fluxgate H,D and Z baselines are derived. It should be noted that the current site correction for the proton magnetometer of 24.2 nt ( F D/I pillar F Measured) was measured in 2011 when the observatory was set up. In 2013 a new GSM-90T proton was purchased and this instrument will be used to check this site difference in Using the GDASView software, baselines along with observation and instrument quality control measures are derived from the absolute observations. Below the baselines for 2013 are plotted. Note the large step in January is due to the fluxgate replacement. Gan 2013 Baseline plot
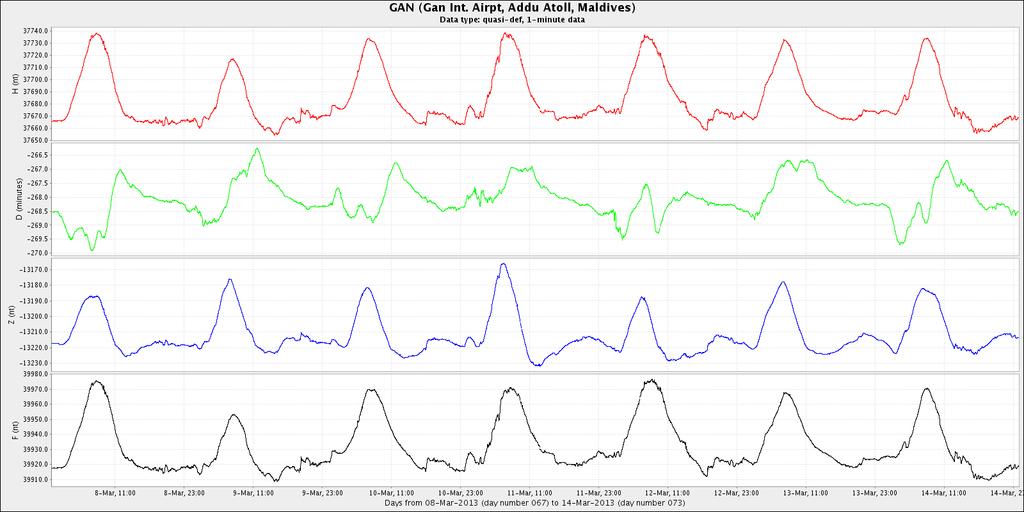
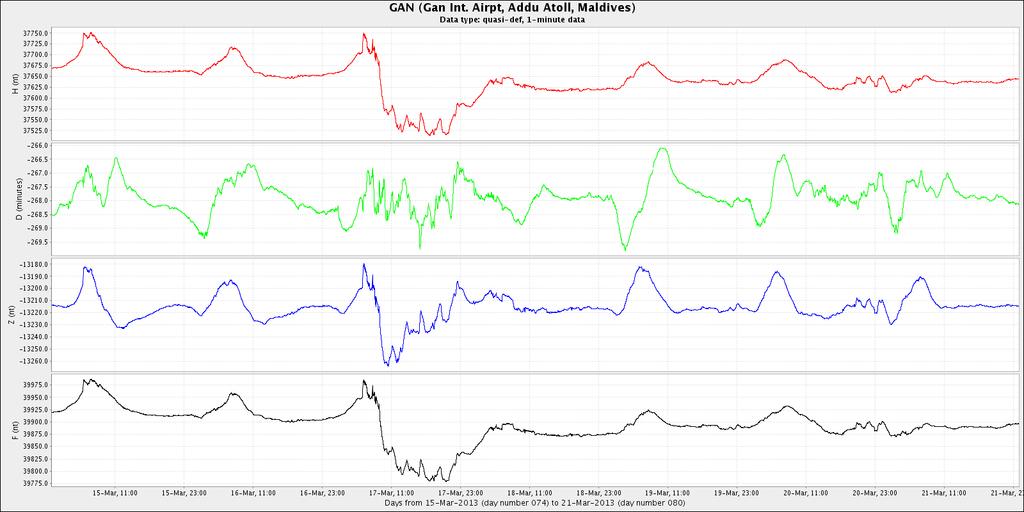
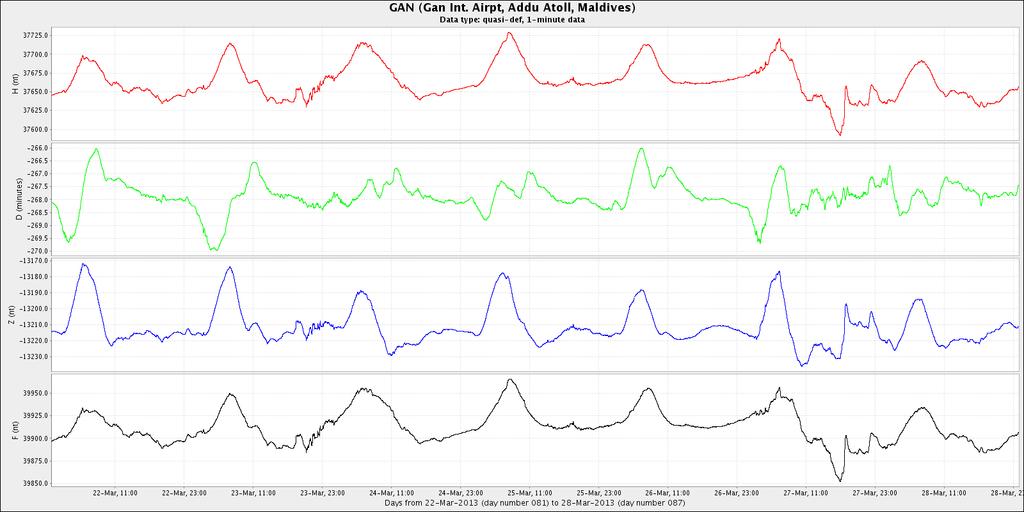
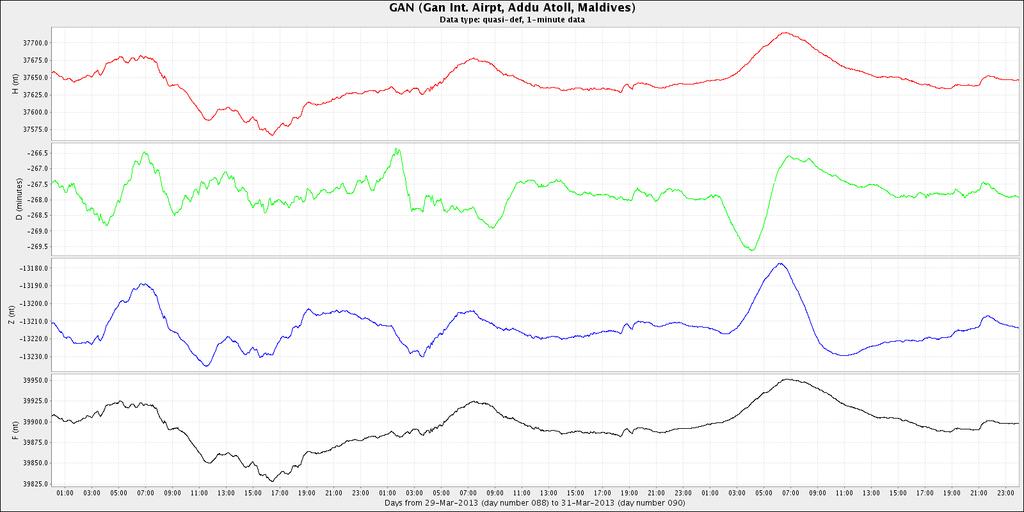
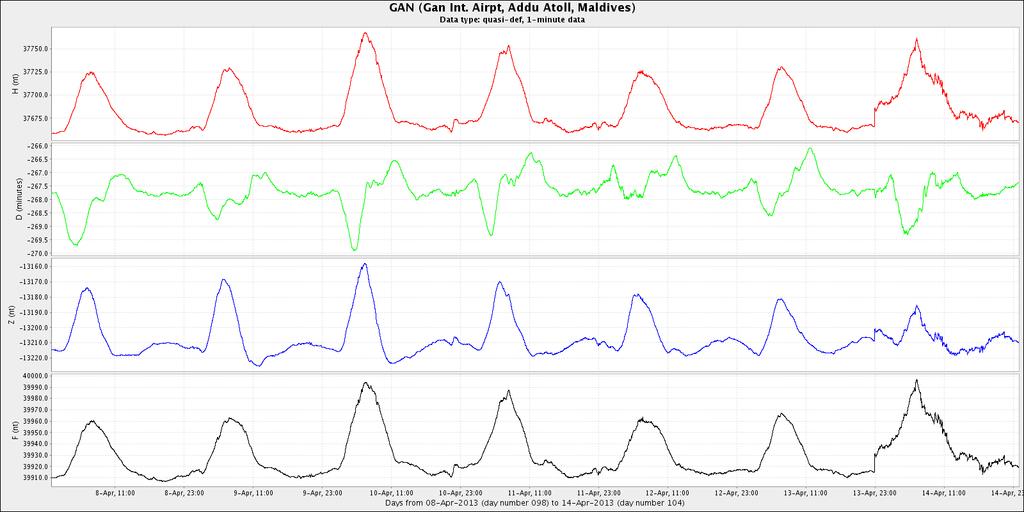
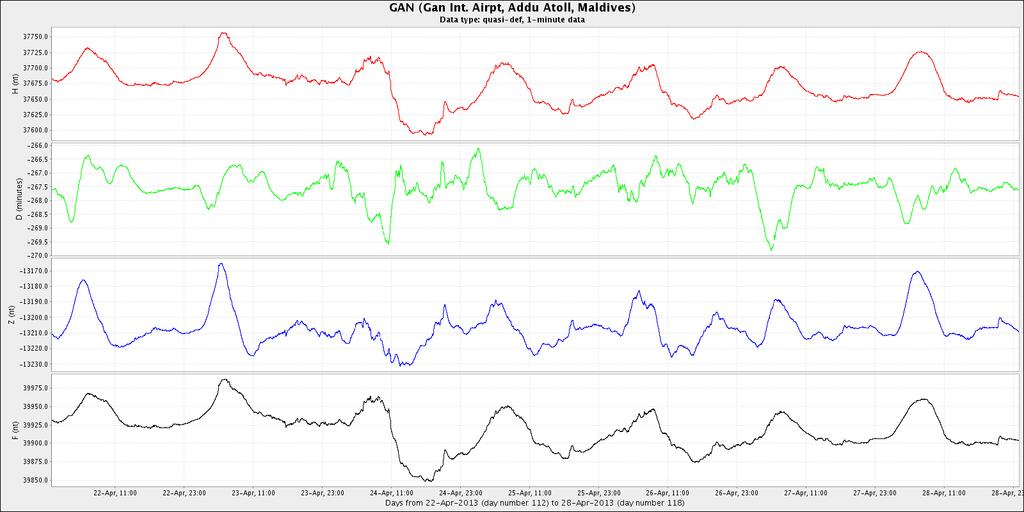
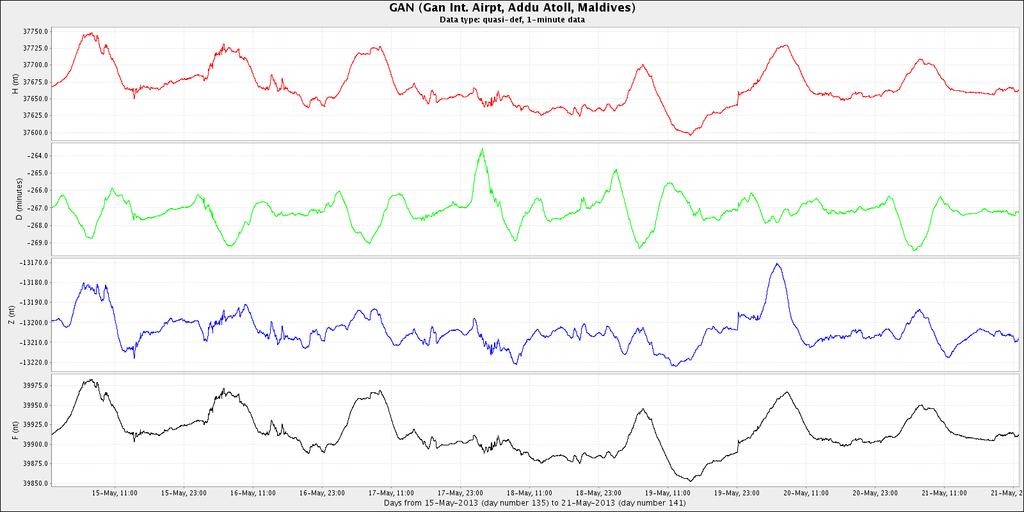
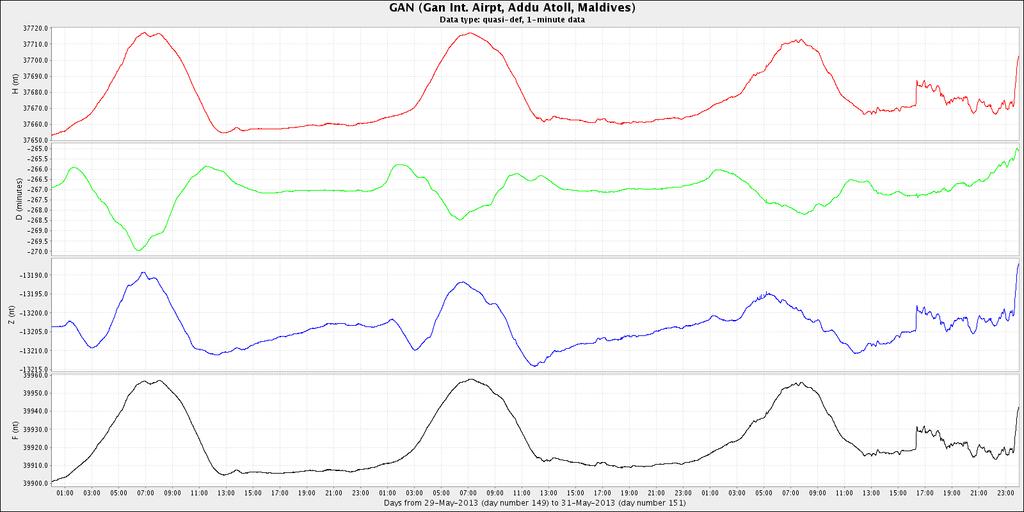
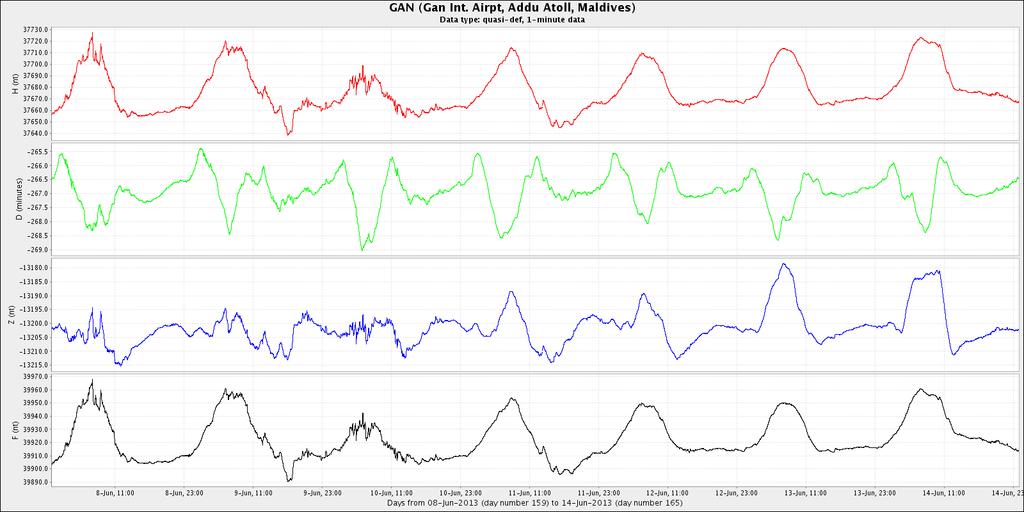
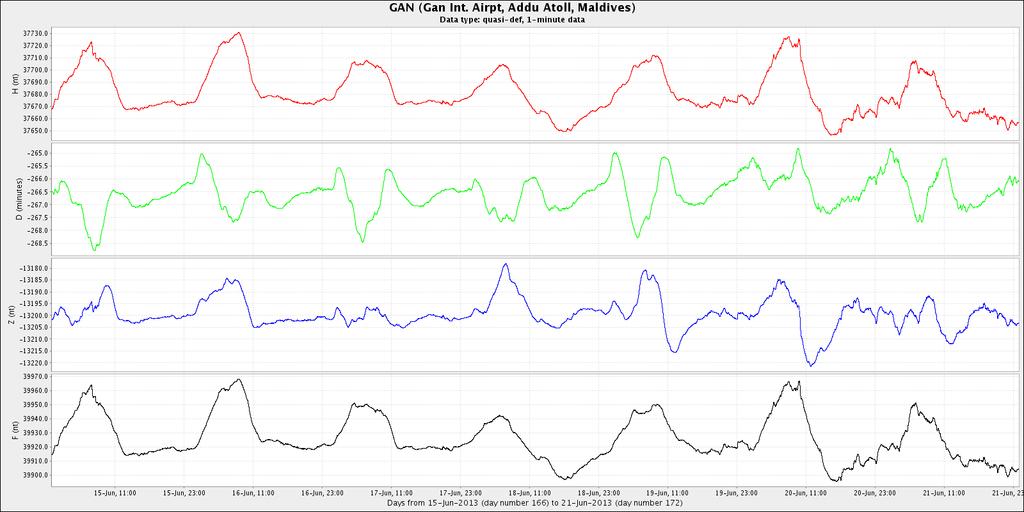
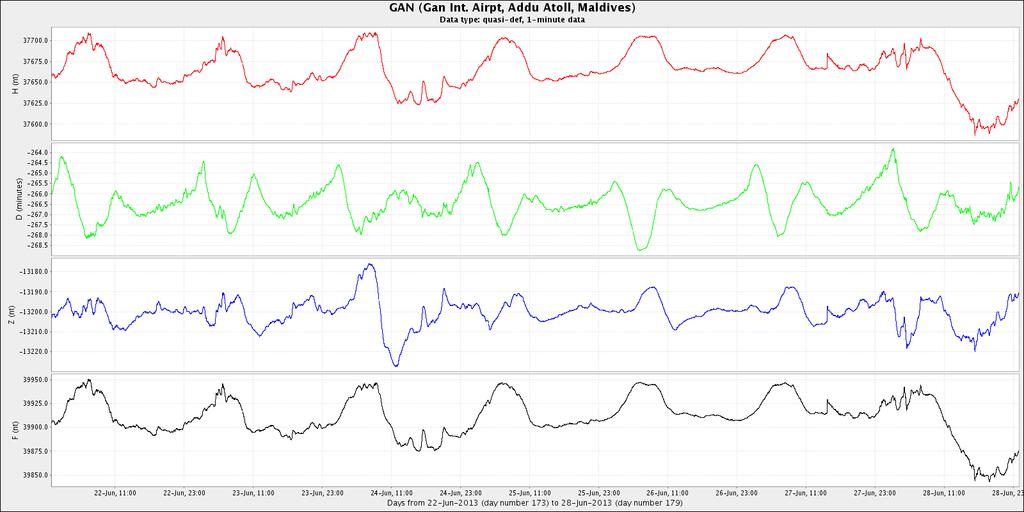
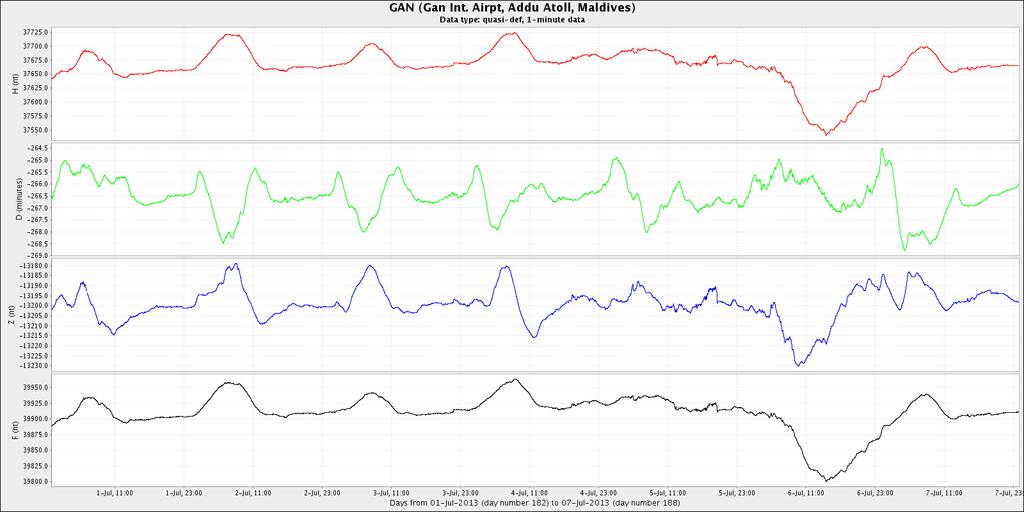
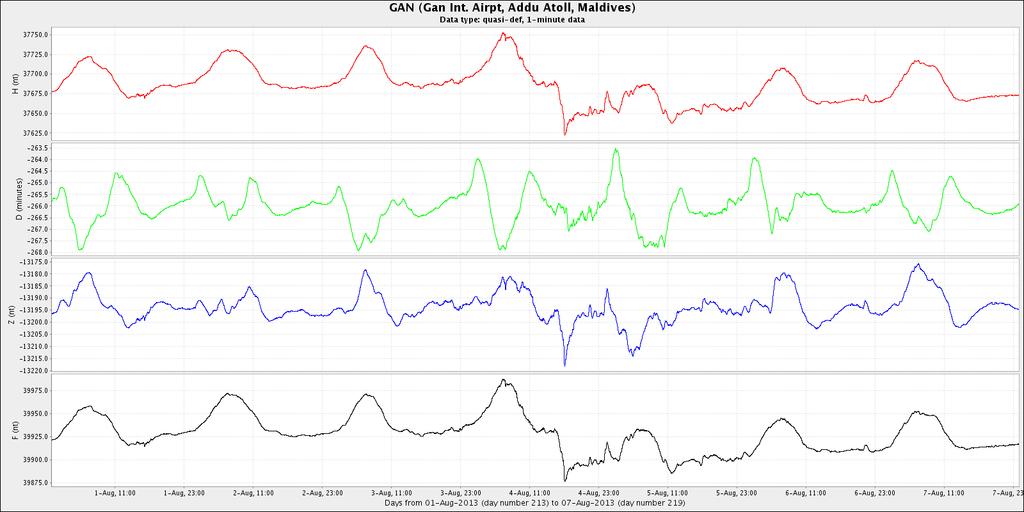
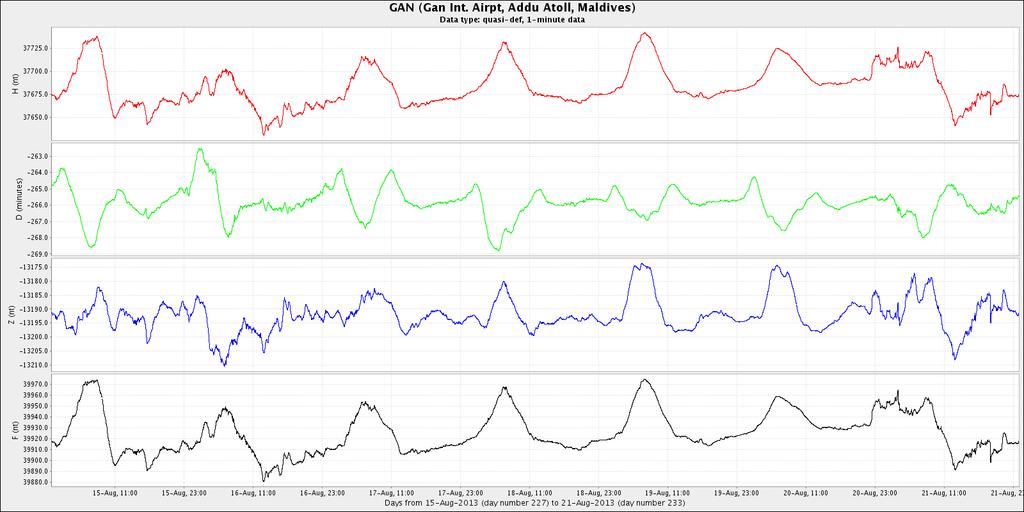
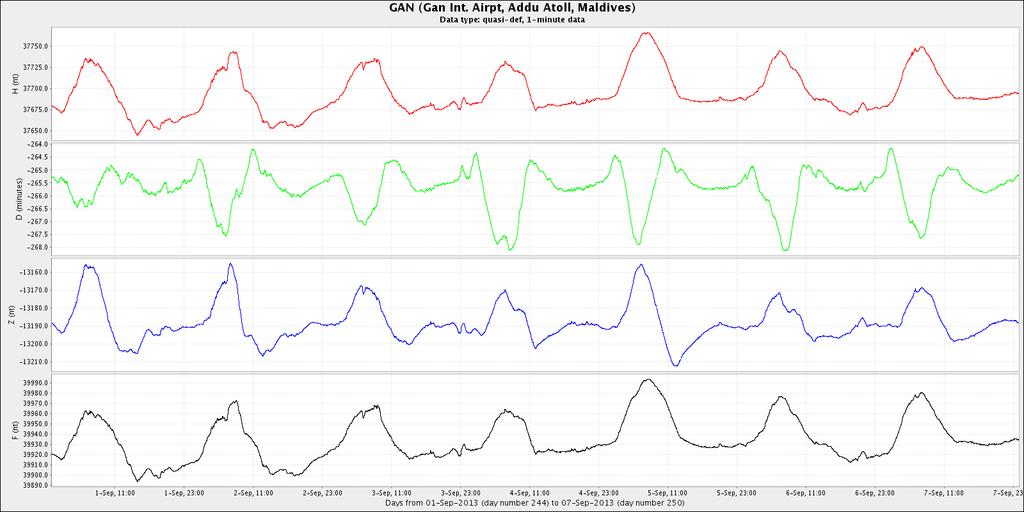
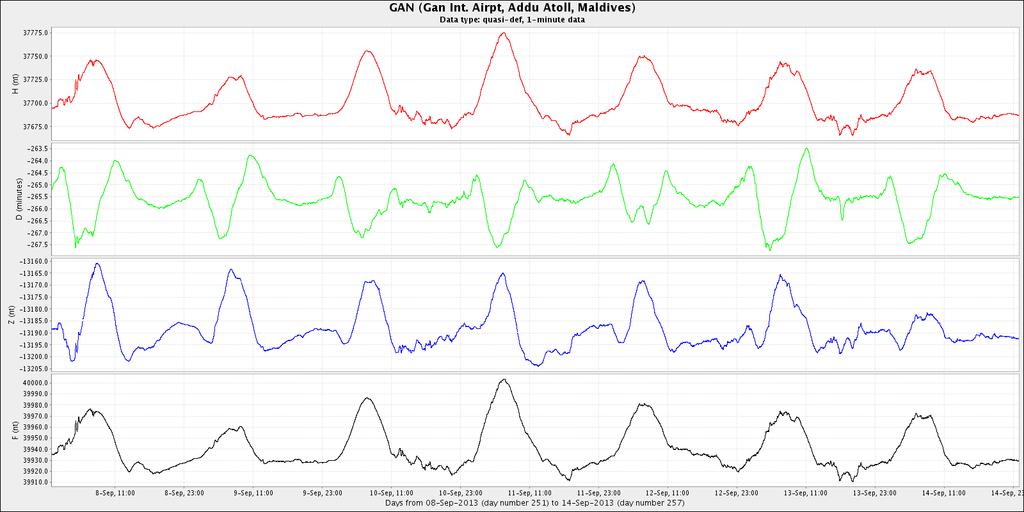
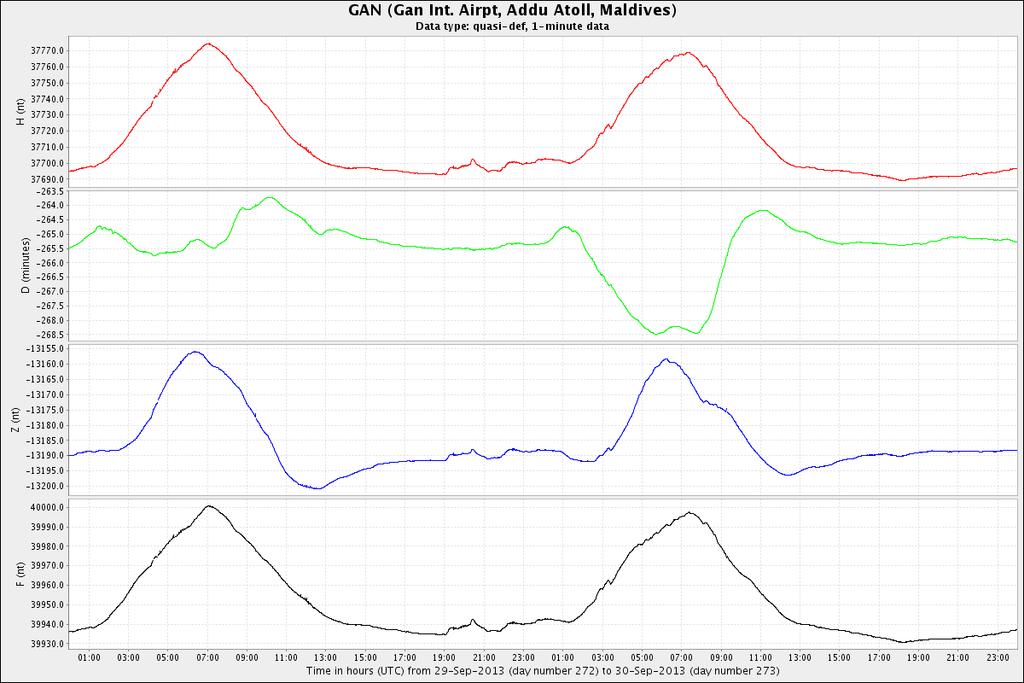
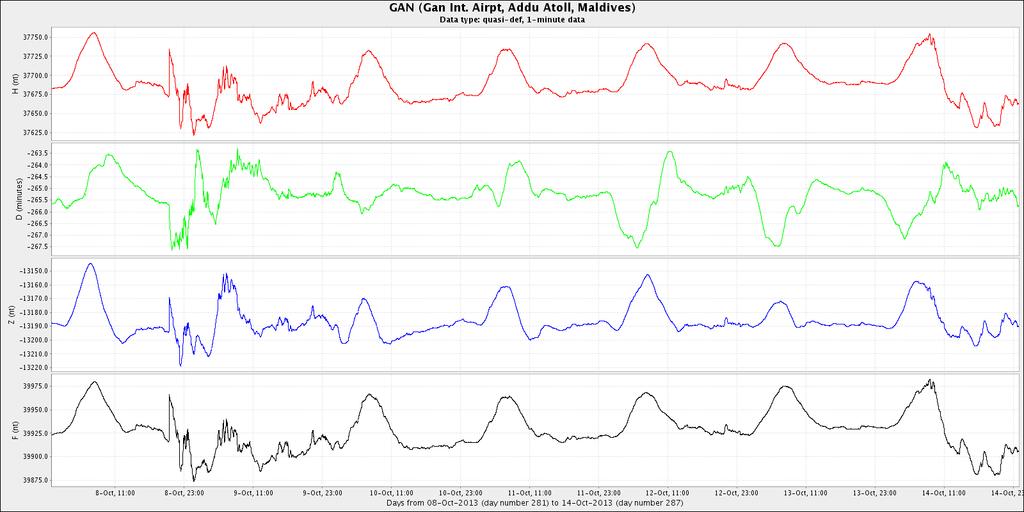
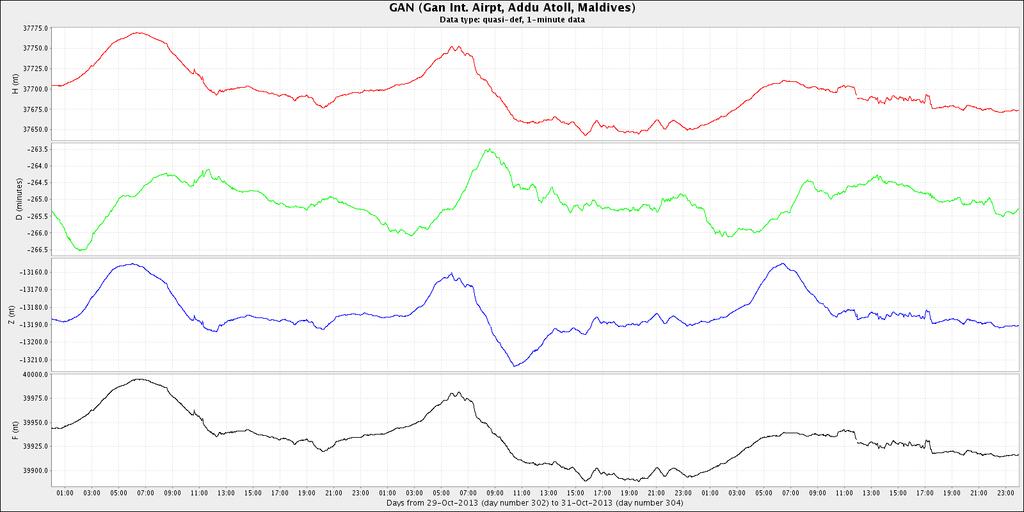
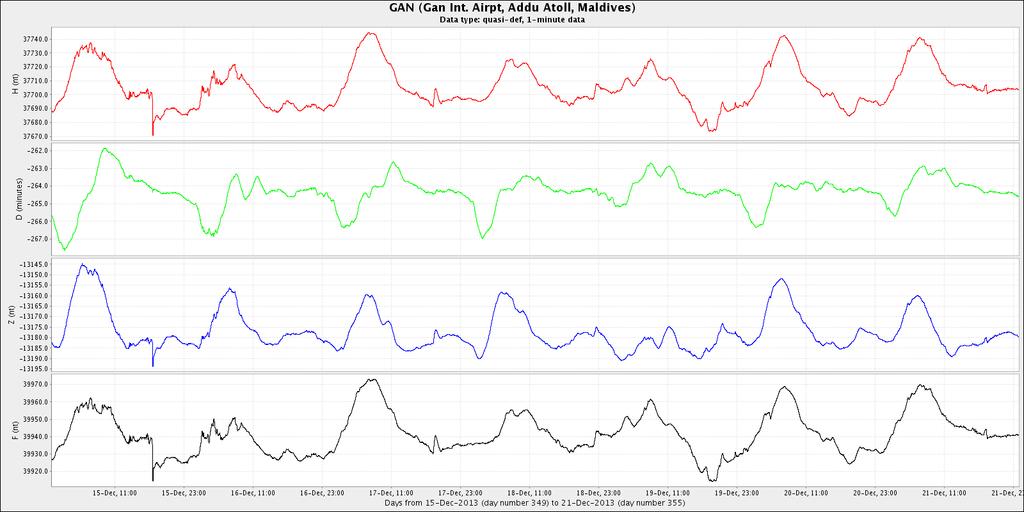
18 8 Plots of daily magnetograms The plots show the baseline corrected magnetograms of the horizontal (H), declination (D), vertical (Z) fluxgate variations along with the total field (F). The data are plotted for each month in 7 day sections, dates 1-7 th, 8-14 th, st, th followed by the remaining days of each month in a 2 or 3 day plot. Gan Magnetograms January 2013


19


20
21
22 Gan Magnetograms February 2013 Note During February 2013 problems with the data logging PC resulted in significant losses of data.
23
24
25 Gan Magnetograms March 2013

26
27
28
29 Gan Magnetograms April 2013

30

31

32
33 Gan Magnetograms May 2013


34

35
36
37 Gan Magnetograms June 2013

38
39

40
41 Gan Magnetograms July 2013

42

43

44
45 Gan Magnetograms August 2013

46

47

48
49 Gan Magnetograms September 2013
50


51
52
53 Gan Magnetograms October 2013

54


55
56
57 Gan Magnetograms November 2013


58


59

60
61 Gan Magnetograms December 2013


62

63

64
65 9 Participants in Gan Observatory operation Gan Operations and Observers Mr Ahmed Muslim, Climatologist, Maldive Meteorological Office. Mr Ibrahim Ziyad, Assistant Meteorological Technician, Maldive Meteorological Office. European Operations. Professor A Jackson, Project Leader, Institute of Geophysics, ETH Zürich, Switzerland. Dr Jakub Velimsky, Dept. of Geophysics, Charles University in Prague, Czech Republic. Dr Alexei Kuvshinov, Institute of Geophysics, ETH Zürich, Switzerland. Mr Friedman Samrock, Institute of Geophysics, ETH Zürich, Switzerland. Mr John C. Riddick, Scotland. 10 Acknowledgements We would like to acknowledge and thank the following people for their help in setting up Gan Observatory. Dr Lars W. Pedersen, National Space Institute, Technical University of Denmark, for visiting Gan, in January and replacing the triaxial fluxgate his assistance was greatly appreciated. Mr. Abdulla Wahid, Executive Director of Maldives Meteorological Service. Mr. Ali Wafir, Head of Gan Meteorological Office - for logistical and management support; Dr. Juergen Matzka and Dr. Chris Finlay, National Space Institute, Technical University of Denmark - for assistance at initial stages of the project; Mr. K.C.S. Rao and Dr. Kusumita Arora, National Geophysical Research Institute, Hyderabad - for assistance in installation of instruments, and training observers. Mr C. Turbitt and Mr T. Shanahan, British Geological Survey for their assistance in the development and use of GDASView software. Mr T Harris, British Geological Survey for post production & PDF development
66 11 Publications Gan Observatory Monthly Bulletins, J. Velímský, A. Muslim, A. Jackson, A. Kuvshinov, F. Samrock, K. Arora, K.C.S. Rao, L. Pedersen, C. Finlay, J. Riddick, Geomagnetic observatory Gan, XVth IAGA Workshop on Geomagnetic Observatory Instruments, Data Acquisition and Processing, Cadiz, J. Velímský, A. Muslim, A. Jackson, A. Kuvshinov, F. Samrock, K. Arora, K.C.S. Rao, L. Pedersen, C. Finlay, J. Riddick, Geomagnetic Observatory Gan, IAGA XIIth Scientific Assembly, Merida, References Turbitt, C.W., GDASView Users' Guide, Seismology & Geomagnetism Programme Internal Report (In press).
67
Gan Magnetic Observatory. Maldive Islands South Indian Ocean Annual Report
 Gan Magnetic Observatory Maldive Islands South Indian Ocean 2016 Annual Report 1 Institut für Geophysik, Zürich Gan Magnetic Observatory Maldive Islands South Indian Ocean 2016 Annual Report Report Editor
Monthly Magnetic Bulletin
 BRITISH GEOLOGICAL SURVEY Ascension Island Observatory Monthly Magnetic Bulletin December 2008 08/12/AS Crown copyright; Ordnance Survey ASCENSION ISLAND OBSERVATORY MAGNETIC DATA 1. Introduction Ascension
Monthly Magnetic Bulletin
 BRITISH GEOLOGICAL SURVEY Fort McMurray Observatory Monthly Magnetic Bulletin March 2017 17/03/FM Fort McMurray FORT McMURRAY OBSERVATORY MAGNETIC DATA 1. Introduction The British Geological Survey (BGS)
Monthly Magnetic Bulletin
 BRITISH GEOLOGICAL SURVEY Port Stanley Observatory Monthly Magnetic Bulletin December 2007 07/12/PS Jason Islands a ar C West Falkland Kin gg eor ge B Port Salavador ay Weddell Island Mount Osborne So
Monthly Magnetic Bulletin
 BRITISH GEOLOGICAL SURVEY Fort McMurray Observatory Monthly Magnetic Bulletin February 2016 16/02/FM Fort McMurray FORT McMURRAY OBSERVATORY MAGNETIC DATA 1. Introduction The British Geological Survey
Monthly Magnetic Bulletin
 BRITISH GEOLOGICAL SURVEY Jim Carrigan Observatory Prudhoe Bay Monthly Magnetic Bulletin May 2014 14/05/JC JIM CARRIGAN OBSERVATORY MAGNETIC DATA 1. Introduction Jim Carrigan observatory is the fourth
Monthly Magnetic Bulletin
 BRITISH GEOLOGICAL SURVEY Port Stanley Observatory Monthly Magnetic Bulletin July 2009 09/07/PS Jason Islands a ar C West Falkland Kin gg eor ge B Port Salavador ay Weddell Island Mount Osborne So un d
Monthly Magnetic Bulletin
 BRITISH GEOLOGICAL SURVEY Port Stanley Observatory Monthly Magnetic Bulletin April 2009 09/04/PS Jason Islands a ar C West Falkland Kin gg eor ge B Port Salavador ay Weddell Island Mount Osborne So un
Monthly Magnetic Bulletin
 BRITISH GEOLOGICAL SURVEY Port Stanley Observatory Monthly Magnetic Bulletin May 2009 09/05/PS Jason Islands a ar C West Falkland Kin gg eor ge B Port Salavador ay Weddell Island Mount Osborne So un d
KING EDWARD POINT OBSERVATORY MAGNETIC DATA
 BRITISH GEOLOGICAL SURVEY King Edward d Point Observatory Monthly Magnetic Bulletin October 2018 18/10/KE King Edward Point (UK) Maps British Antarctic Survey KING EDWARD POINT OBSERVATORY MAGNETIC DATA
Monthly Magnetic Bulletin
 BRITISH GEOLOGICAL SURVEY Ascension Island Observatory Monthly Magnetic Bulletin March 2017 17/03/AS Crown copyright; Ordnance Survey ASCENSION ISLAND OBSERVATORY MAGNETIC DATA 1. Introduction Ascension
KING EDWARD POINT OBSERVATORY MAGNETIC DATA
 BRITISH GEOLOGICAL SURVEY King Edward d Point Observatory Monthly Magnetic Bulletin September 2018 18/09/KE King Edward Point (UK) Maps British Antarctic Survey KING EDWARD POINT OBSERVATORY MAGNETIC DATA
Monthly Magnetic Bulletin
 BRITISH GEOLOGICAL SURVEY Port Stanley Observatory Monthly Magnetic Bulletin July 2011 11/07/PS Jason Islands West Falkland King George Bay Queen Charlotte Bay Weddell Island Caracass Island Saunders Island
KING EDWARD POINT OBSERVATORY MAGNETIC DATA
 BRITISH GEOLOGICAL SURVEY King Edward d Point Observatory Monthly Magnetic Bulletin May 2018 18/05/KE King Edward Point (UK) Maps British Antarctic Survey KING EDWARD POINT OBSERVATORY MAGNETIC DATA 1.
Monthly Magnetic Bulletin
 BRITISH GEOLOGICAL SURVEY Port Stanley Observatory Monthly Magnetic Bulletin July 2010 10/07/PS Jason Islands a ar C West Falkland Kin gg eor ge B Port Salavador ay Weddell Island Mount Osborne So un d
Monthly Geomagnetic Bulletin
 HARTLAND OBSERVATORY Monthly Geomagnetic Bulletin BRISTOL CHANNEL December 2002 02/12/HA Hartland NERC 2002 1. HARTLAND OBSERVATORY MAGNETIC DATA 1.1 Introduction This bulletin is published to meet the
Hermanus Magnetic Observatory
 Hermanus Magnetic Observatory A facility of the National Research Foundation Magnetic Results 2009 Hermanus, Hartebeesthoek and Keetmanshoop observatories 1. INTRODUCTION The Hermanus Magnetic Observatory
Establishment of Abdus Salam Geomagnetic Observatory Sonmiani, Pakistan: Site Selection to INTERMAGNET Certification
 Pakistan Space & Upper Atmosphere Research Commission Establishment of Abdus Salam Geomagnetic Observatory Sonmiani, Pakistan: Site Selection to INTERMAGNET Certification G. Murtaza Space Science Department
BRITISH GEOLOGICAL SURVEY Hartland Observatory Monthly Magnetic Bulletin March /03/HA
 BRITISH GEOLOGICAL SURVEY Hartland Observatory Monthly Magnetic Bulletin March 2010 10 /03/HA HARTLAND OBSERVATORY MAGNETIC DATA 1. Introduction Hartland observatory is one of three geomagnetic observatories
BRITISH GEOLOGICAL SURVEY Lerwick Observatory Monthly Magnetic Bulletin September /09/LE
 BRITISH GEOLOGICAL SURVEY Lerwick Observatory Monthly Magnetic Bulletin September 2010 10/09/LE LERWICK OBSERVATORY MAGNETIC DATA 1. Introduction Lerwick observatory is one of three geomagnetic observatories
BRITISH GEOLOGICAL SURVEY Hartland Observatory Monthly Magnetic Bulletin June /06/HA
 BRITISH GEOLOGICAL SURVEY Hartland Observatory Monthly Magnetic Bulletin June 2016 16/06/HA HARTLAND OBSERVATORY MAGNETIC DATA 1. Introduction Hartland observatory is one of three geomagnetic observatories
Annual Report of New Zealand Magnetic Observatories, 2007
 Annual Report of New Zealand Magnetic Observatories, 2007 INTRODUCTION There were no significant changes to the equipment used in the magnetic observatories in 2007. The new fluxgate at Scott Base continued
Monthly Magnetic Bulletin March 2010
 BRITISH GEOLOGICAL SURVEY Eskdalemuir Observatory Monthly Magnetic Bulletin March 2010 10/03/ES Crown copyright; Ordnance Survey ESKDALEMUIR OBSERVATORY MAGNETIC DATA 1. Introduction Eskdalemuir observatory
Final Report. COMET Partner's Project. University of Texas at San Antonio
 Final Report COMET Partner's Project University: Name of University Researcher Preparing Report: University of Texas at San Antonio Dr. Hongjie Xie National Weather Service Office: Name of National Weather
1 Introduction. 2 Instrumentation, conditions of measurements. Solar-Terrestrial Relations and Physics of Earthquakes Precursors
 Overhauser vector magnetometer POS-4: Results of continuous measurements during 2015 2016 at geophysical observatory "Paratunka" of IKIR FEB RAS, Kamchatka, Russia Sergey Khomutov 1,, Vladimir Sapunov
Stability analysis of geomagnetic baseline data obtained at Cheongyang observatory in Korea
 https://doi.org/10.5194/gi-6-231-2017 Author(s) 2017. This work is distributed under the Creative Commons Attribution 3.0 License. Stability analysis of geomagnetic baseline data obtained at Cheongyang
WIND DATA REPORT FOR THE YAKUTAT JULY 2004 APRIL 2005
 WIND DATA REPORT FOR THE YAKUTAT JULY 2004 APRIL 2005 Prepared on July 12, 2005 For Bob Lynette 212 Jamestown Beach Lane Sequim WA 98382 By John Wade Wind Consultant LLC 2575 NE 32 nd Ave Portland OR 97212
The Climate of Payne County
 The Climate of Payne County Payne County is part of the Central Great Plains in the west, encompassing some of the best agricultural land in Oklahoma. Payne County is also part of the Crosstimbers in the
Operational Applications of Awos Network in Turkey
 Operational Applications of Awos Network in Turkey by Soner Karatas Turkish State Meteorological Service Electronic Observing Systems Division Kütükcü Alibey Cad. No:4 06120 Kalaba-Ankara-TURKEY Tel:+90-312-302
REPORT ON THE MEASUREMENT SESSION DURING THE XIVth IAGA WORKSHOP AT CHANGCHUN MAGNETIC OBSERVATORY
 REPORT ON THE MEASUREMENT SESSION DURING THE XIVth IAGA WORKSHOP AT CHANGCHUN MAGNETIC OBSERVATORY Yufei He 1*, Dongmei Yang 1, Benliang Zou 2, Jianjun Wang 3 * 1 Institute of Geophysics, China Earthquake
The Climate of Kiowa County
 The Climate of Kiowa County Kiowa County is part of the Central Great Plains, encompassing some of the best agricultural land in Oklahoma. Average annual precipitation ranges from about 24 inches in northwestern
1 Introduction. Station Type No. Synoptic/GTS 17 Principal 172 Ordinary 546 Precipitation
 Use of Automatic Weather Stations in Ethiopia Dula Shanko National Meteorological Agency(NMA), Addis Ababa, Ethiopia Phone: +251116639662, Mob +251911208024 Fax +251116625292, Email: Du_shanko@yahoo.com
The Climate of Marshall County
 The Climate of Marshall County Marshall County is part of the Crosstimbers. This region is a transition region from the Central Great Plains to the more irregular terrain of southeastern Oklahoma. Average
Jackson County 2013 Weather Data
 Jackson County 2013 Weather Data 61 Years of Weather Data Recorded at the UF/IFAS Marianna North Florida Research and Education Center Doug Mayo Jackson County Extension Director 1952-2008 Rainfall Data
RECOMMENDATIONS FOR EUROPEAN MAGNETIC REPEAT STATION SURVEYS
 RECOMMENDATIONS FOR EUROPEAN MAGNETIC REPEAT STATION SURVEYS Andrzej Sas Uhrynowski, Monika Korte, Jean Jacques Schott and Gerhard Schwarz, Coordination Committee for common European repeat station surveys.
The Climate of Texas County
 The Climate of Texas County Texas County is part of the Western High Plains in the north and west and the Southwestern Tablelands in the east. The Western High Plains are characterized by abundant cropland
Wind Resource Data Summary Cotal Area, Guam Data Summary and Transmittal for December 2011
 Wind Resource Data Summary Cotal Area, Guam Data Summary and Transmittal for December 2011 Prepared for: GHD Inc. 194 Hernan Cortez Avenue 2nd Floor, Ste. 203 Hagatna, Guam 96910 January 2012 DNV Renewables
Antarctic Automatic Weather Station Data for the calendar year 2000
 Antarctic Automatic Weather Station Data for the calendar year 2000 by Linda M. Keller George A. Weidner Charles R. Stearns Matthew T. Whittaker Robert E. Holmes Matthew A. Lazzara Space Science and Engineering
The Climate of Grady County
 The Climate of Grady County Grady County is part of the Central Great Plains, encompassing some of the best agricultural land in Oklahoma. Average annual precipitation ranges from about 33 inches in northern
Temperature Tests on Modern Magnetometers
 PUBLS. INST. GEOPHYS. POL. ACAD. SC., C-99 (398), 2007 Temperature Tests on Modern Magnetometers András CSONTOS, László HEGYMEGI and Balázs HEILIG Eötvös Loránd Geophysical Institute Budapest, Kolombusz
The Climate of Seminole County
 The Climate of Seminole County Seminole County is part of the Crosstimbers. This region is a transition region from the Central Great Plains to the more irregular terrain of southeastern Oklahoma. Average
Memo. I. Executive Summary. II. ALERT Data Source. III. General System-Wide Reporting Summary. Date: January 26, 2009 To: From: Subject:
 Memo Date: January 26, 2009 To: From: Subject: Kevin Stewart Markus Ritsch 2010 Annual Legacy ALERT Data Analysis Summary Report I. Executive Summary The Urban Drainage and Flood Control District (District)
The Climate of Bryan County
 The Climate of Bryan County Bryan County is part of the Crosstimbers throughout most of the county. The extreme eastern portions of Bryan County are part of the Cypress Swamp and Forest. Average annual
Charles Magori. Status Report of GLOSS Tide Gauges in Kenya
 GLOSS Group of Experts Meeting February 2005 Charles Magori Introduction Status Report of GLOSS Tide Gauges in Kenya There is growing concern about the rise in mean sea level around the globe. To address
The Climate of Murray County
 The Climate of Murray County Murray County is part of the Crosstimbers. This region is a transition between prairies and the mountains of southeastern Oklahoma. Average annual precipitation ranges from
The Climate of Haskell County
 The Climate of Haskell County Haskell County is part of the Hardwood Forest. The Hardwood Forest is characterized by its irregular landscape and the largest lake in Oklahoma, Lake Eufaula. Average annual
The Climate of Pontotoc County
 The Climate of Pontotoc County Pontotoc County is part of the Crosstimbers. This region is a transition region from the Central Great Plains to the more irregular terrain of southeast Oklahoma. Average
STANDARD OPERATING PROCEDURES
 PAGE: 1 of 5 CONTENTS 1.0 SCOPE AND APPLICATION 2.0 METHOD SUMMARY 3.0 SAMPLE PRESERVATION, CONTAINERS, HANDLING, AND STORAGE 4.0 INTERFERENCE AND POTENTIAL PROBLEMS 5.0 EQUIPMENT/APPARATUS 6.0 REAGENTS
Computing & Telecommunications Services Monthly Report January CaTS Help Desk. Wright State University (937)
") January 215 Monthly Report Computing & Telecommunications Services Monthly Report January 215 CaTS Help Desk (937) 775-4827 1-888-775-4827 25 Library Annex helpdesk@wright.edu www.wright.edu/cats/ Last
January 215 Monthly Report Computing & Telecommunications Services Monthly Report January 215 CaTS Help Desk (937) 775-4827 1-888-775-4827 25 Library Annex helpdesk@wright.edu www.wright.edu/cats/ Last
Computing & Telecommunications Services
 Computing & Telecommunications Services Monthly Report September 214 CaTS Help Desk (937) 775-4827 1-888-775-4827 25 Library Annex helpdesk@wright.edu www.wright.edu/cats/ Table of Contents HEAT Ticket
Wind Tower Deployments and Pressure Sensor Installation on Coastal Houses Preliminary Data Summary _ Sea Grant Project No.
 Wind Tower Deployments and Pressure Sensor Installation on Coastal Houses Preliminary Data Summary _ Sea Grant Project No.:1020040317 Submitted to: South Carolina Sea Grant Consortium 287 Meeting Street
The geomagnetic indices: derivation, meaning, and availability
 The geomegnetic indices: derivation, meaning and availability The geomagnetic indices: derivation, meaning, and availability Michel MENVIELLE C.E.T.P., 4, Avenue de Neptune, F-94107 SAINT MAUR DES FOSSES,
An Assessment of the BGS δdδi Vector Magnetometer
 PUBLS. INST. GEOPHYS. POL. ACAD. SC., C-99 (398), 007 An Assessment of the BGS δdδi Vector Magnetometer Santiago MARSAL, J. Miquel TORTA and John C. RIDDICK Observatori de l Ebre, CSIC Universitat Ramon
Meteorological Data recorded at Armagh Observatory from 1795 to 2001: Volume I - Daily, Monthly and Annual Rainfall
 Meteorological Data recorded at Armagh Observatory from 1795 to 2001: Volume I - Daily, Monthly and Annual Rainfall 1838-2001 A. M. García-Suárez, C.J. Butler, D. Cardwell, A.D.S. Coughlin, A. Donnelly,
GEOPHYSICAL OBSERVATORY REPORT
 (LENDING SECTION) GEOPHYSICAL OBSERVATORY REPORT V M «> 'j. 3 O. - MAGNETIC OBSERVATORIES VOLUME 34 Na 12 DECEMBER 1986 ;, ' L J OF MINERAL RESOURCES, GEOLOGY & GEOPHYSICS DEPARTMENT OF RESOURCES RND ENERGY
REPORT ON SEA LEVEL MEASUREMENT FOR GHANA
 20TH SEPTEMBER 2006 REPORT ON SEA LEVEL MEASUREMENT FOR GHANA Emmanuel K. Nkebi 1 1 Survey Department of Ghana, P. O. Box CT903, Accra Tel: 233 21 777 334 Fax : 233 21 765687 E-mail: survey@ghana.com E-mail:eknkebi@yahoo.com
NATIONAL ANTARCTIC RESEARCH PROGRAM. Terra Nova Bay, Antarctica Geomagnetic Observatory
 NATIONAL ANTARCTIC RESEARCH PROGRAM Terra Nova Bay, Antarctica Geomagnetic Observatory Magnetic Observation Results 2007-2008 L. Cafarella, S. Lepidi, A. Meloni, P. Palangio, M. Pietrolungo and L. Santarelli
2018 Annual Review of Availability Assessment Hours
 2018 Annual Review of Availability Assessment Hours Amber Motley Manager, Short Term Forecasting Clyde Loutan Principal, Renewable Energy Integration Karl Meeusen Senior Advisor, Infrastructure & Regulatory
Site Description: Tower Site
 Resource Summary for Fort Collins Site Final Report Colorado Anemometer Loan Program Monitoring Period: /0/00 11/03/007 Report Date: January 1, 00 Site Description: The site is located adjacent to the
TABLE -I RAINFALL RECORDED AT PORT BLAIR (MM) FROM 1949 TO 2009
 FROM 1949 TO 2009") A. RAINFALL TABLE -I RAINFALL RECORDED AT PORT BLAIR (MM) FROM 1949 TO 2009 MONTH/YEAR 1949 1950 1951 1952 1953 1954 1955 1956 1957 1958 JANUARY 0.0 0.8 82.5 0.0 26.9 37.3 71.4 46.2 10.2 28.7 FEBRUARY
A. RAINFALL TABLE -I RAINFALL RECORDED AT PORT BLAIR (MM) FROM 1949 TO 2009 MONTH/YEAR 1949 1950 1951 1952 1953 1954 1955 1956 1957 1958 JANUARY 0.0 0.8 82.5 0.0 26.9 37.3 71.4 46.2 10.2 28.7 FEBRUARY
Pilot applications for Egypt related end-users
 GEO-CRADLE Regional Workshop Thursday, 25 th May, 2017 Pilot applications for Egypt related end-users Hesham El-Askary Chapman University Panagiotis Kosmopoulos National Observatory of Athens Stelios Kazadzis
Geomagnetic Field Modeling Lessons learned from Ørsted and CHAMP and prospects for Swarm
 Geomagnetic Field Modeling Lessons learned from Ørsted and CHAMP and prospects for Swarm Nils Olsen RAS Discussion Meeting on Swarm October 9 th 2009 Nils Olsen (DTU Space) Ørsted, CHAMP, and Swarm 1 /
Deriving Meteorological Data from free-to-air Mode-S broadcasts in an Australian Context.
 Deriving Meteorological Data from free-to-air Mode-S broadcasts in an Australian Context. Douglas Body Bureau of Meteorology, Melbourne, Australia d.body@bom.gov.au ABSTRACT Using free to air Automatic
A method for the near real-time production of quasi-definitive magnetic observatory data
 Earth Planets Space, 65, 1363 1374, 2013 A method for the near real-time production of quasi-definitive magnetic observatory data Ellen Clarke, Orsi Baillie, Sarah J. Reay, and Chris W. Turbitt British
Introduction to upper air measurements with radiosondes and other in situ observing systems. John Nash, C. Gaffard,R. Smout and M.
 Introduction to upper air measurements with radiosondes and other in situ observing systems John Nash, C. Gaffard,R. Smout and M. Smees Observation Development, Met Office, Exeter Integrated Ground-based
UNITED NATIONS E/CONF.96/CRP. 5
 UNITED NATIONS E/CONF.96/CRP. 5 ECONOMIC AND SOCIAL COUNCIL Eighth United Nations Regional Cartographic Conference for the Americas New York, 27 June -1 July 2005 Item 5 of the provisional agenda* COUNTRY
Studnice Test Station (EGÚ Brno)
") Test Station (EGÚ Brno) Ing. Jaroslav Šabata EGÚ a.s. Hudcova 487/76a, 612 48 Brno-Medlánky,, jaroslav.sabata@egubrno.cz Abstract EGÚ Brno has been involved in solving the problems of icing on overhead
Test Station (EGÚ Brno) Ing. Jaroslav Šabata EGÚ a.s. Hudcova 487/76a, 612 48 Brno-Medlánky,, jaroslav.sabata@egubrno.cz Abstract EGÚ Brno has been involved in solving the problems of icing on overhead
Seismic Recording Station AZ_PFO Summary Report
 Seismic Recording Station AZ_PFO Summary Report Thank you for hosting station AZ_PFO on your property. We hope that you find the enclosed report interesting. Your station is one of the 2000 USArray seismic
EMADDC. towards operational collection of Mode-S EHS observations in Europe
 EMADDC towards operational collection of Mode-S EHS observations in Europe Jan Sondij MBA Programme Manager EMADDC Senior Advisor Aviation Meteorology KNMI Content About EMADDC History of Mode-S EHS research
Results of DIflux Intercomparisons at the 3th Escuela Latino-Americana de Geomagnetismo in Huancayo, Perú October 22th - 29th 1997
 Results of DIflux Intercomparisons at the 3th Escuela Latino-Americana de Geomagnetismo in Huancayo, Perú October 22th - 29th 1997 by Oscar Veliz Castillo Instituto Geofisico del Perú Perú and Jean L.
LAB 3: THE SUN AND CLIMATE NAME: LAB PARTNER(S):
:") GEOG 101L PHYSICAL GEOGRAPHY LAB SAN DIEGO CITY COLLEGE SELKIN 1 LAB 3: THE SUN AND CLIMATE NAME: LAB PARTNER(S): The main objective of today s lab is for you to be able to visualize the sun s position
GEOG 101L PHYSICAL GEOGRAPHY LAB SAN DIEGO CITY COLLEGE SELKIN 1 LAB 3: THE SUN AND CLIMATE NAME: LAB PARTNER(S): The main objective of today s lab is for you to be able to visualize the sun s position
ERBE Geographic Scene and Monthly Snow Data
 NASA Contractor Report 4773 ERBE Geographic Scene and Monthly Snow Data Lisa H. Coleman, Beth T. Flug, Shalini Gupta, Edward A. Kizer, and John L. Robbins Science Applications International Corporation
THE NEW DIGITAL SEISMIC NETWORK IN GHANA THE WAYFORWARD AND THE CHALLENGES
 THE NEW DIGITAL SEISMIC NETWORK IN GHANA THE WAYFORWARD AND THE CHALLENGES By NICHOLAS OPOKU Seismologist, Ghana Geological Survey JANUARY, 2013 IRIS METADATA WORKSHOP - KUWAIT Seismicity / Instrumental
Agricultural Science Climatology Semester 2, Anne Green / Richard Thompson
 Agricultural Science Climatology Semester 2, 2006 Anne Green / Richard Thompson http://www.physics.usyd.edu.au/ag/agschome.htm Course Coordinator: Mike Wheatland Course Goals Evaluate & interpret information,
GOES-16 & GOES-S: Natalia Donoho. Preparing Users for New Generation Satellites. WMO IPET-SUP-4 Geneva, Switzerland 26 February, 2018
 GOES-16 & GOES-S: Preparing Users for New Generation Satellites Natalia Donoho Satellite Products and Services Division (NOAA/NESDIS) WMO IPET-SUP-4 Geneva, Switzerland 26 February, 2018 GOES-R series
Changing Hydrology under a Changing Climate for a Coastal Plain Watershed
 Changing Hydrology under a Changing Climate for a Coastal Plain Watershed David Bosch USDA-ARS, Tifton, GA Jeff Arnold ARS Temple, TX and Peter Allen Baylor University, TX SEWRU Objectives 1. Project changes
Chiang Rai Province CC Threat overview AAS1109 Mekong ARCC
 Chiang Rai Province CC Threat overview AAS1109 Mekong ARCC This threat overview relies on projections of future climate change in the Mekong Basin for the period 2045-2069 compared to a baseline of 1980-2005.
Geomagnetic Sudden Impulses
 Geomagnetic Sudden Impulses Whitham D. Reeve 2013 W. Reeve 1. Introduction This article discusses geomagnetic sudden impulses observed with the SAM-III magnetometer system at Anchorage, Alaska USA during
WEATHER MODELING FOR ASTRONOMY OBSERVATIONS AT KILOHOKU OBSERVATORY, PEARL CITY, HAWAI`I
 WEATHER MODELING FOR ASTRONOMY OBSERVATIONS AT KILOHOKU OBSERVATORY, PEARL CITY, HAWAI`I Jonathan Bauer College of Arts and Science University of Hawaii at Hilo Hilo, Hawaii 96720 ABSTRACT Daily and monthly
Outage Coordination and Business Practices
 Outage Coordination and Business Practices 1 2007 Objectives What drove the need for developing a planning/coordination process. Why outage planning/coordination is crucial and important. Determining what
Relating Storage Tank Stock Temperature to Meteorological Data
 Relating Storage Tank Stock Temperature to Meteorological Data September 11, 2008 Prepared by: Robert L. Ferry J. Randolph Kissell The TGB Partnership Prepared for: American Petroleum Institute 1220 L
Government of Sultanate of Oman Public Authority of Civil Aviation Directorate General of Meteorology. National Report To
 Government of Sultanate of Oman Public Authority of Civil Aviation Directorate General of Meteorology National Report To Panel on Tropical Cyclones in the Bay of Bengal And Arabian Sea 43rd Session, India
Measurement of global solar radiation in Terengganu state, Malaysia
 Environmental Science and Technology Conference (ESTEC29) Kuala Terengganu Malaysia, December 7-8, 29 Measurement of global solar radiation in Terengganu state, Malaysia A.M. Muzathik 1*, W.B. Wan Nik
Your Partner in Environment Monitoring
 Your Partner in Environment Monitoring Radiation Environment in Space The ionizing radiation in space represents one of the most severe environmental loads to space hardware and can cause a large number
Multivariate Regression Model Results
 Updated: August, 0 Page of Multivariate Regression Model Results 4 5 6 7 8 This exhibit provides the results of the load model forecast discussed in Schedule. Included is the forecast of short term system
PROPOSAL OF SEVEN-DAY DESIGN WEATHER DATA FOR HVAC PEAK LOAD CALCULATION
 Ninth International IBPSA Conference Montréal, Canada August 5-8, PROPOSAL OF SEVEN-DAY DESIGN WEATHER DATA FOR HVAC PEAK LOAD CALCULATION Hisaya ISHINO Faculty of Urban Environmental Sciences, Metropolitan
P7.7 A CLIMATOLOGICAL STUDY OF CLOUD TO GROUND LIGHTNING STRIKES IN THE VICINITY OF KENNEDY SPACE CENTER, FLORIDA
 P7.7 A CLIMATOLOGICAL STUDY OF CLOUD TO GROUND LIGHTNING STRIKES IN THE VICINITY OF KENNEDY SPACE CENTER, FLORIDA K. Lee Burns* Raytheon, Huntsville, Alabama Ryan K. Decker NASA, Marshall Space Flight
Scarborough Tide Gauge
 Tide Gauge Location OS: 504898E 488622N WGS84: Latitude: 54 16' 56.990"N Longitude: 00 23' 25.0279"W Instrument Valeport 740 (Druck Pressure Transducer) Benchmarks Benchmark Description TGBM = 4.18m above
Location. Datum. Survey. information. Etrometa. Step Gauge. Description. relative to Herne Bay is -2.72m. The site new level.
 Tide Gauge Location OS: 616895E 169377N WGS84: Latitude: 51 o 22.919196 N Longitude: 01 o 6.9335907 E Instrument Type Etrometa Step Gauge Benchmarks Benchmark TGBM = 5.524m above Ordnance Datum Newlyn
Generation of an Annual Typical Meteorological Solar Radiation for Armidale NSWAustralia
 IOSR Journal of Engineering (IOSRJEN) ISSN (e): 2250-3021, ISSN (p): 2278-8719 Vol. 04, Issue 04 (April. 2014), V1 PP 41-45 www.iosrjen.org Generation of an Annual Typical Meteorological Solar Radiation
Kevin Smith Senior Climatologist. Australian Bureau of Meteorology.
 GCOS Region V Lead Centre Kevin Smith Senior Climatologist Australian Bureau of Meteorology k.c.smith@bom.gov.au GCOS_Lead_Centre_RAV@bom.gov.au http://www.bom.gov.au BACKGROUND & INTRODUCTION RA V observational
Location. Datum. Survey. information. Etrometa. Step Gauge. Description. relative to Herne Bay is -2.72m. The site new level.
 Tide Gauge Location OS: 616895E 169377N WGS84: Latitude: 51 o 22.919196 N Longitude: 01 o 6.9335907 E Instrument Type Etrometa Step Gauge Benchmarks Benchmark TGBM = 5.524m above Ordnance Datum Newlyn
Center Data Analysis Service supported by the FAGS
 Solar Influences Data analysis Center Data Analysis Service supported by the FAGS SUNSPOT BULLETIN 2 n Provisional international and normalized hemispheric daily sunspot numbers for September 2 computed
DANISH METEOROLOGICAL INSTITUTE
 DANISH METEOROLOGICAL INSTITUTE TECHNICAL REPORT 03-01 Magnetic Results 2001 Brorfelde, Qeqertarsuaq, Qaanaaq and Narsarsuaq Observatories COPENHAGEN 2003 DMI Technical Report 03-01 Compiled by Børge Pedersen
_ falian GEOMAGNETISM REPORT
 blications compactus w u t; n :0 o c r ir. iifc _ falian GEOMAGNETISM REPORT MAGNETIC OBSERVATORIES VOLUME 40 No.6 JUNE 1992 BUREAU OF MINERAL RESOURCES, GEOLOGY & GEOPHYSICS DEPARTMENT OF PRIMARY INDUSTRIES
Purdue University Meteorological Tool (PUMET)
") Purdue University Meteorological Tool (PUMET) Date: 10/25/2017 Purdue University Meteorological Tool (PUMET) allows users to download and visualize a variety of global meteorological databases, such as
Purdue University Meteorological Tool (PUMET) Date: 10/25/2017 Purdue University Meteorological Tool (PUMET) allows users to download and visualize a variety of global meteorological databases, such as
Demonstration of the new InterMet radiosondes system installed at the Tanzania Meterological Agency, Dar-es-Salaam
 Demonstration of the new InterMet radiosondes system installed at the Tanzania Meterological Agency, Dar-es-Salaam J. Nash, R. Smout, M. Smees Met Office, Exeter,UK C. Bower NOAA-NWS, Silver Spring, Md,
Exercise 6. Solar Panel Orientation EXERCISE OBJECTIVE DISCUSSION OUTLINE. Introduction to the importance of solar panel orientation DISCUSSION
 Exercise 6 Solar Panel Orientation EXERCISE OBJECTIVE When you have completed this exercise, you will understand how the solar illumination at any location on Earth varies over the course of a year. You
MetConsole AWOS. (Automated Weather Observation System) Make the most of your energy SM
 Make the most of your energy SM") MetConsole AWOS (Automated Weather Observation System) Meets your aviation weather needs with inherent flexibility, proven reliability Make the most of your energy SM Automated Weather Observation System
MetConsole AWOS (Automated Weather Observation System) Meets your aviation weather needs with inherent flexibility, proven reliability Make the most of your energy SM Automated Weather Observation System
Jay Lawrimore NOAA National Climatic Data Center 9 October 2013
 Jay Lawrimore NOAA National Climatic Data Center 9 October 2013 Daily data GHCN-Daily as the GSN Archive Monthly data GHCN-Monthly and CLIMAT messages International Surface Temperature Initiative Global