BRITISH GEOLOGICAL SURVEY Hartland Observatory Monthly Magnetic Bulletin March /03/HA
|
|
|
- Edgar Bond
- 5 years ago
- Views:
Transcription


1 BRITISH GEOLOGICAL SURVEY Hartland Observatory Monthly Magnetic Bulletin March /03/HA
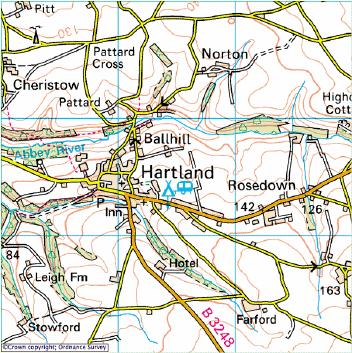
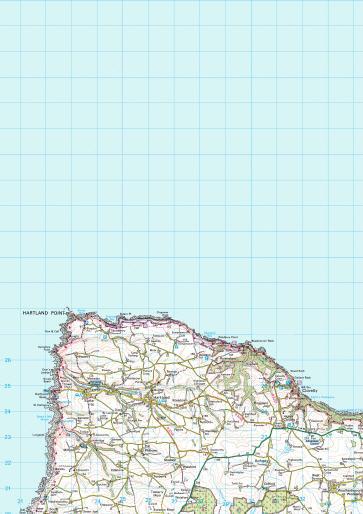
2 HARTLAND OBSERVATORY MAGNETIC DATA 1. Introduction Hartland observatory is one of three geomagnetic observatories in the UK operated and maintained by the British Geological Survey (BGS). This bulletin is published to provide rapid access to the provisional geomagnetic observatory results. The information is freely available for personal, academic, educational and non-commercial research or use. Magnetic observatory data are presented as a series of plots of one-minute, hourly and daily values, followed by tabulations of monthly values, reports of rapid variations and geomagnetic activity indices. The operation of the observatory and presentation of data are described in the rest of this section. Enquiries about the data should be addressed to: 2. Position Geomagnetism Team Earth Hazards and Systems British Geological Survey Murchison House, West Mains Road Edinburgh EH9 3LA Scotland, UK Tel: +44 (0) Fax: +44 (0) enquiries@bgs.ac.uk Internet: The observatory is situated on the NW boundary of the village of Hartland in North Devon. The observatory co-ordinates are: Geographic: N E Geomagnetic: N E Height above mean sea level: 95 m The geomagnetic co-ordinates are approximations, calculated using the 11th generation International Geomagnetic Reference Field (IGRF) at epoch On-line access to models (including IGRF), charts and navigational data are available at 3. The Observatory Operation 3.1 GDAS The observatory operates under the control of the Geomagnetic Data Acquisition System (GDAS), which was developed by BGS staff, installed in 2002, and became fully operational in January The data acquisition software, running on QNX operated computers, controls the data logging and the communications. There are two sets of sensors used for making magnetic measurements. A tri-axial linear-core fluxgate magnetometer, manufactured by the Danish Meteorological Institute, is used to measure the variations in the horizontal (H) and vertical (Z) components of the field. The third sensor is oriented perpendicular to these, and measures variations, which are proportional to the changes in declination (D). Measurements are made at a rate of 1 Hz. In addition to the fluxgate sensors there is a proton precession magnetometer (PPM) making measurements of the absolute total field intensity (F) at a rate of 0.1Hz. The raw unfiltered data are retrieved automatically via Internet connections to the BGS office in Edinburgh in near real-time. The fluxgate data are filtered to produce one-minute values using a 61- point cosine filter and the total field intensity samples are filtered using a 7-point cosine filter. The one-minute values provide input for various data products in the Geomagnetism Information and Forecast Service (GIFS), available on-line at Back-up Systems There are two other fully independent identical systems, GDAS 2 and GDAS 3, operating at the observatory. The data from these are also processed in near real-time and used for quality control purposes. They are also used to fill any gaps or replace any corrupt values in the primary system, GDAS Absolute Observations The GDAS fluxgate magnetometers accurately measure variations in the components of the geomagnetic field, but not the absolute magnitudes. Two sets of absolute measurements of the field are made manually once per week. A fluxgate sensor mounted on a theodolite is used to determine D and inclination (I); the GDAS PPM measurements, with a site difference correction applied, are used for F. The absolute observations are used in conjunction with the GDAS variometer measurements to produce a continuous record of the absolute values of the geomagnetic field
3 elements as if they had been measured at the observatory reference pillar. 4. Observatory Results The data presented in the bulletin are in the form of plots and tabulations described in the following sections. 4.1 Absolute Observations The absolute observation measurements made during the month are tabulated. Also included are the corresponding baseline values, which are the differences between the absolute measurements and the variometer measurements of D, H and Z (in the sense absolute variometer). These are also plotted (markers) along with the derived preliminary daily baseline values (line) throughout the year. Daily mean differences between the measured absolute F and the F computed from the baseline corrected H and Z values are plotted in the fourth panel (in the sense measured derived). The bottom panel shows the daily mean temperature in the fluxgate chamber. 4.2 Summary magnetograms Small-scale magnetograms are plotted which allow the month's data to be viewed at a glance. They are plotted 16 days to a page and show the one-minute variations in D, H and Z. The scales are shown on the right-hand side of the page. On disturbed days the scales are multiplied by a factor, which is indicated above the panel for that day. The variations are centred on the monthly mean value, shown on the left side of the page. 4.3 Magnetograms The daily magnetograms are plotted using oneminute values of D, H and Z from the fluxgate sensors, with any gaps filled using back-up data. The magnetograms are plotted to a variable scale; scale bars are shown to the right of each plot. The absolute level (the monthly mean value) is indicated on the left side of the plots. 4.4 Hourly Mean Value Plots Hourly mean values of D, H and Z for the past 12 months are plotted in 27-day segments corresponding to the Bartels solar rotation number. Magnetic disturbances associated with active regions and/or coronal holes on the Sun may recur after 27 days: the same is true for geomagnetically quiet intervals. Plotting the data in this way highlights this recurrence. Diurnal variations are also clear in these plots and the amplitude changes throughout the year highlight the seasonal changes. Longer term secular variation is also illustrated. Full lists of the UK observatory hourly mean values from 1983 to the present day are available at Daily and Monthly Mean Values Daily mean values of D, H, Z and F are plotted throughout the year. In addition, a table of monthly mean values of all the geomagnetic elements is provided. These values depend on accurate specification of the fluxgate sensor baselines. It is anticipated that these provisional values will not be altered by more than a few nt or tenths of arcminutes before being made definitive at the end of the year. 4.6 Rapid Variations Charged particles stream from the Sun in the solar wind. The solar wind interacts with the geomagnetic field to create a cavity, the magnetosphere, in which the field is confined. When a region of enhanced velocity and/or density in the solar wind arrives at the dayside boundary of the magnetosphere (at about 10 earth radii) the boundary is pushed towards the Earth. Currents set up on the boundary of the magnetosphere can cause an abrupt change in the geomagnetic field measured on the ground and this is recorded on observatory magnetograms as a sudden impulse (si). If, following an si, there is a change in the rhythm of activity, the si is termed a storm sudden commencement (ssc). A classical magnetic storm exhibiting initial, main and recovery phases (shown by, for instance, the Dst ring current index) can often occur after a ssc, in which case the start of the storm is taken as the time of the ssc. Solar flares, seen at optical wavelengths as a sudden brightening of a small region of the Sun's surface, are also responsible for increased X-ray emissions. These X-rays cause increased ionisation in the ionosphere, which leads to absorption of short-wave radio signals. A solar flare effect (sfe), or "crochet", may be observed on a magnetogram during geomagnetically quiet times. It is a relatively short-term change (tens of minutes) to the normal diurnal variation and can vary in size (tens of nt) depending on local time (LT), geomagnetic latitude and solar zenith angle.
4 4.7 Local geomagnetic activity indices The Observatory K index. This summarises geomagnetic activity at an observatory by assigning a code, an integer in the range 0 to 9, to each 3- hour Universal Time (UT) interval. The index for each 3-hour UT interval is determined from the maximum range in H or D (scaled in nt), with allowance made for the regular (undisturbed) diurnal variation. The conversion from range to an index value is made using a quasi-logarithmic scale, with the scale values dependent on the geomagnetic latitude of the observatory. The lower bounds (in nt) for the classification of each period at Hartland are: The K index retains the LT and seasonal dependence of activity associated with the position of the observatory. The 3-hourly K indices for the month are tabulated and also plotted as a histogram. All UK observatory K indices are available at Global geomagnetic activity indices The aa index. A number of 3-hour geomagnetic indices are computed by combining K indices from networks of observatories to characterise global activity levels and to eliminate LT and seasonal effects. The simplest of these is the aa index, computed using the K indices from two approximately antipodal observatories: Hartland in the UK and Canberra in Australia. The aa index is calculated from linearisations of the Hartland and Canberra K indices, and has units of nt. The 3- hourly aa indices are tabulated along with the daily mean value of aa (denoted Aa), the mean values of aa for the intervals 00-12UT (Aa am ) and 12-24UT (Aa pm ) and the monthly mean value. The 3-hourly aa indices for the month are also plotted as a histogram. Although the aa index is based on data from only two observatories, provided averages over 12 hours or longer are used, the index is strongly correlated with the ap and am indices, which are derived using data from more extensive observatory networks. The aa indices listed in this bulletin are available at as well as the full data set from Definitive aa are published by the International Service for Geomagnetic Indices, LATMOS, 4 Avenue de Neptune, F Saint Maur Cedex, France. 5. Conditions of Use The data presented in this bulletin are provided for personal, academic, educational, non-commercial research or other non-commercial use and are not for sale or distribution to third parties without written permission from BGS. Reproduction of any part of this bulletin should be accompanied by the statement: 'Reproduced with the permission of the British Geological Survey NERC. All rights Reserved'. Publications making use of the data should include an acknowledgment statement of the form: The results presented in this paper rely on the data collected at Hartland magnetic observatory, operated by the British Geological Survey. Commercial users can contact the geomagnetism team for information on the range of applications and services offered. Full contact details are available at This product includes mapping data licensed from Ordnance Survey with the permission of HMSO Crown copyright. All rights reserved. Licence Number: /2010 NERC All rights reserved Edinburgh British Geological Survey 2010
5 HARTLAND OBSERVATORY ABSOLUTE OBSERVATIONS Date Day Number Time (UT) Declination Inclination Total Field Horizontal Intensity Vertical Intensity Absolute (º) Baseline (º) Time (UT) Absolute (º) Site difference (nt) Absolute corrected (nt) 03-Mar : : ST 03-Mar : : ST 10-Mar : : ST 10-Mar : : ST 18-Mar : : ST 18-Mar : : ST 25-Mar : : ST 25-Mar : : ST 31-Mar : : ST 31-Mar : : ST Absolute (nt) Baseline (nt) Absolute (nt) Baseline (nt) Observer
6 Hartland 2010 Declination : Absolute - Variometer (markers) and Baseline Applied (line) min Horizontal Intensity : Absolute - Variometer (markers) and Baseline Applied (line) Vertical Intensity : Absolute - Variometer (markers) and Baseline Applied (line) Total Intensity : Absolute (Proton F) - Baseline Adjusted Variometer (derived F) -4.5 Temperature Inside Variometer Hut C Jan Feb Mar Apr May Jun Jul Aug Sep Oct Nov Dec
7 Hartland March D 0.40 o H Z D H 100 nt Z D H Z 75 nt D H Z
8 D 0.40 o H Z D H 100 nt Z D H Z 75 nt D UT H Z Hartland March 2010
9 Hartland Date: Day number: 060 Date: Day number: 061 Hour (UT)
10 Hartland Date: Day number: 062 Date: Day number: 063 Hour (UT)
11 Hartland Date: Day number: 064 Date: Day number: 065 Hour (UT)
12 Hartland Date: Day number: 066 Date: Day number: 067 Hour (UT)
13 Hartland Date: Day number: 068 Date: Day number: 069 Hour (UT)
14 Hartland Date: Day number: 070 Date: Day number: 071 Hour (UT)
15 Hartland Date: Day number: 072 Date: Day number: 073 Hour (UT)
16 Hartland Date: Day number: 074 Date: Day number: 075 Hour (UT)
17 Hartland Date: Day number: 076 Date: Day number: 077 Hour (UT)
18 Hartland Date: Day number: 078 Date: Day number: 079 Hour (UT)
19 Hartland Date: Day number: 080 Date: Day number: 081 Hour (UT)
20 Hartland Date: Day number: 082 Date: Day number: 083 Hour (UT)
21 Hartland Date: Day number: nT 30nT Date: Day number: 085 Hour (UT)
22 Hartland Date: Day number: 086 Date: Day number: 087 Hour (UT)
23 Hartland Date: Day number: nT Date: Day number: 089 Hour (UT)
24 Hartland Date: Day number: 090
25 Hartland Observatory: Declination (degrees) Rotn Apr09 May 2398 Jun 2399 Jul 2400 Aug Sep 2403 Oct 2404 Nov 2405 Dec 2406 Jan Feb 2408 Mar Hourly Mean Values Plotted By Bartels Solar Rotation Number
26 Hartland Observatory: Horizontal Intensity (nt) Rotn Apr09 May 2398 Jun 2399 Jul 2400 Aug Sep 2403 Oct 2404 Nov 2405 Dec 2406 Jan Feb 2408 Mar Hourly Mean Values Plotted By Bartels Solar Rotation Number
27 Hartland Observatory: Vertical Intensity (nt) Rotn Apr09 May 2398 Jun 2399 Jul 2400 Aug Sep 2403 Oct 2404 Nov 2405 Dec 2406 Jan Feb 2408 Mar Hourly Mean Values Plotted By Bartels Solar Rotation Number
28 Hartland Observatory 2010 Daily Mean Declination (deg) min Daily Mean Horizontal Intensity (nt) nT Daily Mean Vertical Intensity (nt) 50nT Daily Mean Total Intensity (nt) nT Jan Feb Mar Apr May Jun Jul Aug Sep Oct Nov Dec
29 Monthly Mean Values for Hartland Observatory 2010 Month D H I X Y Z F January nt nt nt nt nt February nt nt nt nt nt March nt nt nt nt nt Note i. The values shown here are provisional.

30 INDICES OF GEOMAGNETIC ACTIVITY K - INDICES FOR THREE-HOUR INTERVAL Day
31 The aa Index Date Day 3-hourly aa-indices Aa am Aa pm Aa Monthly mean value = 10.0 Notes i. The units of the aa index are nt. ii. The 3-hour aa values are rounded to the nearest integer. Where aa = *.5, aa is rounded down. iii. Daily values (Aa am, Aa pm and Aa) are computed from aa values of original resolution. iv. The monthly mean value is computed from the daily mean values, Aa. v. Definitive aa indices are derived and published by the International Service for Geomagnetic Indices.
32 HARTLAND RAPID VARIATIONS SIs and SSCs Date Time (UT) Type Quality H (nt) D (min) Z (nt) SSC C SI* B SSC* B Notes: An asterisk (*) indicates that the principal impulse was preceded by a smaller reversed impulse. The quality of the event is classified as follows: A = very distinct B = fair, ordinary, but unmistakable C = doubtful The amplitudes given are for the first chief movement of the event. SFEs Date Universal Time H (nt) D (min) Z (nt) Start Maximum End NONE Note: The amplitudes given are for the first chief movement of the event.
BRITISH GEOLOGICAL SURVEY Hartland Observatory Monthly Magnetic Bulletin June /06/HA
 BRITISH GEOLOGICAL SURVEY Hartland Observatory Monthly Magnetic Bulletin June 2016 16/06/HA HARTLAND OBSERVATORY MAGNETIC DATA 1. Introduction Hartland observatory is one of three geomagnetic observatories
Monthly Magnetic Bulletin March 2010
 BRITISH GEOLOGICAL SURVEY Eskdalemuir Observatory Monthly Magnetic Bulletin March 2010 10/03/ES Crown copyright; Ordnance Survey ESKDALEMUIR OBSERVATORY MAGNETIC DATA 1. Introduction Eskdalemuir observatory
BRITISH GEOLOGICAL SURVEY Lerwick Observatory Monthly Magnetic Bulletin September /09/LE
 BRITISH GEOLOGICAL SURVEY Lerwick Observatory Monthly Magnetic Bulletin September 2010 10/09/LE LERWICK OBSERVATORY MAGNETIC DATA 1. Introduction Lerwick observatory is one of three geomagnetic observatories
Monthly Geomagnetic Bulletin
 HARTLAND OBSERVATORY Monthly Geomagnetic Bulletin BRISTOL CHANNEL December 2002 02/12/HA Hartland NERC 2002 1. HARTLAND OBSERVATORY MAGNETIC DATA 1.1 Introduction This bulletin is published to meet the
Monthly Magnetic Bulletin
 BRITISH GEOLOGICAL SURVEY Ascension Island Observatory Monthly Magnetic Bulletin March 2017 17/03/AS Crown copyright; Ordnance Survey ASCENSION ISLAND OBSERVATORY MAGNETIC DATA 1. Introduction Ascension
Monthly Magnetic Bulletin
 BRITISH GEOLOGICAL SURVEY Jim Carrigan Observatory Prudhoe Bay Monthly Magnetic Bulletin May 2014 14/05/JC JIM CARRIGAN OBSERVATORY MAGNETIC DATA 1. Introduction Jim Carrigan observatory is the fourth
KING EDWARD POINT OBSERVATORY MAGNETIC DATA
 BRITISH GEOLOGICAL SURVEY King Edward d Point Observatory Monthly Magnetic Bulletin May 2018 18/05/KE King Edward Point (UK) Maps British Antarctic Survey KING EDWARD POINT OBSERVATORY MAGNETIC DATA 1.
KING EDWARD POINT OBSERVATORY MAGNETIC DATA
 BRITISH GEOLOGICAL SURVEY King Edward d Point Observatory Monthly Magnetic Bulletin September 2018 18/09/KE King Edward Point (UK) Maps British Antarctic Survey KING EDWARD POINT OBSERVATORY MAGNETIC DATA
Monthly Magnetic Bulletin
 BRITISH GEOLOGICAL SURVEY Port Stanley Observatory Monthly Magnetic Bulletin July 2011 11/07/PS Jason Islands West Falkland King George Bay Queen Charlotte Bay Weddell Island Caracass Island Saunders Island
KING EDWARD POINT OBSERVATORY MAGNETIC DATA
 BRITISH GEOLOGICAL SURVEY King Edward d Point Observatory Monthly Magnetic Bulletin October 2018 18/10/KE King Edward Point (UK) Maps British Antarctic Survey KING EDWARD POINT OBSERVATORY MAGNETIC DATA
Monthly Magnetic Bulletin
 BRITISH GEOLOGICAL SURVEY Fort McMurray Observatory Monthly Magnetic Bulletin March 2017 17/03/FM Fort McMurray FORT McMURRAY OBSERVATORY MAGNETIC DATA 1. Introduction The British Geological Survey (BGS)
Monthly Magnetic Bulletin
 BRITISH GEOLOGICAL SURVEY Fort McMurray Observatory Monthly Magnetic Bulletin February 2016 16/02/FM Fort McMurray FORT McMURRAY OBSERVATORY MAGNETIC DATA 1. Introduction The British Geological Survey
Monthly Magnetic Bulletin
 BRITISH GEOLOGICAL SURVEY Port Stanley Observatory Monthly Magnetic Bulletin July 2010 10/07/PS Jason Islands a ar C West Falkland Kin gg eor ge B Port Salavador ay Weddell Island Mount Osborne So un d
Monthly Magnetic Bulletin
 BRITISH GEOLOGICAL SURVEY Ascension Island Observatory Monthly Magnetic Bulletin December 2008 08/12/AS Crown copyright; Ordnance Survey ASCENSION ISLAND OBSERVATORY MAGNETIC DATA 1. Introduction Ascension
Monthly Magnetic Bulletin
 BRITISH GEOLOGICAL SURVEY Port Stanley Observatory Monthly Magnetic Bulletin July 2009 09/07/PS Jason Islands a ar C West Falkland Kin gg eor ge B Port Salavador ay Weddell Island Mount Osborne So un d
Monthly Magnetic Bulletin
 BRITISH GEOLOGICAL SURVEY Port Stanley Observatory Monthly Magnetic Bulletin May 2009 09/05/PS Jason Islands a ar C West Falkland Kin gg eor ge B Port Salavador ay Weddell Island Mount Osborne So un d
Monthly Magnetic Bulletin
 BRITISH GEOLOGICAL SURVEY Port Stanley Observatory Monthly Magnetic Bulletin April 2009 09/04/PS Jason Islands a ar C West Falkland Kin gg eor ge B Port Salavador ay Weddell Island Mount Osborne So un
Monthly Magnetic Bulletin
 BRITISH GEOLOGICAL SURVEY Port Stanley Observatory Monthly Magnetic Bulletin December 2007 07/12/PS Jason Islands a ar C West Falkland Kin gg eor ge B Port Salavador ay Weddell Island Mount Osborne So
Hermanus Magnetic Observatory
 Hermanus Magnetic Observatory A facility of the National Research Foundation Magnetic Results 2009 Hermanus, Hartebeesthoek and Keetmanshoop observatories 1. INTRODUCTION The Hermanus Magnetic Observatory
Monthly Magnetic Bulletin August 2011
 BRITISH GEOLOGICAL SURVEY Eskdalemuir Observatory Monthly Magnetic Bulletin August 2011 11/08/ES Crown copyright; Ordnance Survey ESKDALEMUIR OBSERVATORY MAGNETIC DATA 1. Introduction Eskdalemuir o bservatory
BRITISH GEOLOGICAL SURVEY Lerwick Observatory Monthly Magnetic Bulletin August /08/LE
 BRITISH GEOLOGICAL SURVEY Lerwick Observatory Monthly Magnetic Bulletin August 2011 11/08/LE LERWICK OBSERVATORY MAGNETIC DATA 1. Introduction Lerwick observatory i s o ne o f t hree g eomagnetic observatories
Monthly Magnetic Bulletin November 2009
 BRITISH GEOLOGICAL SURVEY Eskdalemuir Observatory Monthly Magnetic Bulletin November 2009 09 /11/ES Crown copyright; Ordnance Survey ESKDALEMUIR OBSERVATORY MAGNETIC DATA 1. Introduction This bulletin
Monthly Magnetic Bulletin
 BRITISH GEOLOGICAL SURVEY Eskdalemuir Observatory Monthly Magnetic Bulletin 20 10/1 /ES Crown copyright; Ordnance Survey ESKDALEMUIR OBSERVATORY MAGNETIC DATA 1. Introduction Eskdalemuir obs ervatory i
Magnetic field nomenclature
 Magnetic field nomenclature Declination trend angle between horizontal projection of F and true North Inclination plunge angle between horizontal and F Magnetic equator location on surface where field
_ falian GEOMAGNETISM REPORT
 blications compactus w u t; n :0 o c r ir. iifc _ falian GEOMAGNETISM REPORT MAGNETIC OBSERVATORIES VOLUME 40 No.6 JUNE 1992 BUREAU OF MINERAL RESOURCES, GEOLOGY & GEOPHYSICS DEPARTMENT OF PRIMARY INDUSTRIES
RECOMMENDATIONS FOR EUROPEAN MAGNETIC REPEAT STATION SURVEYS
 RECOMMENDATIONS FOR EUROPEAN MAGNETIC REPEAT STATION SURVEYS Andrzej Sas Uhrynowski, Monika Korte, Jean Jacques Schott and Gerhard Schwarz, Coordination Committee for common European repeat station surveys.
Correct normalization of the Dst index
 Astrophys. Space Sci. Trans., 4, 41 4, 8 www.astrophys-space-sci-trans.net/4/41/8/ Author(s) 8. This work is licensed under a Creative Commons License. Astrophysics and Space Sciences Transactions Correct
Establishment of Abdus Salam Geomagnetic Observatory Sonmiani, Pakistan: Site Selection to INTERMAGNET Certification
 Pakistan Space & Upper Atmosphere Research Commission Establishment of Abdus Salam Geomagnetic Observatory Sonmiani, Pakistan: Site Selection to INTERMAGNET Certification G. Murtaza Space Science Department
INVESTIGATIONS OF THE STRUCTURE OF THE DIURNAL VARIATIONS OF GEOMAGNETIC FIELD
 Geologica Macedonica, Vol. 26, No. 1, pp. 37 51 (2012) GEOME 2 ISSN 0352 1206 Manuscript received: May 6, 2012 UDC: 556.385 Accepted: October 10, 2012 Original scientific paper INVESTIGATIONS OF THE STRUCTURE
Annual Report of New Zealand Magnetic Observatories, 2007
 Annual Report of New Zealand Magnetic Observatories, 2007 INTRODUCTION There were no significant changes to the equipment used in the magnetic observatories in 2007. The new fluxgate at Scott Base continued
SOUTH AFRICAN TIDE TABLES
 SAN HO-2 2018 SOUTH AFRICAN TIDE TABLES PUBLISHED BY THE HYDROGRAPHER SOUTH AFRICAN NAVY PRIVATE BAG X1 TOKAI, 7966 COPYRIGHT RESERVED ISBN 978-0-9869717-9-2 CONTENTS Preface.... (iii) Tidal Levels......(iv)
Study of Geomagnetic Field Variations at Low Latitude of African Equatorial Region
 Study of Geomagnetic Field Variations at Low Latitude of African Equatorial Region Agbo G. A 1 ; Azi A. O. 2, Okoro N. O. 3 Industrial Physics Department, Ebonyi State University, P.M.B 053 Abakaliki Abstract:
Center Data Analysis Service supported by the FAGS
 Solar Influences Data analysis Center Data Analysis Service supported by the FAGS SUNSPOT BULLETIN 2 n Provisional international and normalized hemispheric daily sunspot numbers for September 2 computed
The geomagnetic indices: derivation, meaning, and availability
 The geomegnetic indices: derivation, meaning and availability The geomagnetic indices: derivation, meaning, and availability Michel MENVIELLE C.E.T.P., 4, Avenue de Neptune, F-94107 SAINT MAUR DES FOSSES,
GEOPHYSICAL OBSERVATORY REPORT
 (LENDING SECTION) GEOPHYSICAL OBSERVATORY REPORT V M «> 'j. 3 O. - MAGNETIC OBSERVATORIES VOLUME 34 Na 12 DECEMBER 1986 ;, ' L J OF MINERAL RESOURCES, GEOLOGY & GEOPHYSICS DEPARTMENT OF RESOURCES RND ENERGY
SOUTH AFRICAN TIDE TABLES
 SAN HO-2 2019 SOUTH AFRICAN TIDE TABLES PUBLISHED BY THE HYDROGRAPHER SOUTH AFRICAN NAVY PRIVATE BAG X1 TOKAI, 7966 COPYRIGHT RESERVED ISBN 978-0-9947002-0-9 Intentionally left blank CONTENTS Preface....
A new reconstruction of the Dst index for
 A new reconstruction of the Dst index for 1932-2002 A. Karinen, K. Mursula To cite this version: A. Karinen, K. Mursula. A new reconstruction of the Dst index for 1932-2002. Annales Geophysicae, European
Gan Magnetic Observatory Annual Report
 Gan Magnetic Observatory Maldive Islands South Indian Ocean 2013 Annual Report Aerial view of the island of Gan, the observatory is located below the runway approximately at its midpoint 1 List of Contents
Space Weather. S. Abe and A. Ikeda [1] ICSWSE [2] KNCT
![Space Weather. S. Abe and A. Ikeda [1] ICSWSE [2] KNCT](/thumbs/89/99030303.jpg "Space Weather. S. Abe and A. Ikeda [1] ICSWSE [2] KNCT") Space Weather S. Abe and A. Ikeda [1] ICSWSE [2] KNCT Outline Overview of Space Weather I. Space disasters II. Space weather III. Sun IV. Solar wind (interplanetary space) V. Magnetosphere VI. Recent Space
Space Weather S. Abe and A. Ikeda [1] ICSWSE [2] KNCT Outline Overview of Space Weather I. Space disasters II. Space weather III. Sun IV. Solar wind (interplanetary space) V. Magnetosphere VI. Recent Space
Geomagnetic Calibration of Sunspot Numbers
 Geomagnetic Calibration of Sunspot Numbers Leif Svalgaard Stanford University 2 nd SSN Workshop, Brussels, May 212 1 Wolf s Several Lists of SSNs During his life Wolf published several lists of his Relative
Geomagnetic Disturbance Report Reeve Observatory
 Event type: Geomagnetic disturbances due to recurrent coronal hole high-speed stream Background: This background section defines the events covered. A coronal hole is a large dark region of less dense
Geomagnetic Disturbance Report Reeve Observatory
 Event type: Various geomagnetic disturbances including coronal hole high-speed stream, coronal mass ejection, sudden impulse and reverse shock effects Background: This background section defines the various
CHAPTER 2 DATA. 2.1 Data Used
 CHAPTER DATA For the analysis, it is required to use geomagnetic indices, which are representatives of geomagnetic activity, and Interplanetary Magnetic Field (IMF) data in addition to f F,which is used
GAMINGRE 8/1/ of 7
 FYE 09/30/92 JULY 92 0.00 254,550.00 0.00 0 0 0 0 0 0 0 0 0 254,550.00 0.00 0.00 0.00 0.00 254,550.00 AUG 10,616,710.31 5,299.95 845,656.83 84,565.68 61,084.86 23,480.82 339,734.73 135,893.89 67,946.95
V r : A new index to represent the variation rate of geomagnetic activity
 Earthq Sci (2010)23: 343 348 343 Doi: 10.1007/s11589-010-0731-9 V r : A new index to represent the variation rate of geomagnetic activity Dongmei Yang 1, Yufei He 1 Chuanhua Chen 2 and Jiadong Qian 3 1
Outline. The Path of the Sun. Emissivity and Absorptivity. Average Radiation Properties II. Average Radiation Properties
 The Path of the Sun Larry Caretto Mechanical Engineering 83 Alternative Energy Engineering II March, 2 Outline Review radiation properties for solar collectors Orientation of earth and sun Earth-based
Computing & Telecommunications Services Monthly Report January CaTS Help Desk. Wright State University (937)
") January 215 Monthly Report Computing & Telecommunications Services Monthly Report January 215 CaTS Help Desk (937) 775-4827 1-888-775-4827 25 Library Annex helpdesk@wright.edu www.wright.edu/cats/ Last
January 215 Monthly Report Computing & Telecommunications Services Monthly Report January 215 CaTS Help Desk (937) 775-4827 1-888-775-4827 25 Library Annex helpdesk@wright.edu www.wright.edu/cats/ Last
Technical note on seasonal adjustment for M0
 Technical note on seasonal adjustment for M0 July 1, 2013 Contents 1 M0 2 2 Steps in the seasonal adjustment procedure 3 2.1 Pre-adjustment analysis............................... 3 2.2 Seasonal adjustment.................................
NATIONAL ANTARCTIC RESEARCH PROGRAM. Terra Nova Bay, Antarctica Geomagnetic Observatory
 NATIONAL ANTARCTIC RESEARCH PROGRAM Terra Nova Bay, Antarctica Geomagnetic Observatory Magnetic Observation Results 2007-2008 L. Cafarella, S. Lepidi, A. Meloni, P. Palangio, M. Pietrolungo and L. Santarelli
Time Series Analysis
 Time Series Analysis A time series is a sequence of observations made: 1) over a continuous time interval, 2) of successive measurements across that interval, 3) using equal spacing between consecutive
Exercise 6. Solar Panel Orientation EXERCISE OBJECTIVE DISCUSSION OUTLINE. Introduction to the importance of solar panel orientation DISCUSSION
 Exercise 6 Solar Panel Orientation EXERCISE OBJECTIVE When you have completed this exercise, you will understand how the solar illumination at any location on Earth varies over the course of a year. You
REPORT ON LABOUR FORECASTING FOR CONSTRUCTION
 REPORT ON LABOUR FORECASTING FOR CONSTRUCTION For: Project: XYZ Local Authority New Sample Project Contact us: Construction Skills & Whole Life Consultants Limited Dundee University Incubator James Lindsay
Solar Flare Durations
 Solar Flare Durations Whitham D. Reeve 1. Introduction Scientific investigation of solar flares is an ongoing pursuit by researchers around the world. Flares are described by their intensity, duration
Scarborough Tide Gauge
 Tide Gauge Location OS: 504898E 488622N WGS84: Latitude: 54 16' 56.990"N Longitude: 00 23' 25.0279"W Instrument Valeport 740 (Druck Pressure Transducer) Benchmarks Benchmark Description TGBM = 4.18m above
Geomagnetic storms. Measurement and forecasting
 Geomagnetic storms. Measurement and forecasting Anna Gustavsson 17 October 2006 Project of the Space Physics Course 2006 Umeå University 1 Introduction Effects of magnetic storms on technology Geomagnetic
Wind Resource Data Summary Cotal Area, Guam Data Summary and Transmittal for December 2011
 Wind Resource Data Summary Cotal Area, Guam Data Summary and Transmittal for December 2011 Prepared for: GHD Inc. 194 Hernan Cortez Avenue 2nd Floor, Ste. 203 Hagatna, Guam 96910 January 2012 DNV Renewables
WIND DATA REPORT. Vinalhaven
 WIND DATA REPORT Vinalhaven April 1, 2004 June 30, 2004 Prepared for Fox Islands Electric Cooperative By Melissa L. Ray Anthony L. Rogers April 4, 2005 Renewable Energy Research Laboratory 160 Governors
Solar and Interplanetary Disturbances causing Moderate Geomagnetic Storms
 J. Astrophys. Astr. (2008) 29, 263 267 Solar and Interplanetary Disturbances causing Moderate Geomagnetic Storms Santosh Kumar, M. P. Yadav & Amita Raizada Department of P.G. Studies and Research in Physics
This document is a preview generated by EVS
 INTERNATIONAL STANDARD ISO 16698 First edition 2013-05-01 Space environment (natural and artificial) Methods for estimation of future geomagnetic activity Environnement spatial (naturel et artificiel)
WIND DATA REPORT. Vinalhaven
 WIND DATA REPORT Vinalhaven July 1, 2004 September 30, 2004 Prepared for Fox Islands Electric Cooperative By Melissa L. Ray Anthony L. Rogers April 4, 2005 Renewable Energy Research Laboratory 160 Governors
Sales Analysis User Manual
 Sales Analysis User Manual Confidential Information This document contains proprietary and valuable, confidential trade secret information of APPX Software, Inc., Richmond, Virginia Notice of Authorship
ENGINE SERIAL NUMBERS
 ENGINE SERIAL NUMBERS The engine number was also the serial number of the car. Engines were numbered when they were completed, and for the most part went into a chassis within a day or so. However, some
SYSTEM BRIEF DAILY SUMMARY
 SYSTEM BRIEF DAILY SUMMARY * ANNUAL MaxTemp NEL (MWH) Hr Ending Hr Ending LOAD (PEAK HOURS 7:00 AM TO 10:00 PM MON-SAT) ENERGY (MWH) INCREMENTAL COST DAY DATE Civic TOTAL MAXIMUM @Max MINIMUM @Min FACTOR
Location. Datum. Survey. information. Etrometa. Step Gauge. Description. relative to Herne Bay is -2.72m. The site new level.
 Tide Gauge Location OS: 616895E 169377N WGS84: Latitude: 51 o 22.919196 N Longitude: 01 o 6.9335907 E Instrument Type Etrometa Step Gauge Benchmarks Benchmark TGBM = 5.524m above Ordnance Datum Newlyn
Statistical Characterization of Geomagnetic Variation in Nigeria
 IOSR Journal of Applied Geology and Geophysics (IOSR-JAGG) e-issn: 2321 99, p-issn: 2321 982.Volume 4, Issue 6 Ver. II (Nov-Dec. 216), PP 1-2 www.iosrjournals.org Statistical Characterization of Geomagnetic
Results of Geomagnetic Observations Belsk, Hel, Hornsund, 2008
 PUBLS. INST. GEOPHYS. POL. ACAD. SC., C-102 (409), 2009 Results of Geomagnetic Observations Belsk, Hel, Hornsund, 2008 Jan REDA, Mariusz NESKA and Stanisław WÓJCIK Institute of Geophysics, Polish Academy
Comparative study of solar and geomagnetic indices for the solar cycle 22 and 23 C. M Tiwari Dept. of Physics, APS University, Rewa (M. P.
 International Association of Scientific Innovation and Research (IASIR) (An Association Unifying the Sciences, Engineering, and Applied Research) International Journal of Emerging Technologies in Computational
Site Description: Tower Site
 Resource Summary for Elizabeth Site Final Report Colorado Anemometer Loan Program Monitoring Period: 7/3/06 /26/07 Report Date: January, 0 Site Description: The site is.6 miles northeast of the town of
Geomagnetic Calibration of Sunspot Numbers. Leif Svalgaard HEPL, Stanford University SSN-Workshop, Sunspot, NM, Sept. 2011
 Geomagnetic Calibration of Sunspot Numbers Leif Svalgaard HEPL, Stanford University SSN-Workshop, Sunspot, NM, Sept. 2011 1 Wolf s Several Lists of SSNs During his life Wolf published several lists of
Sunspot Index and Long-term Solar Observations World Data Center supported by the ICSU - WDS
 Sunspot Index and Long-term Solar Observations World Data Center supported by the ICSU - WDS 2016 n 7 WARNING OF MAJOR DATA CHANGE Over the past 4 years a community effort has been carried out to revise
2.1 Inductive Reasoning Ojectives: I CAN use patterns to make conjectures. I CAN disprove geometric conjectures using counterexamples.
 2.1 Inductive Reasoning Ojectives: I CAN use patterns to make conjectures. I CAN disprove geometric conjectures using counterexamples. 1 Inductive Reasoning Most learning occurs through inductive reasoning,
Chiang Rai Province CC Threat overview AAS1109 Mekong ARCC
 Chiang Rai Province CC Threat overview AAS1109 Mekong ARCC This threat overview relies on projections of future climate change in the Mekong Basin for the period 2045-2069 compared to a baseline of 1980-2005.
EXTREMELY QUIET 2009 STATE OF GEOMAGNETIC FIELD AS A REFERENCE LEVEL FOR AMPLITUDE OF THE LOCAL GEOMAGNETIC DISTURBANCES
 EXTREMELY QUIET 2009 STATE OF GEOMAGNETIC FIELD AS A REFERENCE LEVEL FOR AMPLITUDE OF THE LOCAL GEOMAGNETIC DISTURBANCES A.E. Levitin, L.I. Gromova, S.V. Gromov, L.A. Dremukhina Pushkov Institute of Terrestrial
Computing & Telecommunications Services
 Computing & Telecommunications Services Monthly Report September 214 CaTS Help Desk (937) 775-4827 1-888-775-4827 25 Library Annex helpdesk@wright.edu www.wright.edu/cats/ Table of Contents HEAT Ticket
NATIONAL ANTARCTIC RESEARCH PROGRAM. Terra Nova Bay, Antarctica Geomagnetic Observatory
 NATIONAL ANTARCTIC RESEARCH PROGRAM Terra Nova Bay, Antarctica Geomagnetic Observatory Magnetic Observation Results 2009-2010 L. Cafarella, S. Lepidi, A. Meloni, P. Palangio, M. Pietrolungo L. Santarelli
particular regional weather extremes
 SUPPLEMENTARY INFORMATION DOI: 1.138/NCLIMATE2271 Amplified mid-latitude planetary waves favour particular regional weather extremes particular regional weather extremes James A Screen and Ian Simmonds
Mars Atmosphere and Volatile Evolution Mission (MAVEN) Status of the MAVEN Mission at Mars 18 May 2018
 Status of the MAVEN Mission at Mars 18 May 2018") Mars Atmosphere and Volatile Evolution Mission (MAVEN) Status of the MAVEN Mission at Mars 18 May 2018 Bruce Jakosky Laboratory for Atmospheric and Space Physics University of Colorado at Boulder USA MAVEN
Mars Atmosphere and Volatile Evolution Mission (MAVEN) Status of the MAVEN Mission at Mars 18 May 2018 Bruce Jakosky Laboratory for Atmospheric and Space Physics University of Colorado at Boulder USA MAVEN
WYANDOTTE MUNICIPAL SERVICES COMMUNITY WIND ENERGY PROJECT WIND RESOUCE SUMMARY
 WYANDOTTE MUNICIPAL SERVICES COMMUNITY WIND ENERGY PROJECT WIND RESOUCE SUMMARY MONTHLY REPORT October 15, 2007 Black & Veatch Project: 144374 Prepared by: Black & Veatch Corporation 6300 S. Syracuse Way
WIND DATA REPORT FOR THE YAKUTAT JULY 2004 APRIL 2005
 WIND DATA REPORT FOR THE YAKUTAT JULY 2004 APRIL 2005 Prepared on July 12, 2005 For Bob Lynette 212 Jamestown Beach Lane Sequim WA 98382 By John Wade Wind Consultant LLC 2575 NE 32 nd Ave Portland OR 97212
STCE Newsletter. 29 Jan Feb 2018
 STCE Newsletter 29 Jan 2018-4 Feb 2018 Published by the STCE - this issue : 8 Feb 2018. Available online at http://www.stce.be/newsletter/. The Solar-Terrestrial Centre of Excellence (STCE) is a collaborative
TILT, DAYLIGHT AND SEASONS WORKSHEET
 TILT, DAYLIGHT AND SEASONS WORKSHEET Activity Description: Students will use a data table to make a graph for the length of day and average high temperature in Utah. They will then answer questions based
Space environment (natural and artificial) Realtime solar activity and space environment information for spacecraft operation
 Realtime solar activity and space environment information for spacecraft operation") ISO 2008 All rights reserved ISO TC 20/SC 14 N873 Date: 2012-07-31 ISO/CDV 16709 ISO TC 20/SC 14/WG 4 Secretariat: Space environment (natural and artificial) Realtime solar activity and space environment
ISO 2008 All rights reserved ISO TC 20/SC 14 N873 Date: 2012-07-31 ISO/CDV 16709 ISO TC 20/SC 14/WG 4 Secretariat: Space environment (natural and artificial) Realtime solar activity and space environment
peak half-hourly New South Wales
 Forecasting long-term peak half-hourly electricity demand for New South Wales Dr Shu Fan B.S., M.S., Ph.D. Professor Rob J Hyndman B.Sc. (Hons), Ph.D., A.Stat. Business & Economic Forecasting Unit Report
IMPROVING THE ACCURACY OF RUNWAY ALLOCATION IN AIRCRAFT NOISE PREDICTION
 IMPROVING THE ACCURACY OF RUNWAY ALLOCATION IN AIRCRAFT NOISE PREDICTION David G. Southgate and Jonathan P. Firth Aviation Operations, Dept of Transport and Regional Services (DOTARS), Canberra, Australia
Calculations Equation of Time. EQUATION OF TIME = apparent solar time - mean solar time
 Calculations Equation of Time APPARENT SOLAR TIME is the time that is shown on sundials. A MEAN SOLAR DAY is a constant 24 hours every day of the year. Apparent solar days are measured from noon one day
Presented by Dr. Clezio Marcos De Nardin. Head of the Embrace Space Weather Program (INPE/CEA-LAC-DSS-CPTEC)
") For the occasion of the 54th Session of the Technical and Scientific Subcommittee of COPUOS held in Vienna, Austria from January30th to February 11 th, 2017. Presented by Dr. Clezio Marcos De Nardin Head
For the occasion of the 54th Session of the Technical and Scientific Subcommittee of COPUOS held in Vienna, Austria from January30th to February 11 th, 2017. Presented by Dr. Clezio Marcos De Nardin Head
Determine the trend for time series data
 Extra Online Questions Determine the trend for time series data Covers AS 90641 (Statistics and Modelling 3.1) Scholarship Statistics and Modelling Chapter 1 Essent ial exam notes Time series 1. The value
Sunspot Index and Long-term Solar Observations World Data Center supported by the ICSU - WDS
 Sunspot Index and Long-term Solar Observations World Data Center supported by the ICSU - WDS 2016 n 6 WARNING OF MAJOR DATA CHANGE Over the past 4 years a community effort has been carried out to revise
How to find Sun's GHA using TABLE How to find Sun's Declination using TABLE 4...4
 1 of 8 How to use- TABLE 4. - GHA and Declination of the Sun for the Years 2001 to 2036- Argument Orbit Time How to find Sun's GHA using TABLE 4... 2 How to find Sun's Declination using TABLE 4...4 Before
Mountain View Community Shuttle Monthly Operations Report
 Mountain View Community Shuttle Monthly Operations Report December 6, 2018 Contents Passengers per Day, Table...- 3 - Passengers per Day, Chart...- 3 - Ridership Year-To-Date...- 4 - Average Daily Ridership
Candidate Number. General Certificate of Secondary Education Higher Tier June 2012
 Centre Number Surname Candidate Number For Examiner s Use Other Names Candidate Signature Examiner s Initials General Certificate of Secondary Education Higher Tier June 2012 Pages 2 3 4 5 Mark Mathematics
GEOPHYSICAL OBSERVATORY REPORT
 COMMONWEALTH OF AUSTRALIA DEPARTMENT OF NATIONAL DEVELOPMENT BUREAU OF MINERAL RESOURCES, GEOLOGY AND GEOPHYSICS ^^.^fi GEOPHYSICAL OBSERVATORY REPORT
Stream Discharge and the Water Budget
 Regents Earth Science Unit 6: Water Cycle & Climate Name: Lab # Stream Discharge and the Water Budget Introduction: The United States Geological Survey (USGS) measures and publishes values for the daily
Multi dimensional scaling of geomagnetic Sq (H) variations
 variations") Indian Journal of Radio & Space Physics Vol. 38, June 2009, pp. 165-173 Multi dimensional scaling of geomagnetic Sq (H) variations M Sridharan 1,$,* & R Samuel Selvaraj 2 1 Magnetic Observatory, Indian
Indian Journal of Radio & Space Physics Vol. 38, June 2009, pp. 165-173 Multi dimensional scaling of geomagnetic Sq (H) variations M Sridharan 1,$,* & R Samuel Selvaraj 2 1 Magnetic Observatory, Indian
Geomagnetic Disturbances (GMDs) History and Prediction
 History and Prediction") Geomagnetic Disturbances (GMDs) History and Prediction J. Patrick Donohoe, Ph.D., P.E. Dept. of Electrical and Computer Engineering Mississippi State University Box 9571 Miss. State, MS 39762 donohoe@ece.msstate.edu
Geomagnetic Disturbances (GMDs) History and Prediction J. Patrick Donohoe, Ph.D., P.E. Dept. of Electrical and Computer Engineering Mississippi State University Box 9571 Miss. State, MS 39762 donohoe@ece.msstate.edu
L. Cafarella, S. Lepidi, A. Meloni, P. Palangio, M. Pietrolungo, L. Santarelli and A. Zirizzotti
 1$7,21$/$17$5&7,&5(6($5&+352*5$0 7HUUD1RYD%D\$QWDUFWLFD *HRPDJQHWLF2EVHUYDWRU\ 0DJQHWLF2EVHUYDWLRQ5HVXOWV L. Cafarella, S. Lepidi, A. Meloni, P. Palangio, M. Pietrolungo, L. Santarelli and A. Zirizzotti
Gan Magnetic Observatory. Maldive Islands South Indian Ocean Annual Report
 Gan Magnetic Observatory Maldive Islands South Indian Ocean 2016 Annual Report 1 Institut für Geophysik, Zürich Gan Magnetic Observatory Maldive Islands South Indian Ocean 2016 Annual Report Report Editor
SYSTEM BRIEF DAILY SUMMARY
 SYSTEM BRIEF DAILY SUMMARY * ANNUAL MaxTemp NEL (MWH) Hr Ending Hr Ending LOAD (PEAK HOURS 7:00 AM TO 10:00 PM MON-SAT) ENERGY (MWH) INCREMENTAL COST DAY DATE Civic TOTAL MAXIMUM @Max MINIMUM @Min FACTOR
Site Description: Tower Site
 Resource Summary for Fort Collins Site Final Report Colorado Anemometer Loan Program Monitoring Period: /0/00 11/03/007 Report Date: January 1, 00 Site Description: The site is located adjacent to the