Color images C1 C2 C3
|
|
|
- Silas Simmons
- 5 years ago
- Views:
Transcription
1 Color imaging
2 Color images C1 C2 C3 Each colored pixel corresponds to a vector of three values {C1,C2,C3} The characteristics of the components depend on the chosen colorspace (RGB, YUV, CIELab,..)

![n2] x [ G n, ]](/docs-images/89/98362116/images/3-1.jpg "1 n2 xb[ n1,")
3 Digital Color Images xr[ n1, n2] x [ G n, ] 1 n2 xb[ n1, n2]


4 Color channels Red Green Blue
5 Color channels Red Green Blue

6 Bayer matrix Typical sensor topology in CCD devices. The green is twice as numerous as red and blue.
7 Color imaging Color reproduction Printing, rendering Digital photography High dynamic range images Mosaicking Compensation for differences in illuminant (CAT: chromatic adaptation transforms) Post-processing Image enhancement Coding Quantization based on color CFSs (contrast sensitivity function) Downsampling of chromatic channels with respect to luminance
8 Color science Color vision Seeing colors Foundations of color vision Trichromatic model Colorimetry & Photometry Measuring colors: radiometric & photometric units Color naming Attaching labels to colors Applications Image rendering, cross-media color reproduction, image analysis, feature extraction, image classification, data mining...
 Physiology Phsychology E() ( ) ( ) Ci =")
: Spectral Power Distribution")
9 What is color? Physiscs Si() Physiology Phsychology E() ( ) ( ) Ci = E Si d Color representation S i (): sensitivity of the i th sensor E(): Spectral Power Distribution (SPD) of the diffused light Color perception
 } α material 1 β material")
10 Newton s prism sinα = n( ) sin{ β( ) } α material 1 β material 2
11 What is color? Radiometric quantities Physics (EM) Photometry& Colorimetry Photometric quantities (only concern the visible spectrum) Cognitive psychology (Color naming)
12 Color Human vision Color encoding (receptor level) Color perception (post-receptoral level) Color semantics (cognitive level) Colorimetry Spectral properties of radiation Physical properties of materials Color categorization and naming (understanding colors) MODELS Color vision (Seeing colors) Colorimetry (Measuring colors)


13 The physical perspective
14 Simultaneous contrast The perceptual perspective

15 Chromatic induction Color
16 Basic quantities Radiance: total amount of energy that flows from the light source Physical quantity measured in Watts [W] by a radiometer Luminance: measure of the amount of light emitted by the source that a person perceives Perceptual quantity measured in lumens [lm] it is assessed by weighting the light emitted by the source by the absorption curves of the standard subject Brightness: psychological quantity that is it impossible to measure objectively. It embodies the achromatic notion of intensity Psychological quantity
17 Color models A color model is a 3D unique representation of a color There are different color models and the use of one over the other is problem oriented. For instance RGB color model is used in hardware applications like PC monitors, cameras and scanners CMY color model is used in color printers YIQ model in television broadcast In color image manipulation the two models widely used are HSI and HSV Uniform color models (CIELAB, CIELUV) are used in color imaging [Gonzalez Chapter 6]
 HSI (Hue, Saturation, Intensity) HSL (Hue, Saturation,")
18 Color models User-oriented color models Emphasize the intuitive color notions of brightness, hue and saturation HSV (Hue, saturation, Value) HSI (Hue, Saturation, Intensity) HSL (Hue, Saturation, Lightness)
19 Color models Device-oriented color models The color representation depends on the device. Concerns both acquisition and display devices Acquisition The value of the color numerical descriptors depend on the spectral sensitivity of the camera sensors Display A color with given numerical descriptors appears different if displayed on another device or if the set-up changes In RGB for instance, the R,G and B components depend on the chosen red, green and blue primaries as well as on the reference white Amounts of ink expressed in CMYK or digitized video voltages expressed in RGB RGB, Y CbCr,Y UV, CMY, CMYK Towards device independence: srgb
20 Color models Colorimetric color models Based on the principles of trichromacy Allow to predict if two colors match in appearance in given observation conditions CIE XYZ Perceptually uniform color models (CIELAB, CIELUV)
21 Device-oriented color models

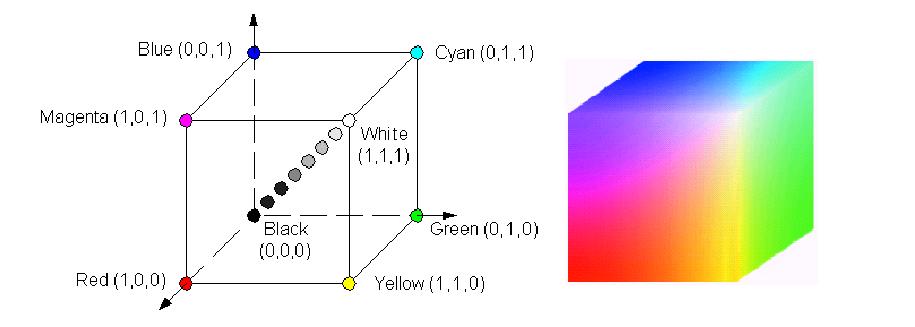
22 RGB color model Additive color model The additive reproduction process usually uses red, green and blue light to produce the other colors


23 RGB displays Each pixel on the screen is built by driving three small and very close but still separated RGB light sources. At common viewing distance, the separate sources are indistinguishable, which tricks the eye to see a given solid color. All the pixels together arranged in the rectangular screen surface conforms the color image. CRT LCD Close-up of red, green, and blue LEDs that form a single pixel in a large scale LED screen


24 RGB digital cameras CCD camera sensor with Bayer array Only one color channel is recorded in each physical location (pixel) Twice as many green sensors than red and blue Demosaicing is needed to recover full size images for the three color channels

25 RGB digital cameras CCD cameras with full color sensors The three color channels are recorded in each physical location (pixel)


26 RGB digital cameras Full color sensors Image as seen through a Bayer sensor Reconstructed image after demosaicing JPEG compression was added to the images
27 RGB model
![RGB model Normalized values in [0,1] (chromaticity coordinates) may be convenient for](/docs-images/89/98362116/images/28-0.jpg "some applications For a given device, the set of manageable colors lies inside the RGB")
28 RGB model Normalized values in [0,1] (chromaticity coordinates) may be convenient for some applications For a given device, the set of manageable colors lies inside the RGB cube
29 RGB model (0,0) A single pixel consists of three components = Final pixel in the image If R,G, and B are represented with 8 bits (24- bit RGB image), the total number of colors is =16,777,216
30 RGB Color Space


31 Exemple RGB Original Image G-Component R-Component B-Component False colors are used to represent the color channels, which all consists of gray values in the range [0,255]

32 Color channels Red Green Blue
33 Device-oriented color models: CYM(K) Cyan, Yellow and Magenta are the secondary colors of light or the primary colors of pigments Model of color subtraction Used in printing devices


34 CMY(K) Color subtraction Cyan, Magents, Yellow filters The Y filter removes B and transmits the R ang G The M filter removes G and transmits R and B The C filter removes R and transmits G and B Adjusting the transparency of these filters the amounts of R, G and B can be controlled cyan=white-red magenta=white-green yellow=white-blue
35 CMY model CMY (Cyan, Magenta, Yellow) Used in printing devices Subractive color synthesis CMYK: adding the black ink Equal amounts of C,M and Y should produce black, but in practice a dark brown results. A real black ink is then added to the printer
 absorbs blu CYM(K) = B G R Y M C 1 1")
36 cyan (C) absorbs red magenta (M) absorbs green yellow (Y) absorbs blu CYM(K) = B G R Y M C 1 1 1
37 CMY(K) model Red, Green, Blue are the primary colors of light Cyan, Magenta, Yellow are the Secondary colors of light Primary colors of pigments When a cyan-colored object is illuminated with white light, no red light will be reflected from its surface! Cyan subtracts red! The pigment when illuminated with white light absorbs its complementary color and reflects the others
38 User-oriented CM Color is encoded in a way that is most natural to humans for describing colors Based on the decoupling of chromatic and achromatic information One of the three axis represents the value or intensity on the blackwhite axis of the color dark- or bright- ness of the color The other two independent variables represent Hue, which qualifies the color as belonging to a category (ex: red, green) Saturation, or colorfulness, expressing how far the color is from neutral gray Can be thought of as a deformation of the RGB cube
39 User-oriented CM value They all are effectively the RGB space twisted so that the neutral diagonal becomes the lightness axis, the saturation the distance from the central lightness axis and the hue the position around the center. The only difference between these models is the measurement of saturation, or the strength of the colour
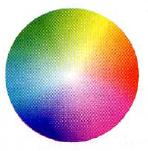
40 User-oriented CM HSV (Hue, Saturation, and Value). Sometimes variations include HSB (Brightness), HSL (Lightness/Luminosity), HSI (Intensity) The hue of a color places it on the color wheel where the color spectrum (rainbow) is evenly spaced The saturation or chroma of a hue defines its intensity Decreasing the saturation via a contrast control adds gray. The value of a hue defines how bright or dark a color is They all are effectively the RGB space twisted so that the neutral diagonal becomes the lightness axis, the saturation the distance from the central lightness axis and the hue the position around the center. The only difference between these models is the measurement of saturation, or the strength of the colour
41 HSI (HSV, HSL) Color Space Recall: Hue is color attribute that describes a pure color Saturation gives the measure to which degree the pure color is diluted by white light. 1. Intensity (Value or Lightness) component I (V,L), is decoupled from the cromaticity information! 2. Hue and saturation can be accessed independently from illumination
42 HSI
43 HSI model Two values (H & S) encode chromaticity Convenient for designing colors Hue H is defined by and angle between 0 and 2π: red at angle of 0; green at 2π/3; blue at 4π/3 Saturation S models the purity of the color S=1 for a completely pure or saturated color S=0 for a shade of gray
44 Color hexagon for HSI (HSV) Color is coded relative to the diagonal of the color cube. Hue is encoded as an angle, saturation is the relative distance from the diagonal, and intensity is height.
45 Variations on the theme The shape in the plan does not matter because the one can always be related to the other by a geometric transformation
46 Color hexacone for HSI (HSV) (Left) Projection of RGB cube perpendicular to the diagonal (0,0,0) (1,1,1). Color names now at vertices of a hexagon. Colors in HIS : intensity I is vertical axis hue H is angle with R at 0 saturation is 1 at periphery and 0 on I axis

47 HSI-like model Hue, Saturation, Value (HSV) model from


48 HSV, HSL Hue, Saturation, Value (Brightness) HSV cone HSV cylinder Hue, Saturation, Lightness
49 User-oriented CM: HSV
50 RGB to HSI
51 { } RGB,, 0,1 RGB 2 HSI θ is measured conterclockwise from the red axis { } H can be normalized to be in 0,1 by dividing by 360 { } The other values (for chroma and saturation) are in 0,1 The inverse formulas are also defined.

52 RGB vs HSI hue hue saturation intensity
53 User-oriented CM Drawbacks Singularities in the transform (such as undefined hue for achromatic points) Sensitivity to small deviations of RGB values near the singularities Numerical instability when operating on hue due to its angular nature
54 HSI Represention (0,0) A single pixel consists of three components. Each pixel is a Vector / Array = Pixel-Vector in the computer memory Final pixel in the image


55 Original Image HSI Examples Hue Saturation Intensity
 saturation value of each pixel increased")
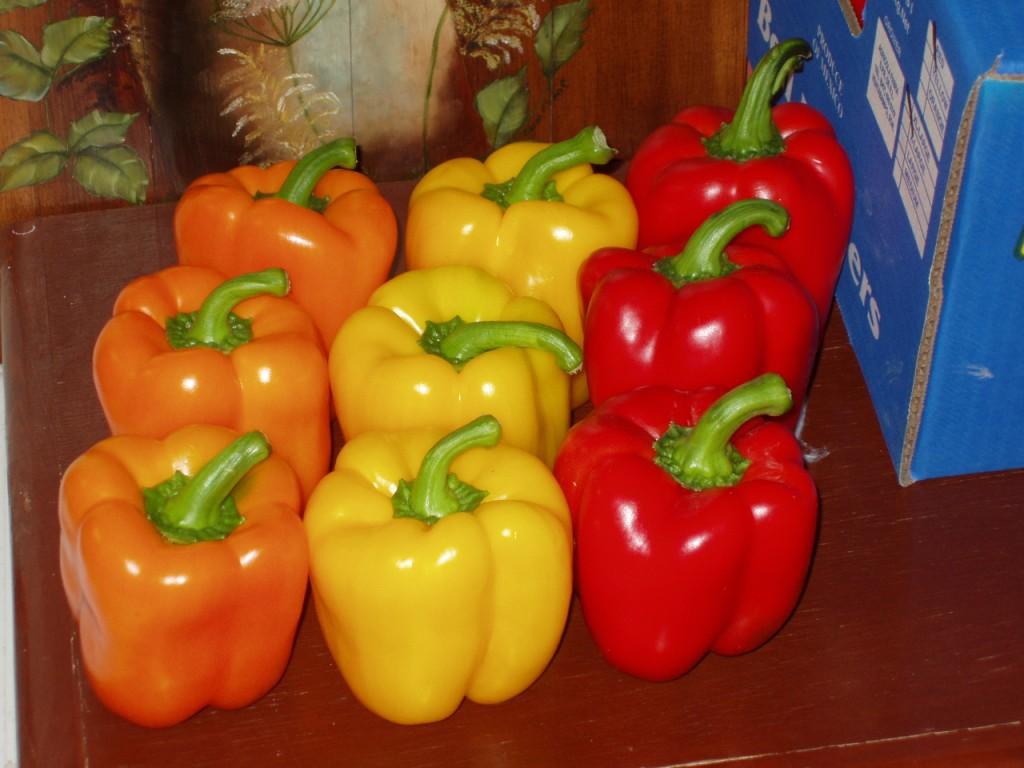
56 Editing saturation of colors (Left) Image of food originating from a digital camera; (center) saturation value of each pixel decreased 20%; (right) saturation value of each pixel increased 40%.
 to Y implies a non linear")
57 Opposite channels model Encode color images taking human perception into account RGB -> luminance + 2 chrominances Going from Y (physical entity) to Y implies a non linear operation
58 YUV Color model YUV color model imitates human vision. Implementation of the opposed channel model, also called luminance / chrominance color spaces Historically, YUV color space was developed to provide compatibility between color and black /white analog television systems. YUV color image information transmitted in the TV signal allowed proper reproducing an image contents at the both types of TV receivers, at the color TV sets as well as at the black / white TV sets. PAL TV standard YCbCr similar, used in JPEG and MPEG YCbCr color space is defined in the ITU-R BT [1] and ITU-R BT [2] standards of ITU (International Telecommunication Union). YIQ (similar) used in NTSC [1] RECOMMENDATION ITU-R BT.601-5, ; [2] RECOMMENDATION ITU-R BT.709-5,
59 YUV color model Color channels Y: luminance UV (Cb, Cr): chrominance. These are often downsampled exploiting the lowers cutting frequency and sensitivity of the human visual system with respect to the luminance component Conversion formulas from/to RGB are available in the literature and implemented in Matlab
60 YUV reppresentation (0,0) A single pixel consists of three components. Each pixel is a Vector / Array = Pixel-Vector in the computer memory Final pixel in the image Same Caution as before applies here!


61 Original Image YUV example Y-Component U-Component V-Component
62 YUV possible subsampling patterns

63 YIQ model NTSC (National Television Color System) Y is the luminance, meaning that light intensity is nonlinearly encoded based on gamma corrected RGB primaries The YIQ color space at Y=0.5. Note that the I and Q chroma coordinates are scaled up to 1.0
64 YIQ Chromaticity is represented by I and Q in phase and in quadrature components RGB2YIQ Y I Q = R G B
65 Colorimetric color models CIE-RGB CIE-XYZ CIELAB CIELUV
66 RGB color model Image formation Si() E() ( ) ( ) Ci = E Si d S i (): sensitivity of the i th sensor E(): Spectral Power Distribution (SPD) of the diffused light
67 Spectral sensitivities Target: (normalized) spectral sensitivities of the eye

68 Broad range sensitivity
69 Sensor sensitivity: Ex. 1 S 2 S 3 S 1
70 Spectral sensitivity: Ex. 2 S 2 S 3 S 1
71 i ( ) ( ) ( ) ( ) Ci = P Si d P S P( ) RGB model : PSD (Power Spectral Density of the incident light) : spectral sensitivity of the "red", "green" and "blue" sensors Intensity of the signals recorded by the camera in the three channels c c c ( ) ( ) R = k P S d 1 1 ( ) ( ) G = k P S d 2 2 ( ) ( ) B = k P S d 3 3 relative to the camera We need a PSD representing the white to calculate k1, k2 and k3 such that for that PSD (P()=E()) R c =G c =B c =1 (255). This is called the reference white
72 Reference white The reference white is the light source that is chosen to approximate the white light D65, D50
73 Reference white The reference white, E(), will be given the maximum tristimulus values in all channels (R c =G c =B c =255) The numerical values of the R,G,B coordinates of a generic PSD P() will depend on the choice of E() We neglect the pedices for easyness of notations Ec ( ) ( ) R = k E S d = 1 1 ( ) ( ) ( ) ( ) G = k E S d = 255 k, k, k Ec B = k E S d = Ec 255
 acquired with different cameras are different, in general Gamut: set of colors that is manageable by the device Acquisition devices: set")
74 RGB tristimulus values The R,G,B coordinates does not have an absolute meaning, as their values depend on The spectral sensitivity of the sensors that are used in the capture device The reference white Thus, R,G,B values of the same physical stimulus (image) acquired with different cameras are different, in general Gamut: set of colors that is manageable by the device Acquisition devices: set of colors that are represented by the device gamut mapping
75 RGB model Similar considerations apply to rendering devices: the rendering of a color with given tristimulus coordinares (R,G,B) will depend on The spectral responses of the emitters phosphors for a CRT color filters in a LCD The calibration of the device As for the acquisition devices, the color corresponding to the rendered white must be set To define the entire gamut for a monitor, you only need mark the points on the diagram that represent the colors the monitor actually produces. You can measure these colors with either a colorimeter or a photospectrometer along with software that ensures the monitor is showing 100 percent red for the red measurement, 100 percent green for the green measurement, and 100 percent blue for the blue measurement. The linearity of the monitor transfer function (gamma)
76 RGB model: rendering ex. The RGB values depend on the phosphores Different for the different reproduction media (CRT, television displays) Example: Red phosphore: x=0.68, y=0.32 Green phosphore: x=0.28, y=0.60 Blue phosphore: x=0.15, y=0.07 Given the x,y coordinates of the phosohores, the reference white point and the illuminant (D65), the RGB coordinates can be calculated Calibration the R=G=B=100 points must match in appearance with the white color as observed by 10 deg observer under the D65 illuminant The brightness of the three phosphores is non linear with the RGB values. A suitable correction factor must be applied (Gamma correction)
77 RGB model P() Acquisition (sensors spectral sensitivities) (R c,g c,b c ) Rendering (spectral responses of light emitters and gamma) (R out,g out,b out ) P() P out () P out ()
78 Gamma function Gamma function γ=1 γ<1 γ>1 top top top bottom bottom bottom low height low height low height Typical CRT monitors: gamma=2.2 The non-linearity of the monitor can be compensated by non-uniform scaling of the RGB coordinates at input (RGB linearization) This led to the definition of the srgb color model
79 srgb
80 CIE-RGB Colorimetric standard observer
81 RGB standard observer Spectral sensitivities for the human eye have been measured in reference conditions by a very large number of observers Performed by the CIE (Commission Intérnationale d Eclairage) standardization committee Such curves are called Color Matching Functions (CMFs) after the type of experiment The so-derived tristimulus values Are not device dependent Are still relative as they depend on (1) the choice of the red, green and blue monochromatic primaries that were used (2) the reference white and (3) the experimental conditions
82 Wavelength encoding Scotopic matching experiment Scotopic luminosity function V () Characterizes vision at low illumination conditions Rod responses One primary light and one test light The intensity of the light beam is the parameter Photopic color matching experiment Color matching finctions (CMF), photopic luminosity function V() Characterizes vision under high illumination conditions Cones responses Three primary lights and one test light The intensities of each primary lights are the parameters
83 Brightness matching Wavelength encoding
84 Basic postulate The photometric principle Whatever the visual stimulus, fixed in all respects, of one patch, and whatever the fixed relative spectral distribution of the stimulus on the second patch, a brightness match can always be achieved by varying the absolute value of the second stimulus Basic laws of brightness matching Symmetry If A matches B then B matches A Transitivity If A matches B and B matches C than A matches C Proportionality If A matches B then ka matches kb Additivity If A matches B and C matches D than (A+C) matches (B+D)
85 Brightness match Definition Similar uniform light patches, producing visual stimuli defined by {P d } and {P d}, respectively, are in brightness match for the standard photopic observer if PV( ) d = P' V( ) d For brightness matches, the photopic luminous flux entering the eye per unit solid angle must be the same for the two patches
86 Matching experiments Scotopic matching experiment (brightness matching) Low illumination conditions Rod responses One primary light and one test light The intensity of the primary light beam is the parameter Measures the scotopic spectral sensitivity function V () Photopic color matching experiment High illumination conditions Brightness matching Rods Color matching Cones Three primary lights and one test light The intensities of each primary lights are the parameters Measures the photopic spectral sensitivity function V() Measures the Color Matching Functions (CMFs)
87 Brightness matching Necessary and sufficient condition for a brightness match between two stimuli of radiant power distribution {P d } and {P d }, respectively Where β () is a fixed function characterizing the brightness-matching process depending on the spectral radiance power distributions (relative or absolute) of the matching stimuli the observational conditions Pβ ( ) d= P' β ( ) d field size, eccentricity of the field of view, state of adaptation as modified by previous or surrounding stimuli Quantum efficiency of the human visual system Ø Ideal photometric observer Ø defined by the CIE by the specification of two fixed functions Scotopic matching β () V ()
88 Scotopic brightness matching Bipartite field The primary light has a fixed relative spectral distribution and only the intensity can vary The test light can have any spectral distribution. It is common to use an equal-energy spectral light Primary light Test light Task: Adjust the primary light intensity so that the primary and test lights appear indistinguishable
89 Scotopic spectral sensitivity function [ ] = n n t t t r r r e r : system vector (transfer function) t : spectral distribution of the test light e : response of the observer Assuming that the system is linear (homogeneity and superposition hold), the system vector can be measured by feeding it with n monochromatic lights. It is common to choose an equal-energy spectral light (reference white) as test light. [ ] r r r r e n = = Each monochromatic light will determine one entry of the system vector, resulting in the Scotopic Spectral Sensitivity function.
90 Scotopic spectral sensitivity function In scotopic conditions, the eye is sensible only to relative intensities of the two lights. The spectral distribution is immaterial (in low illumination conditions, color is not perceivable ). Physiological interpretation: the rhodopsin absorption coefficient depends on the wavelength, but the response is the same for any wavelength. Once a photon is absorbed, the information about its wavelength is lost. Hence, the appearance of the stimulus is independent of its spectrum. The shape of V`() reflects the dependence of the absorption coefficients from the wavelength. In order to measure the spectral sensitivity at each wavelength a set of equal energy spectral (monochromatic lights) are used as test lights Relative intensities are recorded (I REF /I test =I REF since I test =const.=1) and the normalized (values between zero and one) Prior to normalization, due to the linearity of the system, the system vector is unique up to a scale factor. V`() was adopted by CIE in 1951 in a field of 10 degrees (Crawford 1949) and eccentrically with more than 5 degrees (Wald 1945) with complete darkness adaptation.
91 Scotopic spectral sensitivity function V () Data available at
92 Photopic brightness matching Bipartite field Primary light: only the intensity can vary Test light Task: Adjust the primary light intensity so that the primary and test lights appear indistinguishable, following a ad-hoc paradigm
93 Photopic curve V() High illumination levels Different paradigms The direct comparison of the brightness leads to unreliable results due to the difference in color 1 Flickering method (Coblentz and Emerson, 1918) Step-by-step method of heterochromatic fotometry (Hyde et al. 1918) CIE adopted the (Gibson and Tindall, 1923) Relative sensitivity SCOTOPIC PHOTOPIC For daylight vision the maximum efficiency is at 555 nm (yellow) while for night vision it shifts to 505 nm (blue) As a measure of the sensitivity of the eye to incident monochromatic light at each wavelength, it corresponds to a measure of the luminous efficacy of the eyes. 0 VIOLET GREEN RED Wavelength [nm]
94 Color matching Bipartite field Primary lights Test light There are three primary lights with fixed relative spectral distribution and only the intensity can vary. These are chosen to be monochromatic The test light can have any spectral distribution. It is common to chose a equal energy light and decompose it into the monochromatic components for testing the entire set of wavelengths. Task: Adjust the intensities of the primary lights so that the primary and test lights appear indistinguishable


95 Color matching
96 Measuring the CMFs! # # e = # # # "# r 1 1 r 1 2 r 1 3 r 2 1 r 2 2 r 2 3 r 1 n r 2 n r 3 n $! & # & # & # & # & # %& " t 1 t 2 t n $ & & & & & % R : system matrix (transfer function). Each line represents the Color Matching Function (CMF) for the corresponding primary light t : spectral distribution of the test light e : response of the observer! # # e = # # # "# Assuming a equal-energy test light r 1 1 r 1 2 r 1 3 r 2 1 r 2 2 r 2 3 r 1 n r 2 n r 3 n $! & # & # & # & # & # %& " t 1 t 2 t n $! & # & # & = t# & # & # % "# r 1 1 r 1 2 r 1 3 r 2 1 r 2 2 r 2 3 r 1 n r 2 n r 3 n $ &! & # & # & # & # %& " $ & & & & % since we are measuring relative intensities we can choose t=1
97 Color Matching Functions (CMFs) Assuming that the symmetry, transitivity and homogeneity hold (Grassmann s laws of additive color mixtures), the system matrix can be measured by feeding it with n monochromatic lights! # # e = # # # "# r 1 1 r 1 2 r 1 3 r 2 1 r 2 2 r 2 3 r 1 n r 2 n r 3 n $ &! & # & # & # & # %& " $! & # & = # & # & # % " r 1 1 r 1 2 r 1 3 $ & & & & % The response to each monochromatic light will determine one column of the system matrix, so one entry of each CMF. It can be shown that the system matrix is not unique. Using different sets of primaries leads to different CMFs. Though, different sets of CMFs are related by a linear transformation Need to choose one set of primaries
98 Color Matching Functions In other words, the CMFs are the spectral tristimulus values of the equal energy stimulus E (reference white) monochromatic component E =1 Ed ( ) ( ) ( ) E = r R+ g G+ b B R = 700nm G = 546.1nm = 435.8nm B = 360 d = 830 a ( ) ( ) ( ) r, g, b are called color matching functions b
99 CMFs r ( ) b ( ) g ( )
100 D65
101 CMF rgb 1931
102 Stiles and Burch 10deg (1959) Primary lights: monochromatic r10 ( ) R = nm G = nm B = nm r ( ), g ( ), b ( ) CMFs t( ) = R r ( ) + G g ( ) + B b ( ) t : monochromatic test light (R,G,B) : tristimulus values of t b10 ( ) g10 ( ) A 10 degrees bipartite field was used Negative values for the tristimulus value mean that the corresponding primary was added to the test light in order to match the color appearance. This outlines that not every test color can be matched by an additive mixture of the three primaries. The presence of negative values could be impractical, so another color coordinate system was chosen as the reference by the Commisione Internationale d Eclairage (CIE) in 1931.
103 Cone photopigments and CMF How well do the spectral sensitivities of the cone photopigments predict performance on the photopic color matching experiment? L M S = Biological measurements Spectral sensitivity of L photopigments Spectral sensitivity of Mphotopigments Spectral sensitivity of S photopigments t t 1 2 t n Psychophyiscal measurements e e e = CMF of primary 1 CMF of primary 2 CMF of primary 3 t t 1 2 t n There should be a linear transformation that maps the cone absorption curves to the system matrix of the color matching experiment Linking hypothesis
104 Cone photopigments and CMFs Relative primary intensity Wavelength From the agreement between these two datasets one can conclude that the photopigment spectral responsivities provide a satisfactory biological basis to explain the photopic color matching experiments
105 Tristimulus values for complex stimuli Color stimuli are represented by vectors in a three-dimensional space, called the tristimulus space Let Q be an arbitrary monochromatic color stimulus and R,G and B the fixed primary stimuli chosen for the color matching experiment Q = R Q R +GQ G + BQ B R Q,G Q,B Q : tristimulus values of Q The scalar multipliers R Q,G Q,B Q are measured in terms of the assigned respective units of the corresponding primaries It is customary to choose these units such that when additively mixed yield a complete color match with a specified achromatic stimulus, usually one with an equal-energy spectrum on a wavelength basis R The units of these primaries was chosen in the radiant power ratio Q of 72.1:1.4:1.0, which places the chromaticity coordinates of the equal energy stimulus E at the center of the (r,g) chromaticity B diagram G R W =G W =B W =1 for the reference white
106 Complex stimuli A given complex stimuli Q with spectral power density (SPD) {P d} Q can be seen as an additive mixture of a set of monochromatic stimuli Q i with SPD {P d} Qi For each monochromatic stimulus P = R R +G G + B B R,G,B spectral tristimulus values P Pd d
107 Special case: reference white The reference white is used to express the complex spectrum in a different form P = E spectral component E =1 a = 360 d b = 830 Ed The Color Matching Functions are normalized such that the tristimulus values of the reference white are equal. ( ) R + g ( ) G + b ( ) B ( ) R + g ( ) G + b ( ) B E = r E d = ( r ) d = ( r ( ) R ) d + ( +g ( ) G ) d + ( b ( ) B ) d = r d R + g d G + b d B ( ) ( ) Normalization conditions E R = E G = E B = ( ) d =1 r g ( ) d =1 b ( )d =1 Then E =1 R +1 G +1 B ( )
108 Tristimulus values of a complex stimulus Q = ( P d) E = ( P d)r R Q = ( P d)r ( ) = P r ( ) d G Q = ( P d) g ( ) = P g ( ) d B Q = ( P d)b ( ) = P b ( ) d ( ) R + ( P d) g ( ) G + P d ( )b ( ) B Metameric stimuli: different SPD, same color appearance R Q = P 1 r () d = P 2 r () d G Q = P 1 g() d= P 2 g() d B Q = P 1 b() d= P 2 b() d
109 Chromatic coordinates Spectral chromaticity coordinates r ( ) r( ) = r( ) + g( ) + b( ) g( ) g( ) = r( ) + g( ) + b( ) b ( ) b( ) = r( ) + g( ) + b( ) r( ) + g( ) + b( ) = 1
110 (r,g) chromaticity diagram r g b ( ) ( ) ( ) = = = r ( ) ( ) + ( ) + ( ) g ( ) ( ) + ( ) + ( ) b ( ) ( ) + ( ) + ( ) r g b r g b r g b g Y Locus of spectrally pure colors Z X r r,g,b : chromaticity coordinates r, g, b purple line color matching functions (tristimulus values of the reference white)
111 Chromaticity coordinates Chromaticity coordinates R r = R + G + B G g = R + G + B B b = R + G + B g=1 (r=b=0) r + g + b =1 R,G,B: tristimulus value of the generic color g b=1 Maxwell color triangle r=0 g=1 b r Q Q g Q Q b=0 g=0 r=1 b b=1(r=g=0) Q r+g+b=1 r r=1 (g=b=0) (r,g) specify the hue and saturation of the color while the information about the luminance is lost
112 A step in colorimetry
113 CIE 1931 Standard Observer In colorimetric practice, the main objective is to obtain results valid for the group of normal trichromats. To this end, the color matching properties of an ideal trichromatic observer are defined by specifying three independent functions of which are identified with the ideal observer CMFs. The CIE 1931 SO also embodies the additivity law for brightness (V() photopic luminous efficiency function) For an observer who makes brightness matches that conform to the additivity law for brightness, and who also makes color matches that are trichromatic in the stronger sense, it can be shown that V() is a combination of the CMFs, provided all the pairs of metameric stimuli are also in brightness match. For such an observer, it is possible to select from the infinitely many equivalent sets of CMFs one set for which one of the three CMFs, usually taken to be the y central one coincides with V(). In this way, the CIE 1931 SO combines both color matching and heterochromatic brightness matching properties in a single quantitative scheme.
114 CIE 1931 Standard Colorimetric Observer Standard system for color representation: X,Y,Z tristimulus coordinate system x( ), y( ), z( ) Color matching functions Tristimulus values y Wavelength [nm] Features =380 to 780 nm, Δ=5nm Measured at 2 degrees Always non negative is a rough approximation of the brightness of monochromatic y lights of equal size and duration (Standard photopic luminosity function V()) They cannot be measured by color matching experiments Quite inaccurate at low wavelengths Improvements In 1959 a new set of CIE XYZ coordinates was derived based on the CMFs measured by Stiles&Burch at 10 degrees (CIE 1964 Supplementary Standard Colorimetric Observer).
115 Guidelines for the derivation of CIE 1931 SO Projective transformation Need to determine the matrix A of the transformation This is accomplished by imposing some conditions = b g r b b b g g g r r r z y x z y x z y x z y x 1 (r x,g x,b x ) : coordinates of (1,0,0) as measured in the {r,g,b} system... = b g r a a a a a z y x 3,3 2,1 1,3 1,2 1, ,1 1,2 1,3 2,1 3,3... x y z x y z x y z a a a r r r a g g g a b b b =
116 Guidelines for the derivation of CIE 1931 SO 1. The function y() must be equal to the luminosity function of the eye V() 2. The constant spectrum of white, E()=1, should have equal tristimulus values N N N i i i i= 1 i= 1 i= 1 i 11 i 12 i 13 i i= 1 i= 1 i= 1 i= 1 but i i i i= 1 i= 1 i= 1 thus i= 1... x( ) = y( ) = z( ) N N N N x( ) = a r( ) + a g( ) + a b( ) N N N N r( ) = g( ) = b( ) = S x( ) = ( a + a + a ) S i y( ) = V( ) this sets a relation among 3 coefficients a + a + a = const ( a + a + a ) = = ( a + a + a ) = = ( a + a + a ) = σ [Ref: Color vision and colorimetry, D. Malacara]
117 Guidelines for the derivation of CIE 1931 SO 3. The line joining X and Y be tangent to the curve on the red side In this way, a linear combination of X and Y is sufficient to describe those colors without any Z This introduces other conditions on a 31, a 32, a 33 and sets their values ( ) x 4. No values of is negative This adds a condition relating a11, a12 and a13, whose sum must be equal to known constant σ. This leaves one degree of freedom that is used to set the area of the XYZ triangle at its minimum g Y Z X r
118 From rgb to xyz r x g = y b z z y x

119 rgb2xyz Chromaticity coordinates 0.49r+ 0.31g+ 0.2b x = r g b r g b y = r g b 0.0r+ 0.01g+ 0.99b z = r g b (x,y) chromaticity diagram Tristimulus values x z X = V Y = V Z = V y y CMF x y z ( ) ( ) ( ) x( ) = V( ) y( ) = V( ) z( ) = V( ) y( ) x E = y = E 1 3
 = 0.341080r ( ) = 0.139058r ( ) = 0.0r 10 10 10 ( ) + 0.189145g ( ) + 0.837460g ( ) + 0.")
120 CIE 1964 SO 10 degrees field Features Extended set of wavelengths (390 to 830 nm) r,g,b CMFs obtained directly from the observations Measures of the radiant power of each monochromatic test stimulus High illumination intensity To minimize rods intrusion Data extrapolated at 1nm resolution x y z ( ) = r ( ) = r ( ) = 0.0r ( ) g ( ) g ( ) g ( ) b ( ) b ( ) b 10 ( ) ( ) ( )
 ( ) ( ) ( y chromaticity")
 ( ) ( ) ( ) ( = + + + + = + + = + + = z y x z y x z z z y x y y z y")
121 CIE Chromaticity Coordinates (X,Y,Z) tristimulus values Chromaticity coordinates = = = d z P Z d y P Y d x P X ) ( ) ( ) ( y chromaticity diagram x - 1 ) ( ) ( ) ( ) ( ) ( ) ( ) ( ) ( ) ( ) ( ) ( ) ( ) ( ) ( ) ( ) ( ) ( ) ( = = + + = + + = z y x z y x z z z y x y y z y x x x
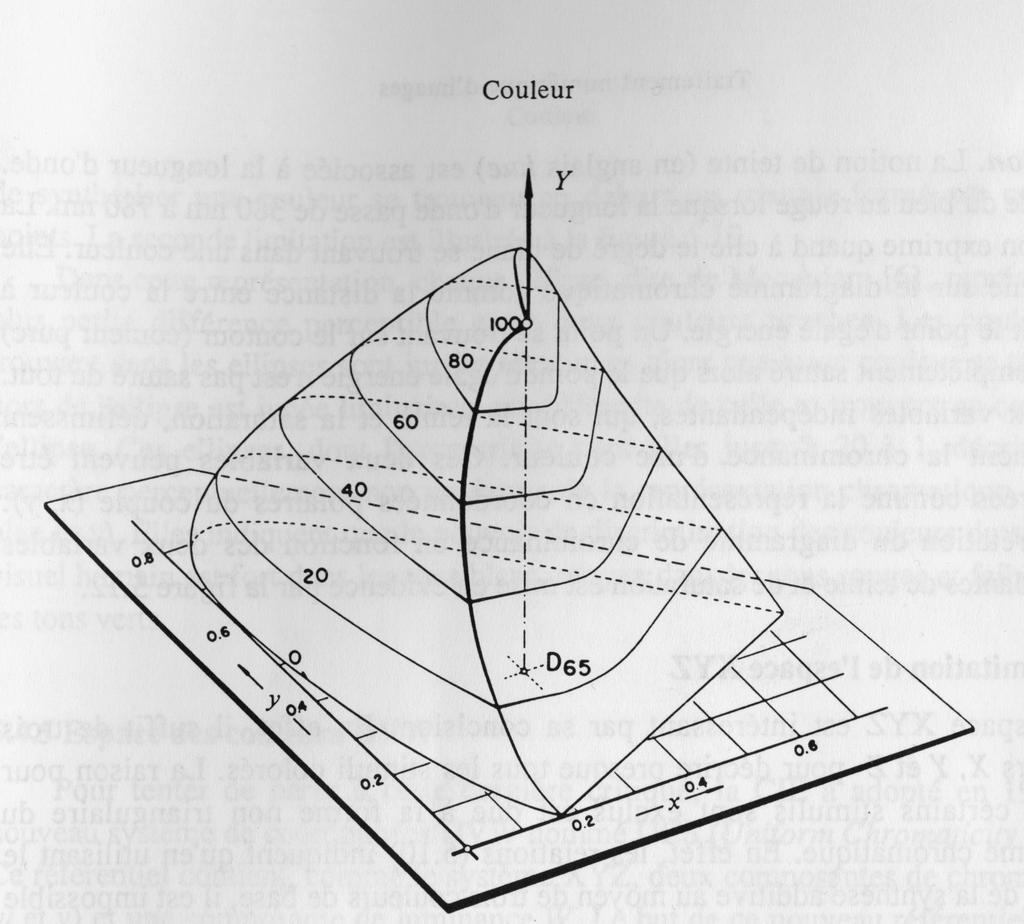
122 xyy
123 Mac Adams ellipses The ellipses represent a constant perceptual color stimulus, at a constant luminance, at various positions and in various directions, in the x,y diagram. The areas of the ellipses vary greatly. This means that the XYZ colorspace (as the RGB color space) is not perceptually uniform. To avoid this nonuniformity, CIE recommended a new CIE 1964 UCS (Uniform-Chromaticity Scale) diagram, to be used with constant luminance levels. In perceptually uniform colorspaces, the size of the MacAdams ellipses are more uniform and the eccentricity is lower.

124 Perceptually uniform Colorspaces CIE 1960 Luv colorspace reversible transformation CIE 1976 L*u*v* (CIELUV) u n,v n : reference white = + + = + + = + + = y x x Z Y X Y v y x x Z Y X X u v v u u 1.5 ' ' = = L*: perceived lightness

125 Perceptually uniform Color models Y CIE 1976 L*a*b* (CIELAB), X Z For:, Y X Z n n n otherwise 1/ 3 Y Y > for Y f = Yn Yn Yn Y 16 Y for Yn 116 Yn X n, Y n, Z n : reference white Tristimulus values for a nominally white object-color stimulus. Usually, it corresponds to the spectral radiance power od one of the CIE standard illuminants (as D65 or A), reflected into the observer s eye by a perfect reflecting diffuser. Under these conditions, X n, Y n, Z n are the tristimulus values of the standard illuminant with Y n =100. Hint: the diffuse light depends on both the physical properties of the surface and the illuminant
126 Perceptual correlates Color difference formula ( ) ( ) ( ) Δ E* uv, = Δ L* + Δ u* + Δv* /2 Perceptual correlates L*: lightness 1/2 2 2 * uv, = ( *) + ( *) : C u v C * uv, s * uv, = : saturation L* chroma
127 Opponent color models Underlying model: opponent channels (a) (b) Example of typical center-surround antagonistic receptive fields: (a) on-center yellow-blue receptive fields; (b) on-center red-green receptive fields. Because of the fact that the L, M and S cones have different spectral sensitivities, are in different numbers and have different spatial distributions across the retina, the respective receptive fields have quite different properties. Experimental evidence: color after-image, non existence of colors like greenish-read or yellowish-blue
128 Summary References B. Wandell, Foundations of visions Wyszecki&Stiles, Color science, concepts, methods, quantitative data and formulae, Wiley Classic Library D. Malacara, Color vision and colorimertry, theory and applications, SPIE Press
129 Color images Different approaches An edge is present iif there is a gradient in the luminance An edge exists if there is a gradient in any of the tristimulus components Total gradient above a predefined threshold G( j, k) = G ( j, k) + G ( j, k) + G ( j, k) Vector sum gradient above a predefined threshold { } 1/ G( j, k) = G ( j, k) + G ( j, k) + G ( j, k) G ( j, k) : i-th linear or non-linear tristimulus value i
130

131 Color representation in Lab L a b

132 Opponent Color Model Perception is mediated by opponent color channels Evidences Afterimages Certain colors cannot be perceived simultaneously (i.e. no reddish-green or bluish-yellow) (a) (b) Example of typical center-surround antagonistic receptive fields: (a) on-center yellow-blue receptive fields; (b) on-center red-green receptive fields. Because of the fact that the L, M and S cones have different spectral sensitivities, are in different numbers and have different spatial distributions across the retina, the respective receptive fields have quite different properties.


133 Opponent Colors 3 4

134 R G B
135 L a b
Color vision and colorimetry
 Color vision and colorimetry Photoreceptor types Rods Scotopic vision (low illumination) Do not mediate color perception High density in the periphery to capture many quanta Low spatial resolution Many-to-one
Color vision and colorimetry
 Color vision and colorimetry Photoreceptor types Rods Scotopic vision (low illumination) Do not mediate color perception High density in the periphery to capture many quanta Low spatial resolution Many-to-one
Color perception SINA 08/09
 Color perception Color adds another dimension to visual perception Enhances our visual experience Increase contrast between objects of similar lightness Helps recognizing objects However, it is clear that
Vision & Perception. Simple model: simple reflectance/illumination model. image: x(n 1,n 2 )=i(n 1,n 2 )r(n 1,n 2 ) 0 < r(n 1,n 2 ) < 1
=i(n 1,n 2 )r(n 1,n 2 ) 0 < r(n 1,n 2 ) < 1") Simple model: simple reflectance/illumination model Eye illumination source i(n 1,n 2 ) image: x(n 1,n 2 )=i(n 1,n 2 )r(n 1,n 2 ) reflectance term r(n 1,n 2 ) where 0 < i(n 1,n 2 ) < 0 < r(n 1,n 2 )
Simple model: simple reflectance/illumination model Eye illumination source i(n 1,n 2 ) image: x(n 1,n 2 )=i(n 1,n 2 )r(n 1,n 2 ) reflectance term r(n 1,n 2 ) where 0 < i(n 1,n 2 ) < 0 < r(n 1,n 2 )
Color and compositing
 Color and compositing 2D Computer Graphics: Diego Nehab Summer 208. Radiometry Measurement of radiant energy in terms of absolute power Wave vs. particle Wavelength (λ), frequency (ν = c λ ), and amplitude
Introduction to Colorimetry
 IES NY Issues in Color Seminar February 26, 2011 Introduction to Colorimetry Jean Paul Freyssinier Lighting Research Center, Rensselaer Polytechnic Institute Troy, New York, U.S.A. sponsored by www.lrc.rpi.edu/programs/solidstate/assist
Digital Image Processing
 Digital Image Processing 16 November 2006 Dr. ir. Aleksandra Pizurica Prof. Dr. Ir. Wilfried Philips Aleksandra.Pizurica @telin.ugent.be Tel: 09/264.3415 UNIVERSITEIT GENT Telecommunicatie en Informatieverwerking
Visual Imaging and the Electronic Age Color Science
 Visual Imaging and the Electronic Age Color Science Grassman s Experiments & Trichromacy Lecture #5 September 6, 2016 Prof. Donald P. Greenberg Light as Rays Light as Waves Light as Photons What is Color
Visual Imaging and the Electronic Age Color Science
 Visual Imaging and the Electronic Age Color Science Grassman s Experiments & Trichromacy Lecture #5 September 8, 2015 Prof. Donald P. Greenberg What is Color Science? Quantifying the physical energy which
COLOR SCIENCE. Concepts and Methods, Quantitative Data and Formulae, 2nd Edition. John Wiley & Sons New York Chichester Brisbane Toronto Singapore
 COLOR SCIENCE Concepts and Methods, Quantitative Data and Formulae, 2nd Edition GÜNTER WYSZECKI National Research Council, Ottawa, Ontario, Canada W. S. STILES Richmond, Surrey, England t^- n M 1982 A
Visual Imaging and the Electronic Age Color Science Metamers & Chromaticity Diagrams. Lecture #6 September 7, 2017 Prof. Donald P.
 Visual Imaging and the Electronic Age Color Science Metamers & Chromaticity Diagrams Lecture #6 September 7, 2017 Prof. Donald P. Greenberg Matching the Power Spectrum of the Test Lamp with a Full Set
Colour Part One. Energy Density CPSC 553 P Wavelength 700 nm
 Colour Part One Energy Density 400 Wavelength 700 nm CPSC 553 P 1 Human Perception An Active Organising Process Many illusions experiments from psychology Colour not just a matter of measuring wavelength
Colour. The visible spectrum of light corresponds wavelengths roughly from 400 to 700 nm.
 Colour The visible spectrum of light corresponds wavelengths roughly from 4 to 7 nm. The image above is not colour calibrated. But it offers a rough idea of the correspondence between colours and wavelengths.
Multimedia Information Systems
 Multimedia Information Systems Samson Cheung EE 639, Fall 2004 Lecture 3 & 4: Color, Video, and Fundamentals of Data Compression 1 Color Science Light is an electromagnetic wave. Its color is characterized
Theory of colour measurement Contemporary wool dyeing and finishing
 Theory of colour measurement Contemporary wool dyeing and finishing Dr Rex Brady Deakin University Colour measurement theory Topics 1. How we see colour 2. Generation of colours 3. Measurement of colour
Color Basics. Lecture 2. Electromagnetic Radiation - Spectrum. Spectral Power Distribution
 ectur Color Basics Wavelength Encoding Trichromatic Color Theory Color Matching Experiments -2-8 -4 4 8 Wavelength in meters (m) Newton s Experiment Visible light 4nm 5nm 6nm 7nm Wavelength 665, Cambridge
Visual Imaging and the Electronic Age Color Science
 Visual Imaging and the Electronic Age Color Science Color Gamuts & Color Spaces for User Interaction Lecture #7 September 16, 2014 Donald P. Greenberg Color Triangle for XYZ Y g 2 1 Z r -2-1 b 1 X XYZ
Radiometry, photometry, measuring color
 Radiometry, photometry, measuring color Lecture notes are done by Géza Várady, based on the lecture notes of Prof. János Schanda varady.geza@mik.pte.hu University of Pécs, Faculty of Engineering and Information
CS Color. Aditi Majumder, CS 112 Slide 1
 CS 112 - Color Aditi Majumder, CS 112 Slide 1 Visible Light Spectrum Aditi Majumder, CS 112 Slide 2 Color is due to.. Selective emission/reflection of different wavelengths by surfaces in the world Different
Color Science Light & Spectra
 COLOR Visible Light Color Science Light & Spectra Light is an electromagnetic wave It s color is characterized by it s wavelength Most light sources produce contributions over many wavelengths, contributions
The Electromagnetic Spectrum
 The Electromagnetic Spectrum Color Definition Color is a visual sensation related to the wavelength distribution of the light energy hitting the retina of the eye. When that wavelength distribution is
Multi-variant data scaling and additivity analysis in potentially nonlinear systems using balanced equivalence tracking
 1 Multi-variant data scaling and additivity analysis in potentially nonlinear systems using balanced equivalence tracking David Oulton November 2014 Introduction It is common experience that when investigating
Mesopic Photometry for SSL. Teresa Goodman Metrology for SSL Meeting 24 th April 2013
 Mesopic Photometry for SSL Teresa Goodman Metrology for SSL Meeting 24 th April 2013 Outline Brief overview of CIE system for mesopic photometry Relevance of mesopic photometry for SSL Is mesopic photometry
The CIE 1997 Interim Colour Appearance Model (Simple Version), CIECAM97s. CIE TC1-34 April, 1998
, CIECAM97s. CIE TC1-34 April, 1998") The CIE 1997 Interim Colour Appearance Model (Simple Version), CIECAM97s CIE TC1-34 April, 1998 i The following members of TC1-34, Testing Colour Appearance Models, took part in the preparation of this
The CIE 1997 Interim Colour Appearance Model (Simple Version), CIECAM97s CIE TC1-34 April, 1998 i The following members of TC1-34, Testing Colour Appearance Models, took part in the preparation of this
CS681 Computational Colorimetry
 CS681 Computational Colorimetry Min H. Kim KAIST School of Computing Energy on a Lambertian surface An ideal surface that provides uniform diffusion of the incident radiation such that its luminance is
The Visual Perception of Images
 C. A. Bouman: Digital Image Processing - January 8, 2018 1 The Visual Perception of Images In order to understand images you must understand how humans perceive visual stimulus. Objectives: Understand
Basic Optical Concepts. Oliver Dross, LPI Europe
 Basic Optical Concepts Oliver Dross, LPI Europe 1 Refraction- Snell's Law Snell s Law: Sin( φi ) Sin( φ ) f = n n f i n i Media Boundary φ i n f φ φ f angle of exitance 90 80 70 60 50 40 30 20 10 0 internal
Fresnel Equations cont.
 Lecture 11 Chapter 4 Fresnel quations cont. Total internal reflection and evanescent waves Optical properties of metals Familiar aspects of the interaction of light and matter Fresnel quations: phases
Screen-space processing Further Graphics
 Screen-space processing Rafał Mantiuk Computer Laboratory, University of Cambridge Cornell Box and tone-mapping Rendering Photograph 2 Real-world scenes are more challenging } The match could not be achieved
Gernot Hoffmann CIE Color Space
 Gernot Hoffmann CIE Color Space Contents 1. CIE Chromaticity Diagram 2 2. Color Matching and Primaries 3 3. Color Volumes and Chromaticity 4 4. RGB to XYZ Conversion 5 5. CIE Primaries 6 6. Visibility
Fundamental Concepts of Radiometry p. 1 Electromagnetic Radiation p. 1 Terminology Conventions p. 3 Wavelength Notations and Solid Angle p.
 Preface p. xiii Fundamental Concepts of Radiometry p. 1 Electromagnetic Radiation p. 1 Terminology Conventions p. 3 Wavelength Notations and Solid Angle p. 4 Fundamental Definitions p. 7 Lambertian Radiators
Midterm Summary Fall 08. Yao Wang Polytechnic University, Brooklyn, NY 11201
 Midterm Summary Fall 8 Yao Wang Polytechnic University, Brooklyn, NY 2 Components in Digital Image Processing Output are images Input Image Color Color image image processing Image Image restoration Image
Fundamentals of light
 Fundamentals of light CHAPTER 1 Introduction Environmental issues Limited resources. Consumption. Sustainability Environmental damage will result in environmental changes (climate change, global warming,
Fundamentals of light
 Fundamentals of light CHAPTER 1 Introduction Environmental issues Limited resources. Consumption. Sustainability Environmental damage will result in environmental changes (climate change, global warming,
2. Lighting Terms. Contents
 Contents 2. Lighting Terms 2.1 Vision 2.2 Spectral sensitivity of the eye 2.3 Radiometric quantities 2.4 Photometric quantities 2.5 Energy and light efficiency 2.6 Colour coordinates 2.7 Colour temperature
Color and Color Model Chap. 12
 Coor and Coor Mode Chap. 12 Coor Visibiity n Interpretation of coor is a psychophysioogy probem We coud not fuy understand the mechanism Physica characteristics of coor can be represented by a forma expression
NEW MEASURES OF WHITENESS THAT CORRELATE WITH PERCEIVED COLOR APPEARANCE
 NEW MEASURES OF WHITENESS THAT CORRELATE WITH PERCEIVED COLOR APPEARANCE Burak Aksoy*, Paul D. Fleming, Margaret K. Joyce and Abhay Sharma Department of Paper Engineering, Chemical Engineering and Imaging
THE MEASUREMENT OF COLOR IN A QUALITY CONTROL SYSTEM: TEXTILE COLOR MATCHING
 th IMEKO TC7 International Symposium June 3 July 2, 24, Saint-Petersburg, Russia THE MEASUREMENT OF COLOR IN A QUALITY CONTROL SYSTEM: TEXTILE COLOR MATCHING Andrea Zanobini, Gaetano Iuculano Department
From CIE 2006 Physiological Model to Improved Age- Dependent and Average Colorimetric Observers
 Dependent and Average Colorimetric Observers Abhijit Sarkar, 1, 2, * Florent Autrusseau, 2 Françoise Viénot, 3 Patrick Le Callet, 2 Laurent Blondé 1 1 Technicolor Research & Innovation, 1 av Belle Fontaine
Opponent Color Spaces
 C. A. Bouman: Digital Image Processing - January 8, 2018 1 Opponent Color Spaces Perception of color is usually not best represented in RGB. A better model of HVS is the so-call opponent color model Opponent
BASIC VISUAL SCIENCE CORE
 BASIC VISUAL SCIENCE CORE Absolute and Increment Thresholds Ronald S. Harwerth Fall, 2016 1. Psychophysics of Vision 2. Light and Dark Adaptation Michael Kalloniatis and Charles Luu 1 The Neuron Doctrine
STUDY OVER LUMINOUS CHARACTERISTICS OF THE TRACER COMPOSITIONS
 STUDY OVER LUMINOUS CHARACTERISTICS OF THE TRACER COMPOSITIONS BOGDAN GABRIEL LUCIAN, ENG. S. C. UZINA MECANICA SADU S. A. e-mail: lucianbog@yahoo.com ABSTRACT: The study of the evolution of the luminous
EXPLOSION PROOF ATEX LUMINAIRE
 info@nextgenerationled.be www.nextgenerationled.be Tel + 32 53 71 09 42 EXPLOSION PROOF ATEX LUMINAIRE Properties n Lifespan L80 %: > 50.000 hours n Atex directive 94/9 EC n Zone 2 and 22 n IP klasse :
Perceptually Uniform Color Spaces
 C. A. Bouman: Digital Image Processing - January 8, 2018 1 Perceptually Uniform Color Spaces Problem: Small changes in XYZ may result in small or large perceptual changes. Solution: Formulate a perceptually
Uncertainty determination of correlated color temperature for high intensity discharge lamps.
 Uncertainty determination of correlated color temperature for high intensity discharge lamps A.B. El-Bialy 1, M.M. El-Ganainy 2 and E.M. El-Moghazy 3 1 University College for Woman for Art, science and
Standard Practice for Calculating Yellowness and Whiteness Indices from Instrumentally Measured Color Coordinates 1
 Designation: E 313 05 Standard Practice for Calculating Yellowness and Whiteness Indices from Instrumentally Measured Color Coordinates 1 This standard is issued under the fixed designation E 313; the
Lighting fundamentals
 Lighting fundamentals About light and photometrics Generation of light Human vision Black body Colour Basic principles of lighting Light sources Light Vision Colour What is light? Light is electromagnetic
Color Perception: Controlled Excitation of Opponent Channels
 Color Perception: Controlled Excitation of Opponent Channels Prashanth Alluvada Electrical and Computer Engineering Jimma University Ethiopia Email: prashanthalluvada@gmail.com Abstract We describe controlled
OPAC 101 Introduction to Optics
 OPAC 101 Introduction to Optics Topic 3 Introductory Photometry Department of http://www1.gantep.edu.tr/~bingul/opac101 Optical & Acustical Engineering Gaziantep University Sep 017 Sayfa 1 Introduction
Colorimetry - Part 4: CIE 1976 L*a*b* COLOUR SPACE
 Draft Standard NC voting begins on: 2007-05-20 Deadline for NC votes: 2007-08-20 Colorimetry - Part 4: CIE 1976 L*a*b* COLOUR SPACE Colorimétrie - Partie 4: Espace chromatique L*a*b* CIE 1976 Farbmessung
Uncertainty determination of correlated color temperature for high intensity discharge lamps
 Uncertainty determination of correlated color temperature for high intensity discharge lamps A.B. El-Bialy 1, M.M. El-Ganainy 2 and E.M. El-Moghazy 3 1 University College for Woman for Art, science and
Color difference Delta E - A survey
 See discussions, stats, and author profiles for this publication at: https://www.researchgate.net/publication/236023905 Color difference Delta E - A survey Article in Machine Graphics and Vision April
Old painting digital color restoration
 Old painting digital color restoration Michail Pappas Ioannis Pitas Dept. of Informatics, Aristotle University of Thessaloniki GR-54643 Thessaloniki, Greece Abstract Many old paintings suffer from the
OPTO 5320 VISION SCIENCE I
 OPTO 5320 VISION SCIENCE I Monocular Sensory Processes of Vision: Color Vision Mechanisms of Color Processing VI. Retinal fundamentals A. Retinal fundamentals and cone photopigments B. Properties of cone
Brightness induction: Unequal spatial integration with increments and decrements
 Visual Neuroscience (2004), 21, 353 357. Printed in the USA. Copyright 2004 Cambridge University Press 0952-5238004 $16.00 DOI: 10.10170S0952523804213037 Brightness induction: Unequal spatial integration
The Truth about Neutrality
 The Truth about Neutrality How Close is Close Enough By Ron Engvaldsen Schneider Optics Inc. March 23, 2017 For many years, the manufacture of neutral density filters (ND s) has been a challenge for all
SYDE 575: Introduction to Image Processing. Image Compression Part 2: Variable-rate compression
 SYDE 575: Introduction to Image Processing Image Compression Part 2: Variable-rate compression Variable-rate Compression: Transform-based compression As mentioned earlier, we wish to transform image data
Light is an electromagnetic wave (EM)
") What is light? Light is a form of energy. Light travels in a straight line Light speed is 3.0 x 10 8 m/s Light is carried by photons Light can travel through a vacuum Light is a transverse wave Light is
What is light? Light is a form of energy. Light travels in a straight line Light speed is 3.0 x 10 8 m/s Light is carried by photons Light can travel through a vacuum Light is a transverse wave Light is
CLINICAL VISUAL OPTICS (OPTO 223) Weeks XII & XIII Dr Salwa Alsaleh
 Weeks XII & XIII Dr Salwa Alsaleh") CLINICAL VISUAL OPTICS (OPTO 223) Weeks XII & XIII Dr Salwa Alsaleh OUTLINE OF WEEKS XII & XIII Temporal resolution Temporal Summation. Broca-Sulzer effect. Critical flicker frequency (CFF). Temporal Contrast
CLINICAL VISUAL OPTICS (OPTO 223) Weeks XII & XIII Dr Salwa Alsaleh OUTLINE OF WEEKS XII & XIII Temporal resolution Temporal Summation. Broca-Sulzer effect. Critical flicker frequency (CFF). Temporal Contrast
Section 22. Radiative Transfer
 OPTI-01/0 Geometrical and Instrumental Optics Copyright 018 John E. Greivenkamp -1 Section Radiative Transfer Radiometry Radiometry characterizes the propagation of radiant energy through an optical system.
Fundametals of Rendering - Radiometry / Photometry
 Fundametals of Rendering - Radiometry / Photometry Physically Based Rendering by Pharr & Humphreys Chapter 5: Color and Radiometry Chapter 6: Camera Models - we won t cover this in class Realistic Rendering
ISOFOOTCANDLE LINES OF HORIZONTAL ILLUMINATION
 2.2.5 ISOFOOTCANDLE LINES OF HORIZONTAL ILLUMINATION Values based on 10 foot mounting height. REPORT NUMBER: RAB00701 ISSUE DATE: 02/04/15 PAGE: 1 OF 8 CATALOG NUMBER: VXLED26NDG / VXBRLED26NDG LUMINAIRE:
Note on Posted Slides
 Note on Posted Slides These are the slides that I intended to show in class on Tue. Apr. 1, 2014. Since it is April 1 st, there is an April Fools Day joke in here one of the slides is complete nonsense
The Electromagnetic Spectrum
 Physics 25 Chapter 24 Dr. Alward Electromagnetic Waves Electromagnetic (EM) waves consist of traveling electric and magnetic disturbances. One source of electromagnetic waves are electric charges oscillating
Section 10. Radiative Transfer
 Section 10 Radiative Transfer 10-1 OPTI-50 Optical Design and Instrumentation I Copyright 017 John E. Greivenkamp Radiometry Radiometry characterizes the propagation of radiant energy through an optical
Color Image Correction
 FLDE. p. 1/48 Color Image Correction Benasque, September 2007 Vicent Caselles Departament de Tecnologia Universitat Pompeu Fabra joint work with M.Bertalmío, R. Palma, E. Provenzi FLDE. p. 2/48 Overview
Hue discrimination in peripheral vision under conditions of dark and light adaptation*
 Perception & Psychophysics 1974, Vol. 15, No.3, 586-590 Hue discrimination in peripheral vision under conditions of dark and light adaptation* BRUCE A. AMBLERt University of Oregon, Eugene, Oregon 97403
CITS 4402 Computer Vision
 CITS 4402 Computer Vision A/Prof Ajmal Mian Adj/A/Prof Mehdi Ravanbakhsh Lecture 06 Object Recognition Objectives To understand the concept of image based object recognition To learn how to match images
Detectability measures the difference between the means of the noisy ``signal'' distribution and the ``noise-only'' distribution.
 VISUAL PERCEPTION Here is the Visual Perception Video Outline. Visual Perception is another subject where a conceptual understanding of the big picture is critical. When there are equations, pay particular
Technical Report. Camera Encoding Evaluation for Image Archiving of Cultural Heritage Roy S. Berns
 Technical Report Camera Encoding Evaluation for Image Archiving of Cultural Heritage Roy S. Berns May 2014 Executive Summary A computational analysis was performed to evaluate color errors caused by color-
Application of Neugebauer-Based Models to Ceramic Printing
 Application of Neugebauer-Based Models to Ceramic Printing L Iovine, S Westland* and TLV Cheung* Colour and Imaging Institute, University of Derby, Derby, United Kingdom *Centre for Colour Design Technology,
Perception of brightness. Perception of Brightness. Physical measures 1. Light Ray. Physical measures 2. Light Source
 Perception of Brightness The physics and psychophysics Perception of brightness psychophysics: relate psychological measures to physical ones perception of brightness is one of the simplest aspects of
Department of Electrical Engineering, Polytechnic University, Brooklyn Fall 05 EL DIGITAL IMAGE PROCESSING (I) Final Exam 1/5/06, 1PM-4PM
 Final Exam 1/5/06, 1PM-4PM") Department of Electrical Engineering, Polytechnic University, Brooklyn Fall 05 EL512 --- DIGITAL IMAGE PROCESSING (I) Y. Wang Final Exam 1/5/06, 1PM-4PM Your Name: ID Number: Closed book. One sheet of
Department of Electrical Engineering, Polytechnic University, Brooklyn Fall 05 EL512 --- DIGITAL IMAGE PROCESSING (I) Y. Wang Final Exam 1/5/06, 1PM-4PM Your Name: ID Number: Closed book. One sheet of
Light. E.M. waves electromagnetic both electric and magnetic characteristics travels at 3.0 x 10 8 m/s in a vacuum slower in material mediums
 Light E.M. waves electromagnetic both electric and magnetic characteristics travels at 3.0 x 10 8 m/s in a vacuum slower in material mediums 1) requires no medium but can travel through them 2) is energy
Spectral characterization of a Philips LED lamp
 Departamento de Astrofísica y Ciencias de la Atmósfera Grupo de Astrofísica Extragaláctica e Instrumentación Astronómica Spectral characterization of a Philips LED lamp Authors: Carlos Tapia Ayuga & Jaime
Study of the reliability of power LEDs for color mixing applications
 Università degli studi di padova FACOLTÀ DI INGEGNERIA Corso di Laurea in Elettronica TESI DI LAUREA Study of the reliability of power LEDs for color mixing applications Relatore: Ch.mo Prof. Enrico Zanoni
EXTENDING THE CIE 2006 MODEL
 MARK D. FAIRCHILD & YUTA ASANO CUSTOM COLOR MATCHING FUNCTIONS: EXTENDING THE CIE 2006 MODEL TWO BIG QUESTIONS WHAT DO YOU SEE? DO YOU SEE WHAT I SEE? CIE COLORIMETRY 1931 & 1964, 2- & 10-deg. 2 1.5 Tristimulus
Nature of Light. What is light? Sources of light. an electromagnetic radiation capable of stimulating the retina of the eye.
 Nature of Light What is light? an electromagnetic radiation capable of stimulating the retina of the eye. electrons Nucleus Electron gains energy When it moves to a higher level Photon bundle (quantum)
Light. Mike Maloney Physics, SHS
 Light Mike Maloney Physics, SHS 1 Light What is LIGHT? WHERE DOES IT COME FROM? 2003 Mike Maloney 2 What is Light? Light is a wave, or rather acts like a wave. How do we know since we cannot see it? We
A Comprehensive Framework for Modeling and Correcting Color Variations in Multi Projector Displays
 A Comprehensive Framework for Modeling and Correcting Color Variations in Multi Projector Displays Aditi Majumder Slide 1 Historical Perspective A dream computer in 1980 (Bill Joy and others) Megabytes
L ight color influence on obstacle recognition in road lighting. 1. Introduction
 Computer Applications in Electrical Engineering L ight color influence on obstacle recognition in road lighting Małgorzata Górczewska, Sandra Mroczkowska, Przemysław Skrzypczak Poznań University of Technology
Machine Learning for Signal Processing Lecture 1: Signal Representations
 Machine Learning for Signal Processing Lecture 1: Signal Representations Class 1. 29 August 2013 Instructor: Bhiksha Raj 29 Aug 2013 11-755/18-797 1 What is a signal A mechanism for conveying information
The Electromagnetic Spectrum
 The Electromagnetic Spectrum A Brief History of Light 1000 AD It was proposed that light consisted of tiny particles Newton Used this particle model to explain reflection and refraction Huygens 1678 Explained
An Experimental Approach to a Definition of the Mesopic Adaptation Field
 May 29 June 1, 2012 NRC Ottawa, Ontario CORM 2012 Annual Conference and Business Meeting An Experimental Approach to a Definition of the Mesopic Adaptation Field Tatsukiyo Uchida*, Yoshi Ohno** *Panasonic
Fundamentals of Rendering - Radiometry / Photometry
 Fundamentals of Rendering - Radiometry / Photometry Image Synthesis Torsten Möller Today The physics of light Radiometric quantities Photometry vs/ Radiometry 2 Reading Chapter 5 of Physically Based Rendering
wavelength (nm)
") CS 465 Homework 0 out: Monday 20 November 2006 due: Friday December 2006 Note: You are encouraged to use mathematical tools like MATLAB, Excel, graphing caluclators, or small programs in Java to come up
CS 465 Homework 0 out: Monday 20 November 2006 due: Friday December 2006 Note: You are encouraged to use mathematical tools like MATLAB, Excel, graphing caluclators, or small programs in Java to come up
Fundamentals of Rendering - Radiometry / Photometry
 Fundamentals of Rendering - Radiometry / Photometry CMPT 461/761 Image Synthesis Torsten Möller Today The physics of light Radiometric quantities Photometry vs/ Radiometry 2 Reading Chapter 5 of Physically
LED Measurement Instrumentation
 R.Young LED Measurement Instrumentation Optronic Laboratories, Inc. ABSTRACT The production and use of LEDs is increasing rapidly. They are being used in applications previously occupied by traditional
Image Data Compression
 Image Data Compression Image data compression is important for - image archiving e.g. satellite data - image transmission e.g. web data - multimedia applications e.g. desk-top editing Image data compression
ISOFOOTCANDLE LINES OF HORIZONTAL ILLUMINATION
 2.02.05 ISOFOOTCANDLE LINES OF HORIZONTAL ILLUMINATION Values based on 12 foot mounting height..01.005.002 REPORT NUMBER: RAB02670 ISSUE DATE: 11/08/16 PAGE: 1 OF 9 DATE SAMPLE TESTED: 11/08/16 CATALOG
Infrared Temperature Calibration 101 Using the right tool means better work and more productivity
 Infrared Temperature Calibration 101 Using the right tool means better work and more productivity Application Note Infrared thermometers let you measure a target s surface temperature from a distance without
ISOFOOTCANDLE LINES OF HORIZONTAL ILLUMINATION
 2.005.01.02 ISOFOOTCANDLE LINES OF HORIZONTAL ILLUMINATION Values based on 16 foot mounting height..002 REPORT NUMBER: RAB01042 ISSUE DATE: 07/15/15 PAGE: 1 OF 8 DATE SAMPLE TESTED: 07/15/15 CATALOG NUMBER:
Computer Graphics III Radiometry. Jaroslav Křivánek, MFF UK
 Computer Graphics III Radiometry Jaroslav Křivánek, MFF UK Jaroslav.Krivanek@mff.cuni.cz Direction, solid angle, spherical integrals Direction in 3D Direction = unit vector in 3D Cartesian coordinates
Local Criterion of Quality for Color Difference Formula
 Local Criterion of Quality for Color Difference Formula Sergey Bezryadin, KWE Int. Inc, San Francisco, USA; Pavel Bourov, UniqueIC s, Saratov, Russia. Abstract It is important to be equipped with criterion
ULTRA COMPACT SMD 10 SMD 20 SMD 30 SMD
 info@nextgenerationled.be www.nextgenerationled.be Tel + 32 53 71 09 42 ULTRA COMPACT SMD Properties n Lifespan L70 %: 30.000-50.000 hours n Energy savings up to 80% n Color temperature: 3000 K - 4000
Vectorial Color James A. Worthey 11 Rye Court, Gaithersburg, Maryland , USA. Copyright 2008 by James A. Worthey
 Friday, 2009 March 6, 22:55:38 JAW, Wednesday, 2004 November 17, 11:42:48 Vectorial Color James A. Worthey 11 Rye Court, Gaithersburg, Maryland 20878-1901, USA. Copyright 2008 by James A. Worthey Abstract
March 26, Title: TEMPO 21 Report. Prepared for: Sviazinvest, OJSC. Prepared by: Cree Durham Technology Center (DTC) Ticket Number: T
 Ticket Number: T") March 26, 2012 Title: TEMPO 21 Report Prepared for: Sviazinvest, OJSC Prepared by: Cree Durham Technology Center (DTC) Ticket Number: 10806-T Co NVLAP lab code 500070-0 The accreditation of the Cree Durham
March 26, 2012 Title: TEMPO 21 Report Prepared for: Sviazinvest, OJSC Prepared by: Cree Durham Technology Center (DTC) Ticket Number: 10806-T Co NVLAP lab code 500070-0 The accreditation of the Cree Durham
Facts of light. Sanjay Joshi. PDF version by Baldasso, L. F.
 Facts of light Sanjay Joshi PDF version by Baldasso, L. F. Introduction: Part I: What is Light? The choice of lighting is one the most important decisions to make when setting up a reef tank. The light
Optical Testing for Super Flux, SnapLED and Luxeon Emitters
 application brief AB08 Optical Testing for Super Flux, SnapLED and Luxeon Emitters Lumileds 100% tests the Super Flux, SnapLED, SnapLED70, SnapLED150, and Luxeon emitters for luminous flux, dominant wavelength
Optical Measurement Guidelines for High-Power LEDs and Solid State Lighting Products
 White Paper Optical Measurement Guidelines for High-Power LEDs and Solid State Lighting Products 1. Introduction The LED industry is growing rapidly and this naturally brings up an important need for reliable